Embed Size (px)
Citation preview
Fault Tree Construction in Reliability Engineering Course No: E04-020
Credit: 4 PDH
Chelliah Sundararajan, PhD, MASCE, FASME
Continuing Education and Development, Inc. 9 Greyridge Farm Court Stony Point, NY 10980 P: (877) 322-5800 F: (877) 322-4774 [email protected]
1
Fault Tree Construction in Reliability Engineering
By:
Chelliah Sundararajan, Ph.D., MASCE, FASME
All rights reserved, including the right to reproduce these notes, or portions thereof, in any form. Copyright © 2012 by Chelliah Sundararajan. The author does not make any warranty, express or implied, or assume any legal liability for the accuracy or completeness of any information presented in the course.
2
Table of Content
1. Introduction
2. An Example Fault Tree
3. System Description
4. Symbols
5. Gates 5.1 OR Gate 5.2 AND Gate 5.3 Tabular OR Gate 5.4 Tabular AND Gate 5.5 "m-out-of-n" Gate 5.6 Exclusive OR Gate 5.7 Priority AND Gate 5.8 Inhibit Gate 5.9 AND- NOT Gate
6. Events 6.1 Top Event 6.2 Intermediate Event 6.3 Terminal Event
6.3.1 Undeveloped event 6.3.2 Basic event 6.3.3 House event 6.3.4 Identification of terminal events
7. Transfer Symbols
8. Common Cause Failures
9. Complementary Trees
10. Limitations
11. Documentation
12. How Fault Trees are used?
13. Example Problem Appendix 1: Faults and Failures References
3
1. INTRODUCTION Fault tree analysis is one of the most widely used methods for system reliability analysis. It is a formal deductive procedure to determine the various combinations of component-level failures that could result in the occurrence of specified "undesired events" at the system-level. Not only hardware (component) failures but also human errors and software errors are considered "component-level failures", within the context of fault tree construction and analysis. The undesired event could be an accident, unscheduled/forced shutdown or other system-level failures. Fault trees may also be used to compute the probability of the undesired event as a function of the probabilities of component failures. We may construct a number of fault trees for the same system if we are interested in studying a number of undesired events relating to that system. Each undesired event would have a different fault tree. We use the term "failure" here to refer to both "failures" and "faults". Definition of fault and failure are provided and discussed in Appendix 1. Fault trees may be constructed at any stage of system design. If a fault tree is constructed at an early stage of system design, it may be updated as more precise information become available or changes are made in the design. Fault trees may also be constructed for operating systems to identify the root causes of system-level failures encountered during operation. A fault tree analysis may follow a preliminary hazard analysis (Sundararajan 2008) or a failure modes and effects analysis (Sundararajan 2008) although neither a preliminary hazard analysis nor a failure modes and effects analysis is a prerequisite. A full fault tree analysis consists of: 1. Fault tree construction; 2. Qualitative fault tree analysis; and 3. Quantitative fault tree analysis (a quantitative analysis may be performed without first performing a qualitative analysis). Depending on the scope of the reliability project, either steps 1 and 2, or steps 1 and 3, or steps 1, 2 and 3 may be performed. We discuss fault tree construction in this course. Qualitative analysis and quantitative analysis will be discussed in future courses. We start the course by developing a fault tree for a simple electrical system in Section 2. This example illustrates how a system level failure can be resolved to component level failures via a fault tree. Concept of gates and events are also introduced through this example. System description is
4
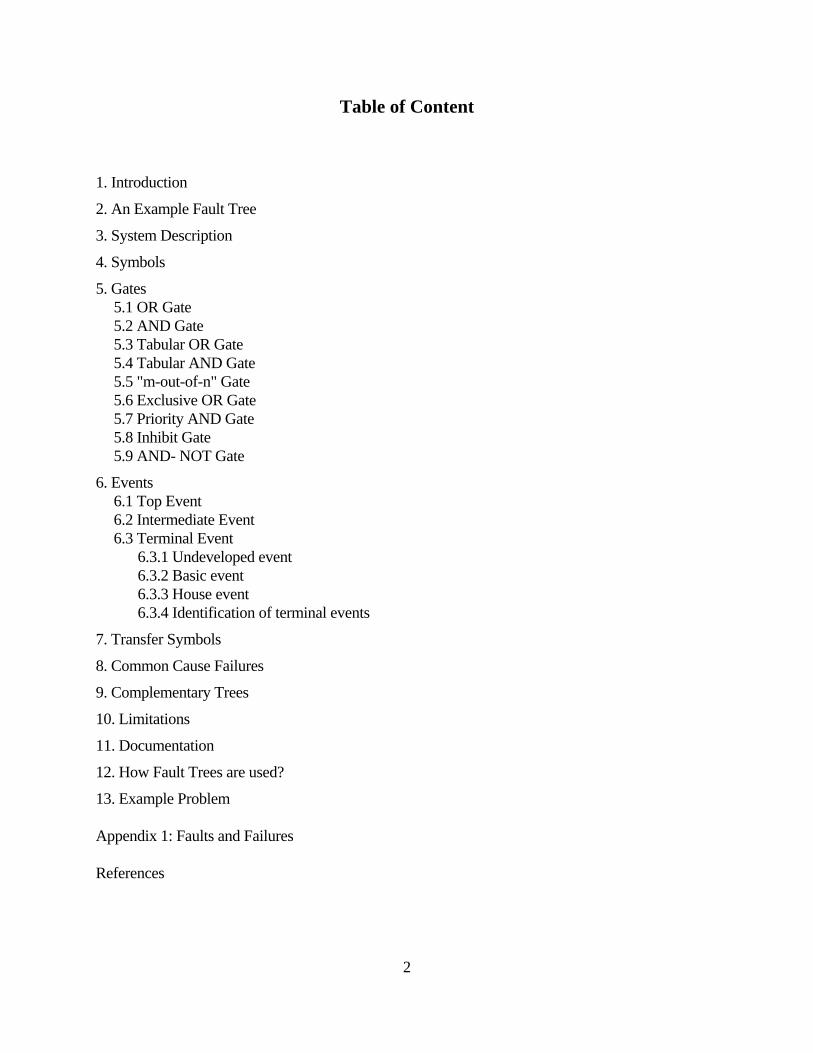
discussed next in Section 4. A system description helps in the construction of fault trees, especially, for large complex systems. Section 4 presents the symbols used to represent the various gates and events in fault trees. Detailed descriptions and discussion of the various gates are provided in section 5; illustrative examples are given when necessary. Different types of events used in fault trees and different types of component failures are discussed at some length in Section 6. An eight-character (eight-digit) naming system for uniquely identifying every terminal event in a tree is also presented and illustrated in that section. Transfer symbols used in the display of large fault trees are discussed in section 7. Common cause failures and their representation in fault trees is the subject of Section 8. Section 9 describes the construction of complementary trees (also known as success trees). Limitations of fault trees and documentation of fault tree construction are discussed in Section 10 and 11, respectively. Section 12 discusses how fault trees are used in quantitative and/or quantitative fault tree analyses. Course ends with the construction of fault tree for an example domestic hot water system (DHWS). Before we go into fault tree construction, a word of caution is in order. If two reliability analysts develop fault trees for the same undesired event of a system, the two fault trees may not necessarily be identical; they may seem different at the outset, particularly if the system is complex. This is because the way in which system logic is modeled by the two analysts may differ. However, the two fault trees must provide the same results when a qualitative and/or quantitative analysis is carried out. 2. AN EXAMPLE FAULT TREE Fault tree is a graphic representation of the relationship between component-level failures and a system-level undesired event. It depicts how component-level failures propagate through the system to cause a system-level failure or some system-level undesired event. The component-level failures are called the terminal events, primary events or end events of the fault tree; we will mostly use the term "terminal event" is this course module. The system-level undesired event is called the top event of the fault tree. The concept of fault trees is best explained through a simple illustration. We have purposively chosen a very simple example; fault trees encountered in practice could be tens or hundreds of time larger than this simple illustration. A system diagram for the operation of an electric motor is shown in Figure 1. We are interested in developing a fault tree for the undesired event "motor overheats". The fault tree is shown in Figure 2. Let us discuss how we draw that fault tree.
5
Figure 1: System diagram for the operation of an electric motor.
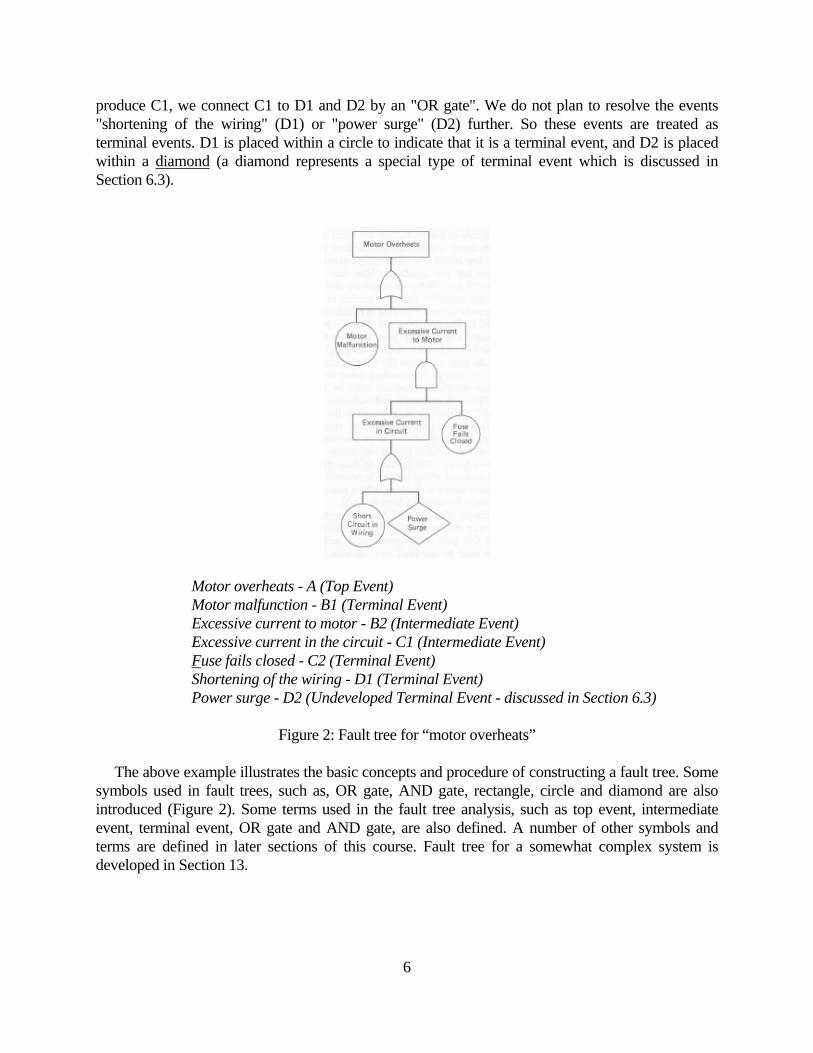
First, we place the undesired event at the top of the tree within a rectangle (General convention is to use a rectangle to represent Top Event). The undesired event, in this case, is "motor overheats". For the sake of simplicity in further discussions, let us denote it by the symbol A. Next, we ask the question: "how can the motor overheat?" (or, "what is necessary and sufficient for the motor to overheat?"). Motor overheating can happen (i) due to an internal malfunction of the motor itself, or (ii) due to excessive current supplied to the motor. So we place the events "motor malfunction" and "excessive current to motor" below the top event (undesired event). Let us denote these events by B1 and B2, respectively. Since A is possible either by “motor overheating” (B1) or by “excessive current” (B2), we connect A to B1 and B2 by an "OR gate". At this point, we may either explore the reasons for "motor malfunction" (B1) by examining the failures of the various parts of the motor or treat "motor malfunction" as a terminal event (component-level failure). In this example, we choose to do the latter. So we place the event "motor malfunction" within a circle to indicate that it is a terminal event. (Convention is to use a circle to represent Terminal Event.) Criteria for deciding whether to treat an event as a terminal event or not is discussed later in Section 6.3. We decide to resolve further the event "excessive current to motor" (B2). So this event is called an intermediate event, and is placed within a rectangle. (Top events and intermediate events are placed within rectangles). We now ask the question: "how can there be excessive current to the motor?" (or, "what is necessary and sufficient to cause excessive current to the motor?") Excessive current to the motor (B2) can happen only if (i) there is "excessive current in the circuit" (C1) and (ii) the "fuse fails closed" (C2). Since both C1 and C2 have to happen, we connect B2 to C1 and C2 by an "AND gate". We do not plan to explore the event "fuse fails closed" (C2) further, and so it is a terminal event and placed within a circle. We do plan to resolve the event "excessive current in the circuit" (C1) further, and so it is an intermediate event to be placed within a rectangle. We ask the question: "how can there be excessive current in the circuit?" (or, "what is necessary and sufficient to cause excessive current in the circuit?"). Either (i) "shortening of the wiring" (D1) or (ii) a "power surge" (D2) could produce excessive current in the circuit. Since either D1 or D2 can
6
produce C1, we connect C1 to D1 and D2 by an "OR gate". We do not plan to resolve the events "shortening of the wiring" (D1) or "power surge" (D2) further. So these events are treated as terminal events. D1 is placed within a circle to indicate that it is a terminal event, and D2 is placed within a diamond (a diamond represents a special type of terminal event which is discussed in Section 6.3).
Motor overheats - A (Top Event) Motor malfunction - B1 (Terminal Event) Excessive current to motor - B2 (Intermediate Event) Excessive current in the circuit - C1 (Intermediate Event) Fuse fails closed - C2 (Terminal Event) Shortening of the wiring - D1 (Terminal Event) Power surge - D2 (Undeveloped Terminal Event - discussed in Section 6.3)
Figure 2: Fault tree for “motor overheats”
The above example illustrates the basic concepts and procedure of constructing a fault tree. Some symbols used in fault trees, such as, OR gate, AND gate, rectangle, circle and diamond are also introduced (Figure 2). Some terms used in the fault tree analysis, such as top event, intermediate event, terminal event, OR gate and AND gate, are also defined. A number of other symbols and terms are defined in later sections of this course. Fault tree for a somewhat complex system is developed in Section 13.
7
3. SYSTEM DESCRIPTION Within the context of fault tree analysis, one may consider a complete plant as a system or some distinct parts of a plant as a system (for example, steam generation system, emergency cooling system, distillation system, feed water system, emergency power supply system, etc.), or even an equipment may be treated as a system. The first step in any reliability analysis, including fault tree analysis, is to understand the system well. A clear understanding of the system, as it pertains to the fault tree, is necessary. Detailed information about each and every component in the system, the functional and physical interconnections between components, the normal and abnormal environments experienced by each component, and failure modes of each component are gathered from drawings, schematic diagrams, block diagrams, logic diagrams, piping and instrumentation diagrams, process flow sheets, installation diagrams, parts lists, operating procedures, maintenance-test procedures, discussions with plant personnel, etc. In addition, interfaces of the system with other systems (for example, power supply system, cooling water supply system, etc.) should be identified. The reliability analyst may prepare a system description, which includes the following information: 1. List of components (Note that some components may be part of more than one system since system boundaries may overlap); 2. Physical interconnections and proximity of components; and 3. Physical interfaces with other systems. The system may function in more than one mode; for example, normal operating mode, emergency operating mode, start-up mode, shut-down mode, pre-operational test mode, etc. Only a few of the functional modes may pertain to a particular fault tree. A functional description may be prepared for each functional mode of interest. Functional descriptions shall include the following information: 1. Function of each component; 2. Initial conditions of each component (valve is closed or open, tank is empty or full, motor is operating or idle, etc.); 3. Functional interfaces between components; 4. Normal operating and environmental conditions of each component (temperature, pressure, humidity, mechanical stress, vibrations, etc.);
8
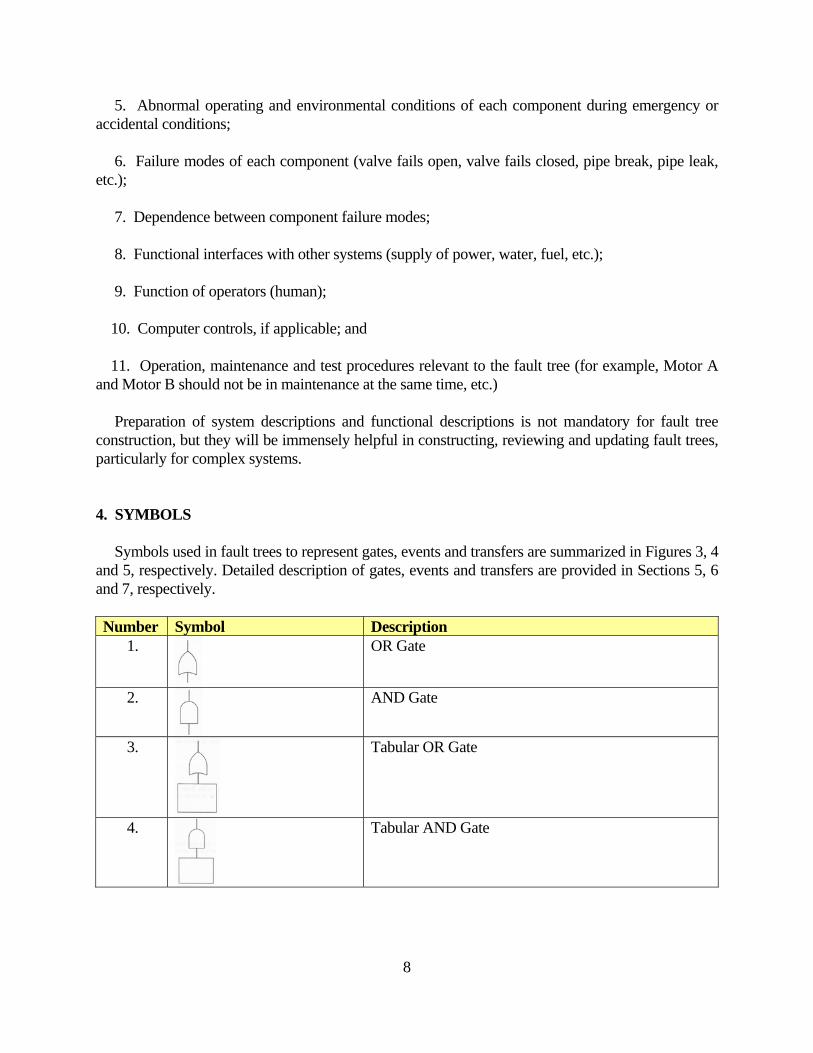
5. Abnormal operating and environmental conditions of each component during emergency or accidental conditions; 6. Failure modes of each component (valve fails open, valve fails closed, pipe break, pipe leak, etc.); 7. Dependence between component failure modes; 8. Functional interfaces with other systems (supply of power, water, fuel, etc.); 9. Function of operators (human); 10. Computer controls, if applicable; and 11. Operation, maintenance and test procedures relevant to the fault tree (for example, Motor A and Motor B should not be in maintenance at the same time, etc.) Preparation of system descriptions and functional descriptions is not mandatory for fault tree construction, but they will be immensely helpful in constructing, reviewing and updating fault trees, particularly for complex systems. 4. SYMBOLS Symbols used in fault trees to represent gates, events and transfers are summarized in Figures 3, 4 and 5, respectively. Detailed description of gates, events and transfers are provided in Sections 5, 6 and 7, respectively. Number Symbol Description
1.
OR Gate
2.
AND Gate
3.
Tabular OR Gate
4.
Tabular AND Gate
9
5.
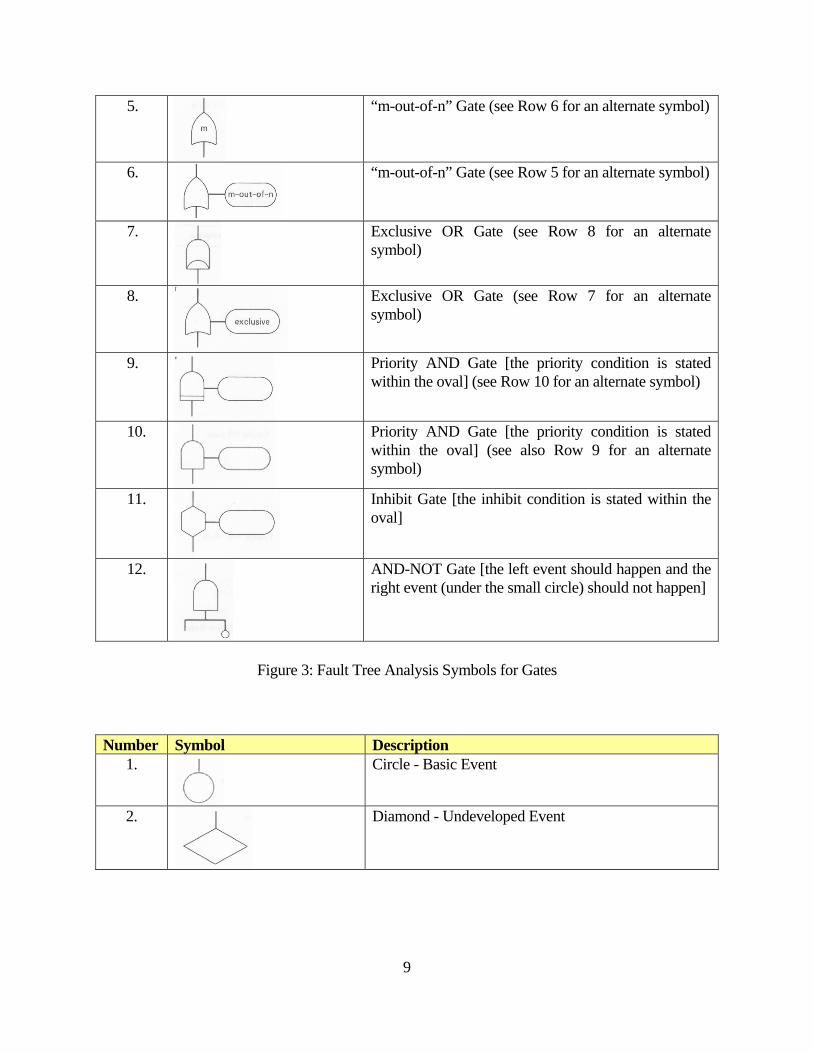
“m-out-of-n” Gate (see Row 6 for an alternate symbol)
6.
“m-out-of-n” Gate (see Row 5 for an alternate symbol)
7.
Exclusive OR Gate (see Row 8 for an alternate symbol)
8.
Exclusive OR Gate (see Row 7 for an alternate symbol)
9.
Priority AND Gate [the priority condition is stated within the oval] (see Row 10 for an alternate symbol)
10.
Priority AND Gate [the priority condition is stated within the oval] (see also Row 9 for an alternate symbol)
11.
Inhibit Gate [the inhibit condition is stated within the oval]
12.
AND-NOT Gate [the left event should happen and the right event (under the small circle) should not happen]
Figure 3: Fault Tree Analysis Symbols for Gates
Number Symbol Description 1.
Circle - Basic Event
2.
Diamond - Undeveloped Event
10
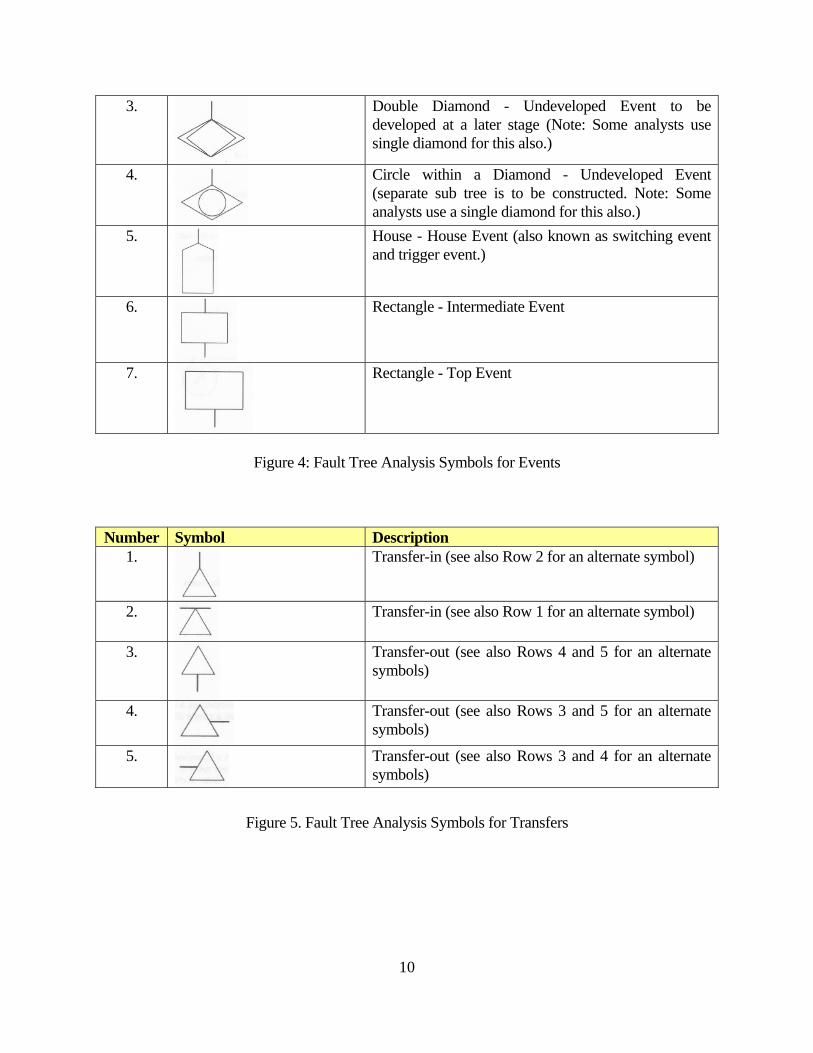
3.
Double Diamond - Undeveloped Event to be developed at a later stage (Note: Some analysts use single diamond for this also.)
4.
Circle within a Diamond - Undeveloped Event (separate sub tree is to be constructed. Note: Some analysts use a single diamond for this also.)
5.
House - House Event (also known as switching event and trigger event.)
6.
Rectangle - Intermediate Event
7.
Rectangle - Top Event
Figure 4: Fault Tree Analysis Symbols for Events
Number Symbol Description
1.
Transfer-in (see also Row 2 for an alternate symbol)
2.
Transfer-in (see also Row 1 for an alternate symbol)
3.
Transfer-out (see also Rows 4 and 5 for an alternate symbols)
4.
Transfer-out (see also Rows 3 and 5 for an alternate symbols)
5.
Transfer-out (see also Rows 3 and 4 for an alternate symbols)
Figure 5. Fault Tree Analysis Symbols for Transfers
11
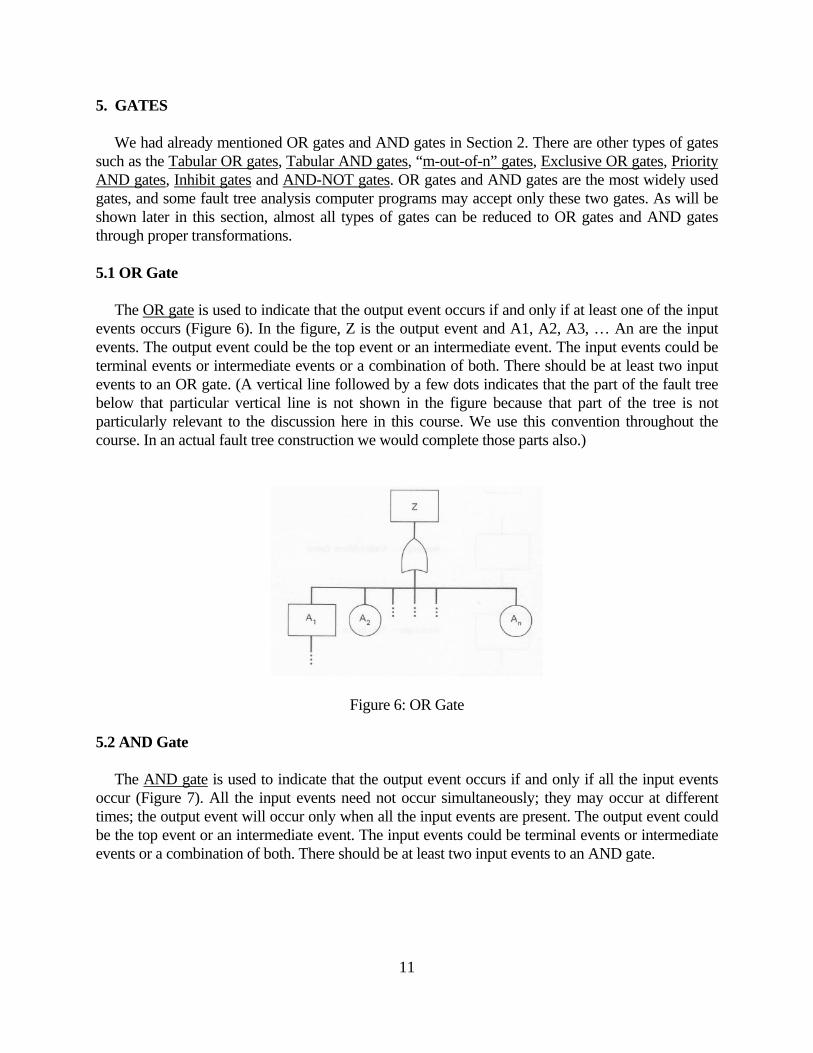
5. GATES We had already mentioned OR gates and AND gates in Section 2. There are other types of gates such as the Tabular OR gates, Tabular AND gates, “m-out-of-n” gates, Exclusive OR gates, Priority AND gates, Inhibit gates and AND-NOT gates. OR gates and AND gates are the most widely used gates, and some fault tree analysis computer programs may accept only these two gates. As will be shown later in this section, almost all types of gates can be reduced to OR gates and AND gates through proper transformations. 5.1 OR Gate The OR gate is used to indicate that the output event occurs if and only if at least one of the input events occurs (Figure 6). In the figure, Z is the output event and A1, A2, A3, … An are the input events. The output event could be the top event or an intermediate event. The input events could be terminal events or intermediate events or a combination of both. There should be at least two input events to an OR gate. (A vertical line followed by a few dots indicates that the part of the fault tree below that particular vertical line is not shown in the figure because that part of the tree is not particularly relevant to the discussion here in this course. We use this convention throughout the course. In an actual fault tree construction we would complete those parts also.)
Figure 6: OR Gate
5.2 AND Gate The AND gate is used to indicate that the output event occurs if and only if all the input events occur (Figure 7). All the input events need not occur simultaneously; they may occur at different times; the output event will occur only when all the input events are present. The output event could be the top event or an intermediate event. The input events could be terminal events or intermediate events or a combination of both. There should be at least two input events to an AND gate.
12
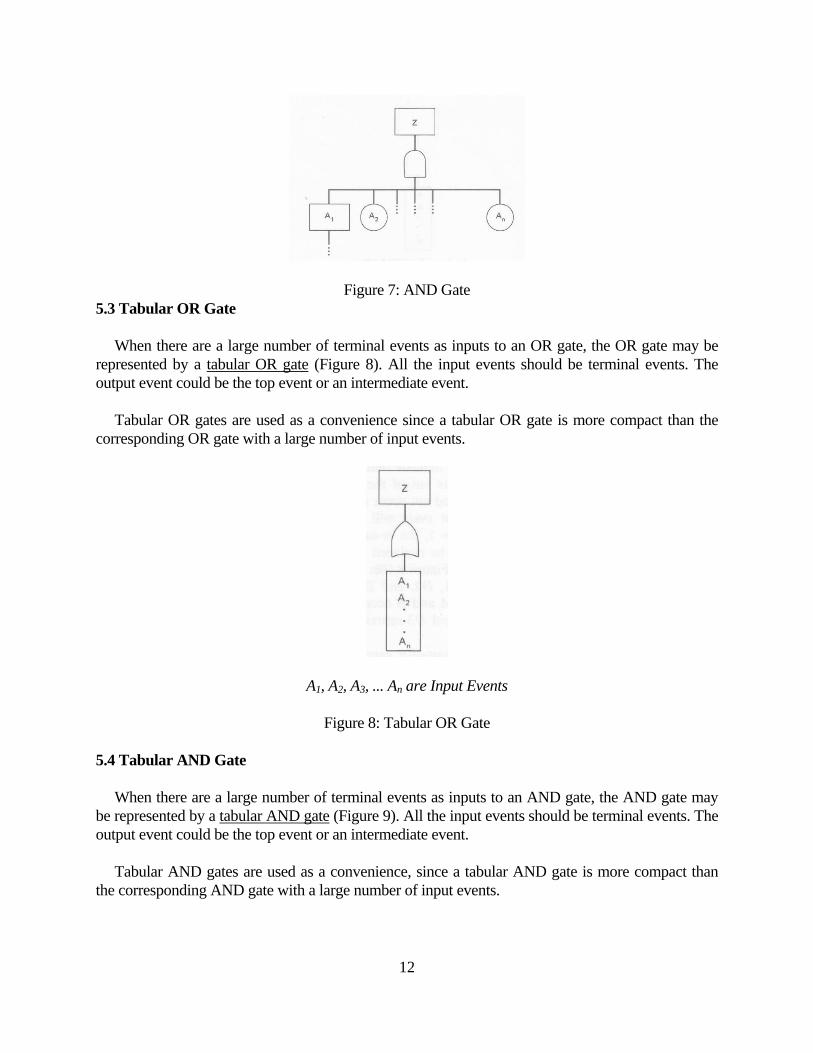
Figure 7: AND Gate 5.3 Tabular OR Gate When there are a large number of terminal events as inputs to an OR gate, the OR gate may be represented by a tabular OR gate (Figure 8). All the input events should be terminal events. The output event could be the top event or an intermediate event. Tabular OR gates are used as a convenience since a tabular OR gate is more compact than the corresponding OR gate with a large number of input events.
A1, A2, A3, ... An are Input Events
Figure 8: Tabular OR Gate 5.4 Tabular AND Gate When there are a large number of terminal events as inputs to an AND gate, the AND gate may be represented by a tabular AND gate (Figure 9). All the input events should be terminal events. The output event could be the top event or an intermediate event. Tabular AND gates are used as a convenience, since a tabular AND gate is more compact than the corresponding AND gate with a large number of input events.
13
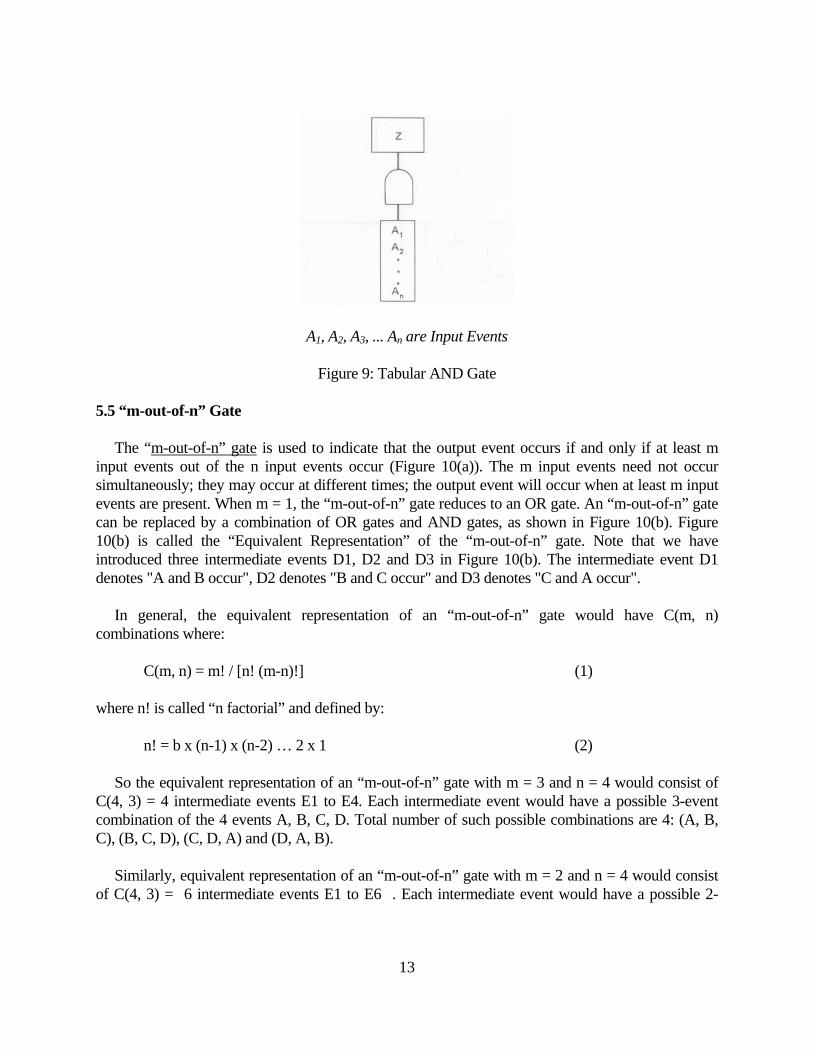
A1, A2, A3, ... An are Input Events
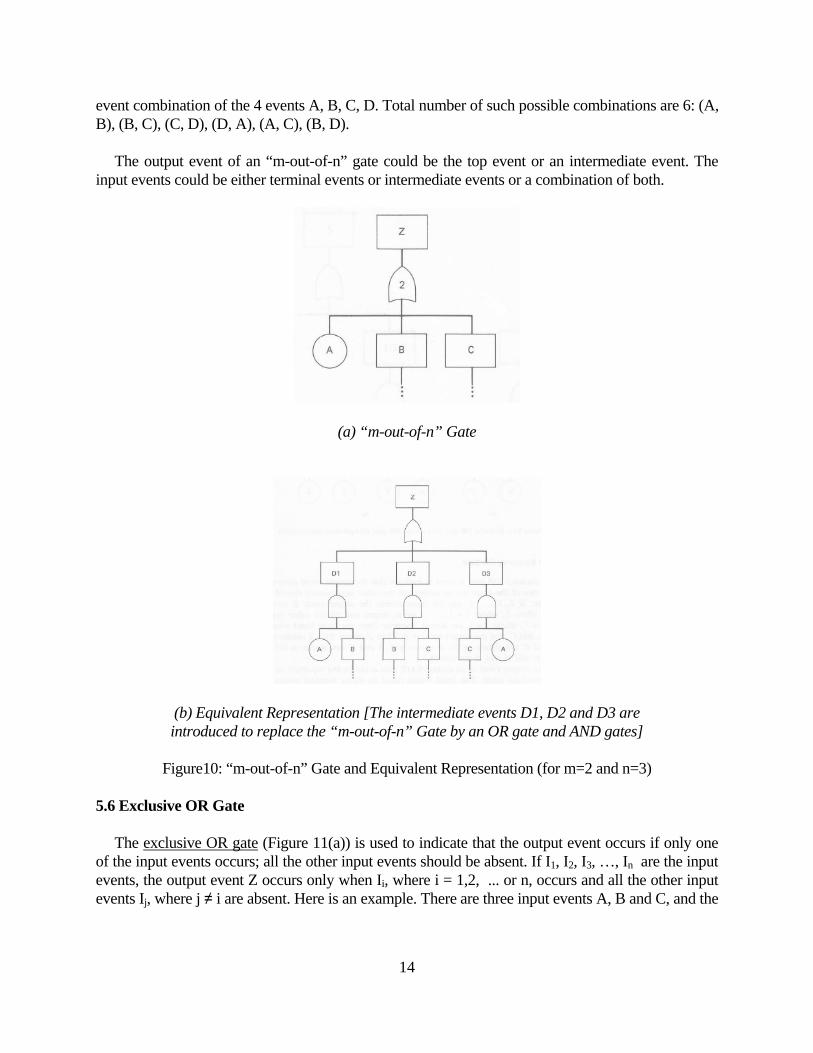
Figure 9: Tabular AND Gate 5.5 “m-out-of-n” Gate The “m-out-of-n” gate is used to indicate that the output event occurs if and only if at least m input events out of the n input events occur (Figure 10(a)). The m input events need not occur simultaneously; they may occur at different times; the output event will occur when at least m input events are present. When m = 1, the “m-out-of-n” gate reduces to an OR gate. An “m-out-of-n” gate can be replaced by a combination of OR gates and AND gates, as shown in Figure 10(b). Figure 10(b) is called the “Equivalent Representation” of the “m-out-of-n” gate. Note that we have introduced three intermediate events D1, D2 and D3 in Figure 10(b). The intermediate event D1 denotes "A and B occur", D2 denotes "B and C occur" and D3 denotes "C and A occur". In general, the equivalent representation of an “m-out-of-n” gate would have C(m, n) combinations where:
C(m, n) = m! / [n! (m-n)!] (1) where n! is called “n factorial” and defined by:
n! = b x (n-1) x (n-2) … 2 x 1 (2) So the equivalent representation of an “m-out-of-n” gate with m = 3 and n = 4 would consist of C(4, 3) = 4 intermediate events E1 to E4. Each intermediate event would have a possible 3-event combination of the 4 events A, B, C, D. Total number of such possible combinations are 4: (A, B, C), (B, C, D), (C, D, A) and (D, A, B). Similarly, equivalent representation of an “m-out-of-n” gate with m = 2 and n = 4 would consist of C(4, 3) = 6 intermediate events E1 to E6 . Each intermediate event would have a possible 2-
14
event combination of the 4 events A, B, C, D. Total number of such possible combinations are 6: (A, B), (B, C), (C, D), (D, A), (A, C), (B, D). The output event of an “m-out-of-n” gate could be the top event or an intermediate event. The input events could be either terminal events or intermediate events or a combination of both.
(a) “m-out-of-n” Gate
(b) Equivalent Representation [The intermediate events D1, D2 and D3 are introduced to replace the “m-out-of-n” Gate by an OR gate and AND gates]
Figure10: “m-out-of-n” Gate and Equivalent Representation (for m=2 and n=3)
5.6 Exclusive OR Gate The exclusive OR gate (Figure 11(a)) is used to indicate that the output event occurs if only one of the input events occurs; all the other input events should be absent. If I1, I2, I3, …, In are the input events, the output event Z occurs only when Ii, where i = 1,2, ... or n, occurs and all the other input events Ij, where j ≠ i are absent. Here is an example. There are three input events A, B and C, and the

15
output event is Z. Then Z occurs if (i) A occurs, and B and C are absent, or (ii) B occurs, and A and C are absent, or (iii) C occurs, and A and B are absent. The output event of an exclusive OR gate could be the top event or an intermediate event. The input events could be either terminal events or intermediate events or a combination of both. An exclusive OR gate can be replaced by a combination of OR gates and AND gates, as shown in Figure 11(b); A and B are the complements of A and B, respectively. A represents the non-occurrence of A and B represents the non-occurrence of B. If A is "failure state of component X", then A is the "success state (normal state) of component X". Use of "success events" is not advisable in quantitative fault tree analysis since success events usually have a high probability of occurrence and quantitative analysis is difficult if there are high-probability terminal events in the fault tree.
(a) Exclusive OR gate (b) Equivalent representation
Figure 11: Exclusive OR gate
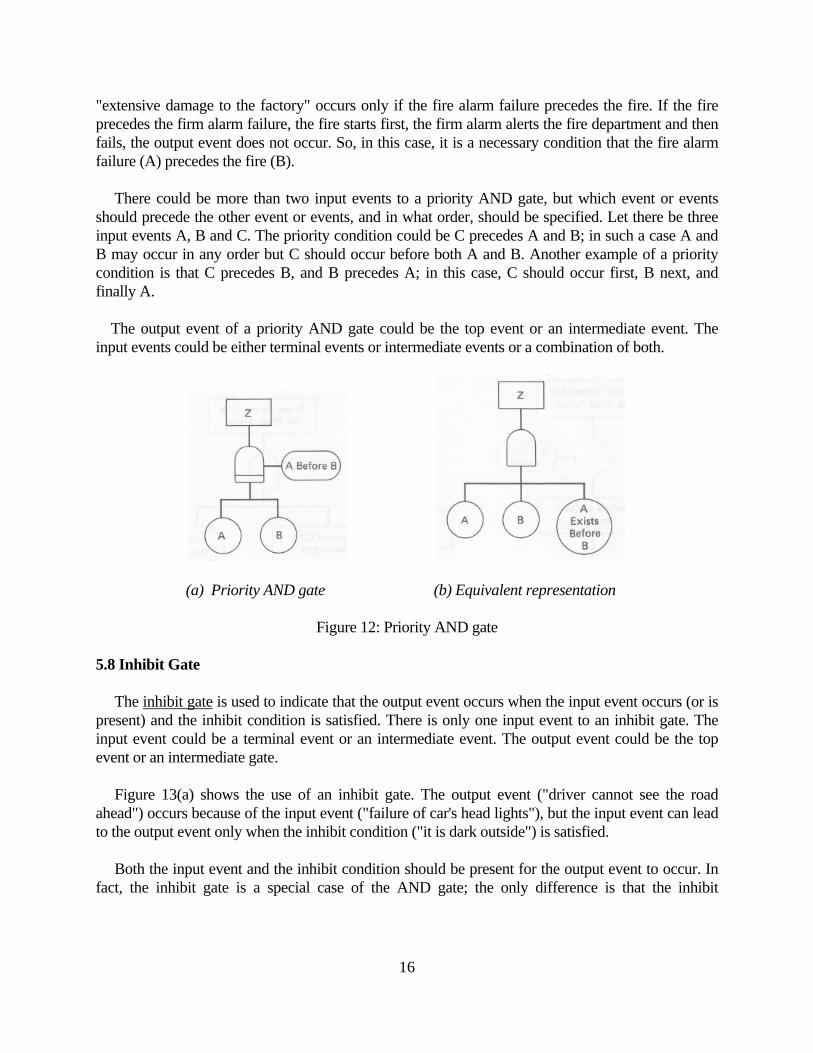
5.7 Priority AND Gate The priority AND gate is used to indicate that the output event occurs when both the input events are present but one of the input events should precede the other, as specified by the priority condition (Figure 12(a)). A priority AND gate can be replaced by a conventional AND gate as shown in Figure 12(b). Consider the situation where a fire starts in a factory and the fire alarm fails to alert the fire department; consequently there occurs extensive damage to the factory. In this case, the output event
16
"extensive damage to the factory" occurs only if the fire alarm failure precedes the fire. If the fire precedes the firm alarm failure, the fire starts first, the firm alarm alerts the fire department and then fails, the output event does not occur. So, in this case, it is a necessary condition that the fire alarm failure (A) precedes the fire (B). There could be more than two input events to a priority AND gate, but which event or events should precede the other event or events, and in what order, should be specified. Let there be three input events A, B and C. The priority condition could be C precedes A and B; in such a case A and B may occur in any order but C should occur before both A and B. Another example of a priority condition is that C precedes B, and B precedes A; in this case, C should occur first, B next, and finally A. The output event of a priority AND gate could be the top event or an intermediate event. The input events could be either terminal events or intermediate events or a combination of both.
(a) Priority AND gate (b) Equivalent representation
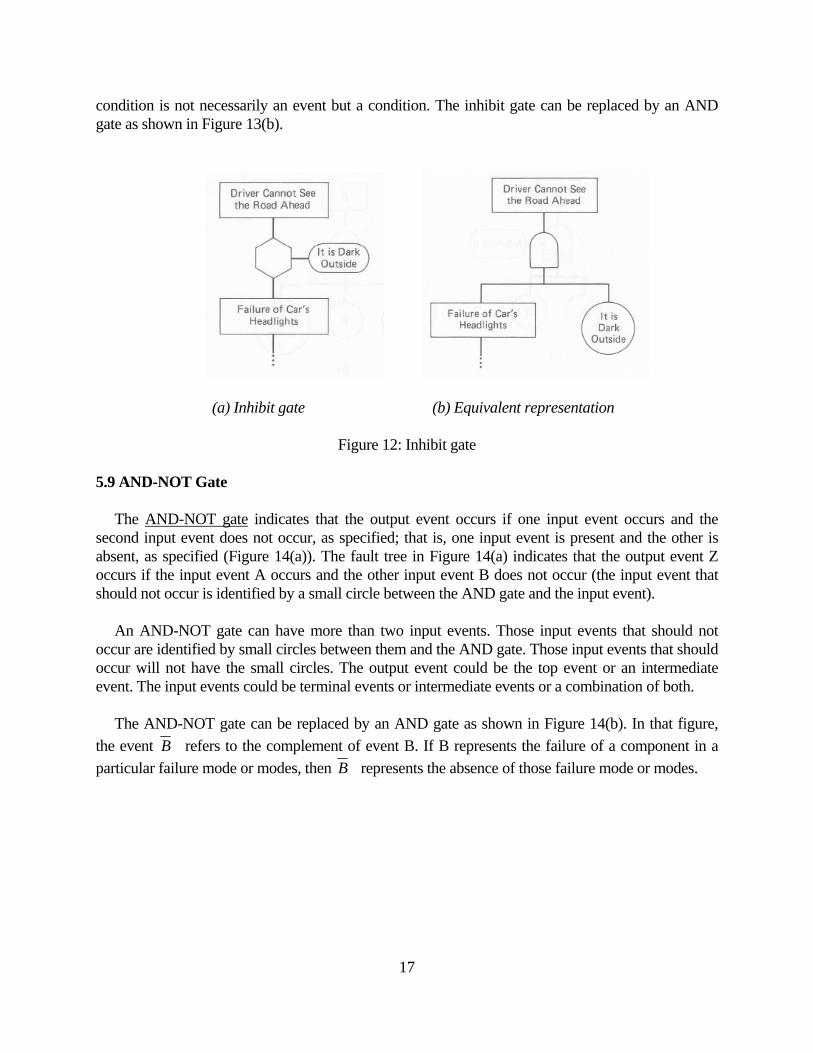
Figure 12: Priority AND gate 5.8 Inhibit Gate The inhibit gate is used to indicate that the output event occurs when the input event occurs (or is present) and the inhibit condition is satisfied. There is only one input event to an inhibit gate. The input event could be a terminal event or an intermediate event. The output event could be the top event or an intermediate gate. Figure 13(a) shows the use of an inhibit gate. The output event ("driver cannot see the road ahead") occurs because of the input event ("failure of car's head lights"), but the input event can lead to the output event only when the inhibit condition ("it is dark outside") is satisfied. Both the input event and the inhibit condition should be present for the output event to occur. In fact, the inhibit gate is a special case of the AND gate; the only difference is that the inhibit
17
condition is not necessarily an event but a condition. The inhibit gate can be replaced by an AND gate as shown in Figure 13(b).
(a) Inhibit gate (b) Equivalent representation
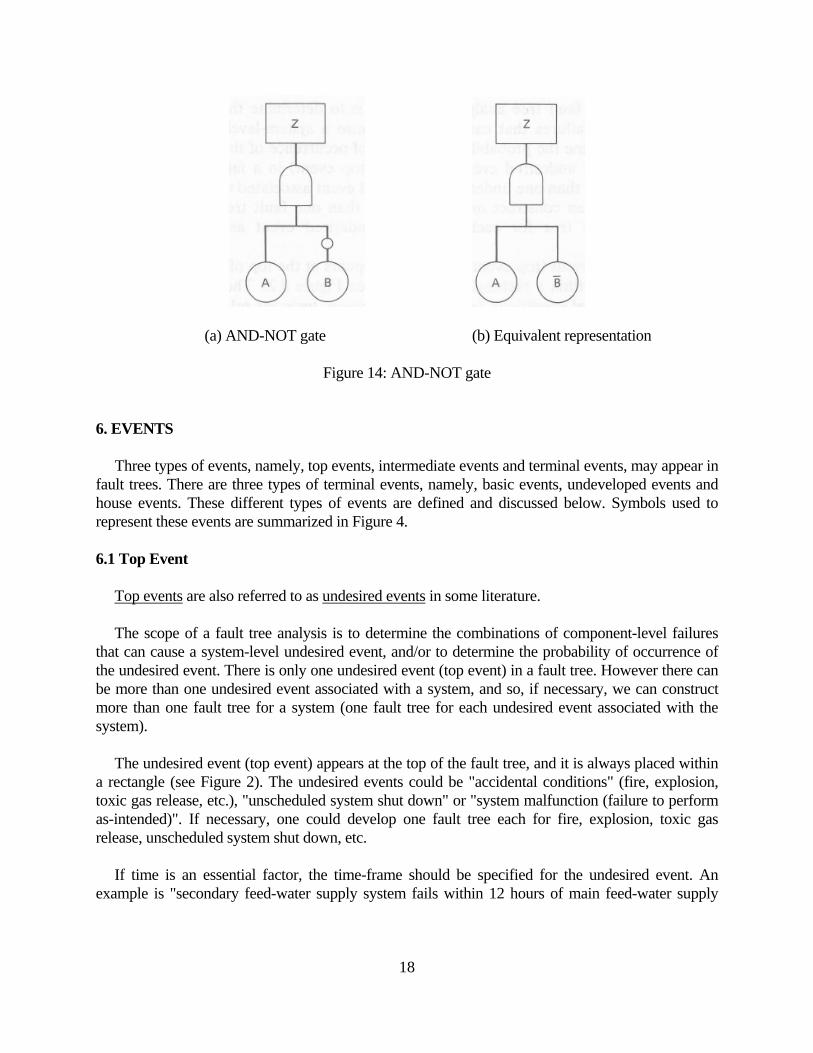
Figure 12: Inhibit gate 5.9 AND-NOT Gate The AND-NOT gate indicates that the output event occurs if one input event occurs and the second input event does not occur, as specified; that is, one input event is present and the other is absent, as specified (Figure 14(a)). The fault tree in Figure 14(a) indicates that the output event Z occurs if the input event A occurs and the other input event B does not occur (the input event that should not occur is identified by a small circle between the AND gate and the input event). An AND-NOT gate can have more than two input events. Those input events that should not occur are identified by small circles between them and the AND gate. Those input events that should occur will not have the small circles. The output event could be the top event or an intermediate event. The input events could be terminal events or intermediate events or a combination of both. The AND-NOT gate can be replaced by an AND gate as shown in Figure 14(b). In that figure, the event B refers to the complement of event B. If B represents the failure of a component in a particular failure mode or modes, then B represents the absence of those failure mode or modes.
18
(a) AND-NOT gate (b) Equivalent representation
Figure 14: AND-NOT gate 6. EVENTS Three types of events, namely, top events, intermediate events and terminal events, may appear in fault trees. There are three types of terminal events, namely, basic events, undeveloped events and house events. These different types of events are defined and discussed below. Symbols used to represent these events are summarized in Figure 4. 6.1 Top Event Top events are also referred to as undesired events in some literature. The scope of a fault tree analysis is to determine the combinations of component-level failures that can cause a system-level undesired event, and/or to determine the probability of occurrence of the undesired event. There is only one undesired event (top event) in a fault tree. However there can be more than one undesired event associated with a system, and so, if necessary, we can construct more than one fault tree for a system (one fault tree for each undesired event associated with the system). The undesired event (top event) appears at the top of the fault tree, and it is always placed within a rectangle (see Figure 2). The undesired events could be "accidental conditions" (fire, explosion, toxic gas release, etc.), "unscheduled system shut down" or "system malfunction (failure to perform as-intended)". If necessary, one could develop one fault tree each for fire, explosion, toxic gas release, unscheduled system shut down, etc. If time is an essential factor, the time-frame should be specified for the undesired event. An example is "secondary feed-water supply system fails within 12 hours of main feed-water supply
19
system failure". In some cases, time duration may be important; for example, "feed-water pump is in a failed state for 36 hours". Here, failure of the pump in itself is not critical if it can be brought back to operation within 36 hours, since there is a reserve water tank that can supply the necessary water for 36 hours. Quantitative information may be an essential factor in some problems; for example, "pump delivers less than 80 gallons of water per minute". 6.2 Intermediate Event Any event within the fault tree (except for the top event) that is further resolved into events that could cause it, is called an intermediate event. In the example problem (Section 2, Figure 2), "excessive current to motor" and "excessive current in circuit" are the intermediate events. Intermediate events are placed within rectangles in a fault tree (see Figure 2). 6.3 Terminal Event Terminal events are also referred to as end events and primary events in some literature. A terminal event is an event that is not resolved further into its causes. Terminal events are at the bottom of the fault tree and are represented by either circles or diamonds (see Figure 4). Whether an event should be resolved further into its causes or not is a decision to be made by the reliability analyst. The decision depends on the availability of quantitative data on the event (probability of the event) and the level of detail (level of resolution) the analyst wants in the fault tree. If the probability of the undesired event is to be computed (quantitative fault tree analysis), then quantitative data for the terminal events is a necessity. This is a necessary condition but just because we have the failure data for an event does not necessarily mean that we have to treat it as a terminal event; we may still treat it as an intermediate event and resolve it into its causes. Some general guidelines in deciding on the level of resolution are given below: 1. Usually, the terminal event is a component-level event, an event caused by another system or an external event. (Component-level events include component failures, human errors and software errors. "Abnormally high temperature due to air-conditioning system failure" and "no power because of external power supply failure" are examples of events caused by another system. Earthquake, hurricane, tornado, tsunami and flood are examples of external events.) 2. Probabilities of the terminal events should be available if quantification of the fault tree (computation of the probability of occurrence of the undesired event and/or intermediate events) is an objective.

20
3. If the probability of a component-level event is not known, it may be treated as an intermediate event and further resolved to failures at the parts-level (parts of the component) for which failure probabilities are available. Note that a component may have more than one failure mode and each failure mode may constitute an event; some failure modes may be treated as terminal events while others may best be treated as intermediate events and further resolved to failures at the parts-level. 4. Sometimes, even subsystem-level events are treated as terminal events if further resolution of the event will not improve our understanding of the problem. This is acceptable if (i) the probability of the subsystem-level event is available, (ii) components of the subsystem do not enter the fault tree as terminal or intermediate events elsewhere in the fault tree, and (iii) there is no statistical dependence between components of the subsystem and other events in the tree. There are three types of terminal events: (i) Undeveloped events, (ii) Basic events, and (iii) House events. 6.3.1 Undeveloped Event Undeveloped events are used in the following situations: 1. A subsystem-level event is used as an undeveloped terminal event if further resolution of that event will not improve our understanding of the problem. These events are represented by diamonds (see Figure 4). 2. A subsystem-level event is treated as an undeveloped terminal event in fault trees developed during early stages of the project, but will be treated as an intermediate event and resolved further at a later date. Such events are represented either by a diamond or by a double diamond (see Figure 4). 3. An outside event (that is, an event caused by a system or subsystem outside the boundaries of the system under analysis) is treated as an undeveloped terminal event. Such events are represented by a diamond (see Figure 4). There should be no common components between the system under analysis and the outside system or subsystem. Also, there should be no statistical dependence between components of the outside system or subsystem and events in the fault tree. 4. Sometimes a subsystem event is treated as an undeveloped terminal event in the main fault tree but a separate sub-tree is constructed for this event. This subsystem event would be the top event of the sub-tree and the probability of the top event of this sub-tree is transferred to the main tree as the probability of the undeveloped terminal event. It is important that the sub-tree be
21
independent of the other events of the fault tree; no event from the main tree should appear on the sub-tree and there should be no statistical dependence between events of the main tree and the sub-tree. Undeveloped terminal events of this type are represented by a diamond or a circle within a diamond (see Figure 4). 6.3.2 Basic Event A basic event is either a component-level event which is not resolved further or an external event. Component-level events include component failures, human errors and software errors. Though component-level events treated as basic events are usually failure events, success events may also enter a fault tree. External events include earthquakes, floods, tornados, tsunamis, hurricanes, etc. A component failure is a state of the component; for example a valve is in a closed state when it should be open, or a pipe is in a ruptured state, or a pump is in an idle state when it should be operating. When a component is in a failed state, it either does not perform its intended function correctly or it performs an unintended function. For example, consider a fire alarm. It is a failure if the alarm fails to sound when there is a fire; it is also a failure (fault) if the alarm sounds when there is no fire. Degrees of component failures: There may be different degrees of component failures. For example, a one gallon per minute (1 gpm) leak from a pipe may not have the same effect as a 10 gpm leak. Such degrees of failures may be treated in two ways. In the first approach, we set off a limit below which it is not considered a failure; for example, if the leakage rate is below 0.5 gpm, it is not a failure. A corollary conservative approach is to treat any leak at all as a failure, and assume that even a small leak has the same effect as a large leak. The second approach is to draw different fault trees with different degrees of failures; one tree with 1 gpm leak, another with 2 gpm leak, etc. Such an approach could result in numerous fault trees, and thus impractical to use, if there are a number of components, each with many different degrees of failures. Degrees of component failures are sometimes referred as levels of component failures although the former is more widely used. Primary, secondary and command failures: Component failures are classified into three categories: 1. Primary failures, 2. Secondary failures, and 3. Command failures (signal failures).
22
A primary failure is the result of a deficiency in the component, and the failure occurs even when the operating and environmental conditions are within design limits. Rupture of a pressure vessel even when the operating temperature and pressure are within design limits is an example of a primary failure. A secondary failure is the result of abnormal operating or/and environmental conditions (operating and/or environmental conditions outside design limits); the component may not have any deficiency and may operate without failure under normal operating and environmental conditions. Operating or environmental conditions causing secondary failures include abnormal temperature, pressure, load, speed, vibration, electric current, moisture, dust and chemical concentration. The abnormal conditions could be the result of one or more of the following causes:
1. External events: earthquake, flood, tornado, tsunami, hurricane, external explosion, etc. 2. Internal events: internal explosion, fire, etc. 3. Malfunction of other components: for example, a safety relief valve failure results in abnormal
pressures in a pressure vessel. 4. Malfunction of other systems: for example, an air conditioning system failure results in
abnormal temperatures in an electronics component panel. 5. Installation, maintenance, and/or test errors: technicians fail to put the component back in its
proper configuration; for example, technicians leave the valve open instead of closed. 6. Damage during shipping 7. Damage due to sabotage
These causes are known as secondary causes. Some of these secondary causes could affect more than one component simultaneously, and such secondary causes are called common causes. Common causes will appear in more than one place in the fault tree. Command failure (signal failure) is a component failure due to a wrong command or wrong signal input to the component. For example, a sprinkler system fails to extinguish the fire because the signal that is to trigger the sprinkler system does not operate.
23
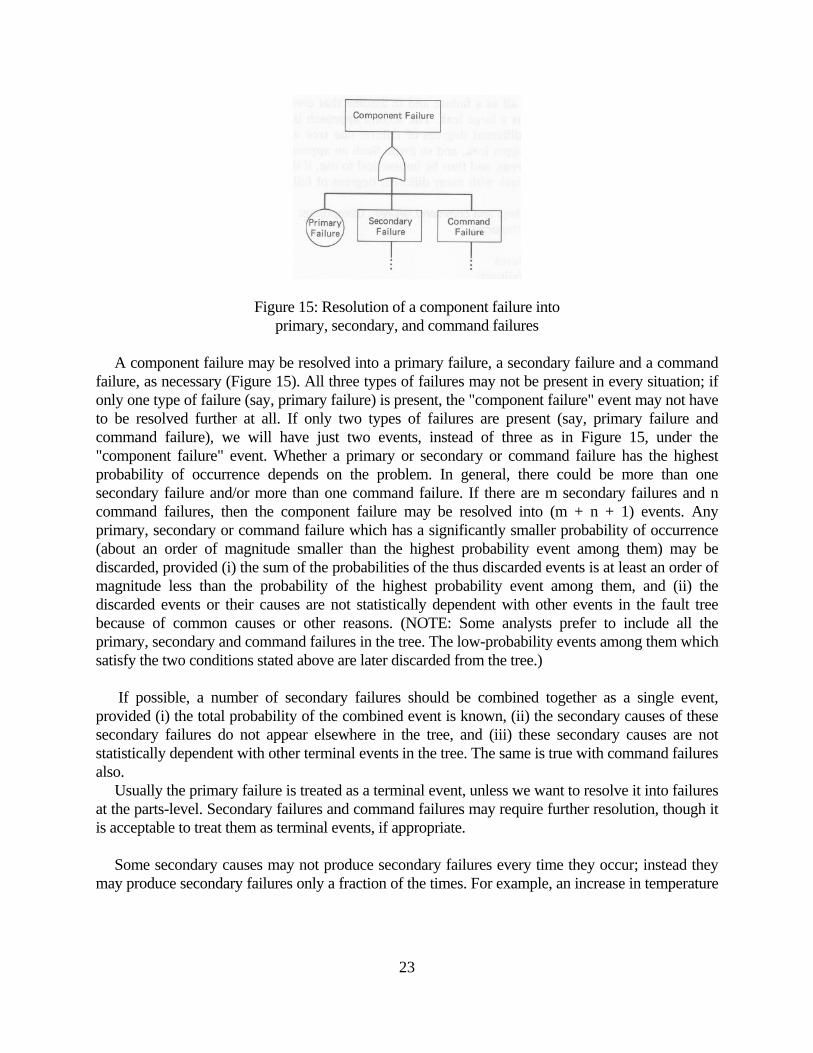
Figure 15: Resolution of a component failure into primary, secondary, and command failures
A component failure may be resolved into a primary failure, a secondary failure and a command failure, as necessary (Figure 15). All three types of failures may not be present in every situation; if only one type of failure (say, primary failure) is present, the "component failure" event may not have to be resolved further at all. If only two types of failures are present (say, primary failure and command failure), we will have just two events, instead of three as in Figure 15, under the "component failure" event. Whether a primary or secondary or command failure has the highest probability of occurrence depends on the problem. In general, there could be more than one secondary failure and/or more than one command failure. If there are m secondary failures and n command failures, then the component failure may be resolved into (m + n + 1) events. Any primary, secondary or command failure which has a significantly smaller probability of occurrence (about an order of magnitude smaller than the highest probability event among them) may be discarded, provided (i) the sum of the probabilities of the thus discarded events is at least an order of magnitude less than the probability of the highest probability event among them, and (ii) the discarded events or their causes are not statistically dependent with other events in the fault tree because of common causes or other reasons. (NOTE: Some analysts prefer to include all the primary, secondary and command failures in the tree. The low-probability events among them which satisfy the two conditions stated above are later discarded from the tree.) If possible, a number of secondary failures should be combined together as a single event, provided (i) the total probability of the combined event is known, (ii) the secondary causes of these secondary failures do not appear elsewhere in the tree, and (iii) these secondary causes are not statistically dependent with other terminal events in the tree. The same is true with command failures also. Usually the primary failure is treated as a terminal event, unless we want to resolve it into failures at the parts-level. Secondary failures and command failures may require further resolution, though it is acceptable to treat them as terminal events, if appropriate. Some secondary causes may not produce secondary failures every time they occur; instead they may produce secondary failures only a fraction of the times. For example, an increase in temperature
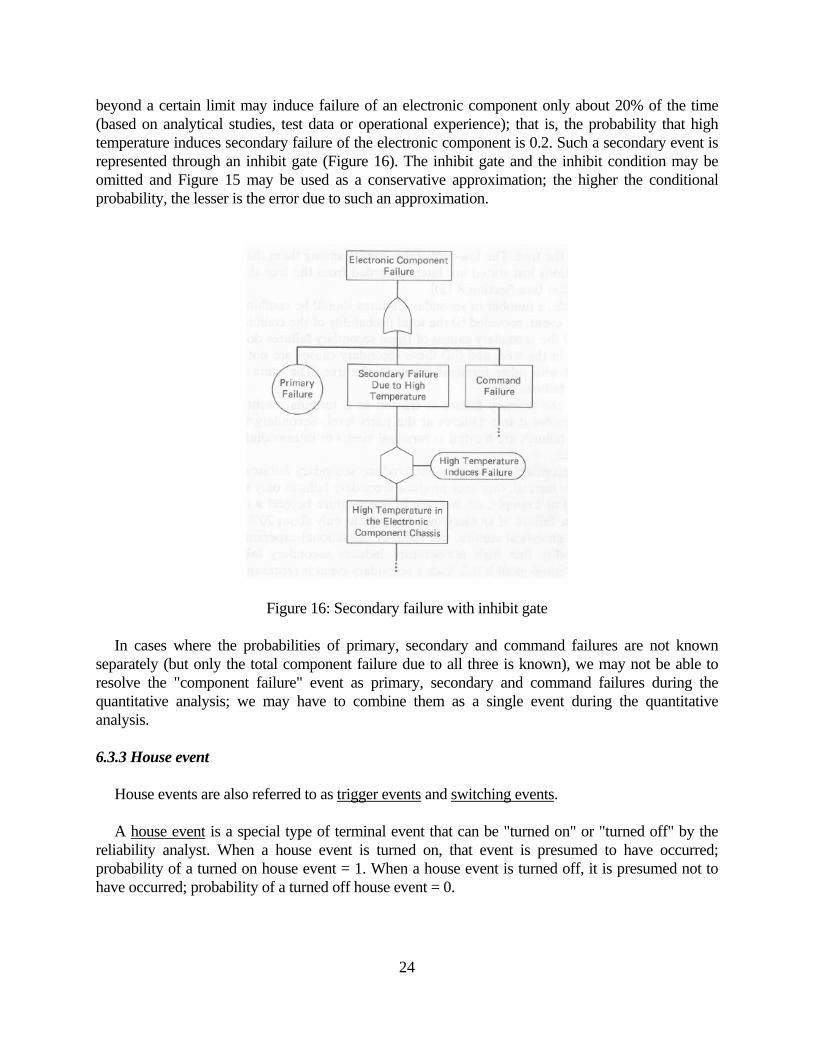
24
beyond a certain limit may induce failure of an electronic component only about 20% of the time (based on analytical studies, test data or operational experience); that is, the probability that high temperature induces secondary failure of the electronic component is 0.2. Such a secondary event is represented through an inhibit gate (Figure 16). The inhibit gate and the inhibit condition may be omitted and Figure 15 may be used as a conservative approximation; the higher the conditional probability, the lesser is the error due to such an approximation.
Figure 16: Secondary failure with inhibit gate In cases where the probabilities of primary, secondary and command failures are not known separately (but only the total component failure due to all three is known), we may not be able to resolve the "component failure" event as primary, secondary and command failures during the quantitative analysis; we may have to combine them as a single event during the quantitative analysis. 6.3.3 House event House events are also referred to as trigger events and switching events. A house event is a special type of terminal event that can be "turned on" or "turned off" by the reliability analyst. When a house event is turned on, that event is presumed to have occurred; probability of a turned on house event = 1. When a house event is turned off, it is presumed not to have occurred; probability of a turned off house event = 0.
25
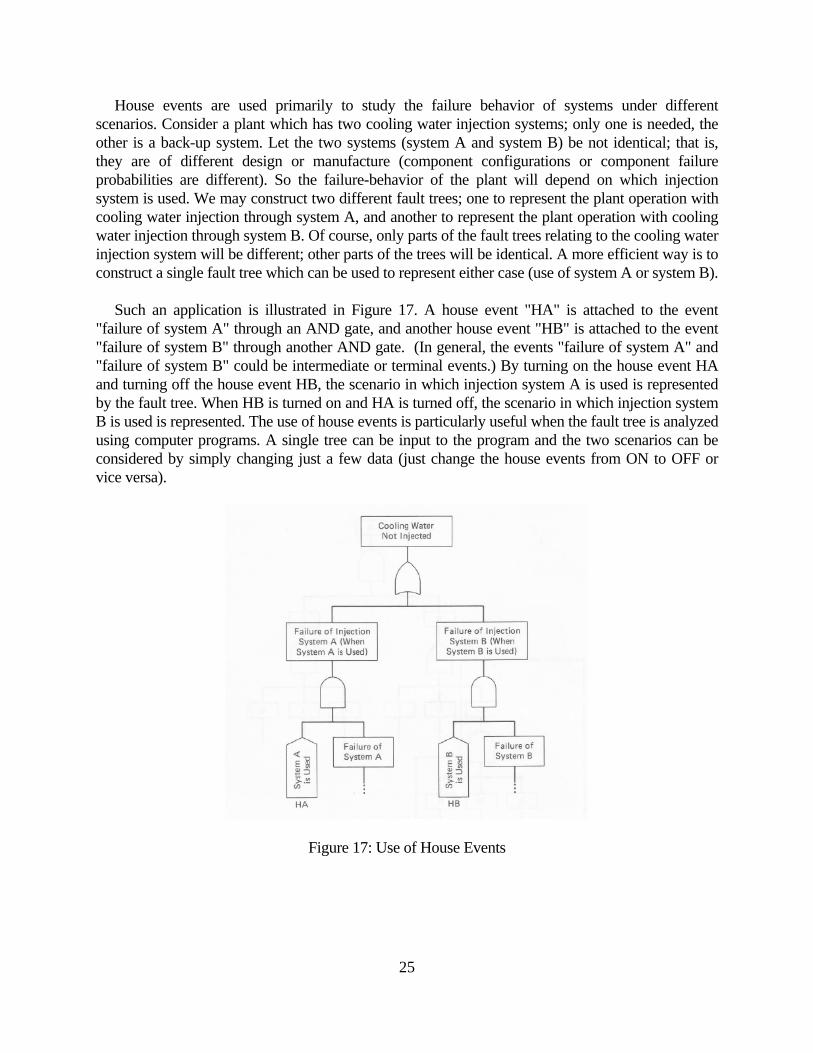
House events are used primarily to study the failure behavior of systems under different scenarios. Consider a plant which has two cooling water injection systems; only one is needed, the other is a back-up system. Let the two systems (system A and system B) be not identical; that is, they are of different design or manufacture (component configurations or component failure probabilities are different). So the failure-behavior of the plant will depend on which injection system is used. We may construct two different fault trees; one to represent the plant operation with cooling water injection through system A, and another to represent the plant operation with cooling water injection through system B. Of course, only parts of the fault trees relating to the cooling water injection system will be different; other parts of the trees will be identical. A more efficient way is to construct a single fault tree which can be used to represent either case (use of system A or system B). Such an application is illustrated in Figure 17. A house event "HA" is attached to the event "failure of system A" through an AND gate, and another house event "HB" is attached to the event "failure of system B" through another AND gate. (In general, the events "failure of system A" and "failure of system B" could be intermediate or terminal events.) By turning on the house event HA and turning off the house event HB, the scenario in which injection system A is used is represented by the fault tree. When HB is turned on and HA is turned off, the scenario in which injection system B is used is represented. The use of house events is particularly useful when the fault tree is analyzed using computer programs. A single tree can be input to the program and the two scenarios can be considered by simply changing just a few data (just change the house events from ON to OFF or vice versa).
Figure 17: Use of House Events
26
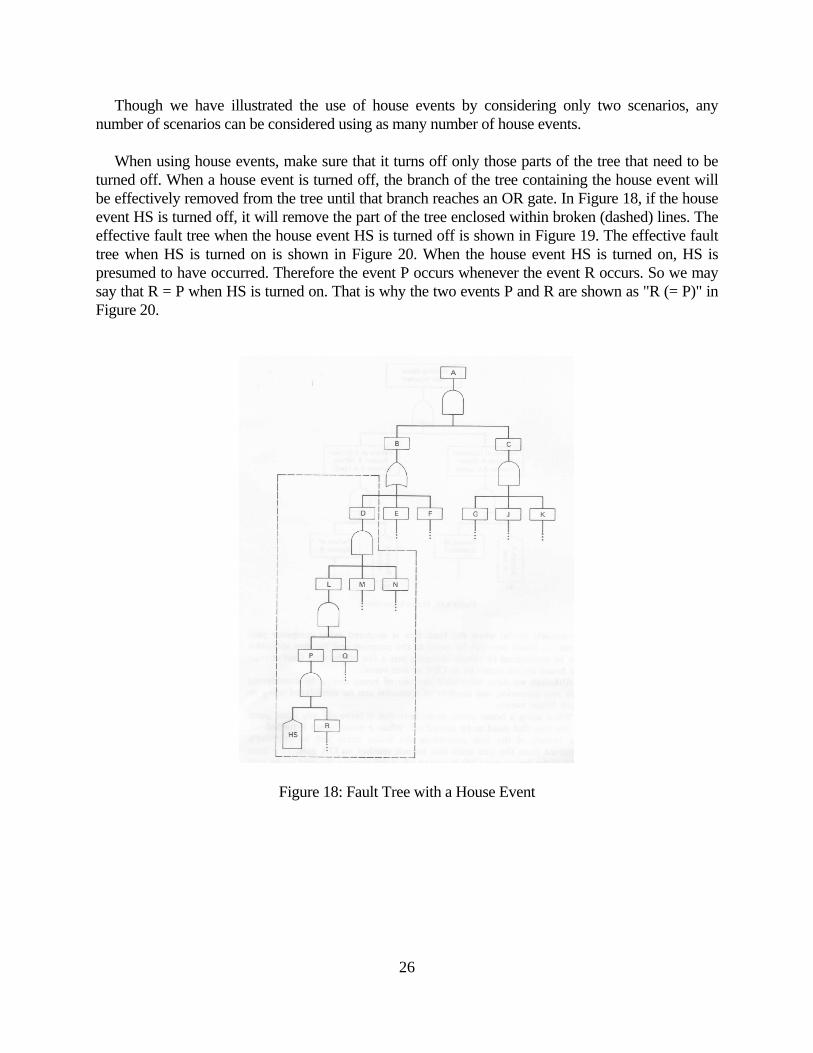
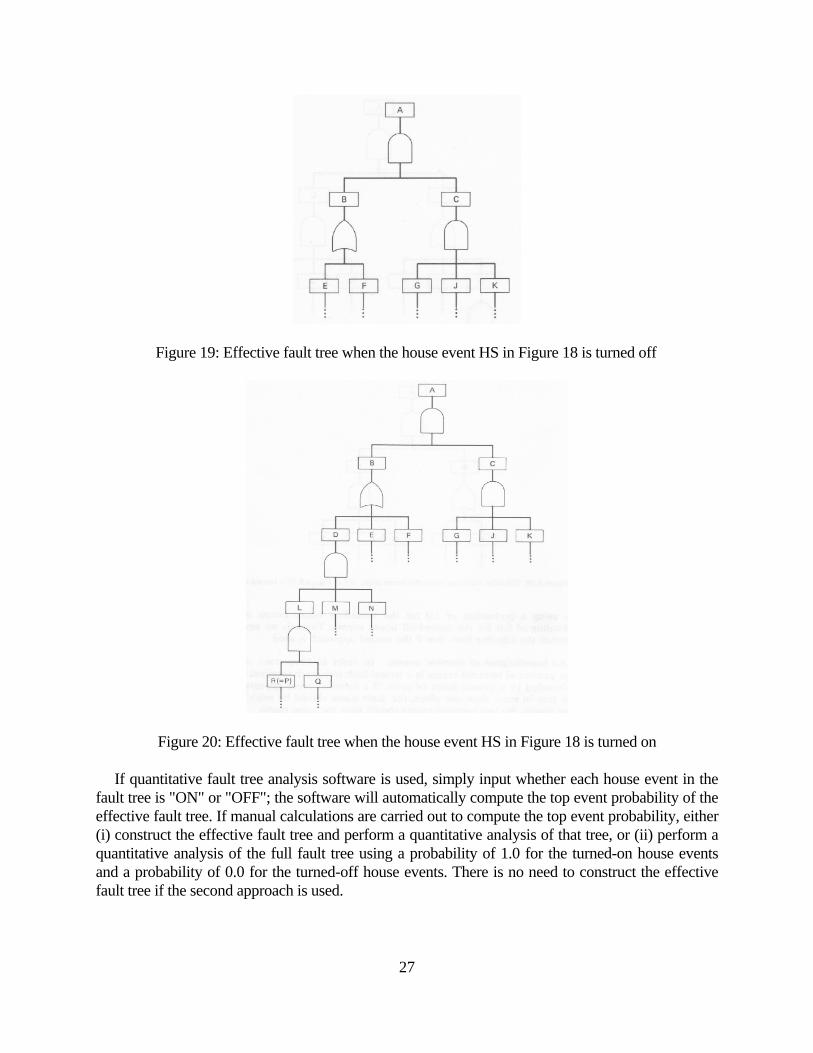
Though we have illustrated the use of house events by considering only two scenarios, any number of scenarios can be considered using as many number of house events. When using house events, make sure that it turns off only those parts of the tree that need to be turned off. When a house event is turned off, the branch of the tree containing the house event will be effectively removed from the tree until that branch reaches an OR gate. In Figure 18, if the house event HS is turned off, it will remove the part of the tree enclosed within broken (dashed) lines. The effective fault tree when the house event HS is turned off is shown in Figure 19. The effective fault tree when HS is turned on is shown in Figure 20. When the house event HS is turned on, HS is presumed to have occurred. Therefore the event P occurs whenever the event R occurs. So we may say that R = P when HS is turned on. That is why the two events P and R are shown as "R (= P)" in Figure 20.
Figure 18: Fault Tree with a House Event
27
Figure 19: Effective fault tree when the house event HS in Figure 18 is turned off
Figure 20: Effective fault tree when the house event HS in Figure 18 is turned on If quantitative fault tree analysis software is used, simply input whether each house event in the fault tree is "ON" or "OFF"; the software will automatically compute the top event probability of the effective fault tree. If manual calculations are carried out to compute the top event probability, either (i) construct the effective fault tree and perform a quantitative analysis of that tree, or (ii) perform a quantitative analysis of the full fault tree using a probability of 1.0 for the turned-on house events and a probability of 0.0 for the turned-off house events. There is no need to construct the effective fault tree if the second approach is used.
28
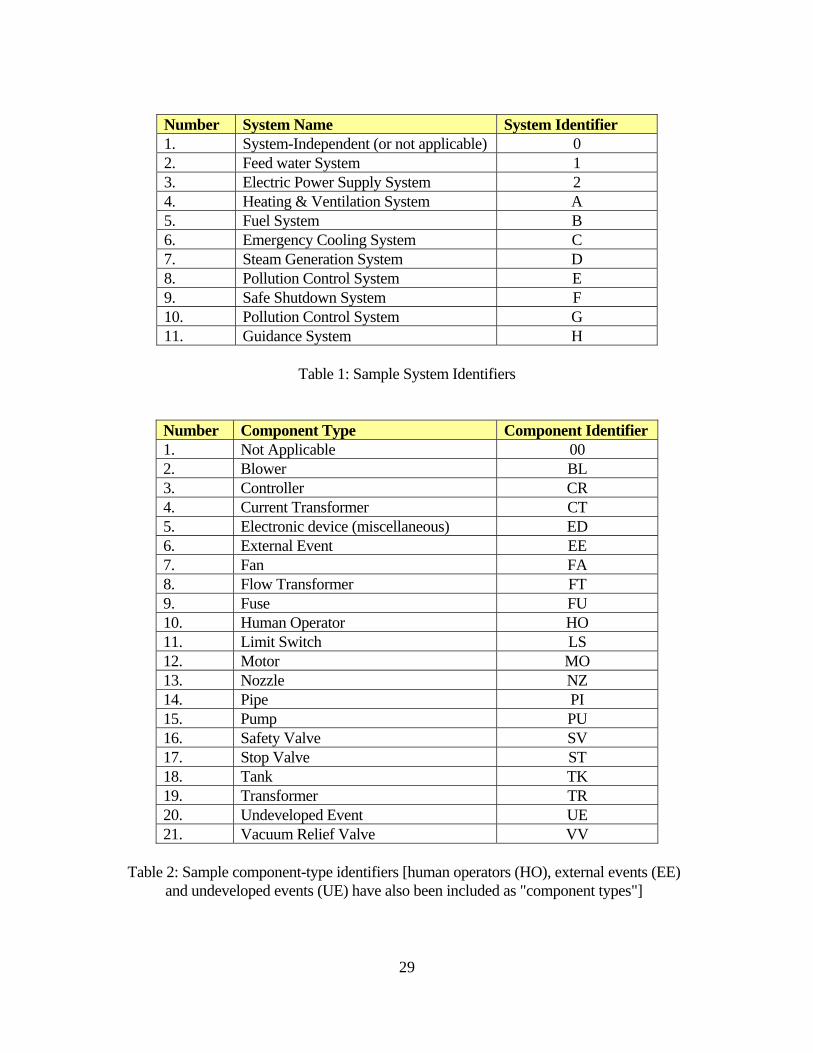
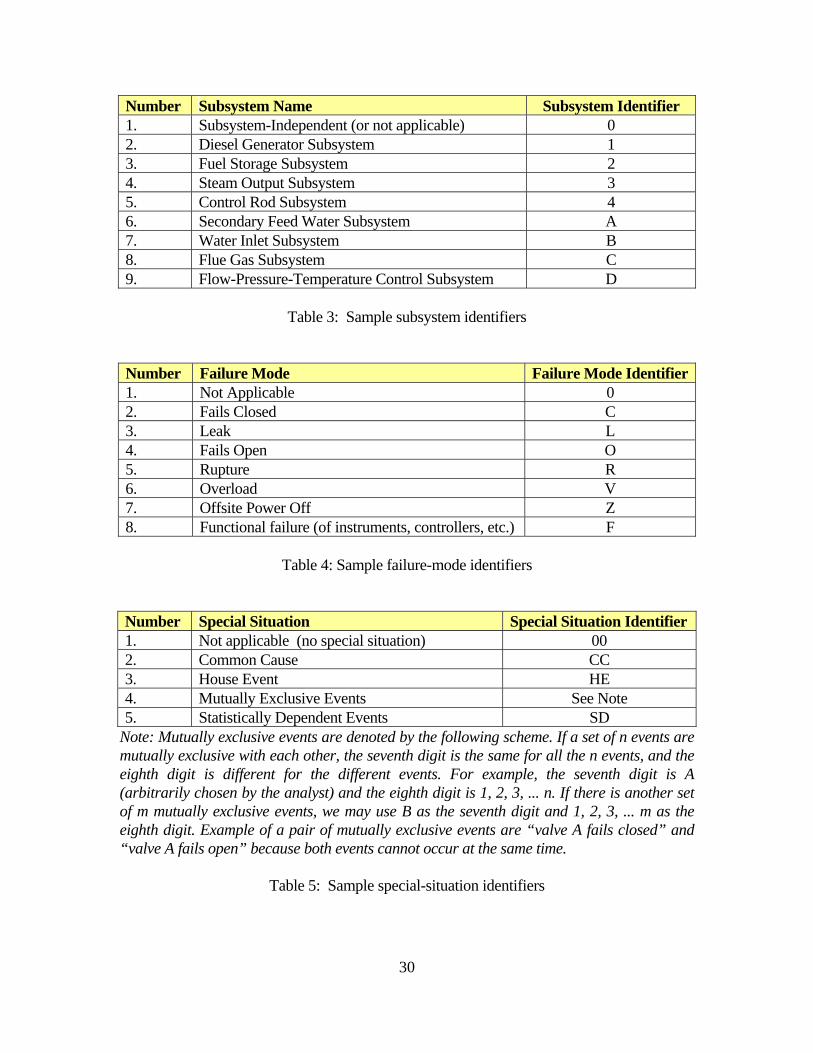
6.3.4 Identification of terminal events In order to keep track of the large numbers of terminal events in a typical fault tree, each terminal event is identified by a unique name or code. If a terminal event appears in a fault tree in more than one place, the same name should be used in all those places. No two terminal events should have the same name. Though we may name terminal events in any way we please, a systematic method is advisable. The Probabilistic Risk Assessment Procedures Guide (Nuclear Regulatory Commission 1983) recommended an eight-character naming system (or eight-digit naming scheme). We present here a slightly different sample eight-character scheme. An analyst may choose his/her own scheme of identifiers. Keep in mind that terminal event names are for easy identification of terminal events. Two analysts may name differently. As long as the names are properly documented, explained and used consistently within the project, naming differences would not affect the final results of qualitative and/or quantitative fault tree analysis. Each digit (each character) can be either a letter (A to Z) or a number (0 to 9). 1-st digit: Identifies the system to which the component belongs (see Table 1). Because of overlapping system boundaries, the same component may belong to two or more systems; in such situations, arbitrarily choose one of the systems for the purpose of naming the component. If more than one fault tree is developed for those systems, the same component name should be used in all those trees. 2-nd and 3-rd digits: Identifies the component type (see Table 2) 4-th digit: Identifies the specific component: arbitrarily assigned by the analyst (Each component of the same type should have a unique identifier in the system. The same identifier may be used in another system for another component as long as both systems do not enter the same fault tree. Within the same system, a tank and a pump may have the same identifier (say, “3” or “J”) but two tanks within the same system should not have the same identifier.) 5-th digit: Identifies the subsystem to which the component belongs (see Table 3). 6-th digit: Identifies the failure mode (see Table 4). 7-th and 8-th digits: Identifies special situations (see Table 5). Additional digits may be added to identify component location and other information. Remember, the identifiers indicated in Tables 1 to 6 are suggestions; you may specify your own identifiers and use them consistently.
29
Number System Name System Identifier 1. System-Independent (or not applicable) 0 2. Feed water System 1 3. Electric Power Supply System 2 4. Heating & Ventilation System A 5. Fuel System B 6. Emergency Cooling System C 7. Steam Generation System D 8. Pollution Control System E 9. Safe Shutdown System F 10. Pollution Control System G 11. Guidance System H
Table 1: Sample System Identifiers
Number Component Type Component Identifier 1. Not Applicable 00 2. Blower BL 3. Controller CR 4. Current Transformer CT 5. Electronic device (miscellaneous) ED 6. External Event EE 7. Fan FA 8. Flow Transformer FT 9. Fuse FU 10. Human Operator HO 11. Limit Switch LS 12. Motor MO 13. Nozzle NZ 14. Pipe PI 15. Pump PU 16. Safety Valve SV 17. Stop Valve ST 18. Tank TK 19. Transformer TR 20. Undeveloped Event UE 21. Vacuum Relief Valve VV
Table 2: Sample component-type identifiers [human operators (HO), external events (EE)
and undeveloped events (UE) have also been included as "component types"]
30
Number Subsystem Name Subsystem Identifier 1. Subsystem-Independent (or not applicable) 0 2. Diesel Generator Subsystem 1 3. Fuel Storage Subsystem 2 4. Steam Output Subsystem 3 5. Control Rod Subsystem 4 6. Secondary Feed Water Subsystem A 7. Water Inlet Subsystem B 8. Flue Gas Subsystem C 9. Flow-Pressure-Temperature Control Subsystem D
Table 3: Sample subsystem identifiers
Number Failure Mode Failure Mode Identifier1. Not Applicable 0 2. Fails Closed C 3. Leak L 4. Fails Open O 5. Rupture R 6. Overload V 7. Offsite Power Off Z 8. Functional failure (of instruments, controllers, etc.) F
Table 4: Sample failure-mode identifiers
Number Special Situation Special Situation Identifier 1. Not applicable (no special situation) 00 2. Common Cause CC 3. House Event HE 4. Mutually Exclusive Events See Note 5. Statistically Dependent Events SD
Note: Mutually exclusive events are denoted by the following scheme. If a set of n events are mutually exclusive with each other, the seventh digit is the same for all the n events, and the eighth digit is different for the different events. For example, the seventh digit is A (arbitrarily chosen by the analyst) and the eighth digit is 1, 2, 3, ... n. If there is another set of m mutually exclusive events, we may use B as the seventh digit and 1, 2, 3, ... m as the eighth digit. Example of a pair of mutually exclusive events are “valve A fails closed” and “valve A fails open” because both events cannot occur at the same time.
Table 5: Sample special-situation identifiers
31
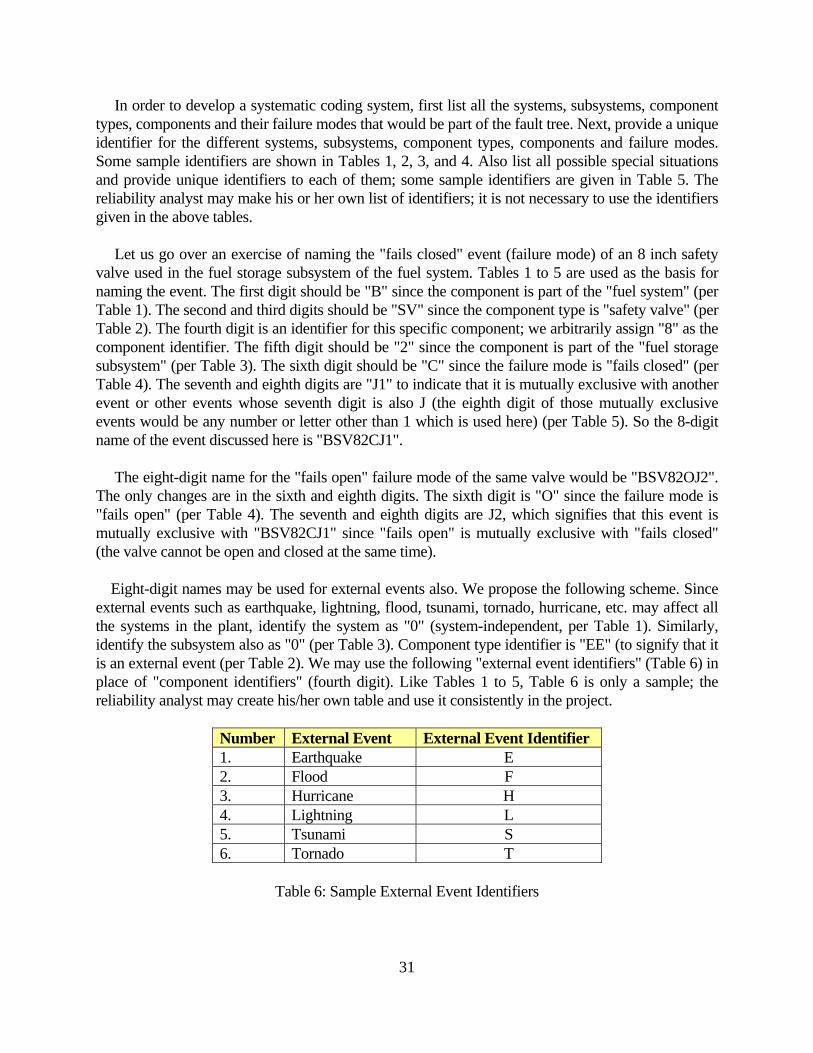
In order to develop a systematic coding system, first list all the systems, subsystems, component types, components and their failure modes that would be part of the fault tree. Next, provide a unique identifier for the different systems, subsystems, component types, components and failure modes. Some sample identifiers are shown in Tables 1, 2, 3, and 4. Also list all possible special situations and provide unique identifiers to each of them; some sample identifiers are given in Table 5. The reliability analyst may make his or her own list of identifiers; it is not necessary to use the identifiers given in the above tables. Let us go over an exercise of naming the "fails closed" event (failure mode) of an 8 inch safety valve used in the fuel storage subsystem of the fuel system. Tables 1 to 5 are used as the basis for naming the event. The first digit should be "B" since the component is part of the "fuel system" (per Table 1). The second and third digits should be "SV" since the component type is "safety valve" (per Table 2). The fourth digit is an identifier for this specific component; we arbitrarily assign "8" as the component identifier. The fifth digit should be "2" since the component is part of the "fuel storage subsystem" (per Table 3). The sixth digit should be "C" since the failure mode is "fails closed" (per Table 4). The seventh and eighth digits are "J1" to indicate that it is mutually exclusive with another event or other events whose seventh digit is also J (the eighth digit of those mutually exclusive events would be any number or letter other than 1 which is used here) (per Table 5). So the 8-digit name of the event discussed here is "BSV82CJ1". The eight-digit name for the "fails open" failure mode of the same valve would be "BSV82OJ2". The only changes are in the sixth and eighth digits. The sixth digit is "O" since the failure mode is "fails open" (per Table 4). The seventh and eighth digits are J2, which signifies that this event is mutually exclusive with "BSV82CJ1" since "fails open" is mutually exclusive with "fails closed" (the valve cannot be open and closed at the same time). Eight-digit names may be used for external events also. We propose the following scheme. Since external events such as earthquake, lightning, flood, tsunami, tornado, hurricane, etc. may affect all the systems in the plant, identify the system as "0" (system-independent, per Table 1). Similarly, identify the subsystem also as "0" (per Table 3). Component type identifier is "EE" (to signify that it is an external event (per Table 2). We may use the following "external event identifiers" (Table 6) in place of "component identifiers" (fourth digit). Like Tables 1 to 5, Table 6 is only a sample; the reliability analyst may create his/her own table and use it consistently in the project.
Number External Event External Event Identifier 1. Earthquake E 2. Flood F 3. Hurricane H 4. Lightning L 5. Tsunami S 6. Tornado T
Table 6: Sample External Event Identifiers
32
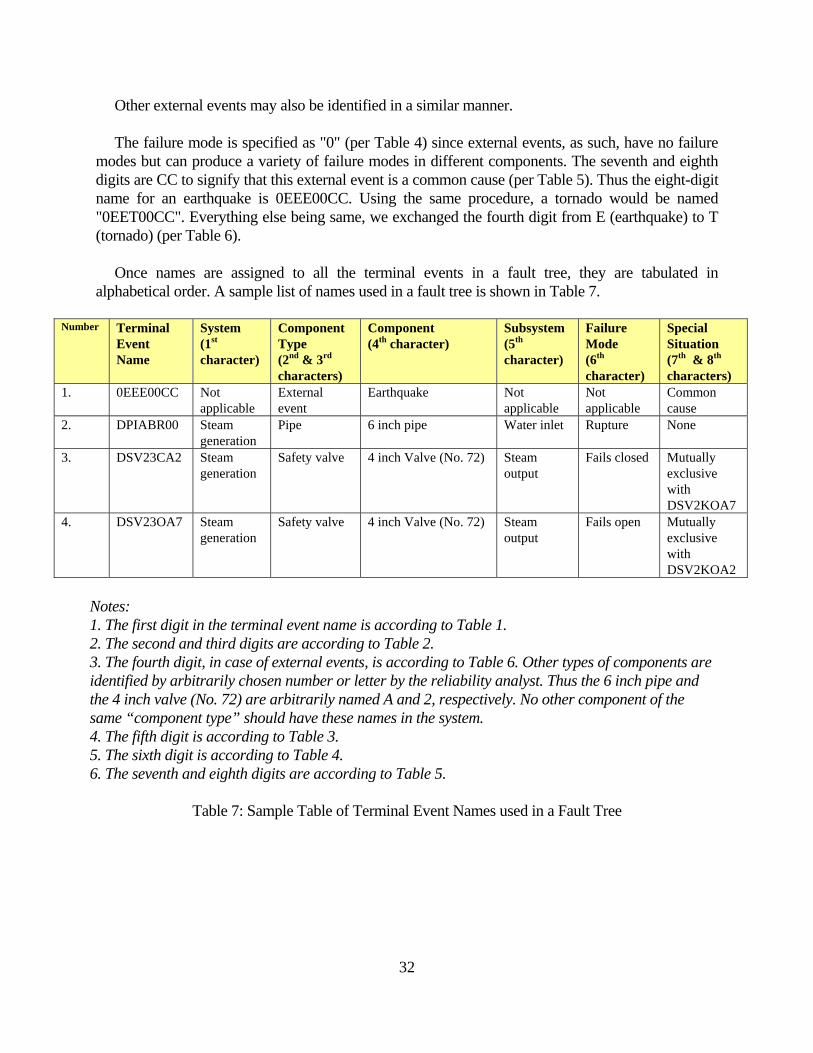
Other external events may also be identified in a similar manner. The failure mode is specified as "0" (per Table 4) since external events, as such, have no failure modes but can produce a variety of failure modes in different components. The seventh and eighth digits are CC to signify that this external event is a common cause (per Table 5). Thus the eight-digit name for an earthquake is 0EEE00CC. Using the same procedure, a tornado would be named "0EET00CC". Everything else being same, we exchanged the fourth digit from E (earthquake) to T (tornado) (per Table 6). Once names are assigned to all the terminal events in a fault tree, they are tabulated in alphabetical order. A sample list of names used in a fault tree is shown in Table 7.
Number Terminal Event Name
System (1st character)
Component Type (2nd & 3rd characters)
Component (4th character)
Subsystem (5th character)
Failure Mode (6th character)
Special Situation (7th & 8th characters)
1. 0EEE00CC Not applicable
External event
Earthquake Not applicable
Not applicable
Common cause
2. DPIABR00 Steam generation
Pipe 6 inch pipe Water inlet Rupture None
3. DSV23CA2 Steam generation
Safety valve 4 inch Valve (No. 72) Steam output
Fails closed Mutually exclusive with DSV2KOA7
4. DSV23OA7 Steam generation
Safety valve 4 inch Valve (No. 72) Steam output
Fails open Mutually exclusive with DSV2KOA2
Notes: 1. The first digit in the terminal event name is according to Table 1. 2. The second and third digits are according to Table 2. 3. The fourth digit, in case of external events, is according to Table 6. Other types of components are identified by arbitrarily chosen number or letter by the reliability analyst. Thus the 6 inch pipe and the 4 inch valve (No. 72) are arbitrarily named A and 2, respectively. No other component of the same “component type” should have these names in the system. 4. The fifth digit is according to Table 3. 5. The sixth digit is according to Table 4. 6. The seventh and eighth digits are according to Table 5.
Table 7: Sample Table of Terminal Event Names used in a Fault Tree

33
Once names are assigned and tabulated, the names may be shown in the fault tree under each terminal event, for easy identification (see Figure 21).
Figure 21: Terminal event identification in fault trees 7. TRANSFER SYMBOLS The fault tree of an undesired event in a complex system may not fit in a single sheet of paper. A tree could be so large as to require ten, twenty or more sheets. Of course, there is no need for transfer symbols if the fault tree is not drawn in multiple sheets of paper. The proper continuation of the tree from one sheet to another is indicated by transfer symbols. Transfer symbols are triangles, with the apex at the top. A triangle with a line emanating from its top, or just attached to the rectangle of an intermediate event above, is the transfer-in symbol (see Figure 5). A triangle with a line emanating from the center of one of the inclined sides or from the bottom side is the transfer-out symbol (see Figure 5). Each transfer symbol in a fault tree is identified by a name (say, A007, D7, AEX, etc.).
34
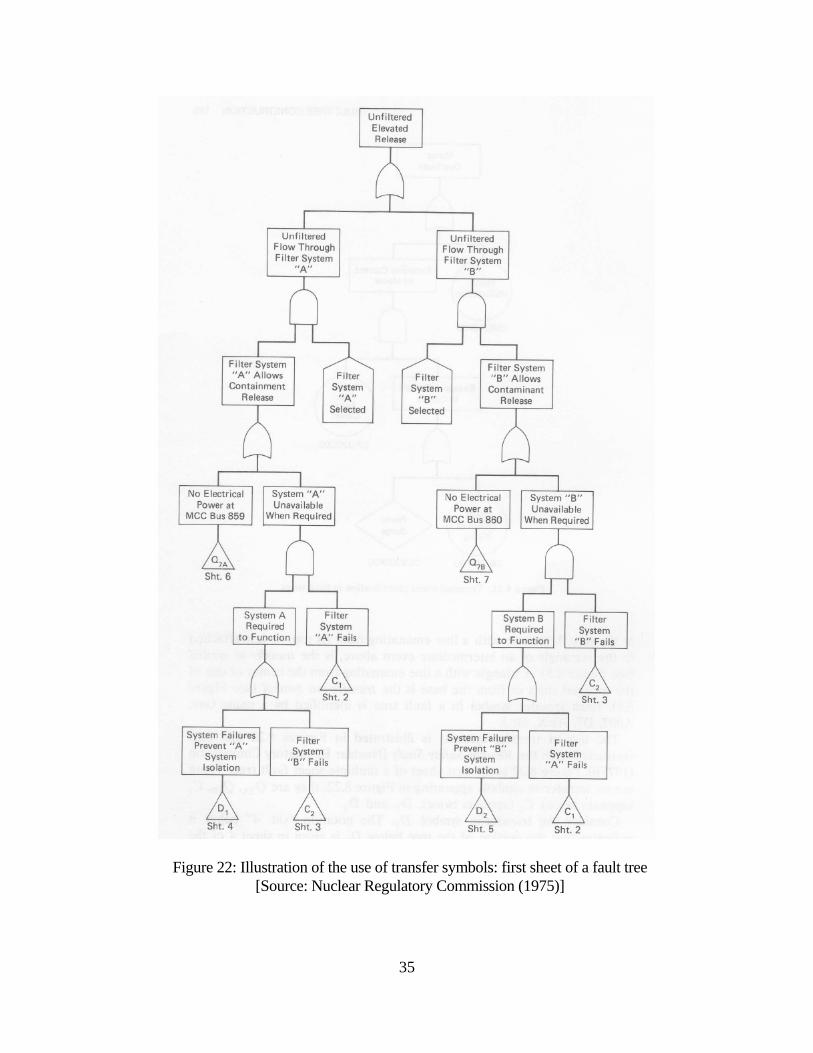
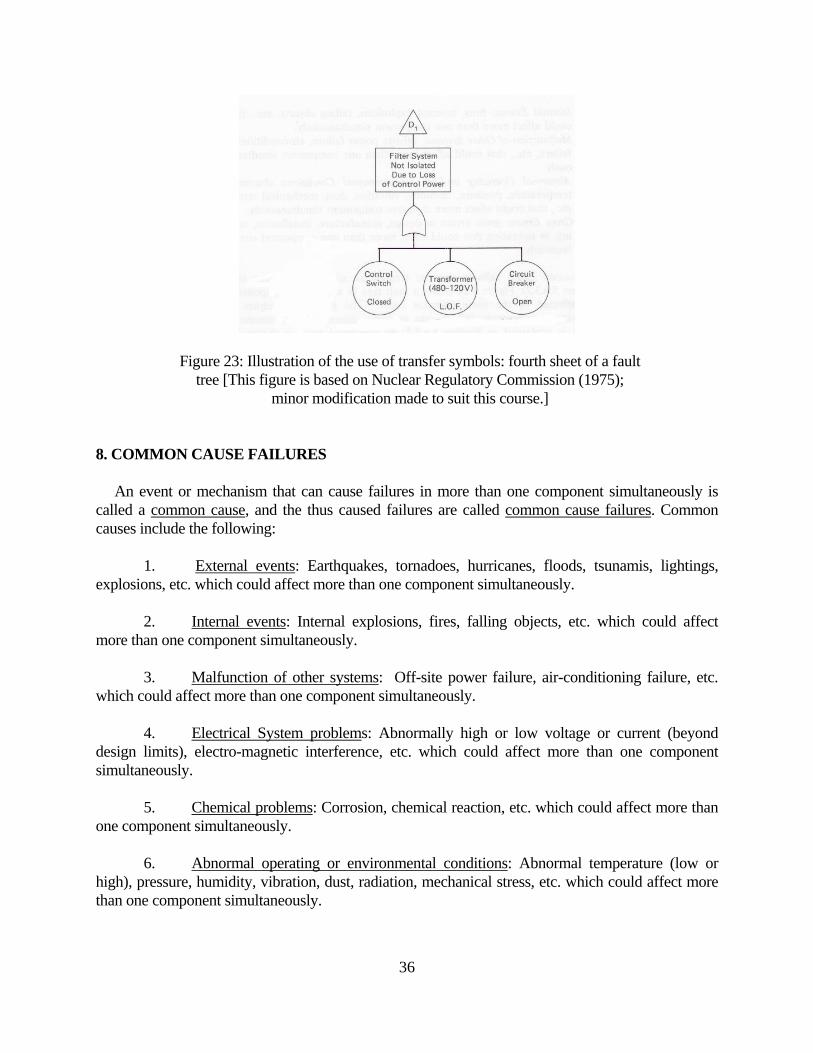
The use of transfer symbols is illustrated in Figures 22 and 23 [extracted from the Reactor Safety Study (Nuclear Regulatory Commission 1975)]. Figure 22 is the first sheet of a multiple-sheet fault tree. There are six transfer-in symbols appearing in Figure 22; they are Q7A, Q7B, C1 (appears twice), C2 (appears twice), D1 and D2. Consider the transfer-in symbol D1. The notation "sht. 4" below it indicates that the portion of the tree below D1 is given in sheet 4 of the fault tree. Figure 23 shows that fourth sheet. The transfer-out symbol D1 in Figure 23 indicates that the tree below it should go to where the transfer-in symbol D1 appears in Figure 22. The part of the tree below the transfer-in symbols C1, C2, D1, D2, Q7A and Q7B are given in sheets 2, 3, 4, 5, 6 and 7 of the fault tree, respectively (as indicated below the symbols in Figure 22). We have given Sheet 4 in Figure 23. Sheets 1 to 3 and 5 to 7 are not presented here in this course notes. If a transfer-in symbol appears n times in a fault tree, then the tree in the sheet corresponding to that transfer-in symbol should be inserted n times in the fault tree. For example, C1 appears 2 times in Figure 22 and so the tree in sht. 2 would be inserted 2 times in Figure 22.
35
Figure 22: Illustration of the use of transfer symbols: first sheet of a fault tree [Source: Nuclear Regulatory Commission (1975)]
36
Figure 23: Illustration of the use of transfer symbols: fourth sheet of a fault tree [This figure is based on Nuclear Regulatory Commission (1975);
minor modification made to suit this course.] 8. COMMON CAUSE FAILURES An event or mechanism that can cause failures in more than one component simultaneously is called a common cause, and the thus caused failures are called common cause failures. Common causes include the following:
1. External events: Earthquakes, tornadoes, hurricanes, floods, tsunamis, lightings, explosions, etc. which could affect more than one component simultaneously.
2. Internal events: Internal explosions, fires, falling objects, etc. which could affect more than one component simultaneously.
3. Malfunction of other systems: Off-site power failure, air-conditioning failure, etc. which could affect more than one component simultaneously.
4. Electrical System problems: Abnormally high or low voltage or current (beyond
design limits), electro-magnetic interference, etc. which could affect more than one component simultaneously.
5. Chemical problems: Corrosion, chemical reaction, etc. which could affect more than
one component simultaneously.
6. Abnormal operating or environmental conditions: Abnormal temperature (low or high), pressure, humidity, vibration, dust, radiation, mechanical stress, etc. which could affect more than one component simultaneously.
37
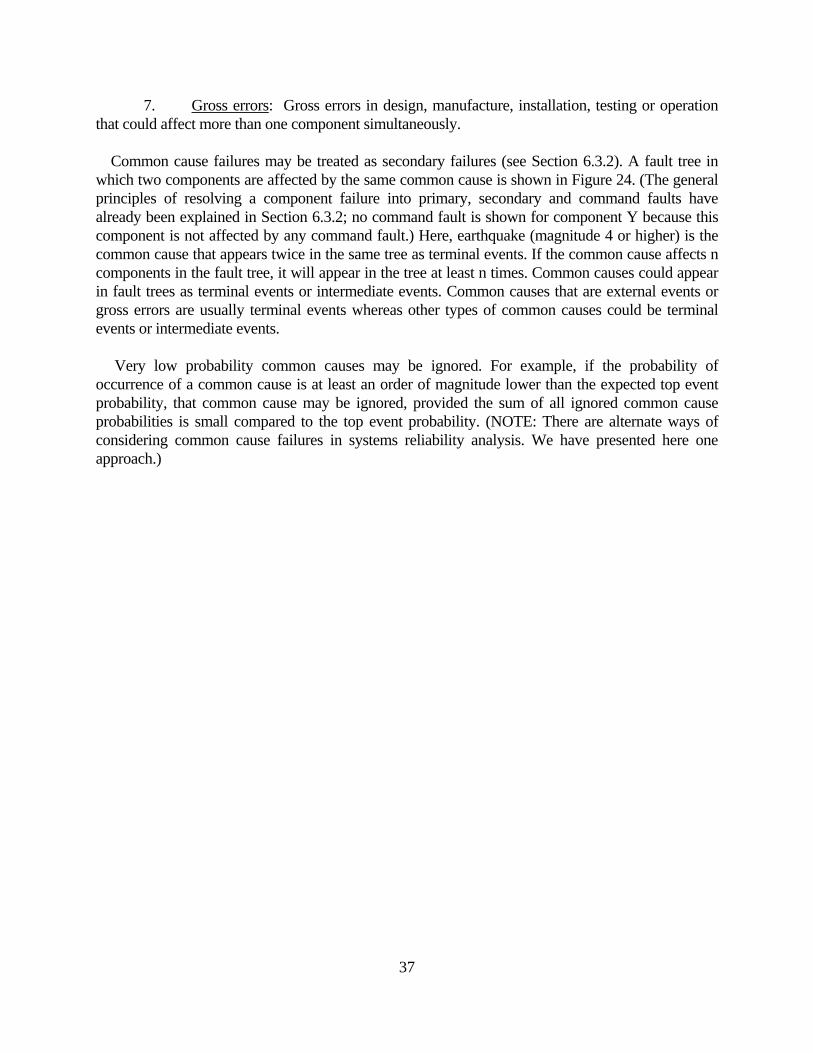
7. Gross errors: Gross errors in design, manufacture, installation, testing or operation that could affect more than one component simultaneously. Common cause failures may be treated as secondary failures (see Section 6.3.2). A fault tree in which two components are affected by the same common cause is shown in Figure 24. (The general principles of resolving a component failure into primary, secondary and command faults have already been explained in Section 6.3.2; no command fault is shown for component Y because this component is not affected by any command fault.) Here, earthquake (magnitude 4 or higher) is the common cause that appears twice in the same tree as terminal events. If the common cause affects n components in the fault tree, it will appear in the tree at least n times. Common causes could appear in fault trees as terminal events or intermediate events. Common causes that are external events or gross errors are usually terminal events whereas other types of common causes could be terminal events or intermediate events. Very low probability common causes may be ignored. For example, if the probability of occurrence of a common cause is at least an order of magnitude lower than the expected top event probability, that common cause may be ignored, provided the sum of all ignored common cause probabilities is small compared to the top event probability. (NOTE: There are alternate ways of considering common cause failures in systems reliability analysis. We have presented here one approach.)

38
EQ - Earthquake of magnitude 4 or higher
Figure 24: Common cause failure in a fault tree 9. COMPLEMENTARY TREES Complementary trees are also known as success trees and dual trees. The concept of complementary tree is useful in determining the combination of success events necessary for the “success” of the system. Such combinations are called path sets and are the subject of qualitative fault tree analysis. The complementary tree of a fault tree is obtained by modifying the fault tree as follows: 1. Change all OR gates to AND gates.
39
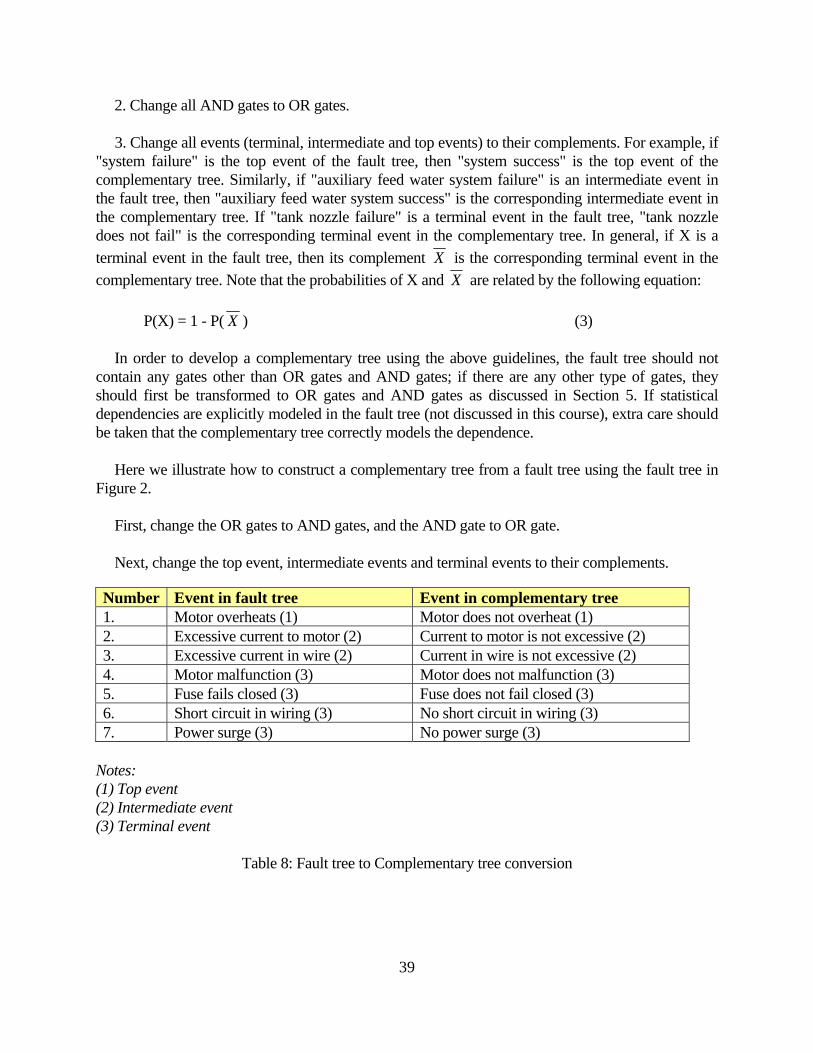
2. Change all AND gates to OR gates. 3. Change all events (terminal, intermediate and top events) to their complements. For example, if "system failure" is the top event of the fault tree, then "system success" is the top event of the complementary tree. Similarly, if "auxiliary feed water system failure" is an intermediate event in the fault tree, then "auxiliary feed water system success" is the corresponding intermediate event in the complementary tree. If "tank nozzle failure" is a terminal event in the fault tree, "tank nozzle does not fail" is the corresponding terminal event in the complementary tree. In general, if X is a terminal event in the fault tree, then its complement X is the corresponding terminal event in the complementary tree. Note that the probabilities of X and X are related by the following equation: P(X) = 1 - P( X ) (3) In order to develop a complementary tree using the above guidelines, the fault tree should not contain any gates other than OR gates and AND gates; if there are any other type of gates, they should first be transformed to OR gates and AND gates as discussed in Section 5. If statistical dependencies are explicitly modeled in the fault tree (not discussed in this course), extra care should be taken that the complementary tree correctly models the dependence. Here we illustrate how to construct a complementary tree from a fault tree using the fault tree in Figure 2. First, change the OR gates to AND gates, and the AND gate to OR gate. Next, change the top event, intermediate events and terminal events to their complements. Number Event in fault tree Event in complementary tree 1. Motor overheats (1) Motor does not overheat (1) 2. Excessive current to motor (2) Current to motor is not excessive (2) 3. Excessive current in wire (2) Current in wire is not excessive (2) 4. Motor malfunction (3) Motor does not malfunction (3) 5. Fuse fails closed (3) Fuse does not fail closed (3) 6. Short circuit in wiring (3) No short circuit in wiring (3) 7. Power surge (3) No power surge (3)
Notes: (1) Top event (2) Intermediate event (3) Terminal event
Table 8: Fault tree to Complementary tree conversion
40
10. LIMITATIONS Though fault trees are versatile and are widely used in system reliability analysis, there are some limitations to fault tree representation of system failures. 1. It is seldom possible to assure completeness of the fault tree. It is quite possible that some failure modes or combination of failure modes are inadvertently missed. If the tree is, in fact, incomplete, the probability of the top event or intermediate events computed from the fault tree could be unconservative. (This drawback is not limited to fault tree analysis; it is true for all system reliability analysis techniques.) 2. Fault tree analysis considers only the binary states of components. That is, we consider only two possible alternatives with respect to each failure mode: the failure mode exists (occurs) or it does not exist. In some actual situations, however, continuously increasing states of failure could occur. For example, a pipe may leak 1 gallon per minute (1 gpm) or 2 gpm or 10 gpm, etc. Fault trees are not best-suited for such non-binary failure states. This aspect has been discussed in Section 6.3.2 and couple of ways of considering multiple states of failure (1 gpm leak, 2 gpm leak, etc.) provided. In spite of these limitations, fault tree analysis is still a valuable and effective method of system reliability analysis. As long as we do not lose sight of these limitations, results from fault trees could be very useful in system design and reliability assessment. 11. DOCUMENTATION Documentation is an important part of fault tree construction and it should not be overlooked. Documentation shall contain the following information: 1. List of all documents used in constructing the fault tree (include Version Number and/or Version Date of each document, as appropriate). Documents may include the following: 1.1 System diagrams
1.2 Piping and instrumentation diagrams (P & I diagrams) 1.3 Schematic diagrams 1.4 Block diagrams 1.5 Logic Diagrams 1.6 Process flow diagrams
41
1.7 Installation drawings 1.8 Parts lists 1.9 Operating procedures 1.10 Maintenance and test procedures 1.11 Training manuals 2. System description and system functional description, as discussed in Section 3. If assumptions are made, those assumptions and their justifications shall be stated. Indicate the reference documents, as necessary. 3. Fault tree. State the specific assumptions made during fault tree construction. Justifications for the assumptions shall be included. 4. Summary of terminal events (system identifiers and descriptions as discussed in Section 6.3.4) 5. Identification of computer programs (if used); include Version Number and/or Version Date, and the source of the program (from whom obtained) 6. Input and output from the computer programs (if computer programs are used) 12. HOW FAULT TREES ARE USED Fault tree construction is not the end of a reliability analysis project. Fault trees, by themselves, do not provide much information about system performance or means of improving the system. But they are necessary for performing qualitative and/or quantitative fault tree analysis. These analyses are beyond the scope of this course. We provide in this section a brief outline of these analyses and what type of results can be obtained. Qualitative fault tree analysis: Qualitative fault tree analysis consists of one or more of the following: (i) determining the minimal cut sets, (ii) determining the minimal path sets, and (iii) qualitatively ranking the terminal events according to their importance. A combination of terminal events that is sufficient to cause the occurrence of the top event is called a cut set. In other words, if all the terminal events in a cut set occur (or are present), then the top event will also occur. The smallest subset of a cut set, that is sufficient and necessary to cause the
42
occurrence of the top event, is called a minimal cut set. For example, in case of the fault tree shown in Figure 2, the terminal events “Fuse fails closed” and “Short circuit in wiring” are sufficient and necessary to cause the occurrence of the top event (“Motor overheats”). There can be more than one minimal cut set for the top event. Combination of terminal event complements that is sufficient to assure that the top event does not occur is called a path set. If all the terminal event complements of a path set exist, then the top event cannot occur. The smallest subset of a path set that is sufficient and necessary to assure that the top event does not occur is called a minimal path set. There can be more than one path set for the top event. Minimal cut sets and minimal path sets are determined by examining the fault tree and complementary tree, respectively. Minimal cut sets are always determined in any qualitative fault tree analysis; minimal path sets may or may not be determined. Cut sets may be determined by visual inspection in case of very simple trees such as Figure 2. For example, (Fuse fails closed & Short circuit in wiring) is a minimal cut set because, as mentioned earlier in this section, these two terminal events are sufficient and necessary to cause the occurrence of the top event (Motor overheats). (Motor malfunction) as well as (Fuse fails closed & Power surge) are also minimal cut sets. Formal computer procedures are necessary for larger fault trees. Some trees could have hundreds of minimal cut sets and path sets. Qualitative importance ranking ranks terminal events according to their importance in contributing to the undesired event. This is an optional task in qualitative analysis. Quantitative fault tree analysis: Probability of occurrence of the top and/or intermediate events is computed during quantitative fault tree analysis. Probabilities of terminal events are required as data. Methods of quantitative analysis with or without minimal cut sets or path sets are available. So qualitative analysis is not a prerequisite. Computer software is necessary except for very simple trees. Quantitative importance ranking ranks terminal events according to their importance in contributing to the undesired event. This ranking is more accurate than qualitative ranking. This is an optional task in qualitative analysis.
43
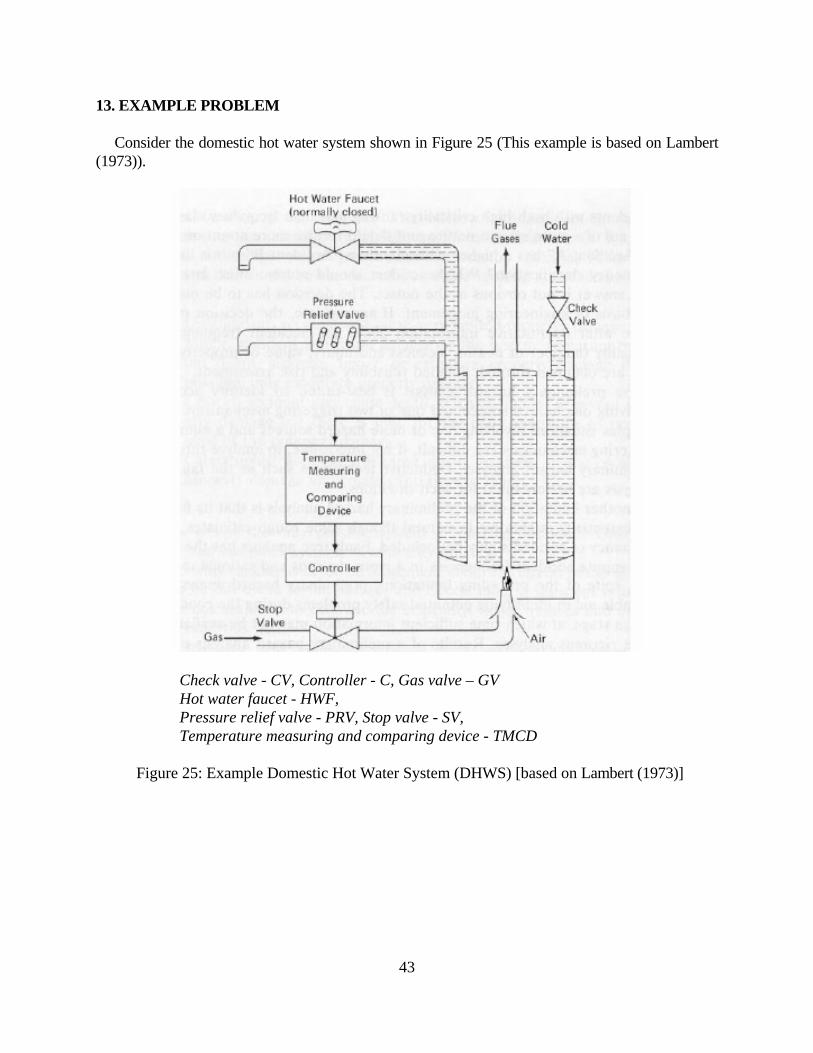
13. EXAMPLE PROBLEM Consider the domestic hot water system shown in Figure 25 (This example is based on Lambert (1973)).
Check valve - CV, Controller - C, Gas valve – GV Hot water faucet - HWF, Pressure relief valve - PRV, Stop valve - SV, Temperature measuring and comparing device - TMCD
Figure 25: Example Domestic Hot Water System (DHWS) [based on Lambert (1973)]
44
System Description: The domestic hot water system (DHWS) supplies hot water at a preset temperature range (say, from 130° F to 140° F) for household use. Water is heated by gas. When the water temperature is below a preset level (say, 130° F), the temperature measuring and comparing device (TMCD) sends a signal to the controller to open the stop valve (gas valve) and turn on the gas burner. The controller does so and water heats up. As soon as the water temperature reaches the preset upper level (say, 140° F), the TMCD sends a signal to the controller to close the stop valve and turn off the gas burner. The controller does so and water heating stops. Water starts cooling down and as soon as the water temperature reaches the preset lower level (say, 130° F), the TMCD signals the controller to open the stop valve and turn on the gas burner. This cycle is repeated again and again. The check valve in the cold water inlet prevents reverse flow due to overpressure in the hot water system. The pressure relief valve (PRV) is set to open when pressure in the hot water system exceeds 100 psi; that will relieve the pressure. Undesired Events: There are a number of possible undesired events associated with the hot water system; for example, “fire”, "hot water tank rupture", "gas-air explosion", "gas asphyxiation”, “carbon monoxide poisoning", “failure to supply hot water (supplied water is below expected temperature range)” and “water supplied at an excessive temperature (above the expected temperature range)”. We will construct a fault tree for the undesired event "hot water tank rupture" in this example. Components List and Failure Modes: Preparation of components list and failure modes may not be important and even unnecessary for relatively simple systems. However such a list would be very helpful for systems with several dozen of components. We have listed the components and their failure modes in Table 9. This table does not include components that are not relevant to the fault tree we are constructing. For example, hot water faucet and check valve are not included. Note that all the failure modes we have listed in Table 9 may not enter the fault tree we are constructing. For example, Failure mode #2 under component #4 (controller fails to open the stop valve even after TMCD signals to open the valve) does not enter our fault tree because this failure mode would not lead to the undesired event “hot water tank rupture”. However if one were to construct a fault tree for the undesired event “failure to supply hot water (supplied water is below expected temperature range)”, the above failure mode would be relevant and enter that fault tree. Some analysts list only those failure modes that are relevant to the fault tree under construction and that is acceptable.

45
Number Component Failure modes 1. Tank 1) Rupture
2) Leak 2. Pressure relief valve 1) Fails open
2) Fails closed 3. Temperature measuring and
comparing device (TMCD) 1) Fails to signal the controller even after temperature goes higher than boiling point of water 2) Fails to signal the controller even after temperature goes higher than the preset limit 3) Fails to signal the controller even after temperature goes below the preset limit
4. Controller 1) Controller fails to close the stop valve even after TMCD signals to close the valve 2) Controller fails to open the stop valve even after TMCD signals to open the valve
3) Controller closes the stop valve even though TMCD did not signal it to close the valve 4) Controller opens the stop valve even though TMCD did not signal it to open the valve
5. Stop valve (Gas valve) 1) Fails open 2) Fails closed
Table 9: Components and failure modes for the example problem (Domestic Hot Water System)
46
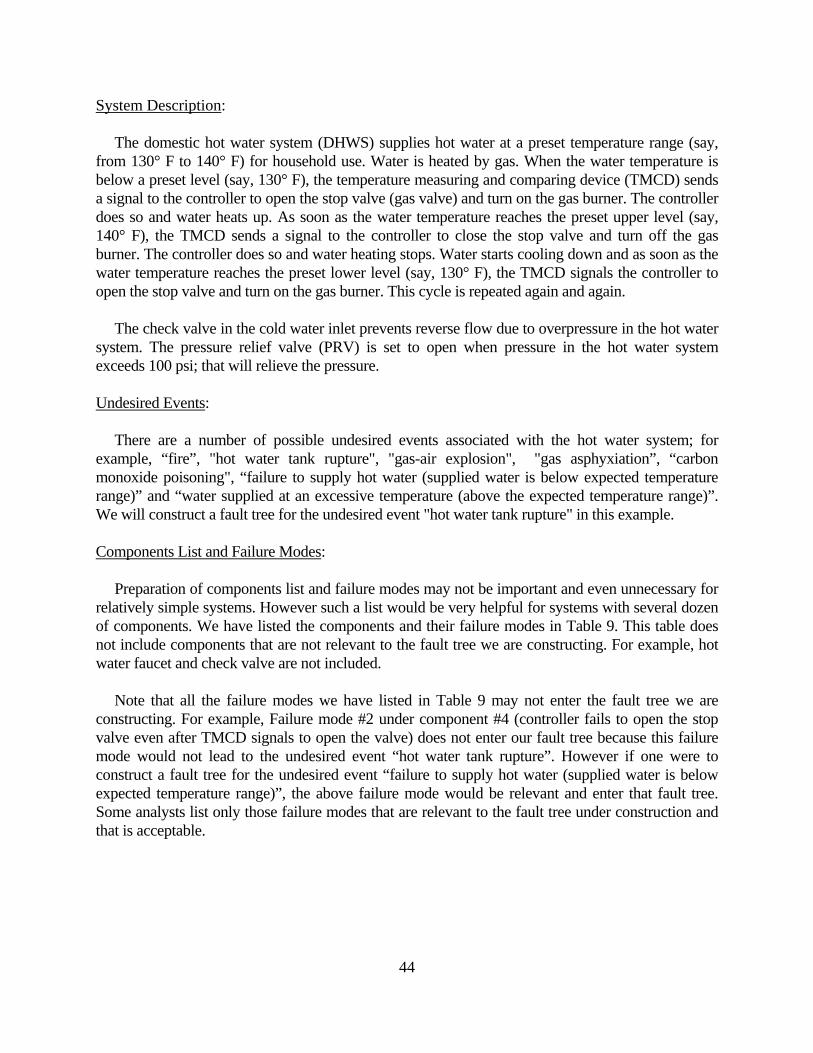
PF - Primary Failure, SF - Secondary Failure
Figure 26: Fault tree for “hot water tank rupture”
47
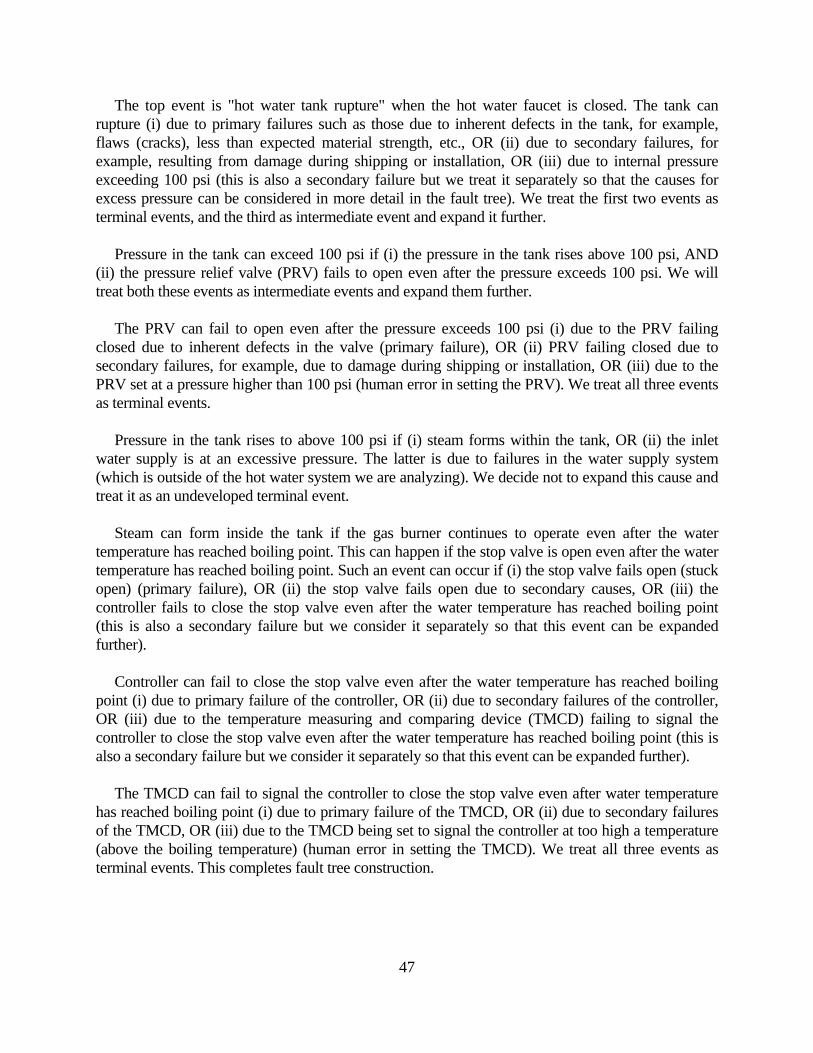
The top event is "hot water tank rupture" when the hot water faucet is closed. The tank can rupture (i) due to primary failures such as those due to inherent defects in the tank, for example, flaws (cracks), less than expected material strength, etc., OR (ii) due to secondary failures, for example, resulting from damage during shipping or installation, OR (iii) due to internal pressure exceeding 100 psi (this is also a secondary failure but we treat it separately so that the causes for excess pressure can be considered in more detail in the fault tree). We treat the first two events as terminal events, and the third as intermediate event and expand it further. Pressure in the tank can exceed 100 psi if (i) the pressure in the tank rises above 100 psi, AND (ii) the pressure relief valve (PRV) fails to open even after the pressure exceeds 100 psi. We will treat both these events as intermediate events and expand them further. The PRV can fail to open even after the pressure exceeds 100 psi (i) due to the PRV failing closed due to inherent defects in the valve (primary failure), OR (ii) PRV failing closed due to secondary failures, for example, due to damage during shipping or installation, OR (iii) due to the PRV set at a pressure higher than 100 psi (human error in setting the PRV). We treat all three events as terminal events. Pressure in the tank rises to above 100 psi if (i) steam forms within the tank, OR (ii) the inlet water supply is at an excessive pressure. The latter is due to failures in the water supply system (which is outside of the hot water system we are analyzing). We decide not to expand this cause and treat it as an undeveloped terminal event. Steam can form inside the tank if the gas burner continues to operate even after the water temperature has reached boiling point. This can happen if the stop valve is open even after the water temperature has reached boiling point. Such an event can occur if (i) the stop valve fails open (stuck open) (primary failure), OR (ii) the stop valve fails open due to secondary causes, OR (iii) the controller fails to close the stop valve even after the water temperature has reached boiling point (this is also a secondary failure but we consider it separately so that this event can be expanded further). Controller can fail to close the stop valve even after the water temperature has reached boiling point (i) due to primary failure of the controller, OR (ii) due to secondary failures of the controller, OR (iii) due to the temperature measuring and comparing device (TMCD) failing to signal the controller to close the stop valve even after the water temperature has reached boiling point (this is also a secondary failure but we consider it separately so that this event can be expanded further). The TMCD can fail to signal the controller to close the stop valve even after water temperature has reached boiling point (i) due to primary failure of the TMCD, OR (ii) due to secondary failures of the TMCD, OR (iii) due to the TMCD being set to signal the controller at too high a temperature (above the boiling temperature) (human error in setting the TMCD). We treat all three events as terminal events. This completes fault tree construction.
48
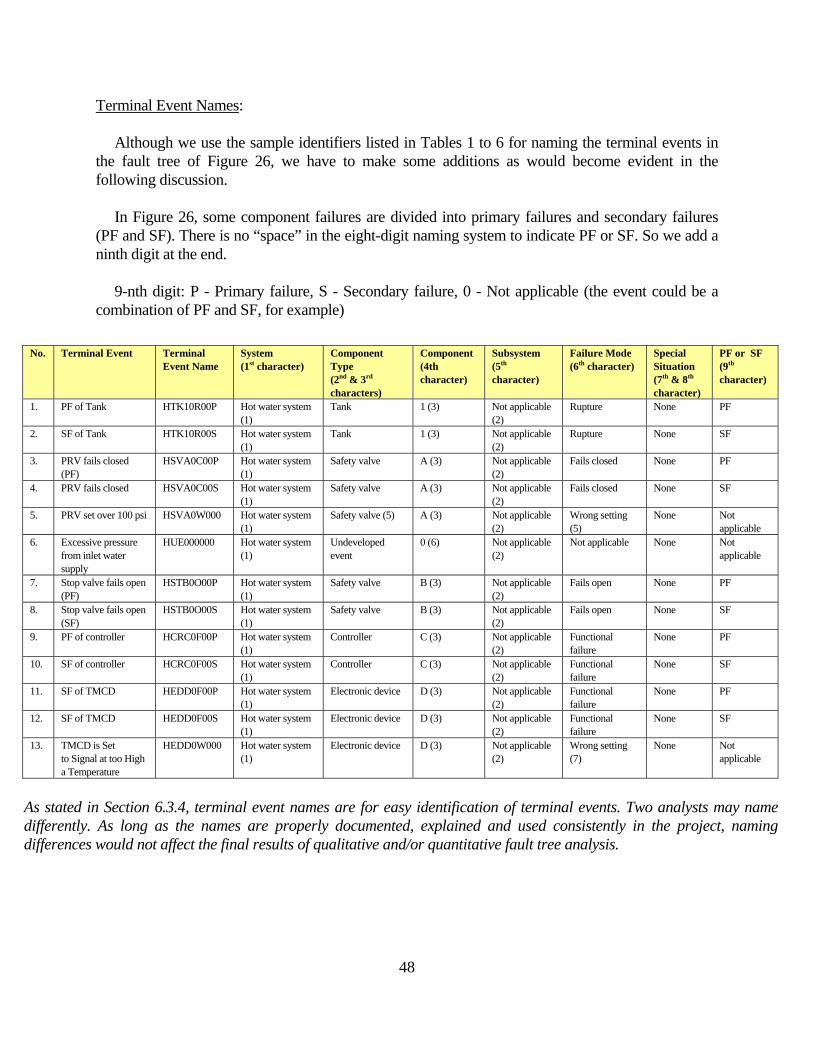
Terminal Event Names: Although we use the sample identifiers listed in Tables 1 to 6 for naming the terminal events in the fault tree of Figure 26, we have to make some additions as would become evident in the following discussion. In Figure 26, some component failures are divided into primary failures and secondary failures (PF and SF). There is no “space” in the eight-digit naming system to indicate PF or SF. So we add a ninth digit at the end. 9-nth digit: P - Primary failure, S - Secondary failure, 0 - Not applicable (the event could be a combination of PF and SF, for example)
No. Terminal Event Terminal Event Name
System (1st character)
Component Type (2nd & 3rd characters)
Component (4th character)
Subsystem (5th character)
Failure Mode (6th character)
Special Situation (7th & 8th character)
PF or SF (9th character)
1. PF of Tank HTK10R00P Hot water system (1)
Tank 1 (3) Not applicable (2)
Rupture None PF
2. SF of Tank HTK10R00S Hot water system (1)
Tank 1 (3) Not applicable (2)
Rupture None SF
3. PRV fails closed (PF)
HSVA0C00P Hot water system (1)
Safety valve A (3) Not applicable (2)
Fails closed None PF
4. PRV fails closed HSVA0C00S Hot water system (1)
Safety valve A (3) Not applicable (2)
Fails closed None SF
5. PRV set over 100 psi HSVA0W000 Hot water system (1)
Safety valve (5) A (3) Not applicable (2)
Wrong setting (5)
None Not applicable
6. Excessive pressure from inlet water supply
HUE000000 Hot water system (1)
Undeveloped event
0 (6) Not applicable (2)
Not applicable None Not applicable
7. Stop valve fails open (PF)
HSTB0O00P Hot water system (1)
Safety valve B (3) Not applicable (2)
Fails open None PF
8. Stop valve fails open (SF)
HSTB0O00S Hot water system (1)
Safety valve B (3) Not applicable (2)
Fails open None SF
9. PF of controller HCRC0F00P Hot water system (1)
Controller C (3) Not applicable (2)
Functional failure
None PF
10. SF of controller HCRC0F00S Hot water system (1)
Controller C (3) Not applicable (2)
Functional failure
None SF
11. SF of TMCD HEDD0F00P Hot water system (1)
Electronic device D (3) Not applicable (2)
Functional failure
None PF
12. SF of TMCD HEDD0F00S Hot water system (1)
Electronic device D (3) Not applicable (2)
Functional failure
None SF
13. TMCD is Set to Signal at too High a Temperature
HEDD0W000 Hot water system (1)
Electronic device D (3) Not applicable (2)
Wrong setting (7)
None Not applicable
As stated in Section 6.3.4, terminal event names are for easy identification of terminal events. Two analysts may name differently. As long as the names are properly documented, explained and used consistently in the project, naming differences would not affect the final results of qualitative and/or quantitative fault tree analysis.

49
Notes: (1) “Hot water system” is not listed in Table 1 of System Identifiers. So we introduce a new identifier H. This identifier should be consistently used in the project, and documented in the fault tree construction documentation so that co-analysts and future revisers and reviewers know it. (2) We have not divided the “Hot water system” into subsystems. So subsystem name is not available. (3) Arbitrarily assigned by analyst. (4) Some analysts may consider component type as “human error” per Table 2. We chose to use “safety valve”. Either is all right as long it is documented. Only change would be that the second and third digits would be HE instead of SV. This name change would not affect the final results of qualitative and/or quantitative fault tree analysis. (5) We assigned the identifier W for “wrong setting” (for example, of pressure or temperature limit). Some analysts may consider it as “fails closed”. (6) We choose to use identifier “0” because it is an external event (fault outside the hot water system) (7) We assigned the identifier W for “wrong setting (for example, of pressure or temperature limit)”.
Table 10: Table of Terminal Event Names used in the Fault Tree of Figure 26

50
APPENDIX 1: FAULTS AND FAILURES A fault is a non-compliance with specifications. For example, if the size of a bolt connecting a turbine casing to its base is less than or greater than the specified size (allowing for specified tolerances), it is a fault. If the yield strength of the material used in the fabrication of a pressure vessel is outside the specified values, it is a fault. Failure is the inability of a component to perform its intended function as specified. Examples of failure include a pump failing to pump water when required or a valve failing to close when required or a valve failing to open when required. However, a failure need not necessarily have to be a total functional failure. A component may function but if it does not function as specified, it may still be considered a failure. A pressure gauge may be measuring the pressure but if the measurement is not within the specified accuracy then it is still considered a failure. (NOTE: Sometimes the term "fault" is used to refer to some types of failures, and the term "failure" is used to refer to faults. Meaning of the terms "fault" and "failure" should be interpreted in the proper context.) REFERENCES Lambert, H. E. 1973. System Safety Analysis and Fault Tree Analysis. Report No. UCID-16238. Livermore: Lawrence Livermore National Laboratory. Nuclear Regulatory Commission. 1975. Reactor Safety Study: An Assessment of Accident Risks in U.S. Commercial Nuclear Power Plants (WASH-1400). Washington: Nuclear Regulatory Commission. Rumble, R. T., Leverenz, F. L., and Erdmann, R. C. 1975. Generalized Fault Tree Analysis for Reactor Safety. Report No. EPRI 217- 2-2. Palo Alto: Electric Power Research Institute. Sundararajan, C. 2008. Safety-Reliability-Risk Assessment: Failure Modes and Effects Analysis (FMEA). Course No. M-2058. Houston: PDHengineer.com. Sundararajan, C. 2008. Safety-Reliability-Risk Assessment: Preliminary Hazard Analysis (PHA). Course No. M-2057. Houston: PDHengineer.com.