Embed Size (px)
Citation preview
1
Family Firms, Accounting Conservatism, and Information Asymmetry: Evidence from Japan†‡
Keiichi Kubota, Chuo University and Musashi University
Hitoshi Takehara, Waseda University
April 14th, 2013
JEL Classifications: M40, M41, G12, M14
Keywords: Family Firms, Loss Recognition, PIN Variables, Order Imbalances
†The address for correspondence is Hitoshi Takehara, Graduate School of Finance, Accounting and Law, Waseda University. E-mail address: [email protected]. ‡This paper was presented at seminar at Institute of Economic and Finance, Chinese University of Hong Kong and the Sixth Japanese Association for Research in Disclosure Conference. The authors thank participants for useful comments, Kelly Chen, Joseph Fan, Zhoyang Gu, and Koji Ota among others. The paper is accepted for presentation at the International Family Enterprise Research Academy 2013 Conference and the authors acknowledge valuable comments from two anonymous referees. Authors also thank Isao Nakano for useful discussion. The authors acknowledge financial support from the Grant-in-Aid for Scientific Research ((A) 21243029) from the Ministry of Education, Culture, Sports, Science and Technology of Japan. All remaining errors are our own.
2
Family Firms, Accounting Conservatism, and Information Asymmetry:
Evidence from Japan
Abstract
This paper investigates accounting conservatism using a sample of family firms versus non-family firms
in Japan. If CEOs of family firms opt to disclose bad news early, they will adopt a more conservative
accounting reporting system. If shareholders and firm managers are more congruent and share similar
values and are concerned with minority shareholders, firm managers may choose to disclose bad news
early to face issues promptly and take necessary measures. Then, the quality of disclosure will be higher
and information asymmetry of stocks will be lower. If CEOs from founding families or hired executive
managers are under tight control of family management and have real authority, they may choose not to
disclose bad news to minority shareholders, and information asymmetry will be higher. We investigate
which of these two forces is dominant by investigating the relationship between income numbers,
realized stock returns, and information asymmetry measures, given shares held by founding families and
CEO either from founding families or not. The results reveal that family firms in Japan adopt a more
conservative accounting reporting system for earnings and extraordinary losses, while the degree of
information asymmetry of traded stocks remains higher. However, the shares held by founding families
do not have explanatory power. We find evidence that the resolution of information asymmetry leads to
conservative accounting choices by family firms.
3
1. Introduction
Claessens et al. (2000) investigated ownership structure among East Asian countries including Japan,
which is one of the most widely cited article among Asian family business research. They cover 1,240
listed firms in Japan (ibid, p.104) and point out that 13.1% of firms are controlled by families with a
10% shareholding cutoff level of founding families, and 9.7% of firms are controlled by families with a
20% cutoff level. More recently, Asaba (2012) investigated investment behavior of the electric
machinery industry in Japan. This sample of 184 family firms from 1995-2006 demonstrates more
aggressive investment behavior during the boom and more persistent investment behavior during the
recession than non-family firms. Saito (2008) finds that family firms slightly outperformed non-family
firms from 1990 through 1998, and their superiority was limited to the founders’ reign. Mehrotra et al.
(2012) investigated the succession problem of Japanese family businesses and demonstrated that adopted
heirs could avoid the succession problem. They studied Japanese firms between 1949 and 1970 and
followed the data up to 2000.
However, there are few studies on Japanese family firms from an accounting viewpoint. In this paper,
based on our originally constructed database which covers 2007 to 2009, we investigate accounting
conservatism and information asymmetry of those family firms. The quality of earnings of financial
reports reflects management decisions of reporting a firm’s financial performance to current investors
and other outside stakeholders. In this paper we focus on the so called accounting conservatism (Basu,
1995) and investigate financial reporting practices of family firms vis-à-vis non-family firms. The paper
investigates whether accounting conservatism on loss recognition is stronger among family than
non-family firms. At the same time we are also concerned whether information content of family firms
contained in financial reports is larger than that of non-family firms. For the former inquiry we use the
Basu measure (Basu, 1997) which is widely accepted in the empirical accounting literature, and for the
latter we use the probability of private information trades as devised by Easley et al. (2002), using tick
data.
We expect there will be less agency costs (Jensen and Meckling, 1976) arising for family firms
between firm managers and major family shareholders. In such a case managers may choose to disclose
bad news early in order to promptly face issues and try to find measures for improving future
performance. On the other hand, if a CEO from a family or an executive manager under the guardianship
4
of founding families possesses strong authority (Aghion and Tirole, 1997), they may choose not to
disclose bad information to minority shareholders. In such a case information asymmetry of traded
stocks will be higher.
We empirically investigate which of these two forces dominate in a family firm by empirically
assessing the relationship between reported income numbers, stock returns, and the PIN variable, a
measure of private information-based trades. We believe these are worthwhile empirical questions in
view of the fact that there is no study investigating accounting conservatism of Japanese family firms.
Based on previous evidence about the usefulness of using the PIN variable (Easley et al., 2002) for
Japanese data (Kubota and Takehara, 2009), we hope to detect the aspect of information asymmetry in
relation to accounting conservatism (LaFond and Watts, 2010). In addition, we employ alternative
microstructure measures as proxy variables denoting for bad news. Bagnoli and Watts (2005, p. 787)
emphasize the role of managers’ tenure versus the degree of private information owned by management
in the context of accounting conservatism. These two aspects can be directly applied to family business
context and in our test we can detect the degree of disclosure of management’s private information. Our
use of a microstructure variable to detect degrees of private information for Japanese family firm data is
a contribution to the literature.
Section 2 motivates the study and Section 3 describes previous studies. Section 4 raises the
hypotheses. Section 5 describes the data and Section 6 reports empirical results. Section 7 concludes.
2. Motivation
Earnings quality is one of the major properties accounting reports ought to possess (Ronen and Yarri,
2008, and Francis et al. 2006). Under the GAAP of countries like the U.S. (FASB, 2010) and Japan
(ASBJ, 2006), fair representations of financial reports are expected. Also, international accounting
standards of IFRS (2012) view that conservatism harms faithful representation and lacks neutrality.
Note, however, that Japanese accounting standards (Accounting Standards Board, 1982) and U.S.
accounting standards (FASB, 1982 and 2004) still advocate the use of lower-or-cost method in practice.
Thus, even though most recent accounting standards try to eliminate the concept of conservatism per se,
accounting practices of conservative income measurement still seem to be implemented, at least in Japan
and the U.S.
5
In accounting literature Hendriksen and van Breda (1992) also criticizes accounting conservatism as
constraints of accounting measurement from the three points; i.e., 1) pessimism may lead to poor
decision making, 2) accountants are not necessarily in a better position to evaluate risk, and 3)
unfavorable items reported may turn out to be wrong. Ijiri and Nakano (1989) synthesize the reasoning
behind the existence of accounting conservatism by focusing on two points; i. e., 1) conservatism leads
to more objective measurement of past cash flows, and 2) conservatism leads to a disclosure of unusual
events quickly and usual events more slowly which may have higher informational value. In this paper
we will not argue the pros and cons of accounting conservatism per se and empirically trace the nature
accounting disclosure decisions by family firms in Japan and refrain from making any normative
statements.
As to the evidence on earnings quality in general, Ali et al. (2007) finds for their sample of U.S.
companies that reported earnings by family firms are of better quality measured by the level of
discretionary disclosure. Wang (2006) also finds that earnings quality is higher for family than
non-family firms using U.S. data. For Japanese data, Chung et al. (2004) investigates the relationship
between level of accruals and ownership structure, but does not focus on family ownership. Ebihara et al.
(2012) investigates the accruals quality of Japanese family firms and find that the quality of earnings is
higher for family than non-family firms.
However, these studies have yet investigated accounting conservatism for public family firm
samples.1 If these firms are indeed long-term oriented (Miller and Le Breton-Miller, 2005, Boyd, 2010),
and can face immediate losses for the benefit of future improvement and sustainability, we expect them
to deal with incurred losses and bad news earlier than non-family firms. Managers in family firms may
try to inform pertinent stakeholders including minority holders, which is an empirical question to be
answered.2
Family firms are expected to have longer horizon because the founding family are concerned with 1 Salvato and Moores (2010) conduct an extensive survey of accounting research in the context of family firms. Still, we find the research on accounting conservatism applied to family firms is sparse except Ball and Shivakumar (2005). 2 In addition, recently the role of the third party, the auditor, has been emphasized because of more stringent regulations like Sarbanes-Oxley in 2002 and the 2006 Japanese version of SOX. Basu (1995, Appendix) points out this aspect is important and Antle and Nalebuff (1991) analyzed the role of auditors in forming accounting conservatism by using contract theory model.

6
longevity of firm and conservatism may apply to family firms. As we discussed in Introduction, we
expect there will be less agency costs (Jensen and Meckling, 1976) arising for family firms between firm
managers and major family shareholders. In such a case managers may choose to disclose bad news
early in order to promptly face issues and try to find measures for improving future performance. On the
other hand, if a CEO from a family or an executive manager under the guardianship of founding families
possesses strong authority (Aghion and Tirole, 1997), they may choose not to disclose bad information
to minority shareholders. Moreover, in such a case information asymmetry of traded stocks will be
higher.
Hence, we expand our research motivation as follows. First, we empirically investigate which of
these two forces dominate family firms. For that purpose we establish the hypothesis H1 in Section 3 to
empirically assess which is true for listed family firms in Japan. As previous evidence, for example, Al
et al. (2007) report that family firms are more likely to warn for a given magnitude of bad news using the
earnings forecast release. They interpret the latter point as the evidence of less severe agency problems,
leading less opportunistic behavior on withholding bade earnings forecast news. On the other hand, for
the sample of private firms in U.K. Ball and Shivakumar (2005) find that financial reporting by private
firms in U.K. is of lower quality using the variant of Basu (1997) measure using the accounting accruals
measures. Because private firms are expected to be more family type firms, their finding against
accounting conservatism of private firms is evidence that the family firms may show lower accounting
conservatism U.K.
Moreover, LaFond and Roychowdhurry (2008) argue that when the managerial ownership in general
is negatively related to accounting conservatism. In our contest the family firms with larger shareholding
and CEO coming from the founding family (defined Type 1 in Section 5) belongs to this category.
However, in our paper we argue instead the opposite the reason being that our sample is listed firms and
firm managers have to take into consideration the continued listing of their stocks and establish H2
below.
In sum, the argument in previous studies seems to suggest either that family firms show higher
accounting conservatism because the firms are with less agency problems, or that family firms are rather
less concerned with disclosing bad news to the non-family stockholders. For the first argument, we
established the hypothesis H1 to be tested and for the second point we established the hypothesis H2

7
because our sample is all listed firms on the Tokyo Stock Exchange and we argue that these firms have
to keep satisfying the stringent listing requirement for their stock to be kept listed. This contrasts with
the argument and evidence of Ball and Shivakumar (2005) for private firms.
As for the evidence between accounting conservatism and microstructure variables, in general,
LaFond and Watts (2008) find positive association between PIN measures (Easley et al., 2002) and
accounting conservatism for U.S. firms claiming that the conservatism adopted by firms is response to
the information asymmetry of their traded stocks. Thus, they rather take position against the recent
movement by FASB to eliminate accounting conservatism as necessary attributes accounting reports
should possess.
However, note that the PIN measure they use is the information asymmetry measured through
investors’ ordering behavior and not necessarily between the family stockholder who will not sell their
stocks and minority stockholders. 3 Thus, in our test of conservatism using the PIN variable, we include
this variable in addition to the basic conservatism testing equations as a control variable. Moreover,
among the variables to constitute the PIN we also use the probability of bad news occurrences in Easley
et al. (2002) to distinguish between the information asymmetry and the bad news in the stock per se.
Thus, in this paper we establish the final hypothesis H3 arguing that firms try to adopt conservative
reporting, in particular bad news, for the sake of minority shareholders and outside lenders, who may not
have direct access to the private information held by the founding family and their management in
addition to the accounting format required by the corporate law and the regulation by the stock
exchange.
A priori we expect there will be higher concentrations of family firm stocks leading to a lower
proportion of traded floating stocks which may affect the degree of public and private information
contained in those family stocks. We believe answering to this question, that is, how much private
information (Bagnoli and Watts, 2005) is disseminated among family firm stocks relative to public
information is an important one in its own context. Conservative accounting reporting practices may
attenuate this information asymmetry problem, or create opportunity cost if the bad information turned
out to be wrong.
3 Whether asymmetry affects the cost of equity depends on the degree of competitiveness of the stock traded (Lambert et al., 2012). When a family owns substantial stocks and thus floating stock is not large, the degree of market competition will be lower and the cost of equity will be higher.
8
Finally, in order to test the degree of family firm accounting conservatism of financial reports, we use
one of the conservatism measures used by Basu (1995).4 His study is the first one which empirically
tested the old notion of accounting conservatism in an empirical context using stock return data. Khan
and Watts (2009) extended the original measure by Basu (1997) and they created the so-called C_Score
to measure the degree of accounting conservatism. They find this measure can predict future
conservatism of firms, and higher firm specific uncertainty and information asymmetry are related with
higher accounting conservatism with longer investment cycles. In our study, we confine ourselves to the
original Basu regression specifications, but at the same time extend it to accommodate the degree of
information asymmetry related to bad news. As far as the authors are aware, Anderson et al. (2009) is the
only study which investigated the measures of information asymmetry for a family firm sample in the
U.S. They investigate firm opacity and find that stocks of heir-controlled firms have higher bid-ask
spreads than founder-controlled family firms or non-family diffuse shareholder firms. However, they
only used bid-ask spread data, not the tick-based PIN measure which we use here. Furthermore,
Anderson et al. (2012) report that stocks of family-controlled firms experience higher abnormal short
sales, suggesting the existence of more privately informed trades for U.S. family firms. This result is
relevant for our study to construct our original hypotheses as well as testing models.
To empirically test these assertions, we use a multivariate testing equation using Japanese data in the
followings. In the next section we establish our hypotheses first.
3. Hypotheses
Because we expect the two forces on agency costs and the level of disclosure discussed above may
work simultaneously the other way, we state three hypotheses below. The first two are related to the first
query of family firms, in which H1 is more operational and H2 is related to the fraction of shares held by
founding families versus minority shareholders because our sample is all listed firms whose stocks are
widely traded on stock exchanges in Japan. The third hypothesis is then related to information
asymmetry of stocks and the argument would not be particularly confined to the family firm sample.
4 We report the results where the earning numbers are denominated by the beginning of the period total assets, whose results appear in Basu (1995) after tables 11.See also Basu (1995, Appendix) for a review of the origin and development of the conservatism concept in the U.K. and the U.S. Pope and Walker (1999) compare the conservatism between U.K. and U.S.
9
H1: Family firms adopt more conservative accounting reporting than non-family firms because firms
are with less agency costs.
H2: The fraction of shares held by founding families causes an increase in accounting conservatism as
family owners of listed firms become more concerned with disclosure to minority shareholders to keep
their stocks listed.
H3: The larger the information asymmetry of firm stocks, the higher the accounting conservatism as
firms try to help reduce the degree of information asymmetry for stock market participants.
Given these three hypotheses we use the sample of Japanese family firms listed on stock exchanges in
Japan and conduct cross section regression tests in Section 6.
4. Testing Equations and Variables Used
Using the Basu (1997) measure as our benchmark we extend this model to incorporate bad news using
the PIN from Easley et al. (2002) as well as other proxy variables. The PIN model is described below
and detail is shown in Appendix 1. Equation (1) is tested and definitions of the variables are as
follows: Xit is an earnings number denominated by the beginning March end book value of total assets,
TAi,t-1,5 DRit is a dummy variable, which takes the value 1 if the stock return Rit is negative, FFOit is the
percentage of shares owned by the founding family, PINit is the probability of private information-based
trades as devised by Easley et al. (2002), ikDSector is the sector dummy variable, where sector
classification schemes are based on Kubota and Takehara (2007) as listed in Appendix 2, itDYear is a
yearly dummy variable, and .it is the error term.6
5 We only use the firm sample with a March 31 fiscal year end, which comprises 90% of the total sample. Given the timed release of accounting reports, approximately three months after the fiscal year end, we compute annual returns and the annual PIN value starting from 9 months before the fiscal year end (July 1). 6 We used the beginning book value of the total assets as a divisor for the dependent variable, unlike in Basu (1995 and 1997) where he uses the stock price. One of the reasons is that Patatoukas and Thomas (2009, 2010) point out the empirical irregularities triggered by the relationship between EPR and stock returns irrespective of the existence of accounting conservatism. We also detect possible simultaneity problems
10
.
6
2
2008
20073
210101
)(
)()( /
itk t
itikititit
ititititititititit
DYearDSectorPINDRR
FFODRRDRRRDRTAX
(1)
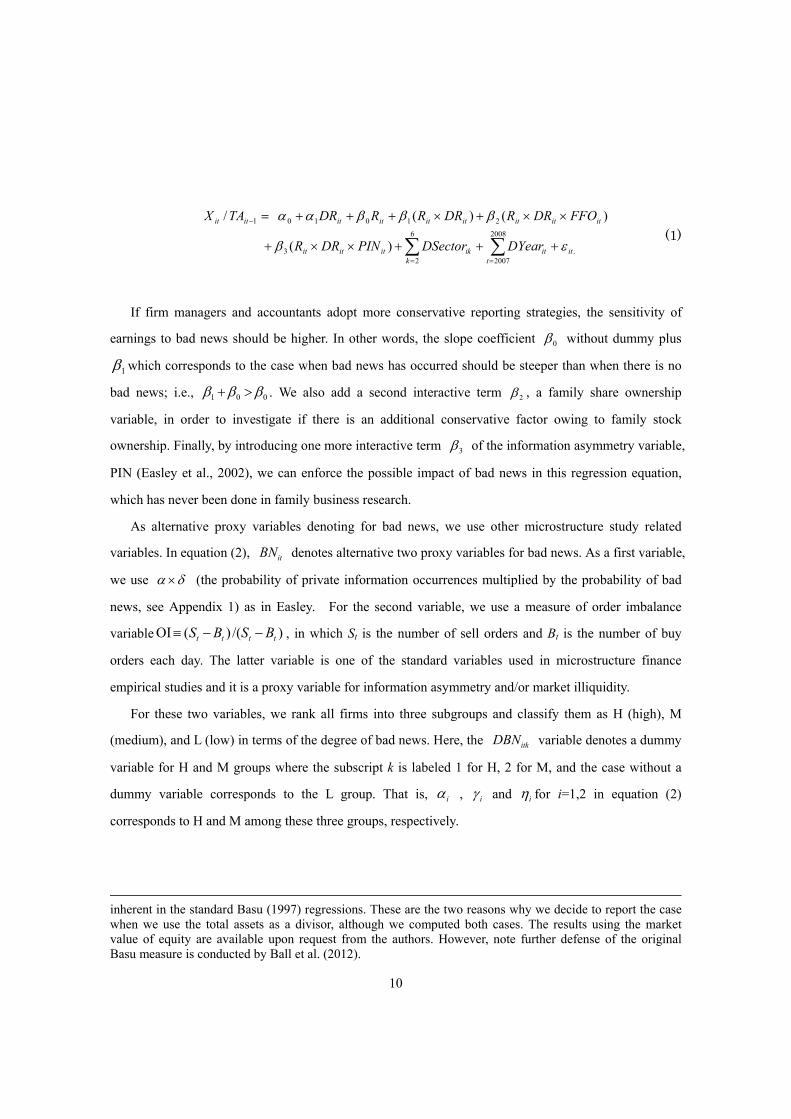
If firm managers and accountants adopt more conservative reporting strategies, the sensitivity of
earnings to bad news should be higher. In other words, the slope coefficient 0 without dummy plus
1 which corresponds to the case when bad news has occurred should be steeper than when there is no
bad news; i.e., 001 . We also add a second interactive term 2 , a family share ownership
variable, in order to investigate if there is an additional conservative factor owing to family stock
ownership. Finally, by introducing one more interactive term 3 of the information asymmetry variable,
PIN (Easley et al., 2002), we can enforce the possible impact of bad news in this regression equation,
which has never been done in family business research.
As alternative proxy variables denoting for bad news, we use other microstructure study related
variables. In equation (2), itBN denotes alternative two proxy variables for bad news. As a first variable,
we use (the probability of private information occurrences multiplied by the probability of bad
news, see Appendix 1) as in Easley. For the second variable, we use a measure of order imbalance
variable )/()(OI tttt BSBS , in which St is the number of sell orders and Bt is the number of buy
orders each day. The latter variable is one of the standard variables used in microstructure finance
empirical studies and it is a proxy variable for information asymmetry and/or market illiquidity.
For these two variables, we rank all firms into three subgroups and classify them as H (high), M
(medium), and L (low) in terms of the degree of bad news. Here, the itkDBN variable denotes a dummy
variable for H and M groups where the subscript k is labeled 1 for H, 2 for M, and the case without a
dummy variable corresponds to the L group. That is, i , i and i for i=1,2 in equation (2)
corresponds to H and M among these three groups, respectively.
inherent in the standard Basu (1997) regressions. These are the two reasons why we decide to report the case when we use the total assets as a divisor, although we computed both cases. The results using the market value of equity are available upon request from the authors. However, note further defense of the original Basu measure is conducted by Ball et al. (2012).
11
.
6
2
2008
2007
2
1
2
1
2
1101
)(
)()( /
itk t
itikk
ititkiti
kititkiti
kitkitiititit
DYearDSectorPINDBNBN
FFODBNBNDBNBNBNTAX
(2)
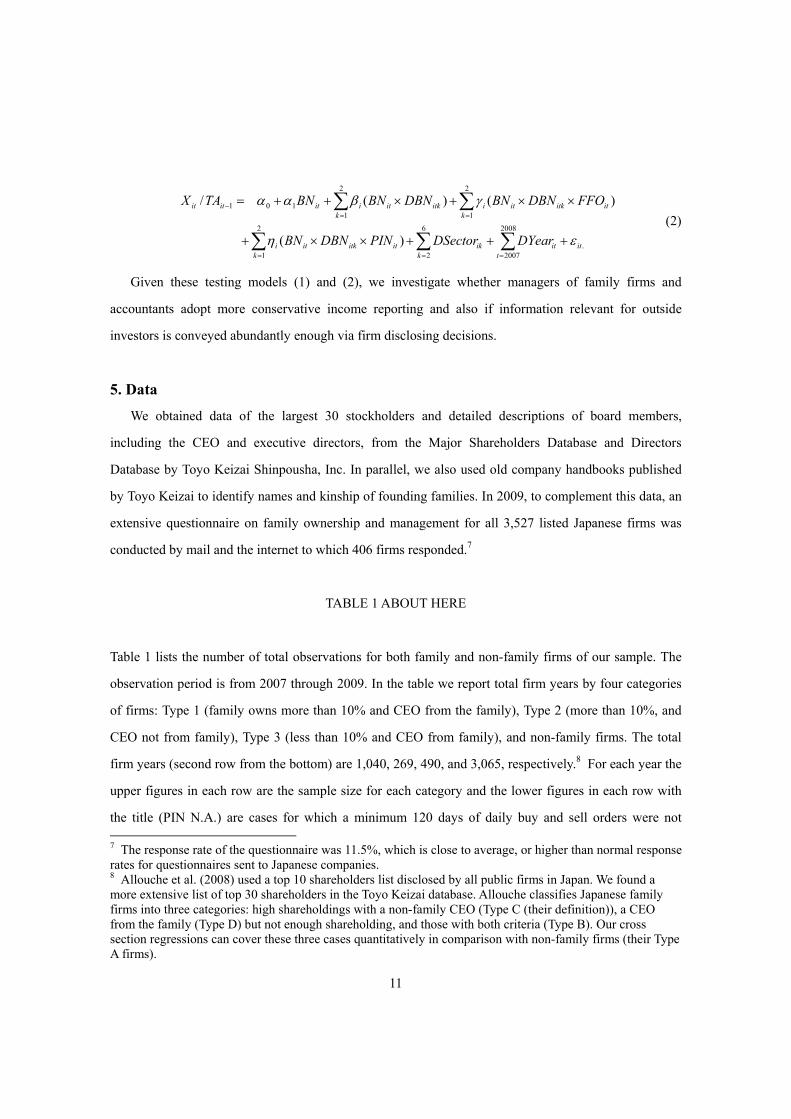
Given these testing models (1) and (2), we investigate whether managers of family firms and
accountants adopt more conservative income reporting and also if information relevant for outside
investors is conveyed abundantly enough via firm disclosing decisions.
5. Data
We obtained data of the largest 30 stockholders and detailed descriptions of board members,
including the CEO and executive directors, from the Major Shareholders Database and Directors
Database by Toyo Keizai Shinpousha, Inc. In parallel, we also used old company handbooks published
by Toyo Keizai to identify names and kinship of founding families. In 2009, to complement this data, an
extensive questionnaire on family ownership and management for all 3,527 listed Japanese firms was
conducted by mail and the internet to which 406 firms responded.7
TABLE 1 ABOUT HERE
Table 1 lists the number of total observations for both family and non-family firms of our sample. The
observation period is from 2007 through 2009. In the table we report total firm years by four categories
of firms: Type 1 (family owns more than 10% and CEO from the family), Type 2 (more than 10%, and
CEO not from family), Type 3 (less than 10% and CEO from family), and non-family firms. The total
firm years (second row from the bottom) are 1,040, 269, 490, and 3,065, respectively.8 For each year the
upper figures in each row are the sample size for each category and the lower figures in each row with
the title (PIN N.A.) are cases for which a minimum 120 days of daily buy and sell orders were not 7 The response rate of the questionnaire was 11.5%, which is close to average, or higher than normal response rates for questionnaires sent to Japanese companies. 8 Allouche et al. (2008) used a top 10 shareholders list disclosed by all public firms in Japan. We found a more extensive list of top 30 shareholders in the Toyo Keizai database. Allouche classifies Japanese family firms into three categories: high shareholdings with a non-family CEO (Type C (their definition)), a CEO from the family (Type D) but not enough shareholding, and those with both criteria (Type B). Our cross section regressions can cover these three cases quantitatively in comparison with non-family firms (their Type A firms).
12
available to compute PIN and not included in the sample.
We find 36.99% of the total firm-years of our sample classified as family firms of either Type 1, 2, or
3. Overall, we have 1,799 total firm-years of family firms and 3,065 total firm-years of non-family firms.
For financial data, the source is Nikkei Media Marketing. The data to compute stock returns and
tick-by-tick quote and transaction data necessary to estimate the PIN are also provided by Nikkei Media
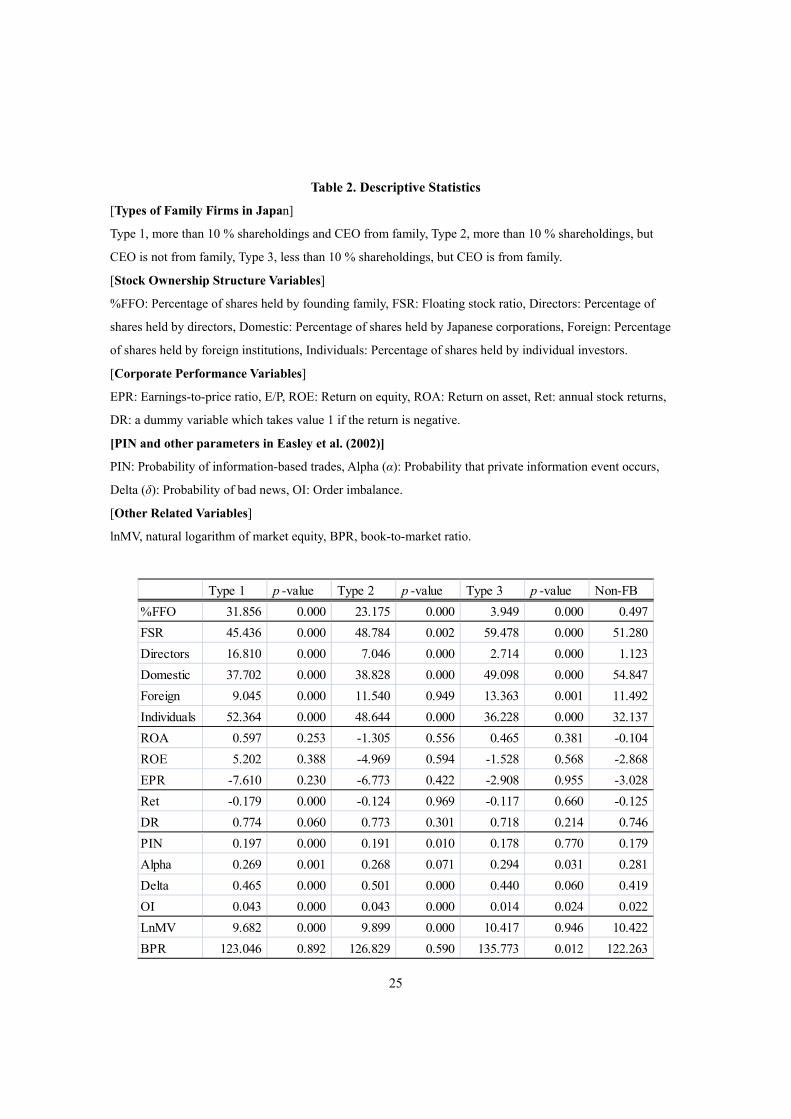
Marketing. Table 2 reports basic descriptive statistics of relevant variables.
TABLE 2 ABOUT HERE
Definitions of variables in Table 2 are as follows. %FFO is the percentage of shares held by the
founding family, FSR is the floating stock ratio, Directors, the shares held by directors, Domestic, shares
held by Japanese corporations, Foreign, shares held by foreign institutions, and Individuals, shares held
by individual investors. EPR is the earnings-to-price ratio, ROE is return on equity, ROA is return on
total assets, PIN is the probability of information-based trades, Alpha (α) is the probability that a private
information event occurs, Delta (δ) is the probability of bad news, OI is order imbalance defined above,
lnMV is a natural logarithm of market value of equity (in million yen), and BPR is the book-to-market
ratio in percent.
From the table we find the shares owned by directors and individuals is higher for family firms
while the floating stock ratio (FSR) is lower. The p-values denote the significance of the mean difference
of three types of family versus non-family firms, and we find that differences are all significant for these
two variables. We also find for family firms shares are owned more by individuals, domestic investors,
and individual investors.
As for earnings, family firms demonstrate lower earnings (EPR) and lower return on equity (ROE),
but higher return on assets (ROA), though these are not significant. The stock returns (Ret) for Type 1
firms are the lowest and for Type 3 firms the highest. Because our sampling period includes the period
after the 2008 financial crisis, we find all returns are negative. The mean values for the dummy variable
for negative return (DR) thus take values of larger than 0.5. For microstructure variables, we find the
probability of private information-based trade (PIN), the probability that a private information event
occurred (Alpha), the probability of bad news (Delta), and order imbalance (OI), are higher for family
13
firms and the differences are significant. Finally, we find that Type 1 and 2 family firms are significantly
smaller in size (9.682 and 9.899), but book-to-price ratios (a measure of value stocks) are not
significantly different between the three types of family and non-family firms.
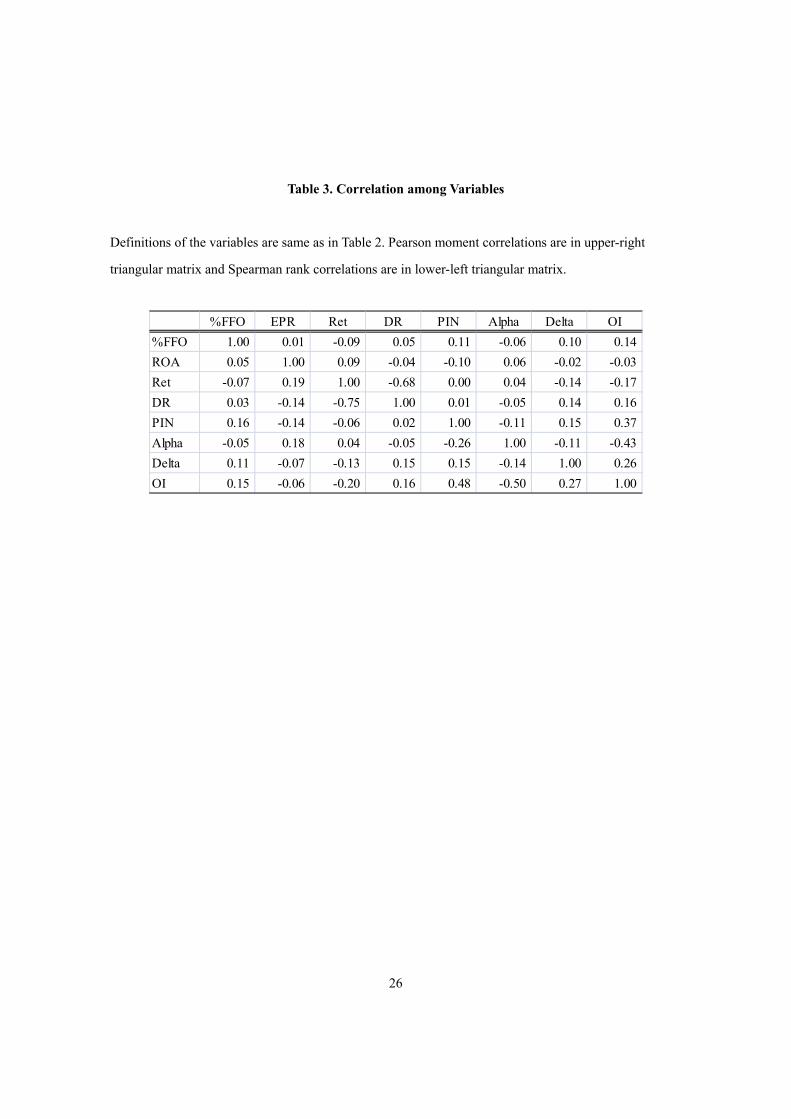
In Table 3 we report the correlation of the selected variable of our interest.
TABLE 3 ABOUT HERE
We find that the correlation between the previous year’s return (Ret) and the probability of bad news
(Delta) as well as order imbalance (OI) are negatively correlated with -0.13 and -0.20, respectively, with
Spearman rank correlations, which confirms our initial contention that alternative proxy variables we use
for bad news and OI as substitutes for negative returns by Basu (2007) are considered to be good
variables to represent bad news. We also confirm that the percentage of shares held by founding families
(%FFO) and PIN and OI are positively correlated at 0.16 and 0.15, which confirms that family firm
stocks possess higher probability of private information-based trades. Note also PIN and OI are highly
correlated at 0.48.
6. Empirical Results
Table 4 reports results from cross section regressions. The dependent variable is the net income
divided by total assets for Panel A, extraordinary income for Panel B, and extraordinary loss for Panel C.
The latter two variables are also denominated by the beginning book value of total assets.
TABLE 4 ABOUT HERE
In each panel, results are presented separately for Type 1 firms (Panel A), Type 2 (Panel B), Type 3
(Panel C) (see Section 5 for definitions), and non-family firms (Panel D) from the top to bottom rows in
each panel. The estimated models are the three variable case like Basu’s (1997) original model.
For net income shown in Panel A we find that the coefficient for additional conservatism, Dr*Ret, is
all positive. Estimated slope coefficients for conservative income measurement, )( 10 in equation
(1), responding to negative returns, are, from the top to bottom row of this panel, 0.133 (=0.016+0.117,
14
and so forth) for Type 1, 0.128 for Type 2, 0. 094 for Type 3, and 0.077 for non-family firms. Thus we
find the degrees (slope coefficients) of the loss recognition from adverse income are stronger (steeper)
for family firms (Basu, 1997, Figure 2). Moreover, accounting conservatism is stronger for family firms
in descending order for Type 1, 2, and 3 firms. If we highlight the relative size of coefficients on
negative and positive returns, 010 /)( , the numbers from the top to bottom panel are 8.31
(=(0.016+0.117)/0.016, and so forth),12,8, 94.00, and 5.90, respectively. We again find that family
firms are more conservative than non-family firms. These results support H1.
In the case of extraordinary income shown in Panel B, the results are mixed and we find coefficients
for Dr*Ret are even negative for some cases though not significant.9 Note the recognition of this
account is non-recurring in nature (Hendriksen, 1970, Ch. 5) and we infer that managers of family firms
are not as concerned with recognizing extraordinary income early.
In the case of extraordinary losses, sign conditions should be opposite because we measure losses as
positive numbers and find that coefficients for Dr*Ret are indeed negative and even significant for all
family firms. The values for )( 10 are -0.041 (=-0.003+0.08, and so forth) for Type 1, -0.044 for
Type 2, -0.023 for Type 3, and 0.002 for non-family firms. The most conservative is Type 2 firms. We
find that family firms overall recognize extraordinary losses earlier, which supports H1. Because this is
also non-recurring in nature (ibid.), we believe this is an important finding on financial reporting
practices among Japanese family firms. The lesson is that not only should we focus primarily on net
income, but should also pay close attention to reporting of extraordinary loss items (Shrand and Walther,
2000).
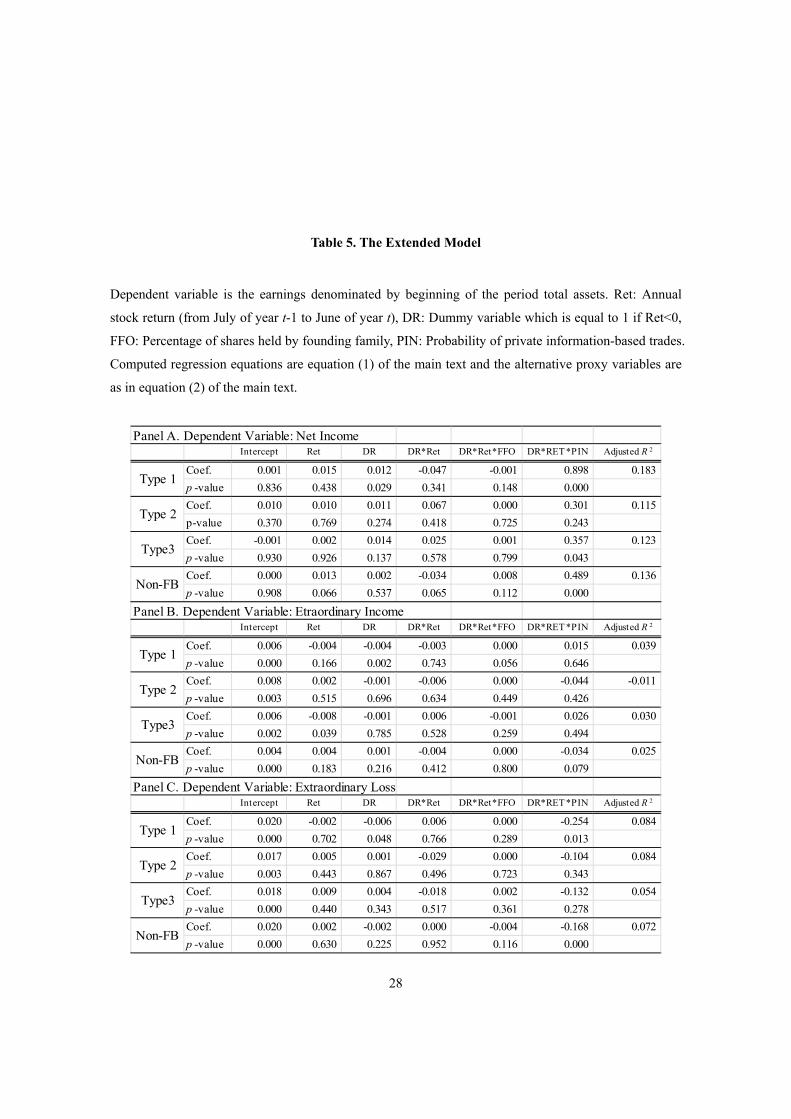
TABLE 5 ABOUT HERE
In Table 5 we add two dummy variables as shown in equation (1). These are shares owned by the
founding family, whose coefficient is 2 , as well as a microstructure variable PIN, whose coefficient is
3 in equation (1). In this case we find the original additional conservatism coefficients 1 from
negative returns become insignificant for all panels for earnings, extraordinary income, and
9 Pope and Walker (1999) find the extraordinary items play significant role to explain the degrees of conservatism among U.K. firms.
15
extraordinary losses.
In the case of net income, 2 coefficients (the coefficient on ititit FFODRR ) which denote the
effect of family shareholdings is close to zero and not significant. Thus, the effect of shareholding is nil,
and we do not support H2. However, we find the 3 coefficients (the coefficient on ititit PINDRR ),
which denote the reaction to a degree of private information trade, PIN, become all positive, and for
Type 1 and 3 firms they are even significant. The coefficient 3 is the largest for Type 1 firms. This
type of firm is one in which shares are owned by a family more than 10% and the CEO is from the
founding family. This result contrasts with argument and evidence by LaFond and Roychowdhurry
(2008) we support H3. Our result implies that whenever the PIN is higher and information asymmetry is
serious, managers and accountants tend to adopt a more conservative accounting strategy to attenuate the
information asymmetry problem, which is consistent with the findings by LaFond and Watts (2010) for
U.S. firms.
However, the explanatory power of the other variable, family-owned shares, is marginal and the
coefficients 2 are all small. Thus, overall we support H3, but not H2 for the case of earnings in Panel
A.
As for extraordinary income, the results are again not strong and it seems that managers and
accountants of family firms care less about recognizing extraordinary income early. For extraordinary
losses we find all 3 coefficients (the coefficient on ititit PINDRR )for the PIN are negative as
predicted and significant for Type 1 firms and non-family firms, where the absolute value of the
coefficients are larger for Type 1 family firms. Thus, for extraordinary losses we find that family firms of
Type 1 are more concerned with information asymmetry and this result supports H3. Again, we find
coefficients for the family-owned shares dummy is very small and we do not support H2.
In interpreting our result we note Ball and Shivakumar (2005) report for U.K. private firms that their
finding is opposite to ours in the sense that the family firms show less conservatism in their accounting
disclosure. However, our sample is limited to listed firms, in which firm managers and accountants have
to take into consideration the quality of disclosure, in particular, to minority shareholders so that the
firms remain listed on stock exchanges as we laid out in H2, and we infer that this may be the reason
why our sample family firms showed more conservatism. Also, because firm owners may be concerned
more with the long term sustainability of their firms and family reputations, they may want to reveal the

16
bad news such as extraordinary losses as fast as possible to show outside investors that the correcting
measures will be taken up soon.
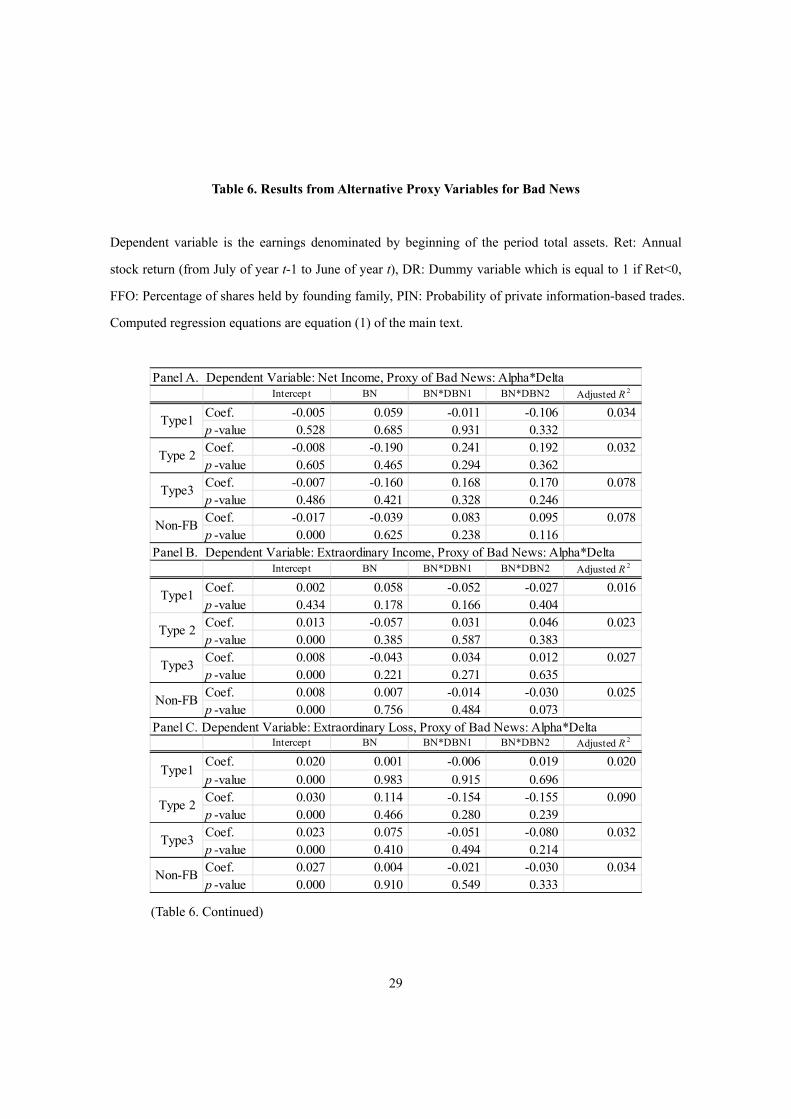
Table 6 reports the results for which alternative proxy variables were used instead of the negative
return variable by Basu (1997) as a signal to denote bad news. The specification of the three variable
model is similar to the original testing equation by Basu (1995 and 1997), although our variables are
composed of two dummy variables as shown in equation (2). Note in equation (2) as for the subscripts
i=1 corresponds to the highest bad news, i=2 medium, and i=0 the least. Thus, 1 signifies the slope
coefficient for the worst news, 2 for the medium and 1 for the least bad news.
TABLE 6 ABOUT HERE
From Panel A to C are cases where Alpha*Delta (see equation (2) is used and from D to E, cases
where order imbalance is used. If accounting conservatism holds, 11211 should hold
for income numbers and 11211 should hold for losses. In Panel A, positive coefficients
for the H group of Type 2 firms at 0.241( 1 ) is higher than for the M group at 0.192 ( 2 ), which
supports accounting conservatism of family firms, though it is not significant. This is the type of firm
whose family stock holdings are higher than 10%, but the CEO is not from the family. It may be the case
that professional managers are concerned with keeping their positions and when bad news arises
(Alpha*Delta), they recognize losses promptly so their reputation will recover by targeting for higher
income in the next period, and hope investors’ memories are short-lived (Shrand and Walther, 2000). In
Panel B and C results for extraordinary income and losses are weak.
Results using order imbalance in Panel D, E, and F are also weak, and even the signs are sometimes
wrong. Thus, we do not conclude from Panel D, E, and F. Overall, from results in Panel A we support
H1 for Type 2 firms when we use Alpha*Delta as a proxy for bad news.
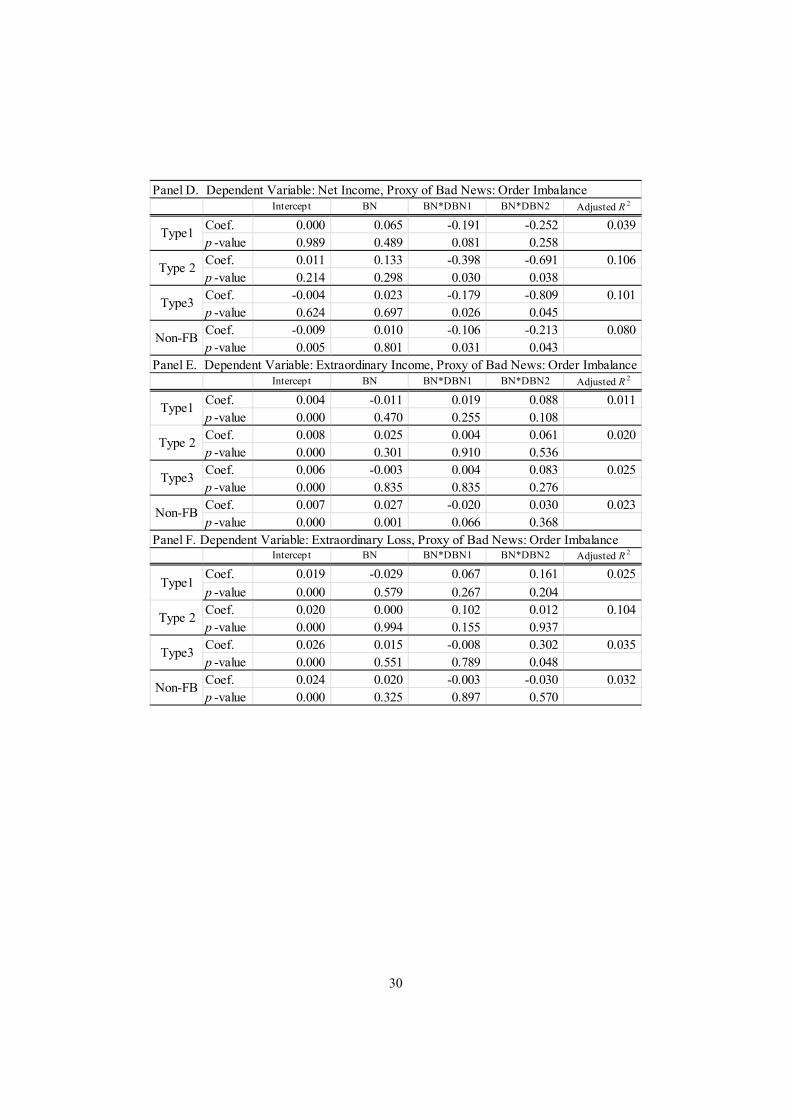
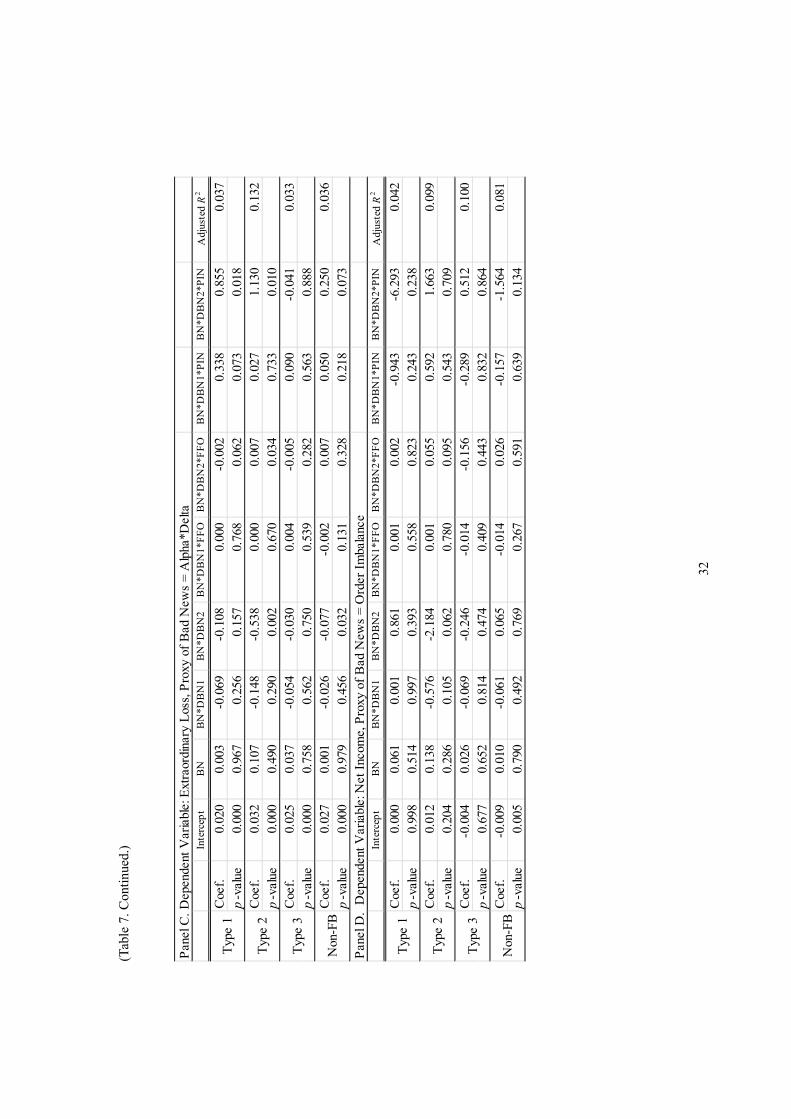
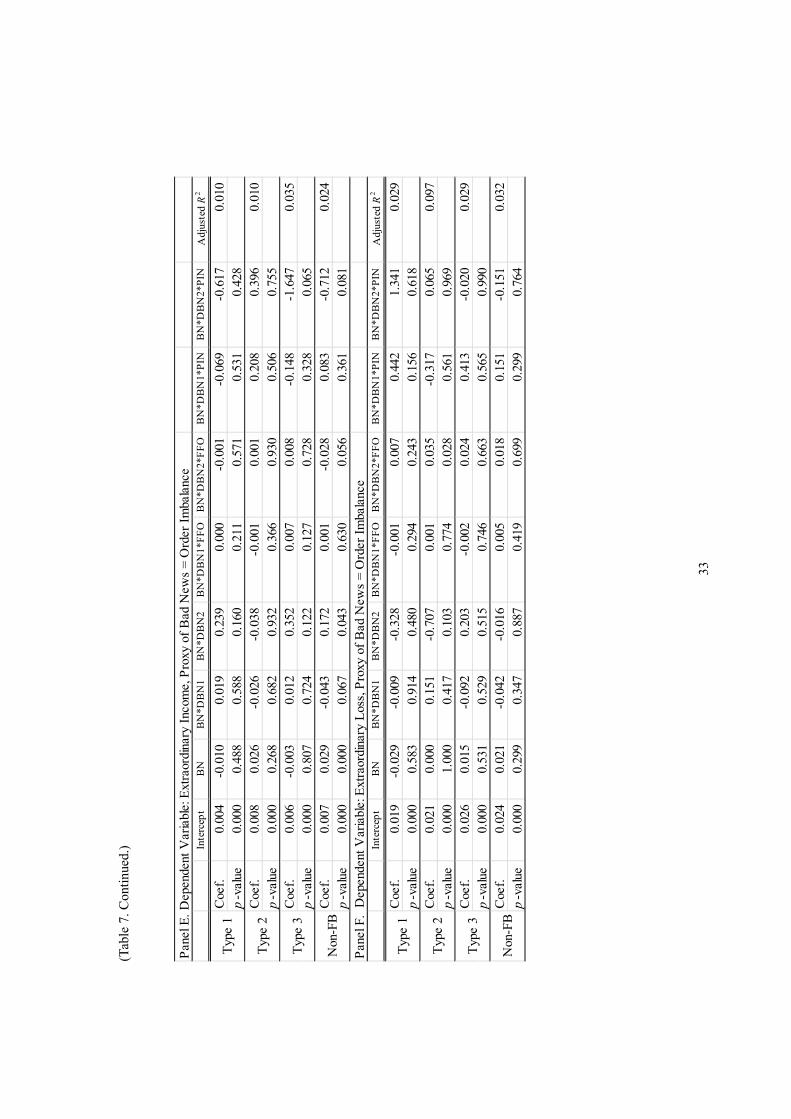
Table 7 reports the results for which family shareholdings and the PIN are simultaneously used as a
full variable version of equation (2).
TABLE 7 ABOUT HERE
17
In Panel A the signs of coefficients, BN*DB1 and BN*DB2, when Alpha*Delta is used as a signal for
bad news are all positive and, in particular, for Type 2 firms, are all significant at a 10% level. Moreover,
coefficients for BN*DB2 are all significant. However, predicted inequalities are all reversed between H
(BN*DB1) and M (BN*DB2) at 0.417 and 0.570, respectively. In spite of this, we can still claim that M
and H group firms are more conservative than L, the lowest bad news group at -0.171. The shareholdings
by founding families do not seem to contribute much to our final results for net income in Panel A. The
PIN variable is still significant, but signs become opposite. In other words, in this specification of the
model information asymmetry does not lead to accounting conservatism, which is a finding opposed to
LaFond and Watts (2010) for U.S. firms, we reject H3 from this particular table. We find the information
asymmetry represented by the PIN is negatively related to accounting conservatism in the case of full
variable models for Japanese family as well as non-family firms. Thus, we do not support H3, unlike the
case in Table 5. However, because the results are not strong in Table 7, however, we stick to results from
Table 5 and still support H3 overall.
Extraordinary income results in Panel B are again very weak. As for extraordinary losses shown in
Panel C, we find correct and negative signs for bad news, which is evidence of the robustness of our
previous result from Table 4. The PIN variable is not significant for extraordinary gain and losses.
Moreover, the signs for the M group of family shareholdings are significantly positive for Type 1 and 3
firms, and thus we do not support H3 for this case of extraordinary losses. However, the results still
support H1.
Again, for cases for the alternative variable, the order imbalance shown in Panel D, E, and F, the
results are weak and not significant.
Overall, for family firms in Japan, we conclude that in various specifications of models to test
conservatism and the resolution of information asymmetry, we support H1 and partially H3, but not H2.
18
7. Conclusion
Our empirical results revealed that Japanese family firms adopt more conservative accounting
reporting than non-family firms, while the degree of information asymmetry of family firm traded stocks
is higher than that of non-family firms. Because family managers and major family shareholders would
be more strongly concerned with future sustainability, we infer they want to face bad news earlier than
non-family firms and are eager to improve.
We have little evidence that shareholdings by families are related to the positive degree of
conservatism. We found that the degree of private information is higher for family than non-family firms,
and that, for firms with a CEO from the family and share- holdings larger than 10%, the existence of
information asymmetry leads firms to adopt more conservative accounting practices. This finding is
consistent with LaFond and Watts (2010) for U.S. firms.
Overall, we found evidence that family firms in Japan adopt more conservative accounting
practices. This is the first study to use family firm samples and microstructure variables to investigate
accounting conservatism for Japanese data.
19
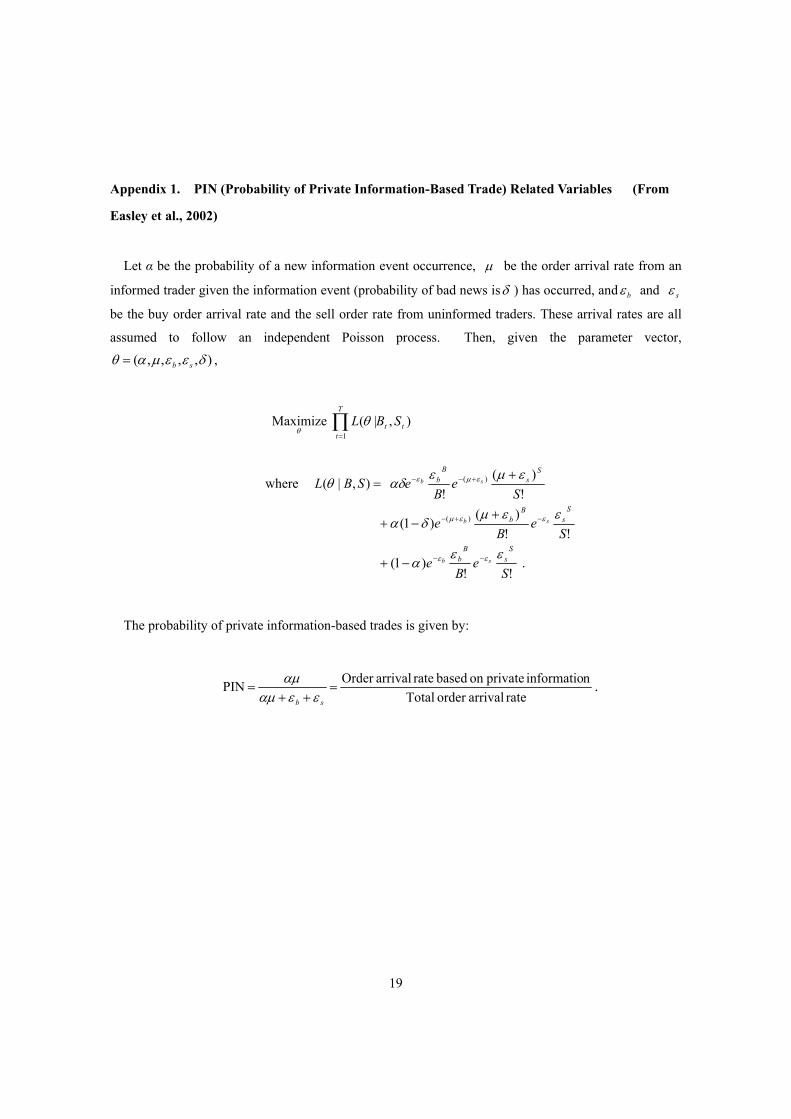
Appendix 1. PIN (Probability of Private Information-Based Trade) Related Variables (From
Easley et al., 2002)
Let α be the probability of a new information event occurrence, be the order arrival rate from an
informed trader given the information event (probability of bad news is ) has occurred, and b and s
be the buy order arrival rate and the sell order rate from uninformed traders. These arrival rates are all
assumed to follow an independent Poisson process. Then, given the parameter vector,
),,,,( sb ,
. !!
)1(
!!
)()1(
!
)(
! ),|( where
),|( Maximize
)(
)(
1
Se
Be
Se
Be
Se
BeSBL
SBL
Ss
Bb
Ss
Bb
Ss
Bb
tt
T
t
sb
sb
sb
The probability of private information-based trades is given by:
rate arrivalorder Total
ninformatio privateon based rate arrivalOrder PIN
sb
.

20
Appendix 2. Sector Classifications
Based on 33 industry classifications by the Tokyo Stock Exchange, we redefine seven sectors below
following Kubota and Takehara (2007) for Japanese firms.
Sector Industry Sector Industry
Fishery and Agriculture CommunicationFoods Wholesale TradeTextiles and Apparels Retail TradePharmaceutical ServicesElectric AppliancesOther Products BanksMining SecuritiesConstruction InsurancePulp and Paper Other Financial BusinessChemicalsOil and Coal Products Land TransportationRubber Products Marine TransportationGlass and Ceramics Products Air TransportationIron and Steel
Nonferrous Metals Utility Electric Power and Gas
Metal Products
Machinery WarehousingTransportation Equipment Real EstatePrecision Instruments
ConsumptionGoods
InvestmentGoods
Services
Financial
Transportation
Real Estate
21
References:
Accounting Standards Board of Japan (2006). Conceptual framework of financial accounting. ASBJ:
Tokyo.
Aghion, P. and Tirole, J. (1997). Formal and real authority in organizations. Journal of Political
Economy, 105, 1-29.
Ali, A, Chen, T., and Radhakrishnan, S. (2007). Corporate disclosures by family firms. Journal of
Accounting and Economics, 44. 238-286.
Allouche, J., Amann, B., Jaussaud, J., and Kurashina, T. (2008). The impact of family control on the
performance and financial characteristics of family versus nonfamily businesses in Japan: A
matched-pair investigation. Family Business Review, 21, 315-329.
Anderson, R. C., Duru, A., and D. M. Reeb, D. M. (2009). Founders, heirs, and corporate opacity in the
United States. Journal of Financial Economics, 92, 205-222.
Anderson, R. C., Reeb, D. M., Zhao, W. (2012). Family-controlled firms and informed trading: Evidence
from short sales. Journal of Finance, 67, 351-385.
Antle, R. and Nalebuff, B. (1991). Conservatism and auditor-client negotiations. Journal of Accounting
Research, Supplement, 31-59.
Asaba, S., 2012. Patient investment: A study on the behavior of the listed family business in the Japanese
electric machinery industry. Asia Pacific Journal of Management, On line first, August 26.
Bagnoli, M. and Watts, S. G. (2005). Conservative accounting choices. Management Science, 51,
786-801.
Ball, R., Kothari, S. P., and Nkolaev, V. (2012). Econometrics of the Basu asymmetric timeliness
coefficient and accounting conservatism. Chicago Booth Working Paper.
Ball, R., and Shivakumar. (2005). Earnings quality in UK private firms: comparative loss recognition
timeliness. Journal of Accounting and Economics, 39, 83-128.
Basu, S., (1995). Conservatism and the asymmetric timeliness of earnings. Ann Arbor: UMI Dissertation
Services.
Basu, S. (1997). The conservatism principle and the asymmetric timeliness of earnings. Journal of
Accounting and Economics, 24, 3-37.
Boyd, B. (2010). Sustainable management in long-lived family businesses- A resource-based analysis of
northern German builders’ providers. International Journal of Entrepreneurship and Small Businesses,
11, 308-320.
Chung, R., Ho, S., and Kim, J-B. (2004). Ownership structure and the pricing of discretionary accruals
in Japan. Journal of International Accounting, Auditing, and Taxation, 13, 1-20.
22
Claessens, S., Djankov, S., and Lang, L. H. P. (2000). Separation of ownership from control of East
Asian firms. Journal of Financial Economics, 58, 81-112.
Easley, D., Hvidkajaer, So, and O’Hara, M., (2002). Is information risk a determinant of asset returns?
Journal of Finance, 57. 2185-2222.
Ebihara, T., Kubota, K., Takehara H., and Yokota, E. (2012). Quality of accounting disclosures by family
firms in Japan. SSRN Working Paper. Abstract=1996505.
Financial Accounting Standards Board (1982). Statement of Financial Accounting Standards, No. 65.
Accounting for Certain Mortgage Banking Activities. Norwalk: FASB.
Financial Accounting Standards Board (2004). Statement of Financial Accounting Standards, No. 151,
Inventory Costs. Norwalk: FASB.
Financial Accounting Standards Board (2010). Statement of Financial Accounting Concepts. Norwalk:
FASB.
Francis, J., Schipper, K. , and Olsson, P., 2006. Earnings Quality. Hanover: now Publisher.
Hendriksen, E. S. (1970). Accounting theory. Homewood: Richard D. Irwin, Inc.
Hendriksen, E. S. and van Breda, M. F.. (1992). Accounting theory. (5th edition) Homewood: Richard D.
Irwin, Inc.
Ijiri, Y. and Nakano, I. (1989). Generalizations of cost-or-market valuation. Accounting Horizons,
September, 1-11.
International Financial Reporting Standards Foudation (2012). Conceptual Framework for Financial
Reporting. London: IFRS.
Japanese Accounting Standards Board (1982). Generally Accepted Accounting Principles. Tokyo:
Financial Services Agency.
Jensen, M. C. and Meckling, W. H., (1976). Theory of the firms: Managerial behavior, agency costs, and
ownership structure. Journal of Financial Economics, 3, 305-360.
Khan, M. and Watts, R. L. (2009). Estimation and empirical properties of a firm-year measure of
accounting conservatism. Journal of Accounting and Economics, 48. 132-150.
Kubota, K. and Takehara, H. (2007). Effects of tax rate changes on the cost of capital. Finanz
Archiv/Public Finance Analysis, 63,163-185.
LaFond, R. and Roychowdhury, S. (2008). Managerial ownership and accounting conservatism. The
Accounting Review, 46, 101-135.
LaFond, R. and Watts, R. L. (2008). The information role of conservatism. The Accounting Review, 83,
447-478.
Lambert, R.A., Leuz, C., and Verrecchia, R. E. (2012). Information asymmetry, information precision,
23
and the cost of capital. Review of Finance, 16, 1-29.
Mehrotra, V., Morck, R., Shim, J., and Wiwattananakantang, Y., (2012). Adoptive expectations: Rising
sun tournaments in Japanese firms. NBER Working Paper No. 16874, forthcoming, Journal of Financial
Economics.
Miller, D., and Le Breton-Miller, I. (2005). Managing for the Long Run: Lessons in Competitive
Advantages from Great Family Businesses. Boston: Harvard Business University Press.
Patatoukas, P., and Thomas, J. (2009). Evidence of conditional conservatism: fact or artifact. Working
Paper, Yale University.
Patatoukas, P., and Thomas, J. (2010). More evidence of bias in Basu (1997) estimates of conditional
conservatism. Working Paper, Yale University.
Pope, P. F. and Walker, M. (1999). International difference in the timeliness, conservatism, and
classification of earnings. Journal of Accounting Research, 37, 53-87.
Ronen, J. and Yarri, V. (2008). Earnings management: Emerging insights into Theory, Practice and
Research. New York: Springer.
Saito, T. (2008). Family firms and firm performance: Evidence from Japan. Journal of the Japanese and
International Economies, 22, 620-646.
Salvato, C. and Moores, K. (2010). Research on accounting in family firms: Past accomplishments and
future challenges. Family Business Review, 23, 193-215.
Shrand, C. M., and Walther, B. R. (2000). Strategic benchmarks in earnings announcement: The
selective disclosure of prior-period earnings components. The Accounting Review, 75, 151-177.
Wang, D. (2006). Founding family ownership and earnings quality. Journal of Accounting Research, 44,
619-655.

24
Table 1. Number of the Sample
Type 1, more than 10 % shareholdings and CEO from family, Type 2, more than 10 % shareholdings, but
CEO is not from family, Type 3, less than 10 % shareholdings, but CEO is from the founding family. The
observation period is from 2007 through 2009. We did not include the sample for which the minimum
days of available trade (buy and sell order) data were less than 120 days to compute the annual PIN
values.
Type 1 Type 2 Type 3 Non-FB Total %FF≧10% &
CEO is amember of FF
%FF≧10%,CEO is not amember of FF
%FF<10% butCEO is a
member of FF
%FF<10%,CEO is not amember of FF
2007 363 94 169 1056 1682
(PIN N.A.) 59 15 14 90 178
2008 373 95 165 1045 1678
(PIN N.A.) 72 16 17 117 222
2009 304 80 156 964 1504
(PIN N.A.) 80 17 20 111 228
Total 1040 269 490 3065 4864
Family Business (%) 21.38 5.53 10.07 63.01 100.00
25
Table 2. Descriptive Statistics
[Types of Family Firms in Japan]
Type 1, more than 10 % shareholdings and CEO from family, Type 2, more than 10 % shareholdings, but
CEO is not from family, Type 3, less than 10 % shareholdings, but CEO is from family.
[Stock Ownership Structure Variables]
%FFO: Percentage of shares held by founding family, FSR: Floating stock ratio, Directors: Percentage of
shares held by directors, Domestic: Percentage of shares held by Japanese corporations, Foreign: Percentage
of shares held by foreign institutions, Individuals: Percentage of shares held by individual investors.
[Corporate Performance Variables]
EPR: Earnings-to-price ratio, E/P, ROE: Return on equity, ROA: Return on asset, Ret: annual stock returns,
DR: a dummy variable which takes value 1 if the return is negative.
[PIN and other parameters in Easley et al. (2002)]
PIN: Probability of information-based trades, Alpha (α): Probability that private information event occurs,
Delta (δ): Probability of bad news, OI: Order imbalance.
[Other Related Variables]
lnMV, natural logarithm of market equity, BPR, book-to-market ratio.
Type 1 p -value Type 2 p -value Type 3 p -value Non-FB
%FFO 31.856 0.000 23.175 0.000 3.949 0.000 0.497
FSR 45.436 0.000 48.784 0.002 59.478 0.000 51.280
Directors 16.810 0.000 7.046 0.000 2.714 0.000 1.123
Domestic 37.702 0.000 38.828 0.000 49.098 0.000 54.847
Foreign 9.045 0.000 11.540 0.949 13.363 0.001 11.492
Individuals 52.364 0.000 48.644 0.000 36.228 0.000 32.137
ROA 0.597 0.253 -1.305 0.556 0.465 0.381 -0.104
ROE 5.202 0.388 -4.969 0.594 -1.528 0.568 -2.868
EPR -7.610 0.230 -6.773 0.422 -2.908 0.955 -3.028
Ret -0.179 0.000 -0.124 0.969 -0.117 0.660 -0.125
DR 0.774 0.060 0.773 0.301 0.718 0.214 0.746
PIN 0.197 0.000 0.191 0.010 0.178 0.770 0.179
Alpha 0.269 0.001 0.268 0.071 0.294 0.031 0.281
Delta 0.465 0.000 0.501 0.000 0.440 0.060 0.419
OI 0.043 0.000 0.043 0.000 0.014 0.024 0.022
LnMV 9.682 0.000 9.899 0.000 10.417 0.946 10.422
BPR 123.046 0.892 126.829 0.590 135.773 0.012 122.263
26
Table 3. Correlation among Variables
Definitions of the variables are same as in Table 2. Pearson moment correlations are in upper-right
triangular matrix and Spearman rank correlations are in lower-left triangular matrix.
%FFO EPR Ret DR PIN Alpha Delta OI
%FFO 1.00 0.01 -0.09 0.05 0.11 -0.06 0.10 0.14
ROA 0.05 1.00 0.09 -0.04 -0.10 0.06 -0.02 -0.03
Ret -0.07 0.19 1.00 -0.68 0.00 0.04 -0.14 -0.17
DR 0.03 -0.14 -0.75 1.00 0.01 -0.05 0.14 0.16
PIN 0.16 -0.14 -0.06 0.02 1.00 -0.11 0.15 0.37
Alpha -0.05 0.18 0.04 -0.05 -0.26 1.00 -0.11 -0.43
Delta 0.11 -0.07 -0.13 0.15 0.15 -0.14 1.00 0.26
OI 0.15 -0.06 -0.20 0.16 0.48 -0.50 0.27 1.00

27
Table 4. Results of Regression Analysis
Dependent variable is the earnings denominated by beginning of the period total assets. Ret: Annual
stock return (from July of year t-1 to June of year t), DR: Dummy variable which is equal to 1 if Ret<0,
FFO: Percentage of shares held by founding family, PIN: Probability of private information-based trades.
Computed regression equations are equation (1) of the main text.
Panel A. Dependent Variable: Net Income Intercept Ret DR DR*Ret Adjusted R 2
Coef. 0.000 0.016 0.014 0.117 0.128
p -value 0.997 0.415 0.015 0.000
Coef. 0.010 0.010 0.011 0.118 0.115
p-value 0.367 0.770 0.238 0.015
Coef. -0.001 0.001 0.014 0.093 0.116
p -value 0.931 0.939 0.143 0.018
Coef. 0.000 0.013 0.002 0.064 0.112
p -value 0.951 0.067 0.433 0.000
Panel B. Dependent Variable: Etraordinary Income Intercept Ret DR DR*Ret Adjusted R 2
Coef. 0.006 -0.004 -0.004 -0.009 0.032
p -value 0.000 0.183 0.002 0.049
Coef. 0.008 0.002 -0.001 -0.011 -0.007
p -value 0.003 0.535 0.688 0.110
Coef. 0.006 -0.008 -0.001 0.006 0.029
p -value 0.003 0.039 0.798 0.393
Coef. 0.004 0.004 0.001 -0.010 0.024
p -value 0.000 0.182 0.232 0.005
Panel C. Dependent Variable: Extraordinary Loss Intercept Ret DR DR*Ret Adjusted R 2
Coef. 0.020 -0.003 -0.006 -0.038 0.063
p -value 0.000 0.667 0.037 0.000
Coef. 0.017 0.004 0.000 -0.044 0.089
p -value 0.002 0.448 0.916 0.021
Coef. 0.019 0.010 0.004 -0.033 0.048
p -value 0.000 0.437 0.344 0.079
Coef. 0.020 0.002 -0.002 0.000 0.072
p -value 0.000 0.630 0.225 0.952
Type 2
Type 1
Type 2
Type3
Non-FB
Type 1
Non-FB
Type3
Non-FB
Type 1
Type 2
Type3
28
Table 5. The Extended Model
Dependent variable is the earnings denominated by beginning of the period total assets. Ret: Annual
stock return (from July of year t-1 to June of year t), DR: Dummy variable which is equal to 1 if Ret<0,
FFO: Percentage of shares held by founding family, PIN: Probability of private information-based trades.
Computed regression equations are equation (1) of the main text and the alternative proxy variables are
as in equation (2) of the main text.
Panel A. Dependent Variable: Net Income Intercept Ret DR DR*Ret DR*Ret*FFO DR*RET*PIN Adjusted R 2
Coef. 0.001 0.015 0.012 -0.047 -0.001 0.898 0.183
p -value 0.836 0.438 0.029 0.341 0.148 0.000
Coef. 0.010 0.010 0.011 0.067 0.000 0.301 0.115
p-value 0.370 0.769 0.274 0.418 0.725 0.243
Coef. -0.001 0.002 0.014 0.025 0.001 0.357 0.123
p -value 0.930 0.926 0.137 0.578 0.799 0.043
Coef. 0.000 0.013 0.002 -0.034 0.008 0.489 0.136
p -value 0.908 0.066 0.537 0.065 0.112 0.000
Panel B. Dependent Variable: Etraordinary Income Intercept Ret DR DR*Ret DR*Ret*FFO DR*RET*PIN Adjusted R 2
Coef. 0.006 -0.004 -0.004 -0.003 0.000 0.015 0.039
p -value 0.000 0.166 0.002 0.743 0.056 0.646
Coef. 0.008 0.002 -0.001 -0.006 0.000 -0.044 -0.011
p -value 0.003 0.515 0.696 0.634 0.449 0.426
Coef. 0.006 -0.008 -0.001 0.006 -0.001 0.026 0.030
p -value 0.002 0.039 0.785 0.528 0.259 0.494
Coef. 0.004 0.004 0.001 -0.004 0.000 -0.034 0.025
p -value 0.000 0.183 0.216 0.412 0.800 0.079
Panel C. Dependent Variable: Extraordinary Loss Intercept Ret DR DR*Ret DR*Ret*FFO DR*RET*PIN Adjusted R 2
Coef. 0.020 -0.002 -0.006 0.006 0.000 -0.254 0.084
p -value 0.000 0.702 0.048 0.766 0.289 0.013
Coef. 0.017 0.005 0.001 -0.029 0.000 -0.104 0.084
p -value 0.003 0.443 0.867 0.496 0.723 0.343
Coef. 0.018 0.009 0.004 -0.018 0.002 -0.132 0.054
p -value 0.000 0.440 0.343 0.517 0.361 0.278
Coef. 0.020 0.002 -0.002 0.000 -0.004 -0.168 0.072
p -value 0.000 0.630 0.225 0.952 0.116 0.000
Type 2
Type 1
Type 2
Type3
Non-FB
Type 1
Non-FB
Type3
Non-FB
Type 1
Type 2
Type3
29
Table 6. Results from Alternative Proxy Variables for Bad News
Dependent variable is the earnings denominated by beginning of the period total assets. Ret: Annual
stock return (from July of year t-1 to June of year t), DR: Dummy variable which is equal to 1 if Ret<0,
FFO: Percentage of shares held by founding family, PIN: Probability of private information-based trades.
Computed regression equations are equation (1) of the main text.
Panel A. Dependent Variable: Net Income, Proxy of Bad News: Alpha*Delta Intercept BN BN*DBN1 BN*DBN2 Adjusted R 2
Coef. -0.005 0.059 -0.011 -0.106 0.034p -value 0.528 0.685 0.931 0.332Coef. -0.008 -0.190 0.241 0.192 0.032p -value 0.605 0.465 0.294 0.362Coef. -0.007 -0.160 0.168 0.170 0.078p -value 0.486 0.421 0.328 0.246Coef. -0.017 -0.039 0.083 0.095 0.078p -value 0.000 0.625 0.238 0.116
Panel B. Dependent Variable: Extraordinary Income, Proxy of Bad News: Alpha*Delta Intercept BN BN*DBN1 BN*DBN2 Adjusted R 2
Coef. 0.002 0.058 -0.052 -0.027 0.016p -value 0.434 0.178 0.166 0.404Coef. 0.013 -0.057 0.031 0.046 0.023p -value 0.000 0.385 0.587 0.383Coef. 0.008 -0.043 0.034 0.012 0.027p -value 0.000 0.221 0.271 0.635Coef. 0.008 0.007 -0.014 -0.030 0.025p -value 0.000 0.756 0.484 0.073
Panel C. Dependent Variable: Extraordinary Loss, Proxy of Bad News: Alpha*Delta Intercept BN BN*DBN1 BN*DBN2 Adjusted R 2
Coef. 0.020 0.001 -0.006 0.019 0.020
p -value 0.000 0.983 0.915 0.696Coef. 0.030 0.114 -0.154 -0.155 0.090p -value 0.000 0.466 0.280 0.239Coef. 0.023 0.075 -0.051 -0.080 0.032p -value 0.000 0.410 0.494 0.214Coef. 0.027 0.004 -0.021 -0.030 0.034p -value 0.000 0.910 0.549 0.333
Type1
Type 2
Type3
Non-FB
Type1
Type1
Type 2
Type3
Non-FB
Type 2
Type3
Non-FB
(Table 6. Continued)
30
Panel D. Dependent Variable: Net Income, Proxy of Bad News: Order Imbalance Intercept BN BN*DBN1 BN*DBN2 Adjusted R 2
Coef. 0.000 0.065 -0.191 -0.252 0.039p -value 0.989 0.489 0.081 0.258Coef. 0.011 0.133 -0.398 -0.691 0.106p -value 0.214 0.298 0.030 0.038Coef. -0.004 0.023 -0.179 -0.809 0.101p -value 0.624 0.697 0.026 0.045Coef. -0.009 0.010 -0.106 -0.213 0.080p -value 0.005 0.801 0.031 0.043
Panel E. Dependent Variable: Extraordinary Income, Proxy of Bad News: Order Imbalance Intercept BN BN*DBN1 BN*DBN2 Adjusted R 2
Coef. 0.004 -0.011 0.019 0.088 0.011p -value 0.000 0.470 0.255 0.108Coef. 0.008 0.025 0.004 0.061 0.020p -value 0.000 0.301 0.910 0.536Coef. 0.006 -0.003 0.004 0.083 0.025p -value 0.000 0.835 0.835 0.276Coef. 0.007 0.027 -0.020 0.030 0.023p -value 0.000 0.001 0.066 0.368
Panel F. Dependent Variable: Extraordinary Loss, Proxy of Bad News: Order Imbalance Intercept BN BN*DBN1 BN*DBN2 Adjusted R 2
Coef. 0.019 -0.029 0.067 0.161 0.025
p -value 0.000 0.579 0.267 0.204Coef. 0.020 0.000 0.102 0.012 0.104p -value 0.000 0.994 0.155 0.937Coef. 0.026 0.015 -0.008 0.302 0.035p -value 0.000 0.551 0.789 0.048Coef. 0.024 0.020 -0.003 -0.030 0.032p -value 0.000 0.325 0.897 0.570
Type1
Type 2
Type3
Non-FB
Type 2
Type3
Non-FB
Type1
Type 2
Type3
Non-FB
Type1

31
Tab
le 7
. Res
ult
s fr
om A
lter
nat
ive
Pro
xy V
aria
ble
s
All
Var
iabl
e M
odel
Cas
e. D
epen
dent
var
iabl
e is
the
ear
ning
s de
nom
inat
ed b
y be
ginn
ing
of t
he p
erio
d to
tal
asse
ts.
Ret
: A
nnua
l st
ock
retu
rn
(fro
m J
uly
of y
ear
t-1
to J
une
of y
ear
t), D
R: D
umm
y va
riab
le w
hich
is e
qual
to 1
if R
et<
0, F
FO: P
erce
ntag
e of
sha
res
held
by
foun
ding
fam
ily,
PIN
: Pro
babi
lity
of
priv
ate
info
rmat
ion-
base
d tr
ades
. Com
pute
d re
gres
sion
equ
atio
ns a
re e
quat
ion
(2)
of th
e m
ain
text
.
Pan
el A
. Dep
ende
nt V
aria
ble:
Net
Inc
ome,
Pro
xy o
f B
ad N
ews
= A
lpha
*Del
ta I
nter
cep
t B
N
BN
*DB
N1
BN
*DB
N2
BN
*DB
N1*
FF
O
BN
*DB
N2*
FF
O
BN
*DB
N1*
PIN
BN
*DB
N2*
PIN
A
djus
ted
R2
Coe
f.
-0.0
080.
060
0.15
40.
468
0.00
00.
001
-0.8
74-2
.905
0.06
5p
-val
ue0.
327
0.68
00.
275
0.01
10.
889
0.73
30.
039
0.00
0
C
oef.
-0
.011
-0.1
710.
417
0.57
0-0
.001
-0.0
07-0
.880
-1.1
760.
065
p-v
alue
0.44
80.
504
0.08
60.
020
0.59
10.
048
0.01
60.
123
Coe
f.
-0.0
08-0
.143
0.17
70.
723
-0.0
010.
012
-0.0
96-3
.451
0.09
7p
-val
ue0.
458
0.57
30.
377
0.02
00.
956
0.40
50.
678
0.03
8
C
oef.
-0
.017
-0.0
200.
114
0.27
50.
006
-0.0
08-0
.272
-1.0
270.
085
p-v
alue
0.00
00.
802
0.10
10.
000
0.13
70.
576
0.00
10.
000
Pan
el B
. D
epen
dent
Var
iabl
e: E
xtra
ordi
nary
Inc
ome,
Pro
xy o
f B
ad N
ews
= A
lpha
*Del
ta I
nter
cep
t B
N
BN
*DB
N1
BN
*DB
N2
BN
*DB
N1*
FF
O
BN
*DB
N2*
FF
O
BN
*DB
N1*
PIN
BN
*DB
N2*
PIN
A
djus
ted
R2
Coe
f.
0.00
20.
057
-0.0
49-0
.034
0.00
00.
000
-0.0
210.
064
0.01
1p
-val
ue0.
448
0.18
20.
208
0.45
80.
896
0.77
30.
729
0.62
0C
oef.
0.
013
-0.0
570.
029
-0.0
050.
000
-0.0
010.
046
0.39
70.
021
p-v
alue
0.00
00.
382
0.61
30.
939
0.26
60.
269
0.17
40.
179
Coe
f.
0.00
9-0
.058
0.03
40.
061
0.00
10.
002
0.03
3-0
.268
0.02
7p
-val
ue0.
001
0.17
10.
305
0.12
40.
310
0.59
90.
320
0.01
1C
oef.
0.
008
0.00
1-0
.021
-0.0
260.
000
-0.0
010.
067
0.00
20.
026
p-v
alue
0.00
00.
971
0.27
30.
162
0.90
20.
692
0.02
80.
969
Typ
e 2
Typ
e 3
Non
-FB
Typ
e 1
Typ
e 2
Typ
e 3
Non
-FB
Typ
e 1
30
32
(Tab
le 7
. Con
tinue
d.)
Pan
el C
. Dep
ende
nt V
aria
ble:
Ext
raor
dina
ry L
oss,
Pro
xy o
f B
ad N
ews
= A
lpha
*Del
ta I
nter
cep
t B
N
BN
*DB
N1
BN
*DB
N2
BN
*DB
N1*
FF
O
BN
*DB
N2*
FF
O
BN
*DB
N1*
PIN
BN
*DB
N2*
PIN
A
djus
ted
R2
Coe
f.
0.02
00.
003
-0.0
69-0
.108
0.00
0-0
.002
0.33
80.
855
0.03
7p
-val
ue0.
000
0.96
70.
256
0.15
70.
768
0.06
20.
073
0.01
8C
oef.
0.
032
0.10
7-0
.148
-0.5
380.
000
0.00
70.
027
1.13
00.
132
p-v
alue
0.00
00.
490
0.29
00.
002
0.67
00.
034
0.73
30.
010
Coe
f.
0.02
50.
037
-0.0
54-0
.030
0.00
4-0
.005
0.09
0-0
.041
0.03
3p
-val
ue0.
000
0.75
80.
562
0.75
00.
539
0.28
20.
563
0.88
8C
oef.
0.
027
0.00
1-0
.026
-0.0
77-0
.002
0.00
70.
050
0.25
00.
036
p-v
alue
0.00
00.
979
0.45
60.
032
0.13
10.
328
0.21
80.
073
Pan
el D
. D
epen
dent
Var
iabl
e: N
et I
ncom
e, P
roxy
of
Bad
New
s =
Ord
er I
mba
lanc
e I
nter
cep
t B
N
BN
*DB
N1
BN
*DB
N2
BN
*DB
N1*
FF
O
BN
*DB
N2*
FF
O
BN
*DB
N1*
PIN
BN
*DB
N2*
PIN
A
djus
ted
R2
Coe
f.
0.00
00.
061
0.00
10.
861
0.00
10.
002
-0.9
43-6
.293
0.04
2p
-val
ue0.
998
0.51
40.
997
0.39
30.
558
0.82
30.
243
0.23
8C
oef.
0.
012
0.13
8-0
.576
-2.1
840.
001
0.05
50.
592
1.66
30.
099
p-v
alue
0.20
40.
286
0.10
50.
062
0.78
00.
095
0.54
30.
709
Coe
f.
-0.0
040.
026
-0.0
69-0
.246
-0.0
14-0
.156
-0.2
890.
512
0.10
0p
-val
ue0.
677
0.65
20.
814
0.47
40.
409
0.44
30.
832
0.86
4C
oef.
-0
.009
0.01
0-0
.061
0.06
5-0
.014
0.02
6-0
.157
-1.5
640.
081
p-v
alue
0.00
50.
790
0.49
20.
769
0.26
70.
591
0.63
90.
134
Typ
e 2
Typ
e 3
Non
-FB
Typ
e 1
Typ
e 2
Typ
e 3
Non
-FB
Typ
e 1
33
(Tab
le 7
. Con
tinue
d.)
Pan
el E
. Dep
ende
nt V
aria
ble:
Ext
raor
dina
ry I
ncom
e, P
roxy
of
Bad
New
s =
Ord
er I
mba
lanc
e I
nter
cep
t B
N
BN
*DB
N1
BN
*DB
N2
BN
*DB
N1*
FF
O
BN
*DB
N2*
FF
O
BN
*DB
N1*
PIN
BN
*DB
N2*
PIN
A
djus
ted
R2
Coe
f.
0.00
4-0
.010
0.01
90.
239
0.00
0-0
.001
-0.0
69-0
.617
0.01
0p
-val
ue0.
000
0.48
80.
588
0.16
00.
211
0.57
10.
531
0.42
8C
oef.
0.
008
0.02
6-0
.026
-0.0
38-0
.001
0.00
10.
208
0.39
60.
010
p-v
alue
0.00
00.
268
0.68
20.
932
0.36
60.
930
0.50
60.
755
Coe
f.
0.00
6-0
.003
0.01
20.
352
0.00
70.
008
-0.1
48-1
.647
0.03
5p
-val
ue0.
000
0.80
70.
724
0.12
20.
127
0.72
80.
328
0.06
5C
oef.
0.
007
0.02
9-0
.043
0.17
20.
001
-0.0
280.
083
-0.7
120.
024
p-v
alue
0.00
00.
000
0.06
70.
043
0.63
00.
056
0.36
10.
081
Pan
el F
. D
epen
dent
Var
iabl
e: E
xtra
ordi
nary
Los
s, P
roxy
of
Bad
New
s =
Ord
er I
mba
lanc
e I
nter
cep
t B
N
BN
*DB
N1
BN
*DB
N2
BN
*DB
N1*
FF
O
BN
*DB
N2*
FF
O
BN
*DB
N1*
PIN
BN
*DB
N2*
PIN
A
djus
ted
R2
Coe
f.
0.01
9-0
.029
-0.0
09-0
.328
-0.0
010.
007
0.44
21.
341
0.02
9p
-val
ue0.
000
0.58
30.
914
0.48
00.
294
0.24
30.
156
0.61
8C
oef.
0.
021
0.00
00.
151
-0.7
070.
001
0.03
5-0
.317
0.06
50.
097
p-v
alue
0.00
01.
000
0.41
70.
103
0.77
40.
028
0.56
10.
969
Coe
f.
0.02
60.
015
-0.0
920.
203
-0.0
020.
024
0.41
3-0
.020
0.02
9p
-val
ue0.
000
0.53
10.
529
0.51
50.
746
0.66
30.
565
0.99
0C
oef.
0.
024
0.02
1-0
.042
-0.0
160.
005
0.01
80.
151
-0.1
510.
032
p-v
alue
0.00
00.
299
0.34
70.
887
0.41
90.
699
0.29
90.
764
Typ
e 2
Typ
e 3
Non
-FB
Typ
e 1
Typ
e 2
Typ
e 3
Non
-FB
Typ
e 1