Embed Size (px)
Citation preview

EXTROVERSION AND MEDIA RICHNESS: AN ANALYSIS OF MEDIA
PREFERENCES OF HIGH EXTROVERTS WITHIN SALES ORGANIZATIONS
______________________________
A Thesis
Presented to the Faculty in Communication and Leadership Studies
School of Professional Studies
Gonzaga University
______________________________
Under the Supervision of Dr. Michael Hazel
Under the Mentorship of Dr. Dave Givens
______________________________
In Partial Fulfillment
Of the Requirements for the Degree
Master of Arts in Communication and Leadership Studies
______________________________
By
Donna M. Dudek
May 2016

Gonzaga University
MA Program in Communication and Leadership Studies

ABSTRACT
Personality traits and vocational acumen have been the source of research in recent years. Using
personality measures such as the Five Factor model, researchers have sought to find common
traits which may predict success in critical organizational roles. Communication needs and
desires, including media richness choices, have also been the subject of past research. The
purpose of this thesis is to tie these two themes together. Using a survey instrument containing
both a personality inventory and a questionnaire examining media preferences in different
scenarios, the author gathered data from sales professionals, client service professionals, and
managers to evaluate similarities and differences in personality traits. Then, to tie prior themes
together, the same population was asked to evaluate preferred communication media for different
scenarios of incoming and outgoing messages. The resulting data showed overall high
expectations for the richest media for incoming messages without regard for personality type.
Those high in Extroversion, however, showed higher preference for communicating with others
by face-to-face interaction.

TABLE OF CONTENTS
CHAPTER 1: INTRODUCTION 1
Importance of the Study 1
Statement of Purpose 1
Definition of Terms Used 2
Organization of Remaining Chapters 2
CHAPTER 2: REVIEW OF LITERATURE 4
Philosophical Assumptions 4
Theoretical Basis 5
The Literature 6
Rationale 12
Research Questions 13
CHAPTER 3: SCOPE AND METHODOLOGY 14
Scope of the Study 14
Methodology 15
Data Analysis 17
CHAPTER 4: THE STUDY 18
Introduction 18
Results of the Study 19
Discussion 33
CHAPTER 5: SUMMARIES AND CONCLUSIONS 38
Limitations of the Study 38
Recommendations for Further Study 39
Conclusions 40
REFERENCES 42
APPENDICES 46
Appendix A: Questionnaire Section 1 – Demographics 46
Appendix B: Questionnaire Section 2 – Big Five Inventory 47
Appendix C: Questionnaire Section 3 – Media Preferences 48
Appendix D: Participants with Big Five Inventory Scores 49

1
CHAPTER 1: INTRODUCTION
Importance of the Study
In sales organizations, maintaining a productive and engaged sales staff is crucial to
profitability. Time spent by sales professionals in non-selling activities reduces potential contacts
to clients and customers, thereby decreasing sales opportunities. Communicating clearly with
sales professionals, therefore, can have a direct impact on sales revenue. If sales professionals
understand the message and its impact, they should be able to spend less time on message
interpretation and more time on sales-related functions. Furthermore, if sales professionals have
specific expectations and desires for receiving messages by way of a particular communication
medium, it might be prudent to consider media selection carefully when crafting messages to
sales professionals. Taking steps to understand the role of communication media choice on
message effectiveness within sales organizations can have an impact on enabling sales
professionals to maintain a high level of sales-generating activities.
Statement of Purpose
The purpose of this thesis is to examine the role of personality traits on message media
preferences. First, an examination of common personality characteristics within sales
professionals was conducted. Second, if there is a commonality of traits within sales
professionals, then does it follow that this common trait impacts media preferences. The research
study conducted as a part of this thesis examined levels of extroversion among sales
professionals. It then tested expectations for delivery for messages with personal impact as well
as messages without personal impact. It went one step further by examining media choice for
outgoing messages of both negative and positive content. This examination was designed to shed

2
light on whether the personality traits of sales professionals predisposes them to be more inclined
to understand and accept messages when delivered by way of a specific communication medium.
Definition of Terms Used
The majority of terms used herein are commonly understood. The following terms may
need clarification to ensure the readers are correctly interpreting the intent of the author.
“Extroversion”, when capitalized within this paper, refers to the specific broad-based personality
trait identified within McCrae and Costa’s (1987) Five Factor model of personality
identification. The traits common to Extroversion are explained more fully in Chapter 2.
“Extroverts”, when capitalized, refers to individuals exhibiting high degrees of the traits common
to Extroversion as measured by a verified Five Factor model personality inventory. “Financial
services” refers to the industry which provides professional investment and financial planning
advice to individuals and institutions. “Advisor” is a term used in the financial services industry
to describe individuals who interact directly with clients. Advisors offer advice and wealth
planning services in exchange for a fee. Advisors are considered sales professionals.
Organization of Remaining Chapters
The Table of Contents contained earlier in this manuscript offers the overall organization
of the remaining chapters. Three chapters, however, contain subsections within the sections
listed in the Table. An explanation of the structure of these three chapters is offered here in an
effort to assist the reader in following the flow of the remainder of the research paper.
The literature review section of Chapter 2 is organized into subsections. The first
subsection discusses literature pertaining to the relationship between personality measures and
vocational fit. This section lays the foundation for the examination of common traits among sales
professionals. The next subsection discusses literature linking Extroversion with salesmanship.

3
The third subsection covers literature discussing communication traits of Extroverts. The final
section of Chapter 2 introduces media richness and managerial preferences.
Chapter 3 explains the nature of the research conducted as a part of this thesis. The
Methodology section contains subsections to help organize the process used. The first subsection
discusses the solicitation and acquisition of participants. The second subsection discusses the
survey instruments used to collect data from participants.
Chapter 4 offers the analysis of collected data. The first subsection analyzes
Extroversion. The second subsection explores the relationship between Extroversion and
incoming messages. The final subsection describes the relationship between Extroversion and
outgoing messages.

4
CHAPTER 2: REVIEW OF THE LITERATURE
Philosophical Assumptions
Organizational communication is the subject of much research and study. Effective
communication can maintain an engaged and motivated workforce. In sales organizations,
keeping sales professionals focused and engaged leads to increased revenue, while distractions
yield revenue and productivity losses (Ahearne, Haumann, Krause, & Wieseke, 2013). A
positive relationship between managers and sales personnel aids sales outcomes (Loundsbury,
Foster, Levy, & Gibson, 2014). For leaders, building loyalty with sales professionals is key for
success (Monzani, Ripoll, & Peiró, 2014). Effective communication is the foundation on which
loyalty is built. Yet in many cases, the personality traits that seem to be present in sales
professionals also tend to lead to an extra sensitivity in how they perceive communication and
relationships. In particular, the mode of communication – or communication medium – is
important. Leaders who are charged with communicating with sales professionals should
recognize the impact medium choice has upon message reception. Choosing the appropriate way
in which to communicate is often as important as the words contained within the message.
Marshall McCluhan (1964) discussed the importance of choice of medium. McCluhan’s
coined phrase, “the medium is the message”, indicates just how important choice of
communication channel really is. The medium we choose tells the receiver the message behind
the words. Reliance on only one or two forms of communication damages social realities and
norms, and impoverishes literacy (McCluhan, 1964). Managers who are able to select the most
appropriate communication medium for each message are typically the most successful
communicators (Lengel & Daft, 1988). The words themselves are less important to
communication than the medium through which the words are conveyed.

5
Theoretical Basis
Media richness theory categorizes different communication media by the depth of
information able to be conveyed (Griffin, 2012). Richness is determined by the number of cues
discernable, the ability to use a variety of language, the amount of personal focus, and the ability
to provide immediate feedback through multiple channels (Schiefelbein, 2012). Based on this
criterion, the richest medium is face-to-face communication. When communicating face-to-face,
participants use verbal and nonverbal cues, variations in tones of voice, and body language to
convey messages. Impersonal mass written communication would be the least rich. Selection of
the appropriate mode of communication can be instrumental in keeping sales professionals
engaged and productive. The medium itself can “enhance or distort the intended message”
(Lengel & Daft, 1988, p. 225).
Finding the right employees to fill key roles has long been a focus of hiring managers.
The personality of applicants is often given more weight by hiring managers than technical skills
or general intelligence (Sitser, van der Linden, & Born, 2013). Personality traits, when paired
with occupational requirements, create a match which can lead to improved performance and job
satisfaction. These traits can actually become more profoundly embedded in individuals
employed in an occupation requiring those traits (Wille & DeFruyt, 2014). Yet not all traits are a
universal fit for all roles. Sales roles specifically seem to attract individuals whose personality
characteristics fit sales roles, yet are a hindrance to success in other occupational roles. These
characteristics also tend to have implications as to the nature of successful communication.
A review of literature will first substantiate the link between vocational success and
personality traits as measured by the Five-Factor model (Barrick & Mount, 1991; Barrick,
Stewart, & Piotrowski, 2002; Costa, McCrae, & Holland, 1984; Wille & DeFruyt, 2014).

6
Further, it will support the idea that one particular trait, Extroversion, is commonly tied to
success in sales roles. An additional literature examination will illustrate how this personality
trait impacts communication desires and expectations of sales professionals. Finally, modes of
communication and manager preferences will be examined. Each of these four key research
themes lead to the research questions examined in this thesis.
The Literature
Personality, Vocational Fit, and Five-Factor Model
When selecting employees for specific roles, hiring managers often place more emphasis
on personality than on technical skills or intelligence (Sitser, van der Linden, & Born, 2013).
Selecting an employee with the right personality traits is often more predictive of success and
satisfaction than a specific skill set. The match between personality and vocation is important.
Traits viewed as an asset for one occupation can prove to be a liability for another (Wille &
DeFruyt, 2014). Personality traits and occupational proficiency remain stable through adulthood,
which indicates the value of personality trait examination in determining appropriate vocations
(Costa, McCrae, & Holland, 1984; Wille & DeFruyt, 2014).
Measuring and identifying personality traits consistently has been the subject of much
research. The Five Factor Model (FFM) (McCrae & Costa, 1987) is a method which has been
frequently tested in research of vocational fit. McCrae and Costa identified and defined five
broad personality traits which describe virtually all normal personalities (Loundsbury, Foster,
Levy, & Gibson, 2014). These five traits, also called The Big Five, are Agreeableness,
Conscientiousness, Extroversion, Neuroticism, and Openness to Experience. Of these five,
Conscientiousness has consistently been cited as a dominant factor in success across virtually all
occupations (Barrick & Mount, 1991; Furnham & Fudge, 2008; Hurtz & Donovan, 2000; Sitser,
7
van der Linden, and Born, 2013). This is not surprising, as conscientiousness is exemplified by
being “hardworking, ambitious, energetic, (and) persevering” (McCrae & Costa, 1987, p. 88).
Neuroticism is generally viewed as a negative indicator, meaning high levels of neuroticism were
seen as detriments to vocational success (Furnham & Fudge, 2008). Again, this finding is
understandable given the qualities associated with neuroticism: excessive worry, self-
consciousness, insecurity, anxiety, depression, and a pessimistic temperament (Barrick & Mount,
1991; McCrae & Costa, 1987). Agreeableness, or the ability and desire for community and
amity, proved to be important for those who work in close teaming situations. For sales
professionals, though, Extroversion has been shown as a primary predictor for success (Barrick
& Mount, 1991; Conte & Gintoft, 2005; Hurtz & Donovan, 2000; Oviedo-Garcia, 2007; Sitser,
van der Linden, and Born, 2013).
Extroversion and Sales Success
Barrick and Mount (1991) conducted a thorough meta-analytical study cross-referencing
personality traits and occupations. They found a correlation between high levels of Extroversion
and salesmanship. Hurtz and Donovan (2000) repeated the process, and added a factor for
supervisory ratings as a component to determine levels of success. Their findings were in line
with those of Barrick and Mount (1991), supporting the positive correlation between success in
sales and high levels of Extroversion. Extroversion was viewed as a fundamental differentiator
when using FFM for vocational acumen, pointing only to roles in sales or management (Hurtz &
Donovan, 2000). Furnham and Fudge (2008), however, found Extroversion to be mediated by
the type of products being sold. Brewer (2006) identified Extroversion as a quality present in
successful business people. McCrae and Costa (1987) referred to sales professionals as “the
prototypic extroverts” (p. 87).

8
Extroversion is characterized by being “sociable, fun-loving, affectionate, friendly, (and)
talkative” (McCrae & Costa, 1987, p. 87). Extroverts are social beings. They crave social
contact, and want to be around others (Brewer, 2006). They value relationships, and see
communication as a conduit to build and nurture those relationships (Monzani, Ripoll, & Pieró,
2014).
Extroverts are also seen as dominant and active (Barrick & Mount, 1991). They tend to
initiate conversation and interaction, even when unfamiliar with the topic (Frederickx &
Hofmans, 2014). This dominance, though, is not an impediment to communicating with a fellow
Extrovert. Cuperman and Ickes (2009) found that the most effective dyadic teams consisted of
two Extroverts.
Extroverts are also viewed as being individualistic and autonomous, seeking satisfaction
of their own goals rather than those of a team or organization. In fact, Extroversion was the only
personality factor which was not associated with pro-social citizenship behavior (Chiaburu, Oh,
Berry, Li, & Gardner, 2011). This individualism serves sales professionals, who tend to require
an entrepreneurial spirit to succeed (Loundsbury, et. al, 2014). The combination of interaction
with the public and high levels of autonomy seem to make Extroversion a near necessity for
success in sales (Oviedo-Garcia, 2007).
In their investigation of motivation and the Five-Factor model, Barrick, Stewart, and
Pietrowski (2002) determined Extroverts are likely to be motivated by status and achievement.
Motivation for those high in agreeableness were more motivated by a sense of community and
belonging, whereas those high in conscientiousness were primarily motivated by a sense of
accomplishment. Performance was highest among Extroverts when mediated by status (Barrick,
Stewart, & Pietrowski, 2002). Sales roles tend to require the ability to change directions quickly,

9
and to move from one project to another, referred to as “polychronicity”. Extroversion was the
only trait significantly related to polychronicity (Conte & Gintoft, 2005).
Communication and Extroversion
Extroverted individuals are conversation initiators, and engage in communication even if
the outcome might be negative (Frederickx & Hofmans, 2014). They tend to value relationships
where their opinions are heard and respected, and where they feel comfortable expressing those
opinions. They want to be heard, and tend to show more loyalty to leaders who they feel
genuinely listen to them (Monzani, Ripoll, & Pieró, 2014). The importance of the relationship to
Extroverts might explain some of their specific communication behaviors. Extroverts use
multiple forms of input for information gathering, including the non-verbal cues present
predominantly in face-to-face communication. When communicating, extroverted individuals
tend to be more physically expressive than introverted individuals, and they rely on receiving the
same physical cues from their communication partner (Brewer, 2006). These needs can most
easily be met by the richest communication medium: face-to-face communication. Less rich
media inhibit relationship-building (McDonnell, O’Neill, Kline, & Hambley, 2009), while face-
to-face communication aids relationship building (Sussman & Sproull, 1999). Communicating
using relationship-building media better fulfills the relational needs of extroverted individuals.
Media Richness and Managerial Preferences
Media richness is determined by the depth of interpersonal interaction it allows. It
measures the ability to create a shared experience (Daft, Lengel, & Trevino, 1987). Pentland
(2012) found that patterns, frequency, and richness of communication within teams contributed
more to team success than all other factors (“individual intelligence, personality, skill, and the
substance of discussions”) combined (Pentland, 2012, p. 62). Although Schiefelbein’s (2012)

10
research involved distance learning and video conferencing, she found that using the richest
medium available led to higher satisfaction for all communicants. The richer the medium, the
more the communication experience is shared among participants. The three primary
communication media to be discussed herein are face-to-face, telephone, and direct and
personalized written.
Face-to-Face
Face-to-face interaction is considered the richest communication medium. In face-to-face
communication, participants are able to express themselves using verbal language and non-
verbal cues such as body language, gestures, facial expressions, tones of voice, and pace of
speech. Communication is interactive, with each participant afforded the opportunity to reply and
engage immediately, both verbally and non-verbally. Face-to-face communication also seems to
offer the most effective path to relationship development (Sussman & Sproull, 1999). Face-to-
face interaction appears to be the most effective medium in team problem solving (Chapanis,
Ochsman, Parrish, and Weeks, 1972). Hecht, Boster, and LaMer (1989) found that the ability to
read all cues, both from communication partners and the environment, and adapt accordingly is
important to effective listener-adapted communication. Although video conferencing comes
close to imitating face-to-face communication, it is not an equal substitute. The lack of proximity
insulates participants emotionally, and non-verbal cues outside camera range are lost. Face-to-
face stands alone as the richest medium.
Telephone Communication
Telephone communication allows for quick interaction and tone-of-voice input, but loses
visual cues. As such, it is considered a less rich medium than face-to-face. Pentland (2012) noted
that telephone communication becomes even less rich as more participants were added. As an
11
example, a conference call with hundreds or thousands of active callers would be a less
conducive environment for immediate interaction than a conference call with five participants,
and therefore loses some of its richness.
Direct and Personalized Written Messages
Direct and personalized written communication, delivered either electronically or
physically, is lower on the richness scale. Written communication lacks the opportunity for
participants in the conversation to immediately interact. It also limits information by eliminating
non-verbal cues, including vocal variation. Pentland (2012) cited personalized written
communication, including email and text and instant messages, as the least valuable
communication medium for team interaction and problem solving. Email in particular enables
managers to communicate broad messages to an entire organizational unit quickly and
efficiently, however the messages lose richness as messages become more generic (Daft, Lengel,
& Trevino, 1987). Sussman and Sproull (1999), however, found email to be a valuable medium
choice for delivering negative news. A personalized email sent to a single recipient allowed the
sender to emotionally isolate themselves from the receiver, resulting in a message that was more
honest and clear, and less likely to be misinterpreted by the receiver (Sussman & Sproull, 1999).
In contrast, Lengel and Daft (1988) found that higher-level executives and those rated as
“successful” in performance evaluations were less likely to communicate challenging personal
messages using written medium.
The variety of communication media available to managers today offers opportunity and
presents challenges. Because of the importance of matching the appropriate medium with each
message, communication skill is believed to be the core competency for sales leaders
(Loundsbury, et.al., 2014). The highest performing managerial communicators are not those who

12
have the best language skills, but those who can choose the right medium for the message (Daft
& Lengel, 1988). Top executives tend to rely on face-to-face communication for the majority of
complex messages, yet this tendency is not necessarily found in managers at lower levels (Daft,
Lengel, & Trevino, 1987). Managers reported higher levels of comfort and satisfaction when
communicating complex and personal messages using less rich media (Sussman & Sproull,
1999).
Rationale
Past research supports the position that sales professionals tend to exhibit higher levels of
Extroversion using McCrae and Costa’s (1987) Five-Factor model. The qualities of Extroversion
– talkativeness, need for relationship-building, sociability, and dominance – create certain
expectations and needs in communication. A specific expectation involves receiving information
by way of rich medium. These communication needs and expectations, when met, can help
maintain a high level of engagement and productivity in the sales force. Yet organizational
challenges such as extended geography and time constraints may cause leaders to choose less
rich media to communicate. Other leaders may choose to deliver difficult messages in writing to
ensure accuracy and emotional detachment. There is little research, however, that investigates
whether richness desires of extroverted employees translate directly into the creation of
organizational messages. Thus, this research intends to shed light on whether there is a
correlation between Extroversion and media richness desires. Further, the results could indicate
whether personality of the receiver should influence the message sender’s media choice. To
examine this issue, the following research questions are proposed.

13
Research Questions
RQ1: Do individuals high in Extroversion indicate a preference for rich media when receiving
incoming information?
RQ2: Does the inclusion of a potential personal impact of the incoming information have an
impact on media richness preferences?
RQ3: What are the media-richness preferences of individuals with high levels of Extroversion
when they have information to impart to others?
RQ4: Do sales professionals tend to have higher levels of Extroversion than non-sales
professionals within a sales organization?

14
CHAPTER 3 – SCOPE AND METHODOLOGY
Scope of the Study
Past research has focused on the vocational predictive value of personality measures
including the Five-Factor Model (McCrae & Costa, 1987). Researchers have attempted to
identify traits which may lead to success in a variety of roles, including sales professionals.
Communication patterns of managers have been examined. Yet there has been little research to
pair the two. In organizations striving to maximize profitability by keeping sales professionals
productive and focused, communication with sales professionals could hold the key. This
research could bring new focus to the importance of media choice, and shed light on the impact
of media choice on sales professionals.
The scope of this study focuses on employees in sales organizations primarily in the
financial services industry. While the goal is to determine whether sales professionals have
specific media richness expectations, employees in all roles were within the scope. Adding
participants in non-sales roles offers valuable comparison information which can examine
whether sales professionals have unique communication needs within an organization.
Additionally, although Extroversion was shown by prior research to be generally high among
sales professionals, it may also exist within employees fulfilling other organizational roles.
Examining all participants for levels of extroversion may help reinforce personality as mediating
factor in expectations of medium. The participants were gathered using a non-probability
solicitation method. All individuals who responded to the solicitation had an equal opportunity to
fully participate in the research study.

15
Methodology
Participant Solicitation and Contact
An email was sent to prospective participants using an organization’s non-modified
global email distribution lists. Prefabricated distribution lists were used to avoid any possibility
of selectivity by the author. All respondents were offered the same opportunity to fully
participate, creating a randomization with the population. In addition, a request for participants
was posted to the author’s professional social media site, LinkedIn. The solicitation included a
brief description of the nature of the project, and requested participants to contact the author via
email. All prospective participants were sent an introductory email which included an
explanation of the nature of the project and information about how the collected data would be
used. Once informed of the nature of participation in the study, those who consented were
included in the population.
There were two delivery mechanisms used for distributing the surveys. Participants could
choose to complete the survey either electronically or manually. Those who elected to complete
the survey electronically received a link to a SurveyMonkey survey. Those who elected manual
completion received a three-page survey printed on paper. Both instruments asked identical
questions, and had identical options for each question. Formats were slightly different due to
limitations of the electronic survey tool. Both versions were tested prior to distribution to
subjects. Testers were asked to evaluate each for ease of completion and clarity of instructions.
Upon completion of the pre-testing, survey instruments were delivered to all participants.
Replicas of the paper version of the survey are attached as exhibits.
Survey Instrument
16
The survey instrument itself consisted of three separate sections. The three sections
included a brief demographic survey, a Five-Factor Personality Inventory, and a media
preference questionnaire. Each of these sections is described in more detail below.
The demographic section asked basic questions to establish approximate age,
approximate length of service within their organization, and their role within the organization.
Except for the question of age, answers were selected from a list of preset ranges. Ranges were
used to provide consistency in answers. For those who indicated they occupied a sales role, the
participant was asked to select the range indicating his or her approximate prior-year sales
revenue. Each sales professional was asked to enter the range indicating his or her approximate
prior-year sales revenue. The purpose of obtaining this information was to apply a “successful”
rating to participants. The demographic questions are attached as Appendix A.
The BFI (Big Five Inventory) 44-question survey was used to determine levels of
Extroversion and the other four factors (John, Donahue, & Kentle, 1991). The survey contains 44
brief statements, and asks participants to respond to each by rating them on a five-point Likert
scale. The scale ranged from a low of 1 (Strongly Disagree) to a high of 5 (Strongly Agree).
Each statement asked participants to evaluate the level with which they agree or disagree with
statements like, “I am someone who does a thorough job” and “I am someone who can be
moody”. The complete 44-question instrument is attached as Appendix B.
The media preference section asked four questions about incoming messages and four
questions about outgoing messages. All questions asked the participants to select their first and
second preferences from the following media choices: in-person, face-to-face conversation;
telephone call; personal, addressed email; meeting or conference call; and written message with a
copy of all pertinent policy information. The questions asked the participants to decide how they

17
would want to be informed of information pertaining to a variety of broad-based policy issues.
Two of the four questions pertained to information which may have an impact on the participant.
The other two questions were less personal in nature. This may help differentiate between
richness desires when the information is more personal.
The third section also contained four questions regarding outbound messages. Two
outbound messages were to clients or customers, and two messages were to peers or coworkers.
These questions hoped to test whether individuals high in Extroversion were more inclined to
deliver both positive and negative information by the richest available medium, and whether this
decision differed depending on the recipient. Questions regarding media preference are attached
as Appendix C.
Data Analysis
Analysis of the BFI questionnaire results was completed using John, Donahue, and
Kentle’s (1991) scoring instructions for version 4A of the Big Five Inventory. Numeric values
were assigned to each answer on the Likert scale. The 44 questions in the inventory contained
eight measuring Extroversion and Neuroticism, nine measuring Agreeableness and
Conscientiousness, and ten measuring Openness. The sums of the numeric values for each of the
Big Five traits are then averaged to obtain an overall score.
Analysis of the Media Richness section began by sorting all respondents by level of
Extroversion. The top 20 percent was considered “High Extroverts” (HE). The bottom 20 percent
was considered “Low Extroverts” (LE). The middle sixty percent was considered “Moderate
Extroverts” (ME). Media preferences were compiled and averaged for each category of incoming
and outgoing messages. Frequency of choices were examined by Extroversion level, age, gender,
and occupational role.

18
CHAPTER 4 – THE STUDY
Introduction
Surveys were distributed to potential participants between the dates of February 29, 2016
and March 11, 2016. Data collection ended on March 12, 2016. A total of 102 surveys were
collected: 69 online versions and 33 paper versions. The initial review of surveys indicated two
online versions were invalid. The respondents on these two surveys answered the demographic
information only. These questionnaires were eliminated from the results. There were a total of
100 usable responses.
Of the valid respondents, 48 were male and 52 were female. The role delineation
consisted of 42 “Advisory/Sales” (34 male and eight female), 33 “Client Service/Sales Support”
(five male and 28 female), 18 “Management” (six male and twelve female), three
“Technical/Analytical” (two male and one female), and four “Other” (one male and three
female). The average age of all respondents was 47 years old. The youngest average-aged group
was “Technical/Analytical” at 33.75 years, followed by “Client Service/Sales Support” at 44.09
years, “Other” at 45.4 years, and “Management” at 48.94 years. “Advisory/Sales” roles had the
highest average age of 50.02 years old.
Responses to Section Two, The Big Five Inventory, were segregated for separate scoring.
This section consisted of responses (r) to forty-four questions. Eight responses measured
Extroversion (rE), nine responses measured Agreeableness (rA), nine responses measured
Conscientiousness (rC), eight responses measured Neuroticism (rN), and ten responses measured
Openness (rO). Sixteen of the forty four questions were considered “reverse-score” questions.
Responses to reverse score questions (R) were converted to r by subtracting the response from
six (r=6-R). Averages were calculated for each category of r by dividing the sums of rE, rA, rC,

19
rN, and rO by the number of total questions answered for each trait. Eleven respondents failed to
complete all forty-four items. Because the scoring for this instrument is a simple non-weighted
average, the missing question was eliminated, and the denominator for the average was adjusted.
The average obtained is considered the overall score for each individual trait (sE, sA, etc.). To
maintain consistent scoring, a spreadsheet scoring template was constructed and used to score
each individual questionnaire.
All responses to the online questionnaire were downloaded into a spreadsheet using
SurveyMonkey’s downloading tool. The individual responses for the Big Five Inventory were
replaced by the score for each of the Big Five traits (sE, sA, sC, sN, and sO). Paper versions of
the questionnaire were first scored using the BFI scoring template. All responses and the
individual Big Five scores were manually added to the spreadsheet.
Results of the Study
Extroversion Levels
A primary focus for this research project is the impact of Extroversion on communication
and media preferences. Within the total population, Extroversion scores ranged from a high of
4.750 to a low of 1.875. The average Extroversion score for the entire population was 3.535.
Conscientiousness showed the highest average total score, followed by Agreeableness and
Openness. Only Neuroticism had a total average score lower than Extroversion. Within the
Advisory/Sales population, Extroversion ranged from a high of 4.750 to a low of 2.375, with a
mean of 3.758. Extroversion ranked as the third highest trait, behind Conscientiousness and
Agreeableness. Within the Client Service/Sales Support role, Extroversion ranked fourth behind
Conscientiousness, Agreeableness, and Openness. Total scores for each of the Big Five traits by
occupational role are summarized in Table 1.

20
Occupational Role sE sA sC sN sO
Advisory/Sales 3.7576 3.8703 3.9537 2.6190 3.5521
Client Service/Sales Support 3.2771 4.0774 4.1314 2.4356 3.4855
Management 3.5992 4.1667 4.1087 2.2966 3.5778
Technical/Analytical 3.2917 3.4073 4.0370 2.9167 3.8333
Other 3.2188 3.7778 3.9445 3.0313 3.6000
TOTAL POPULATION 3.5350 3.9744 4.0424 2.5259 3.5451
Table 1: Big Five Inventory Scores by Occupational Role
All responses were sorted by level of Extroversion, from highest to lowest. Appendix D
contains the entire population ranked by Extroversion score. The threshold for “High
Extroversion” (HE) was set by determining the top twenty percent of the population ranked by
sE. Using this method, HE threshold was set at 4.250. All respondents with sE greater than or
equal to 4.250 were considered HE (HE=(sE≥4.250)).. Similarly, the level for “Low
Extroversion” (LE) was determined by identifying the bottom twenty percent of the population
ranked by sE. The level for LE was set at those equal to or less than 2.875 (LE=(sE≤2.875)).
These levels were then applied to each population and the total population. Because the threshold
level fell within a group of respondents with that score, the application of this threshold resulted
in percentages slightly different than the initial twenty percent guide. To explain, the measure of
the top twenty scores fell at 4.250. Ten respondents showed an Extroversion score of 4.250. All
ten respondents were then considered to be “High Extroverts”, resulting in a total of twenty five
respondents (25%) attaining a “High Extrovert” rating. The following charts indicate the levels
of Extroversion among each occupational role. The categories of “Technical/Analytical” and
“Other” were statistically insignificant, having no respondents considered “High Extroverts”.
Charts are not included for these two categories.
21
Graph 1
Graph 2 Graph 3 Graph 4
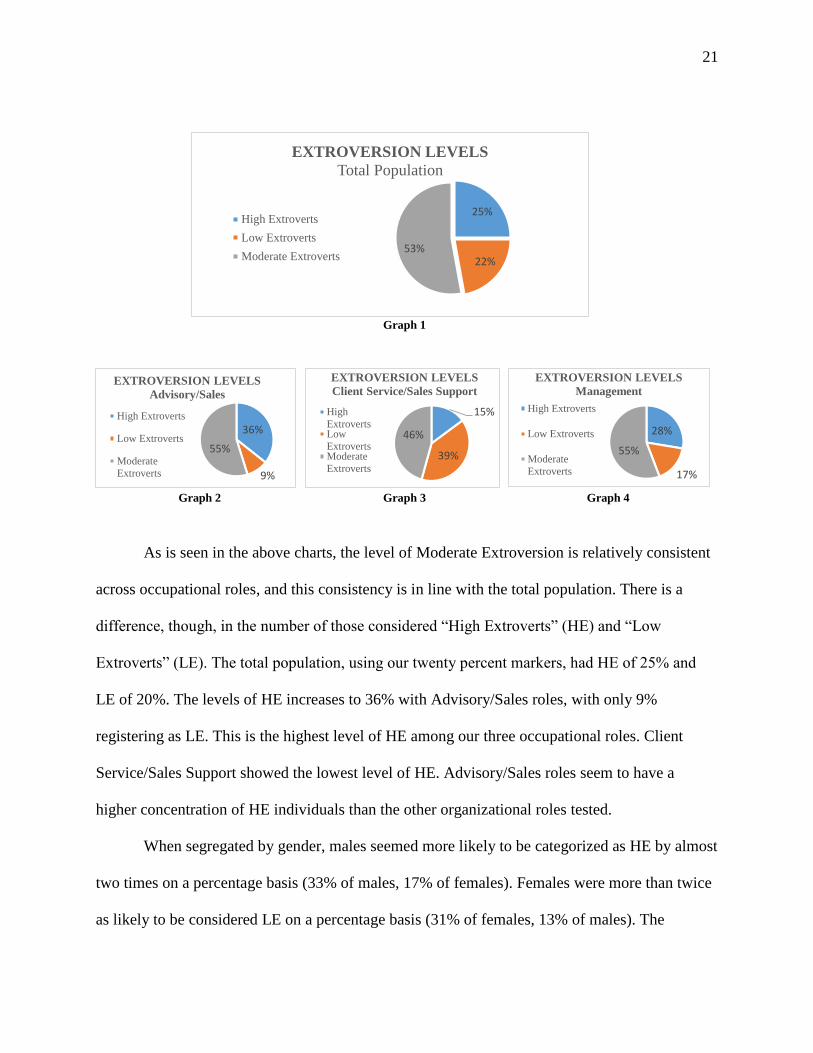
As is seen in the above charts, the level of Moderate Extroversion is relatively consistent
across occupational roles, and this consistency is in line with the total population. There is a
difference, though, in the number of those considered “High Extroverts” (HE) and “Low
Extroverts” (LE). The total population, using our twenty percent markers, had HE of 25% and
LE of 20%. The levels of HE increases to 36% with Advisory/Sales roles, with only 9%
registering as LE. This is the highest level of HE among our three occupational roles. Client
Service/Sales Support showed the lowest level of HE. Advisory/Sales roles seem to have a
higher concentration of HE individuals than the other organizational roles tested.
When segregated by gender, males seemed more likely to be categorized as HE by almost
two times on a percentage basis (33% of males, 17% of females). Females were more than twice
as likely to be considered LE on a percentage basis (31% of females, 13% of males). The
25%
22%53%
EXTROVERSION LEVELS
Total Population
High Extroverts
Low Extroverts
Moderate Extroverts
36%
9%
55%
EXTROVERSION LEVELS
Advisory/Sales
High Extroverts
Low Extroverts
Moderate
Extroverts
15%
39%
46%
EXTROVERSION LEVELS
Client Service/Sales Support
High
ExtrovertsLow
ExtrovertsModerate
Extroverts
28%
17%
55%
EXTROVERSION LEVELS
Management
High Extroverts
Low Extroverts
Moderate
Extroverts
22
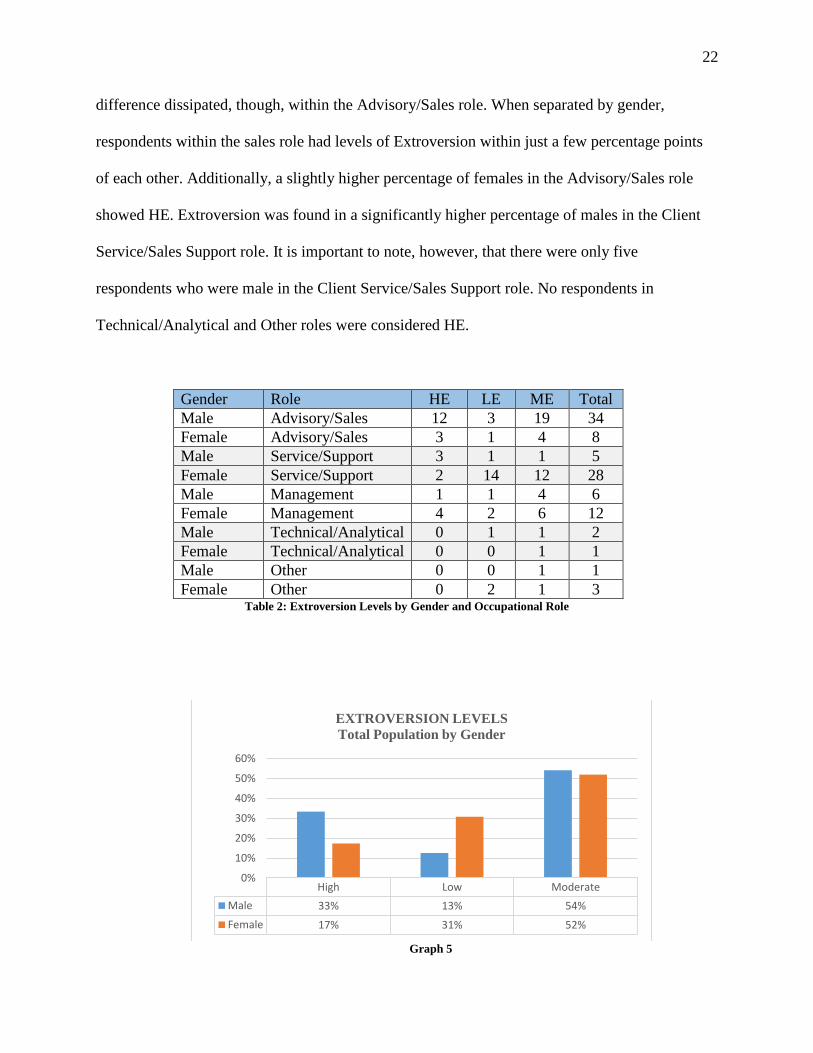
difference dissipated, though, within the Advisory/Sales role. When separated by gender,
respondents within the sales role had levels of Extroversion within just a few percentage points
of each other. Additionally, a slightly higher percentage of females in the Advisory/Sales role
showed HE. Extroversion was found in a significantly higher percentage of males in the Client
Service/Sales Support role. It is important to note, however, that there were only five
respondents who were male in the Client Service/Sales Support role. No respondents in
Technical/Analytical and Other roles were considered HE.
Gender Role HE LE ME Total
Male Advisory/Sales 12 3 19 34
Female Advisory/Sales 3 1 4 8
Male Service/Support 3 1 1 5
Female Service/Support 2 14 12 28
Male Management 1 1 4 6
Female Management 4 2 6 12
Male Technical/Analytical 0 1 1 2
Female Technical/Analytical 0 0 1 1
Male Other 0 0 1 1
Female Other 0 2 1 3 Table 2: Extroversion Levels by Gender and Occupational Role
Graph 5
High Low Moderate
Male 33% 13% 54%
Female 17% 31% 52%
0%
10%
20%
30%
40%
50%
60%
EXTROVERSION LEVELS
Total Population by Gender

23
Graph 6
Graph 7
Extroversion levels were also compared by age. A comparison by age was conducted to
evaluate whether age was more of a factor in Extroversion levels than occupational role. The
population was sorted by age, then divided into three groups: twenty to forty, between forty and
sixty, and sixty and over. The highest concentration by percentage of HE was in the over sixty
group, followed by the forty and under group. The middle age group most closely resembled the
initial breakdown to determine HE and LE (top 20% and bottom 20% of total population,
High Low Moderate
Male 35% 9% 56%
Female 38% 13% 50%
0%
10%
20%
30%
40%
50%
60%
EXTROVERSION LEVELS
Advisory/Sales by Gender
High Low Moderate
Male 60% 20% 20%
Female 7% 43% 50%
0%10%20%30%40%50%60%70%
EXTROVERSION LEVELS
Client Service/Sales Support by Gender

24
respectively). The forty and younger age group also showed the highest percentage of LE, while
only one member of the over sixty age group measured LE (five percent).
Graph 8
Extroversion and Incoming Message Preferences
Section three of the questionnaire asked participants to select from a list of five
communication media. The five media choices varied in richness: face-to-face, telephone, email,
meeting or conference call, and non-personal written communication. Four separate scenarios
were presented for media selection. Two scenarios indicated specifically that it may have
personal impact. The other two scenarios did not have personal impact. Responses were analyzed
by calculating the percentages of respondents selecting each media type for the four scenarios.
Results based on levels of Extroversion were compared to results of selections by occupational
role and by age. Respondents were instructed on the definition of each of the five communication
medium. Face-to-face, telephone, and email were all personalized messages from their “direct
manager, or a person knowledgeable about the situation”. “Meeting” referred to a meeting or
conference call conducted by a “direct manager or a person knowledgeable about the situation”,
High Low Moderate
60 and Over 37% 5% 58%
40 - 60 20% 20% 59%
40 and Under 25% 34% 41%
0%
10%
20%
30%
40%
50%
60%
70%
EXTROVERSION LEVELS BY AGE
25
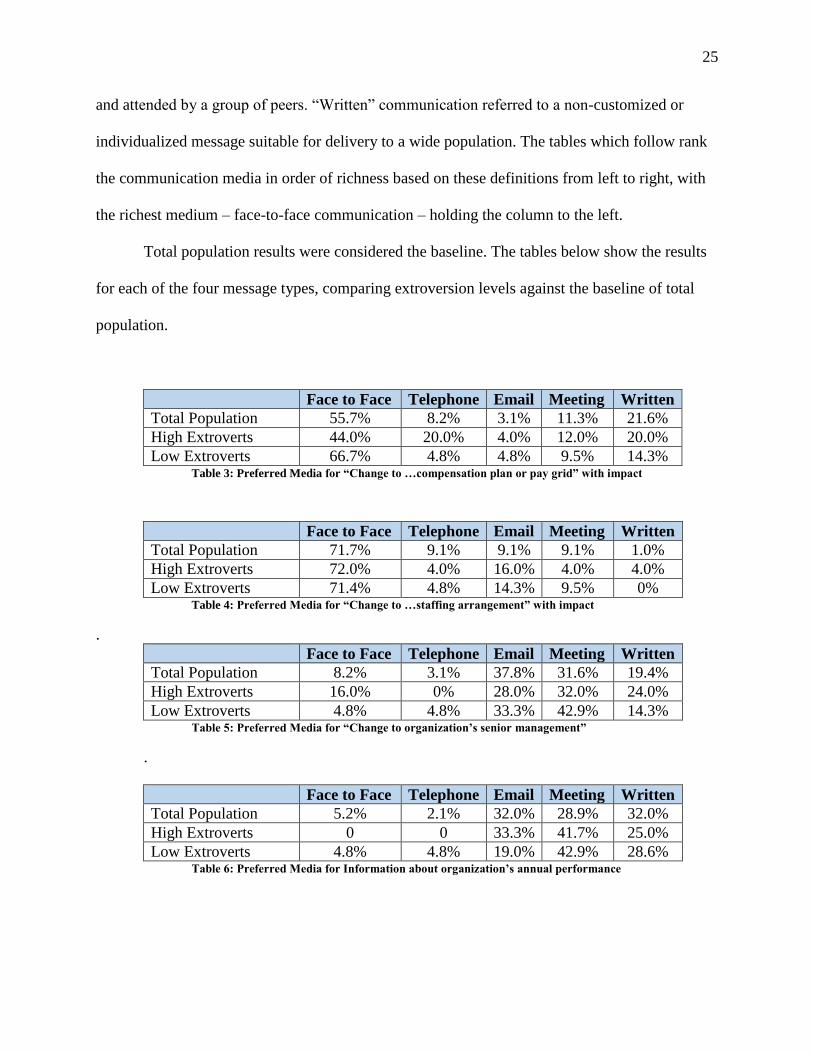
and attended by a group of peers. “Written” communication referred to a non-customized or
individualized message suitable for delivery to a wide population. The tables which follow rank
the communication media in order of richness based on these definitions from left to right, with
the richest medium – face-to-face communication – holding the column to the left.
Total population results were considered the baseline. The tables below show the results
for each of the four message types, comparing extroversion levels against the baseline of total
population.
Face to Face Telephone Email Meeting Written
Total Population 55.7% 8.2% 3.1% 11.3% 21.6%
High Extroverts 44.0% 20.0% 4.0% 12.0% 20.0%
Low Extroverts 66.7% 4.8% 4.8% 9.5% 14.3% Table 3: Preferred Media for “Change to …compensation plan or pay grid” with impact
Face to Face Telephone Email Meeting Written
Total Population 71.7% 9.1% 9.1% 9.1% 1.0%
High Extroverts 72.0% 4.0% 16.0% 4.0% 4.0%
Low Extroverts 71.4% 4.8% 14.3% 9.5% 0% Table 4: Preferred Media for “Change to …staffing arrangement” with impact
.
Face to Face Telephone Email Meeting Written
Total Population 8.2% 3.1% 37.8% 31.6% 19.4%
High Extroverts 16.0% 0% 28.0% 32.0% 24.0%
Low Extroverts 4.8% 4.8% 33.3% 42.9% 14.3% Table 5: Preferred Media for “Change to organization’s senior management”
.
Face to Face Telephone Email Meeting Written
Total Population 5.2% 2.1% 32.0% 28.9% 32.0%
High Extroverts 0 0 33.3% 41.7% 25.0%
Low Extroverts 4.8% 4.8% 19.0% 42.9% 28.6% Table 6: Preferred Media for Information about organization’s annual performance

26
In the two scenarios indicating potential personal impact (compensation changes and
staffing changes), a lower percentage of HE participants selected the richest media than the total
population. There was only a nominal difference (.6%) in the selection of face-to-face separating
HE and LE participants in the staffing scenario. Only in the scenario of a change to senior
management did the HE participants more frequently select the richest medium.
The ratios change when looking at the top two media choices for each scenario. The
number of ratings of “1” or “2” for each of the five media options were totaled, then averaged by
the number of respondents in each population. Those in the HE population chose telephone – a
relatively rich communication medium – as a top preference at a higher percentage rate than both
LE and total population for messages of personal impact. In matters of compensation, though,
the HE population chose the richest medium – face to face – at a lower percentage than both LE
and the total population.
Graph 9
0.0%
10.0%
20.0%
30.0%
40.0%
F2F Telephone Email Meeting Written
Top Two Media Choices - Compensation
Total Population High Extroverts Low Extroverts

27
Graph 10
Again using the total population as a baseline, selections were compared by occupational
role. The results followed a similar pattern to results by level of Extroversion, with
Advisory/Sales comparable to HE and Client Service/Sales Support comparable to LE.
Management, however, showed the highest level of desire for media richness. Differences in
media preference were less dramatic in the question of changes to senior management. Whereas
the HE population showed a significantly higher percentage selecting face-to-face
communication for changes to senior management, there was little difference in face-to-face
selection between occupational roles. While those identified with Advisory/Sales and Client
Service/Sales Support roles were relatively in line with the total population, those in
Management selected only the three least-rich media for information regarding annual
performance.
Face to Face Telephone Email Meeting Written
Total Population 55.7% 8.2% 3.1% 11.3% 21.6%
Advisory/Sales 51.2% 7.3% 4.9% 7.3% 29.3%
Client Service/Support 57.6% 3.0% 3.0% 18.2% 18.2%
Management 64.7% 17.6% 0% 5.9% 11.8% Table 7: Preferred Media for “Change to …compensation plan or pay grid” with impact
0.0%
10.0%
20.0%
30.0%
40.0%
50.0%
F2F Telephone Email Meeting Written
Top Two Media Choices - Staffing
Total Population High Extroverts Low Extroverts

28
.
Face to Face Telephone Email Meeting Written
Total Population 71.7% 8.2% 3.1% 11.3% 21.6%
Advisory/Sales 73.8% 7.1% 7.1% 9.5% 2.4%
Client Service/Support 72.7% 3.0% 12.1% 12.1% 0%
Management 72.2% 23.5% 5.9% 0% 0% Table 8: Preferred Media for “Change to …staffing arrangement” with impact
.
Face to Face Telephone Email Meeting Written
Total Population 8.2% 3.1% 37.8% 31.6% 19.4%
Advisory/Sales 7.1% 0% 47.6% 23.8% 21.4%
Client Service/Support 9.4% 6.3% 40.6% 34.4% 9.4%
Management 5.6% 5.6% 16.7% 38.9% 33.3% Table 9: Preferred Media for “Change to organization’s senior management”
.
Face to Face Telephone Email Meeting Written
Total Population 5.2% 2.1% 32.0% 28.9% 32.0%
Advisory/Sales 7.3% 2.4% 36.6% 24.4% 29.3%
Client Service/Support 6.1% 3.0% 33.3% 30.3% 27.3%
Management 0% 0% 23.5% 29.4% 47.1% Table 10: Preferred Media for Information about organization’s annual performance
Extroversion and Outgoing Message Preferences
The final section of the questionnaire asked respondents to select their preferred
communication medium and their typical communication medium for positive messages and
negative messages to customers or clients and to peers or coworkers. Responses were analyzed
by calculating the percentages of respondents selecting each media type for these eight messages.
Results based on levels of Extroversion for each message were compared to results of selections
by occupational role and by age. In each comparison, the percentages for the total population
was considered as a baseline.

29
Within the total population and within each scenario, the choice of preferred medium
reflected the richest selections: face-to-face and telephone. In fact, over 90% of respondents
indicated a preference for either face-to-face or telephone communication in all four scenarios. In
typical situations, however, the communication medium selection cooled. Negative news had a
higher likelihood of richer media use than positive news.
Respondents rated as HE showed a higher likelihood of selecting rich media than the total
population, while LE-rated respondents showed a lower likelihood of selecting rich media. There
was a significant difference in media preference between HE and LE, as is shown in Table 11.
The LE respondents opted to communicate negative information in writing, either by letter or
email. Specifically, with negative client information 13.6% of LE respondents preferred to write
a letter, with 9.1% preferring to use email. The preferred mode of communicating negative peer
or coworker information by the LE population was 9.1% email and 4.5% by letter. In actuality,
though, the LE population did not communicate these messages by letter at all, showing an
increase in email use to 13.6% for negative client information and 18.2% for negative peer
information.
Negative Client Positive Client Negative Peer Positive Peer
Total Population 90.9% 93.9% 94.0% 91.0%
High Extroverts 92.0% 96.0% 96.0% 88.0%
Low Extroverts 77.3% 86.4% 86.4% 90.9% Table 11: Total of Face to Face and Telephone Elections as Preferred Media for Outgoing Communication

30
Graph 11
Within role delineation, Advisory/Sales selected face-to-face as the preferred method of
communication in both positive and negative client interactions at a significantly higher rate than
Client Service/Sales Support and Management. The percentages declined in peer communication
preferences. Management roles seemed to have the highest overall selection of rich media, with
the exception of typical style for client communication, where Management was surpassed by
Advisory/Sales roles.
0%
10%
20%
30%
40%
50%
60%
70%
80%
90%
100%
Total Population High Extrovert Low Extrovert
Composite Face To Face and Telephone Preferred Usage
Negative Client Positive Client Negative Peer Positive Peer

31
Graph 12
Graph 13
Neg Client Pos Client Neg Peer Pos Peer
Advisory/Sales 73.2% 53.7% 85.7% 69.0%
Service/Support 45.5% 30.3% 81.8% 75.8%
Management 50.0% 33.3% 88.9% 83.3%
Total Population 57.6% 40.4% 85.0% 74.0%
0.0%10.0%20.0%30.0%40.0%50.0%60.0%70.0%80.0%90.0%
100.0%
Face To Face Preferred Choice by Role
Neg Client Pos Client Neg Peer Pos Peer
Advisory/Sales 38.1% 21.4% 85.7% 71.4%
Service/Support 16.7% 5.6% 72.2% 55.6%
Management 16.7% 5.6% 72.2% 55.6%
Total Population 23.0% 14.0% 72.0% 61.0%
0.0%
10.0%
20.0%
30.0%
40.0%
50.0%
60.0%
70.0%
80.0%
90.0%
Face To Face Typical Choice by Role

32
Graph 14
Graph 15
Age differences showed a higher adoption rate of less rich media among the younger age
group. Within the over sixty demographic, there were no reported instances of preference for
media other than telephone or face to face when communicating with clients. Within this same
Neg Client Pos Client Neg Peer Pos Peer
Advisory/Sales 92.7% 90.2% 92.9% 81.0%
Service/Support 87.9% 97.0% 93.9% 100.0%
Management 94.4% 100.0% 100.0% 100.0%
Total Population 90.9% 93.9% 94.0% 91.0%
0.0%
20.0%
40.0%
60.0%
80.0%
100.0%
120.0%
Composite Rich Media - Preferred Choice by Role
Neg Client Pos Client Neg Peer Pos Peer
Advisory/Sales 97.6% 90.5% 88.1% 78.6%
Service/Support 90.9% 90.9% 81.8% 84.8%
Management 88.9% 88.9% 100.0% 100.0%
Total Population 92.0% 86.0% 88.0% 82.0%
0.0%
20.0%
40.0%
60.0%
80.0%
100.0%
120.0%
Composite Rich Media - Typical Choice by Role

33
age group, there were no instances of either preferring to or typically communicating by video
conference or by letter. Email showed mild instances of preference for communicating positive
news to a peer, and minor instances of being typically used for positive client and peer, and
negative peer communication. The vast majority of communication within this age group was
face to face or telephonic. Email increased in prevalence within the forty to sixty age group.
While still relatively low in usage, email had a presence in all eight types of communication. The
most significant difference was found in the twenty to forty age group. Use of the richest media
ranged from a low of 71% (Typical Positive Peer message) to a high of 90.3% (Preferred
Positive Peer). This demographic also seemed to prefer using less rich media to communicate
Negative Client information.
Preferred Negative
Client
Preferred Positive
Client
Preferred Negative
Peer Preferred Positive Peer
>60 40 - 60 20 - 40 >60 40 - 60 20 - 40 >60 40 - 60 20 - 40 >60 40 - 60 20 - 40
In Person 68.4% 59.2% 46.7% 47.4% 40.8% 36.7% 94.7% 85.7% 77.4% 78.9% 71.4% 77.4%
Telephone 31.6% 36.7% 30.0% 52.6% 55.1% 53.3% 5.3% 12.2% 6.5% 15.8% 20.4% 12.9%
Email 0.0% 4.1% 6.7% 0.0% 4.1% 6.7% 0.0% 2.0% 12.9% 5.3% 8.2% 9.7%
Letter 0.0% 0.0% 13.3% 0.0% 0.0% 0.0% 0.0% 3.2% 3.2% 0.0% 0.0% 0.0%
Video 0.0% 0.0% 3.3% 0.0% 0.0% 3.3% 0.0% 0.0% 0.0% 0.0% 0.0% 0.0%
Table 12: Outgoing Preferred Media Preferences by Age
Typical Negative Client Typical Positive Client Typical Negative Peer Typical Positive Peer
>60 40 - 60 20 - 40 >60 40 - 60 20 - 40 >60 40 - 60 20 - 40 >60 40 - 60 20 - 40
In Person 31.6% 26.5% 9.7% 15.8% 16.3% 9.7% 84.2% 71.4% 64.5% 78.9% 57.1% 58.1%
Telephone 68.4% 67.3% 74.2% 78.9% 73.5% 67.7% 10.5% 18.4% 16.1% 10.5% 30.6% 12.9%
Email 0.0% 4.1% 9.7% 5.3% 10.2% 19.4% 5.3% 10.2% 19.4% 10.5% 12.2% 25.8%
Letter 0.0% 2.0% 6.5% 0.0% 0.0% 0.0% 0.0% 0.0% 0.0% 0.0% 0.0% 0.0%
Video 0.0% 0.0% 0.0% 0.0% 0.0% 3.2% 0.0% 0.0% 0.0% 0.0% 0.0% 3.2%
Table 13: Outgoing Typical Media Preferences by Age
Discussion
The purpose of this study was examine the relationship between Extroversion levels and
communication media preferences for incoming and outgoing messages, and whether the
potential for personal impact of the subject to be communicated influences media richness needs.

34
This study also sought to test prior research findings regarding elevated levels of Extroversion
among sales professionals when compared to other occupational roles. The overall findings
indicated a stronger relationship between media richness desires and Extroversion levels on
outgoing messages than on incoming messages. The findings also indicate a consistent desire for
rich media when communicating information of potential personal impact, regardless of
Extroversion levels. This finding lends support to Lengel and Daft’s (1988) findings of the
importance of selecting the richest medium available for messages of personal impact.
Extroversion, however, seemed to play less of a role in richness desirability for incoming
information. This finding was unexpected, and inconsistent with the researcher’s initial
supposition. Further, the data gathered seem to support prior findings of elevated Extroversion
levels among sales professionals when compared to non-sales professionals. Additional details of
each of these findings and their impact on prior research and theory follows.
Extroversion Levels
Within the Big Five construct, Conscientiousness ranked as the trait with highest average
score within the population. This was expected, as prior research indicates Conscientiousness as
the single trait required for occupational success (Barrick & Mount, 1991; Furnham & Fudge,
2008; Hurtz & Donovan, 2000; Sitser, van der Linden, & Born, 2003). Within our population,
Advisory/Sales roles seemed to show the highest average scores for Extroversion.
Advisory/Sales was the only occupational role to indicate elevated levels of Extroversion. This
finding supports prior research on occupational role and sales success (Barrick & Mount, 1991;
Conte & Gintoft, 2005; Hurtz & Donovan, 2000; Oviedo-Garcia, 2007; Sitser, van der Linden,
and Born, 2013). Additionally, though, the sales population showed the lowest level of
individuals categorized as Low Extroverts. When taken together, the lack of low extroverted

35
individuals in sales roles seems to intensify the desirability of Extroversion-related traits within
sales roles.
Within the sales role, there was little difference in Extroversion scores between male and
female. Gender, therefore, does not seem to influence Extroversion levels within the sales
population. Higher levels of Extroversion within the over sixty population is likely explained by
the higher average age of sales professionals. Sales professionals may work to an older age than
those in management or client service. This finding would explain inflated levels of Extroversion
among the older population.
Only those in Management roles exhibited Extroversion levels higher than the total
population. This could in part be attributed to successful sales professionals transitioning into
management roles. It could also indicate that managers, because of the interaction required by
their role, must exhibit behaviors common to Extroversion.
Extroversion and Incoming Message Preferences
The findings within the incoming messages section were unexpected. Issues of staffing
showed the highest level of preference for face-to-face communication, and it was virtually the
same regardless of level of Extroversion. Low Extroverts were just as likely to expect face-to-
face communication regarding staffing issues as High Extroverts. While it might seem to be a
fair assumption that since those in support staff roles were lower in Extroversion, they would
have the most interest in staffing changes, the data does not support this assumption. Perhaps
staffing issues generated the highest desire for rich media because of the impact of staffing
decisions on interpersonal relationships. If an existing positive relationship is threatened by
staffing changes, the interaction offered by the rich medium of face-to-face communication may
be more desirable. Low Extroverts were also more likely to expect face-to-face communication

36
regarding compensation changes. When examining responses to the same questions by
occupational role, those in sales roles had the highest percentage of wanting face-to-face
communication regarding staffing issues. Those in Client Service/Sales Support showed the
highest level of expectation of face-to-face communication only on the question of changes to
senior management within the organization. It would appear, then, that Extroversion itself has no
correlation to media richness in incoming messages. This finding gives a broader support to
media richness theory in that it becomes more applicable across personality types, occupations,
ages, and gender. Communication media choice seems to be of significant importance to the
nature of the message itself. This supports McLuhan’s (1964) identification of the medium
choice itself communicating a message to the receiver of information.
Extroversion and Outgoing Message Preferences
Extroversion does, however, seem to have a positive correlation to media selection for
outgoing messages. Those individuals rated highest in Extroversion seemed to be more likely to
select a rich media for communicating both positive and negative messages to peers and
customers. This finding is reinforced by the media choices of those scoring low in Extroversion.
Low Extroverts seemed significantly less likely to select rich media to communicate all
messages except positive messages to co-workers or peers. These differences seemed less
dramatic when comparing message preferences by role and by age, which supports Extroversion
as the relational variable. Prior research characterizes Extroverts as cravers of social interaction
(Brewer, 2006; McCrae & Costa, 1987; Monzani, Ripoll, & Pieró, 2014). This characteristic
seems to be supported by the findings in this study. Participants high in Extroversion preferred
communication media which offered the most opportunity for social interaction. Individuals low
in Extroversion would seek a communication medium which shelters them from actual

37
interaction. There are two factors at work in this observation. The first is the desire for social
interaction. Extroverts thrive on social encounters, while introverts (Low Extroversion) are
uncomfortable in social encounters. The second factor is the initiation of encounters. High
Extroverts were more likely to initiate interactions than Low Extroverts regardless of whether the
information was positive or negative (Frederickx & Hofmans, 2014; Sussman & Sproull, 1999).
The choice of less interactive media by Introverts can be viewed as a hesitation in initiating
interaction.

38
CHAPTER 5 – SUMMARIES AND CONCLUSIONS
Limitations of the Study
This study has some limitations. One primary limitation is the sample size. While the
sample population of 100 was acceptable, it is still relatively small. The data and analysis may
not be sufficient to draw generalized opinions as to the impact of Extroversion on
communication preferences. A larger and more diverse population would have added increased
validity to the results. Additionally, the number of participants responding as Managers,
Technical/Analytical, and Other were very small. With only eighteen managers responding, the
analysis cannot be considered as indicative of any particular traits or preferences. Respondents
identifying themselves as “Technical/Analytical” and “Other” were so small their responses
could not be measured in any meaningful way in the analyses by occupational role.
Another limitation is industry concentration. The majority of participants were from the
financial services industry. While the participants were primarily in the retail-sales segment of
this industry, by nature financial services are atypical sales constructs. Offices in this field tend
to deal with high net worth individuals and organizations, offering financial planning and
intangible assets. It is possible that Extroversion levels are specific to roles within this industry,
and do not translate into other sales organizations.
The majority of respondents came from a non-geographically diverse population. While
there were individual volunteers from Massachusetts, California, Florida, North Carolina, and
New York, the greatest majority of responses were from Kentucky, Tennessee, and West
Virginia. Although it cannot be determined which volunteers actually completed a survey, the
sample population is likely to show a concentration within mid-America. No geographic
questions were asked in the demographic section. No comparisons were able to be made based

39
on geographic location. It is possible that regional and cultural differences could influence media
choices.
Because a non-probability sample was used, it may be difficult to apply the results to the
population of sales professionals as a whole.
Calculation of levels considered high and low in Extroversion was based on responses
contained within the study population. The calculated levels for High Extroversion and Low
Extroversion may not be comparable to levels considered high and low within a larger
population, or with those populations of other studies using the same Big Five Inventory
instrument.
Recommendations for Further Study
Findings of outbound messages across age should be examined more closely. It could not
be determined if the differences in media preferences by age was a training and comfort issue or
a true preference for warmer media. A study over time of a consistent population might shed
light on whether media choices change with age, or if the choice of telephone and in person
media within the older population is related to the relatively recent advent of electronic media.
It would also be of interest to determine if richer-media choices by certain demographics
within this population was driven by desires of the client. There were no demographic questions
in the survey instrument to identify average age or media sophistication of the co-communicant
for the test population. It is possible that the changes between the preferred media for outgoing
messages and the typical media for outgoing messages were caused not by desires or abilities of
the sender, but by desires and expectations of the receiver. The sales professionals may have
preferred to communicate by telephone, but their clients may prefer communication by email.
40
The survey question regarding staffing changes resulted in the highest level of
expectation for communication by way of rich media. The responses in favor of telephone or in-
person communication surpassed that of compensation changes. Future research could
investigate the nature of communication media desires with questions other than staffing and
compensation.
Conclusions
A compilation and analysis of prior research indicated a common thread of Extroversion
among sales professionals, and a desire among those high in Extroversion for communication by
way of the richest available communication medium. The purpose of this thesis was to determine
if data supported these indications. An analysis of the data gathered offered only partial support
of the assumptions drawn from past research. While the data did indicate a commonality of
higher levels of Extroversion among sales professionals than among other occupational roles,
these Extroversion levels did not appear to impact media richness desires for incoming messages.
Extroversion levels do seem to have a correlation with choice of medium for outbound
messaging. Managers of sales professionals should bear this in mind, and offer opportunities for
ample “face time” for their salesforce.
Although the findings of this research were not fully as expected, the link between
personality and communication desires remains an important variable worthy of examination.
The more that can be learned of expectations and desires of co-communicants, the more
effectively messages can be created and conveyed. Through increasing the understanding of how
different types of people interpret words and media, individuals and organizations can better
design communication strategies.

41
References
Ahearne, M., Haumann, T., Krause,F., & Wieseke, J. (2013). It’s a matter of congruence: How
interpersonal identification between managers and salespersons shapes sales success.
Journal of the Academy of Marketing Science, 41(6), 625-648. doi: 10.1007/s11747-013-
0333-x
Barrick, M., & Mount, M. (1991). The Big Five personality dimensions and job performance: A
meta-analysis. Personal Psychology, 44(1), 1-26.
Benet-Martinez, V., & John, O.P. (1998). Los Cinco Grandes across cultures and ethnic groups:
Multitrait multimethod analyses of the Big Five in Spanish and English. Journal of
Personality and Social Psychology, (75), 729-750.
Barrick, M., Stewart, G., & Piotrowski, M. (2002). Personality and job performance: Test of the
mediating effects of motivation among sales representatives. Journal of Applied
Psychology, 87, 43-51.
Brewer, E. (2006). Extroversion/introversion communication patterns: A determination of
success in business. Quest. Retrieved from http://www.westga.edu/~bquest/
Chiaburu, D., Oh, I., Berry, C., Li, N., & Gardner, R. (2011). The Five-Factor model of
personality traits and organizational citizenship behaviors: A meta-analysis. Journal of
Applied Psychology, 96(6), 1140-1166. doi: 10.1037/a0024004
Conte, J., & Gintoft, J. (2005). Polychronicity, Big Five personality dimensions, and sales
performance. Human Performance, 18(4), 427-444.
Costa, P., McCrae, R., & Holland, J. (1984). Personality and vocational interests in an adult
sample. Journal of Applied Psychology, 69(3), 390-400.

42
Cuperman, R., & Ickes, W. (2009). BigFive predictors of behavior and perceptions in initial
dyadic interactions: Personality similarity helps extraverts and introverts, but hurts
“disagreeables”. Journal of Personality and Social Psychology, 97(4), 667-684. doi:
10.1037/a0015741
Daft, R., & Lengel, R. (1986). Organizational information requirements, media richness and
structural design. Managerial Science, 32(5), 554-571.
Daft, R., Lengel, R., & Trevino, L. (1987). Message equivocality, media selection, and manager
performance: Implications for information systems. MIS Quarterly, 11(3), 354-366.
Frederickx, S., & Hofmans, J. (2014). The role of personality in the initiation of communication
situations. Journal of Individual Differences, 35(1), 30-37. doi: 10.1027/1614-
0001/a000124
Furnham, A., & Fudge, C. (2008). The Five Factor model of personality and sales performance.
Journal of Individual Differences, 29(1), 11-16. doi: 10.1027/1614-0001.29.1.11
Griffin, E. (2012). A first look at communication theory (8th ed.). New York, NY: McGraw-Hill.
Guilford, J., & Braly, K. (1930). Extroversion and introversion. Psychological Bulletin, 27(2),
96-107. doi: 10.1037/h0073968
Hecht, M., Boster, F., & LaMer, S. (1989). The effect of extroversion and differentiation on
listener-adapted communication. Communication Reports, 2(1), 1-8.
Hurtz, G., & Donovan, J. (2000). Personality and job performance: The Big Five revisited.
Journal of Applied Psychology, 85(6), 869-879. doi: 10.1037/0021-9010.85.6.869
John, O.P, Naumann, L.P., & Soto, C.J. (2008). Paradigm shift to the integrative Big-Five Trait
taxonomy: History, measurement, and conceptual issues. In O.P. John, R.W. Robins, &

43
L.A. Pervin (Eds.), Handbook of Personality: Theory and Research (pp. 114-158). New
York, NY: Guilford Press.
John, O.P., Donahue, E.M., & Kentle, R.L. (1991). The Big Five Inventory: Versions 4a and 54.
Berkely, CA: University of California, Berkeley Institute of Personality and Social
Research.
Lengel, R., & Daft, R. (1988). The selection of communication media as an executive skill. The
Academy of Management Executive, 2(3), 225-232.
Loundsbury, J., Foster, N., Levy, J., & Gibson, L. (2014). Key personality traits of sales
managers. Work, 48(2), 239-253. doi: 10.3233/WOR-131615
MacDonnell, R., O’Neill, T., Kline, T., & Hambley, L. (2009). Bringing group-level personality
to the electronic realm: A comparison of face-to-face and virtual contexts. The
Psychologist-Manager Journal, 12(1), 1-24. doi: 10.1080/10887150802371773
McCluhan, M. (1964). The medium is the message. In Understanding Media: The Extensions of
Man. Chapter 1, p. 1-11.
McCrae, R., & Costa, P. (1987). Validation of the Five-Factor model of personality across
instruments and observers. Journal of Personality and Social Psychology, 52(1), 81-90.
McCrae, R., & Costa, P. (1989). More reasons to adopt the Five-Factor model. American
Psychologist, 44(2), 451-452. doi: 10.1037/0003.066x.44.2.451
Monzani, L., Ripoll, P., & Peiró, J. (2014). Followers’ agreeableness and extraversion and their
loyalty towards authentic leadership. Psicothema, 26(1), 69-75. doi:
10.7334/psicothema2013.67
Oviedo-Garcia, M. A., (2007). Internal validation of biodata extraversion scale for salespeople.
Social Behavior & Personality: An International Journal, 35(5), 675-691.

44
Pentland, A. (2012). The new science of building great teams. Harvard Business Review, 90(4),
60-70.
Press, A., Crockett, W., & Delia, J. (1975). Effects of cognitive complexity and of perceiver’s set
upon the organization of impressions. Journal of Personality and Social Psychology,
35(2), 865-872. doi: 10.1037/0022-3514-32.5.865
Savickas, M. (1997). Career adaptability: An integrative construct for life-span, life-space
theory. The Career Development Quarterly, 45(1), 247-259.
Schiefelbein, J. (2012). Media richness and communication in online education. Retrieved from
www.facultyfocus.com/articles/online-education/media-richness-and-communication-in-
online-education/
Sitser, T., van der Linden, D., & Born, M. (2013). Predicting sales performance criteria with
personality measures: The use of the general factor of personality, the Big Five and
narrow traits. Human Performance, 26(2), 126-149. doi: 10.1080/0895959285.
2013.765877
Sussman, S., & Sproull, L. (1999). Straight talk: Delivering bad news through electronic
communication. Information Systems Research, 10(2), 150-166.
Wille, B., & DeFruyt, F. (2014). Vocations as a source of identity: Reciprocal relations between
Big Five personality traits and RIASEC characteristics over 15 years. Journal of Applied
Psychology, 99(2), 262-281. doi: 10.1037/a0034917

45
APPENDIX A: Section 1 – Demographic Information
Please provide an answer to each question:
1. What is your current age? __________________
2. What is your gender?
Male
Female
3. Which choice most closely describes your current role within your organization?
Client Service/Sales Support
Advisory/Sales
Management
Technical/Analytical
Other
4. How long have you been in your current occupational role?
< 5 years
5 – 10 years
11 – 15 years
16 – 20 years
21 – 25 years
> 25 years
5. FOR ADVISORY/SALES ROLES ONLY: Which range reflects your current annual sales
revenue?
< 250,000
250,000 – 500,000
500,001 – 750,000
750,001 – 1,000,000
> 1,000,000
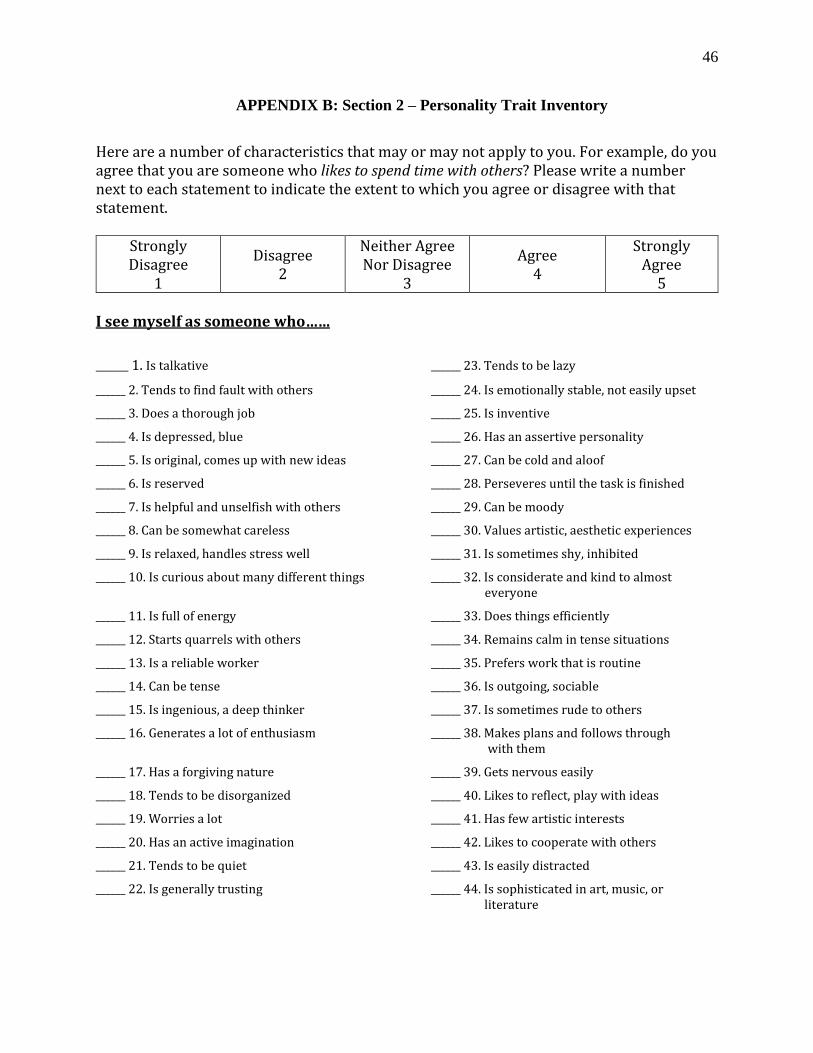
46
APPENDIX B: Section 2 – Personality Trait Inventory
Here are a number of characteristics that may or may not apply to you. For example, do you agree that you are someone who likes to spend time with others? Please write a number next to each statement to indicate the extent to which you agree or disagree with that statement.
Strongly Disagree
1
Disagree 2
Neither Agree Nor Disagree
3
Agree 4
Strongly Agree
5 I see myself as someone who……
______ 1. Is talkative ______ 23. Tends to be lazy
______ 2. Tends to find fault with others ______ 24. Is emotionally stable, not easily upset
______ 3. Does a thorough job ______ 25. Is inventive
______ 4. Is depressed, blue ______ 26. Has an assertive personality
______ 5. Is original, comes up with new ideas ______ 27. Can be cold and aloof
______ 6. Is reserved ______ 28. Perseveres until the task is finished
______ 7. Is helpful and unselfish with others ______ 29. Can be moody
______ 8. Can be somewhat careless ______ 30. Values artistic, aesthetic experiences
______ 9. Is relaxed, handles stress well ______ 31. Is sometimes shy, inhibited
______ 10. Is curious about many different things ______ 32. Is considerate and kind to almost everyone
______ 11. Is full of energy ______ 33. Does things efficiently
______ 12. Starts quarrels with others ______ 34. Remains calm in tense situations
______ 13. Is a reliable worker ______ 35. Prefers work that is routine
______ 14. Can be tense ______ 36. Is outgoing, sociable
______ 15. Is ingenious, a deep thinker ______ 37. Is sometimes rude to others
______ 16. Generates a lot of enthusiasm ______ 38. Makes plans and follows through with them
______ 17. Has a forgiving nature ______ 39. Gets nervous easily
______ 18. Tends to be disorganized ______ 40. Likes to reflect, play with ideas
______ 19. Worries a lot ______ 41. Has few artistic interests
______ 20. Has an active imagination ______ 42. Likes to cooperate with others
______ 21. Tends to be quiet ______ 43. Is easily distracted
______ 22. Is generally trusting ______ 44. Is sophisticated in art, music, or literature

47
APPENDIX C: Section 3 - Media Preferences
Please refer to these definitions of communication methods:
“In-Person Conversation” means a face-to-face conversation with your direct manager, or a person knowledgeable about the situation. “Personal Telephone Call” means a telephone call to you alone from your direct manager, or a person knowledgeable about the situation. “Personal Email” means an email addressed only to you from your direct manager, or a person knowledgeable about the situation. “Meeting or Conference Call” means an in-person meeting or a conference telephone call including you and your peers, led by your direct manager or a person knowledgeable about the situation. “Written Detailed Explanation” means a written communication suitable for delivery to all impacted people, with any appropriate documents attached.
INSTRUCTIONS: This section contains four types of messages. As you read each message type, think about the way in which you would most like to receive the message. For each message, mark your preferred method – the way in which you would MOST like to receive the information – with the number one (1), and your next preferred method with a number two (2).
Message In-Person
Conversation
Personal Telephone
Call
Personal Email
Meeting or Conference
Call
Written Detailed
Explanation
A change to your organization’s compensation plan or pay grade, which may impact you.
A change to a staffing arrangement within your office, which may impact you.
A change to your organization’s senior management structure.
Information regarding your organization’s overall annual performance.
When communicating with others, please indicate how you would want to communicate each of these message types (Choose only one).
Message In-Person
Conversation Video
Conference Telephone
Call Personal
Email Letter or
Memo
Negative news to a client or customer Positive news to a client or customer Negative news to a co-worker or peer Positive news to a co-worker or peer
When communicating with others, please indicate how you typically (most often) communicate each of these message types (Choose only one).
Message In-Person
Conversation Video
Conference Telephone
Call Personal
Email Letter or
Memo
Negative news to a client or customer Positive news to a client or customer Negative news to a co-worker or peer Positive news to a co-worker or peer

48
APPENDIX D: Participants with Big Five Inventory Scores
Resp. Age Gender Role sE sA sC sN sO
P1 31 Male Advisory/Sales 4.750 4.444 3.222 2.125 3.500
P21 45 Male Advisory/Sales 4.750 2.889 4.222 4.125 3.400
P14 51 Female Client Service/Sales Support 4.750 4.111 4.667 1.625 3.400
O64 36 Female Management 4.750 4.111 3.889 2.500 3.300
O11 36 Male Advisory/Sales 4.625 4.444 4.444 2.875 2.800
O67 37 Female Management 4.625 4.444 4.222 3.125 3.200
O24 65 Male Advisory/Sales 4.500 4.000 3.667 1.250 3.700
P11 63 Male Advisory/Sales 4.500 4.556 4.111 2.250 3.600
O55 47 Female Management 4.500 4.444 4.222 1.750 3.200
P3 45 Female Advisory/Sales 4.375 4.333 3.556 3.000 4.000
p32 72 Male Advisory/Sales 4.375 4.556 4.111 1.375 3.900
O27 33 Male Client Service/Sales Support 4.375 4.222 4.000 1.250 4.500
O31 57 Female Client Service/Sales Support 4.375 4.778 4.556 1.875 3.100
O61 24 Male Client Service/Sales Support 4.375 3.889 3.556 2.000 3.600
O23 58 Male Management 4.286 4.000 4.111 1.500 4.200
O14 50 Male Advisory/Sales 4.250 3.111 4.000 3.000 3.300
O34 40 Female Advisory/Sales 4.250 4.222 4.000 2.500 3.100
O51 63 Male Advisory/Sales 4.250 3.556 3.333 3.500 4.100
O57 46 Male Advisory/Sales 4.250 4.333 3.778 1.375 3.700
P4 58 Male Advisory/Sales 4.250 4.333 3.556 2.875 3.900
P7 76 Male Advisory/Sales 4.250 4.333 3.556 1.500 4.100
P16 62 Male Advisory/Sales 4.250 4.333 3.250 1.750 3.200
P31 38 Female Advisory/Sales 4.250 4.333 3.889 2.375 4.900
P13 32 Male Client Service/Sales Support 4.250 3.778 3.889 2.375 3.300
O50 63 Female Management 4.250 4.667 4.625 1.375 3.400
O6 47 Male Advisory/Sales 4.125 4.556 5.000 3.125 3.200
P33 64 Male Advisory/Sales 4.125 4.444 4.000 2.375 3.200
O37 32 Female Client Service/Sales Support 4.125 4.333 4.444 2.000 3.400
O33 57 Female Client Service/Sales Support 4.000 4.111 4.000 2.250 3.300
O60 49 Female Client Service/Sales Support 4.000 4.000 3.444 2.625 3.200
O19 69 Male Management 4.000 4.111 4.222 1.875 3.600
O65 38 Female Management 4.000 3.333 4.111 3.625 3.900
O20 65 Male Advisory/Sales 3.875 4.111 4.556 2.000 3.800
P15 58 Female Advisory/Sales 3.875 4.000 3.889 2.625 3.400
O26 43 Female Client Service/Sales Support 3.875 4.111 4.333 2.250 3.222
P24 53 Female Client Service/Sales Support 3.875 3.778 4.556 1.250 4.600
P5 67 Male Advisory/Sales 3.750 3.778 3.333 3.500 3.500
P6 39 Male Advisory/Sales 3.750 4.333 4.556 3.000 4.200
P17 64 Male Advisory/Sales 3.750 4.111 2.889 2.875 4.400
P29 54 Female Advisory/Sales 3.750 4.444 3.333 1.750 4.400

49
Resp. Age Gender Role sE sA sC sN sO
O25 42 Female Client Service/Sales Support 3.750 4.333 4.889 2.375 3.300
P18 47 Male Client Service/Sales Support 3.750 4.556 4.222 1.750 3.900
O32 48 Male Management 3.750 4.111 3.778 2.375 3.900
O40 60 Female Retired 3.750 3.444 3.667 3.250 3.300
P26 56 Female Technical/Analytical 3.750 3.889 4.000 3.000 3.800
O63 38 Male Advisory/Sales 3.625 3.778 4.333 2.750 3.000
O66 46 Female Advisory/Sales 3.625 3.667 3.889 3.625 3.444
P8 29 Male Advisory/Sales 3.625 4.667 4.444 1.750 3.900
P12 41 Male Advisory/Sales 3.625 3.667 3.889 2.000 3.600
O7 46 Female Client Service/Sales Support 3.625 3.667 4.222 2.875 3.500
P10 52 Female Client Service/Sales Support 3.625 4.000 4.667 2.125 3.500
O53 61 Male Management 3.625 3.556 4.000 2.125 3.700
O69 48 Female Advisory/Sales 3.571 3.222 3.889 2.125 3.700
O8 47 Male Advisory/Sales 3.500 3.222 4.333 3.125 3.667
O18 27 Female Client Service/Sales Support 3.500 3.222 3.444 2.500 3.800
O52 57 Female Client Service/Sales Support 3.500 4.778 4.889 1.750 3.800
P23 49 Female Client Service/Sales Support 3.500 4.444 4.333 3.125 2.900
O16 31 Male Technical/Analytical 3.500 3.000 4.111 2.625 4.600
O44 60 Male Advisory/Sales 3.375 3.000 4.111 3.250 3.600
P2 51 Male Advisory/Sales 3.375 1.889 4.222 3.875 3.900
O47 40 Female Client Service/Sales Support 3.375 3.889 4.667 3.500 2.700
O17 41 Male Management 3.375 4.556 4.111 2.000 3.900
O4 56 Female Management 3.375 4.667 3.333 2.250 3.600
O49 47 Female Management 3.375 4.111 4.778 3.000 4.800
P27 45 Male Other 3.375 3.667 3.333 3.375 3.400
O21 37 Male Advisory/Sales 3.250 4.000 4.333 2.375 2.300
O48 36 Male Advisory/Sales 3.250 4.333 3.444 2.375 4.100
P25 22 Male Advisory/Sales 3.250 3.111 4.000 3.000 3.778
P28 75 Male Advisory/Sales 3.250 4.000 3.222 3.750 3.300
P30 47 Male Advisory/Sales 3.250 3.556 4.889 2.750 4.000
O1 39 Female Owner 3.250 3.889 5.000 2.750 4.600
O46 71 Female Client Service/Sales Support 3.125 3.556 4.000 1.250 4.400
O30 64 Male Advisory/Sales 3.000 3.889 4.222 2.125 3.000
O38 43 Male Advisory/Sales 3.000 3.444 4.444 2.750 3.400
O68 50 Female Client Service/Sales Support 3.000 3.667 4.000 3.000 3.900
O29 35 Female Management 3.000 5.000 4.556 2.375 2.600
O35 52 Female Management 3.000 3.889 3.000 2.500 3.600
O56 37 Female Management 3.000 4.222 4.333 1.750 3.100
O28 37 Male Advisory/Sales 2.875 3.111 4.000 2.750 2.700
O45 23 Female Client Service/Sales Support 2.875 3.333 3.667 3.750 3.600
O59 56 Female Client Service/Sales Support 2.875 4.889 4.556 1.500 3.000
O15 61 Female Client Service/Sales Support 2.750 4.222 4.333 2.500 3.800

50
Resp. Age Gender Role sE sA sC sN sO
O36 57 Female Management 2.750 4.333 5.000 1.714 4.100
O9 52 Female Management 2.750 4.556 4.222 2.000 3.400
O62 49 Male Advisory/Sales 2.625 3.111 2.556 3.750 2.100
O12 34 Female Client Service/Sales Support 2.625 4.333 3.667 3.875 3.900
O41 45 Female Client Service/Sales Support 2.625 3.778 3.667 2.125 3.400
P9 55 Female Client Service/Sales Support 2.625 4.111 3.889 2.625 3.000
O5 24 Male Technical/Analytical 2.625 3.333 4.000 3.125 3.100
O58 33 Male Advisory/Sales 2.500 3.556 4.586 2.500 2.600
O22 36 Female Client Service/Sales Support 2.500 3.333 4.667 2.750 3.100
O39 52 Female Client Service/Sales Support 2.500 4.111 3.222 3.375 3.300
O2 24 Female Teacher 2.500 4.111 3.778 2.750 3.100
P20 Female Advisory/Sales 2.375 3.778 5.000 2.250 3.800
O54 47 Male Management 2.375 2.889 3.444 3.500 2.900
P22 35 Female Client Service/Sales Support 2.250 4.667 4.222 2.500 4.000
P19 44 Female Client Service/Sales Support 2.143 4.333 3.889 3.250 2.100
O10 28 Female Client Service/Sales Support 1.875 3.333 4.000 3.000 3.200
O13 51 Female Client Service/Sales Support 1.875 4.222 4.556 2.750 3.400
O43 23 Male Client Service/Sales Support 1.875 4.667 3.222 2.625 3.900
O42 59 Male Retired
O3 24 Male Technical/Analytical