Embed Size (px)
Citation preview
Exploring how alternative mapping approaches influencefireshed assessment and human community exposureto wildfire
Joe H. Scott . Matthew P. Thompson .
Julie W. Gilbertson-Day
� Springer Science+Business Media Dordrecht (outside the USA) 2015
Abstract Attaining fire-adapted human communi-
ties has become a key focus of collaborative planning
on landscapes across the western United States and
elsewhere. The coupling of fire simulation with GIS
has expanded the analytical base to support such
planning efforts, particularly through the ‘‘fireshed’’
concept that identifies areas where wildfires could
ignite and reach a human community. Previous
research has identified mismatches in scale between
localized community wildfire planning and the
broader fireshed considering patterns of wildfire
activity across landscapes. Here we expand upon this
work by investigating the degree to which alternative
geospatial characterizations of human communities
could influence assessment of community exposure
and characterization of the fireshed. We use three
methods of mapping human communities (point,
raster, and polygon) and develop three fireshedmetrics
(size, number of fires reaching houses, and number of
houses exposed), and apply this analytical framework
on a 2.3 million ha case study landscape encompassing
the Sierra National Forest in California, USA. We
simulated fire occurrence and growth using FSim for
10,000 iterations (fire seasons) at 180-m resolution.
The simulation resulted in 3.9 large fires per million ha
per year, with a mean size of 3432 ha. Results exhibit
similarities and differences in how exposure is quan-
tified, specifically indicating that polygons represent-
ing recognized community boundaries led to the
lowest exposure levels. These results highlight how
choice of the mapping approach could lead to
misestimating the scope of the problem or targeting
mitigation efforts in the wrong areas, and underscore
the importance of clarity and spatial fidelity in
geospatial data representing communities at risk.
Keywords Wildland–urban interface � Fire-adaptedcommunity � Wildfire risk � Fireshed
Introduction
Wildfires in the wildland–urban interface (WUI) pose
a significant threat to human communities, requiring
assessment and planning to support risk mitigation and
adaptation efforts (Calkin et al. 2014; Moritz et al.
2014; Williams 2013). Increased sophistication of
spatial fire spread models, risk analysis techniques,
and decision support systems (Pacheco et al. 2015;
Thompson and Calkin 2011; Thompson et al. 2015a)
has in turn led to increased sophistication of risk-based
WUI assessments in fire-prone areas (e.g., Alcasena
et al. 2015; Cova et al. 2013; Dennison et al. 2007;
Haas et al. 2013; Kalabokidis et al. 2015; Mitsopoulos
J. H. Scott � J. W. Gilbertson-Day
Pyrologix, LLC, Missoula, MT, USA
M. P. Thompson (&)
US Forest Service, Missoula, MT, USA
e-mail: [email protected]
123
GeoJournal
DOI 10.1007/s10708-015-9679-6
et al. 2015). Beyond identifying areas where flam-
mable vegetation coincides with human development,
a key feature of many of these assessments is the use of
fire modeling and GIS to explore how fire weather and
landscape conditions influence community exposure
to wildfire. Consideration of landscape-scale patterns
of fire occurrence and spread can significantly expand
the requisite spatial scale of risk mitigation planning
relative to typical scales of localized community
wildfire protection planning (Williams et al. 2012).
An emerging thread of wildfire exposure and risk
analysis is the notion of risk transmission across
landscapes and the spatial identification of sources of
exposure and risk (Ager et al. 2014a, b). In this
context, exposure relates to the spatial overlap of
potential wildfire activity within and adjacent to
human communities, while risk further incorporates
somemeasure of the effects or consequences of human
community exposure to wildfire (Thompson and
Calkin 2011). These analyses explore how the ignition
location and the size, shape, and location of simulated
fires influence patterns of exposure and potential loss.
Scott et al. (2012), for instance, modeled the growth of
unsuppressed wildfires that ignited on the Bridger-
Teton National Forest (Wyoming, USA) in order to
quantify the expected annual number of fires reaching
the WUI and the expected annual WUI area burned.
Similarly, Haas et al. (2015) merged simulated fire
perimeters with population density metrics to identify
locations along the Front Range of Colorado, USA,
where ignitions could lead to the highest impacts to
human communities.
A particularly useful transmission-based concept
for wildfire planning is the biophysical fireshed, which
is a delineated area within which ignitions can reach a
resource or asset of interest such as designated critical
habitat, a municipal watershed, or a human commu-
nity (Thompson et al. 2013; Thompson et al. 2015b).
Identifying the scale of potential exposure and risk
transmission can help land managers and homeowners
identify optimal strategies for co-managing risk and
creating fire-adapted human communities (Ager et al.
2015). From a modeling perspective, the size, shape,
and location of simulated fire perimeters will exert
critical influence on the geographic extent of the
biophysical fireshed, and these factors have been the
primary focus of analyses to date.
However, the size, shape, and location of the human
community—the focal point of the fireshed—will also
influence fireshed delineation. Human communities
are geospatially represented in three main ways:
individual structure locations using point data, gener-
alized structure locations using raster data, and
community boundaries delineated with polygons
(Calkin et al. 2011; Haas et al. 2013; Radeloff et al.
2005). To our knowledge, the degree to which
alternative geospatial characterizations of human
communities could influence assessment of the scale
of risk transmission to communities and fireshed
delineation has not been studied.
In this paper we leverage the fireshed concept to
explore how raster, polygon and point methods of
defining human communities influence calculations
of exposure to wildfire. As a case study we apply
stochastic wildfire simulation to a landscape contain-
ing the Sierra National Forest in California, USA.
We develop three main fireshed metrics—size,
number of fires reaching houses, and number of
houses exposed—and illustrate how they vary with
human community mapping method. We further
compare exposure-source maps and probabilistic
representations of number of houses exposed per
simulated fire and fire season. The ultimate aim of
this study is to yield insights and actionable infor-
mation to support risk-informed community wildfire
protection planning.
Methods
Study area
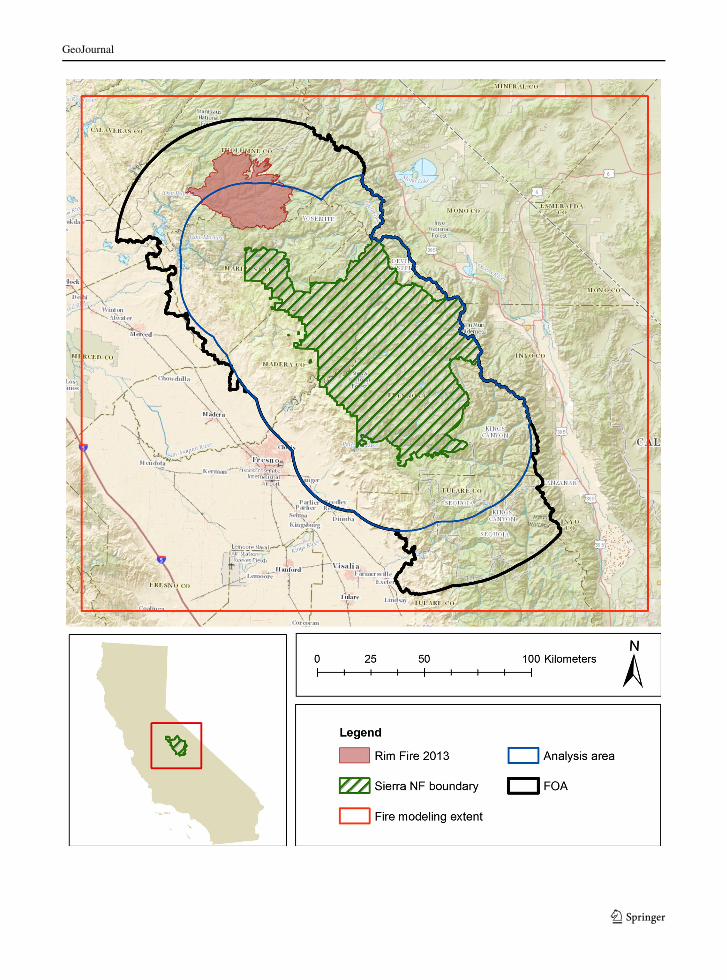
The 2.3 million ha study area consists of the Sierra
NationalForest andsurrounding landownerships, located
on the western slope of the southern Sierra Nevada
Mountains, California (Fig. 1). The eastern edge of the
study area is the Sierra Crest at nearly 4000 m elevation.
The Rim Fire of 2013 (114,008 ha)—the third largest
wildfire in California’s history—burned in the northern
portion of this study area (Fig. 1).
Vegetation and topography vary widely across the
study area. The extreme western portion of the study
area consists of urban and agricultural land in the
Central Valley. To the east and slightly higher in
cFig. 1 Overview of the study area–Sierra National Forest, Fire
Occurrence Area (FOA), and fire modeling extent. Simulated
fires originated within the FOA but could spread to any portion
of the fire modeling extent
GeoJournal
123
GeoJournal
123

elevation, non-native annual grasslands dominate the
base of the foothills. Chamise chaparral (Adenostoma
fasciculatum) and mixed chaparral (including, Quer-
cus, Ceanothus and Arctostaphylos species) are found
in the foothills. The chaparral mixes with foothill
woodlands populated with foothill pine (Pinus sabini-
ana) and blue oak (Quercus douglasii). A mixed-
conifer forest, consisting primarily of ponderosa pine
(Pinus ponderosa), sugar pine (Pinus lambertiana),
incense cedar (Libocedrus decurrens), Douglas-fir
(Pseudotsuga menziesii), dominates the mid eleva-
tions of the western slope of the Sierra. Forests
dominated by white fir (Abies concolor) mixed with
species from the mixed-conifer forest, and red fir
(Abies magnifica) mixed with lodgepole pine (Pinus
contorta) are found above the mixed-conifer forests.
Finally, forests of lodgepole pine, limber pine (Pinus
flexilis), whitebark pine (Pinus albicaulis) and foxtail
pine (Pinus balfouriana) are found near timberline in
the eastern portion of the study area.
Wildfire simulation
We used the FSim large-fire simulator (Finney et al.
2011) to generate a large-fire event set—a set of
thousands of simulated wildfire perimeters that col-
lectively represent a complete set of possible large-fire
events, each with known probability of occurrence
(Scott and Thompson 2015). FSim is a comprehensive
wildfire occurrence, growth and suppression simula-
tion system that pairs a wildfire growth model (Finney
1998, 2002) and a model of large-fire ignition
probability with simulated weather streams in order
to simulate wildfire occurrence and growth for thou-
sands of fire seasons.
We used two of FSim’s outputs in this study—a
raster of burn probability (BP) and polygons, in ESRI
Shapefile format, representing the final perimeter of
each simulated wildfire. BP for a pixel is calculated as
the number of times the pixel burned divided by the
number of simulation iterations. FSim produces an
annual BP result because an iteration represents a
whole fire season. An attribute table specifying certain
characteristics of each simulated wildfire—its start
location and date, duration, final size, and other
characteristics—is included with the shapefile. Fires
occurring during the same simulated fire season are
identified through attributes assigned to each fire so
that the total area burned during an entire fire season
can be produced as well as individual-fire results. Fire
intensity (flame-length class) that occurred within a
perimeter is not recorded.
We used FSim to simulate 10,000 fire seasons at
180-m resolution, using the Scott and Reinhardt
(2001) crown fire modeling method. The number and
duration of simulated wildfires are not direct inputs to
the model, but instead are the result of the simulation
of weather and large-fire occurrence based on histor-
ical data. FSim requires a number of additional spatial
and tabular inputs, described below.
Fire modeling landscape
Among FSim’s spatial inputs is a fire modeling
landscape file (LCP)—a raster representation of
surface fuel (Scott and Burgan 2005), canopy fuel
(canopy base height and canopy bulk density), forest
vegetation (canopy cover and stand height) and
topography (slope, aspect and elevation) across the
fire simulation area. We used LANDFIRE version
1.3.0 (also known as ‘‘LANDFIRE 2012’’), in NAD83
UTM11N geographic projection, as the source for the
LCP (Ryan and Opperman 2013). We resampled the
data layers from their native 30-m grid cell resolution
to a 180-m cell size using the nearest neighbor method,
then assembled a 180-m cell size.
Historical large-fire occurrence data
For historical fire occurrence inputs we used the Short
(2014) Fire Occurrence Database (FOD), second
edition, which covers the 22-year period 1992–2013.
When parameterizing and calibrating FSim, we are
only interested in the relatively few ‘‘large’’ (or
escaped) wildfires that account for the overwhelming
majority (typically more than 90 %) of the total area
burned (Strauss et al. 1989). We used a threshold of
100 ha (247 ac) to identify a large fire. A size
threshold is necessary to both parameterize and
calibrate FSim. FSim’s algorithms and sub-model
components are designed to simulate the relatively
small number of fires that escape initial control efforts
and become large, spreading for days to weeks, and
even months.
Anthropogenic fires accounted for 73 % of the total
area burned in the study area from 1992 to 2013.
However, the relative proportion of anthropogenic to
naturally ignited wildfires varied significantly across
GeoJournal
123
the study area. In the foothills of the western portion of
the study area anthropogenic wildfires accounted for
more than 95 % of the area burned. In the mountainous
eastern portion of the study area, which has relatively
little human influence, natural ignitions were respon-
sible for more than 75 % of the area burned.
Historical weather data
FSim requires three weather-related inputs: monthly
distributions of wind speed and direction, live and
dead fuel moisture content by year-round percentile of
the Energy Release Component variable of the
National Fire Danger Rating System (NFDRS; cita-
tion) for fuel model G (ERC-G) class, and seasonal
trend (daily) in the mean and standard deviation of
ERC-G. We used two data sources for these weather
inputs. For the wind speed and direction distributions
we used the hourly (1200–2000 h) 10-min average
values recorded at the Trimmer RAWS (NWS
ID#044510) for the period 1990–2012. For ERC we
sampled from a spatial dataset derived from North
American Regional Reanalysis (NARR) 4-km ERC-
G dataset for the period 1992–2012 (M. Jolly,
Ecologist, personal communication).
The majority of large-fire area burned (90 %)
occurs with fires that ignite between late June and
mid-September. During that time, the 10-min average
wind speeds (6.1-m above ground) are rarely greater
than 20 km/h (as measured at the Trimmer remote
automated weather station). At the trimmer RAWS,
winds are southwest, west and northwest 70 % of the
time during the large-fire season. Fine dead fuel
moisture content during the large-fire season varied
across the study area from a low of 2–3 % for exposed
fuel at low elevations during periods of very dry
weather (ERC-G[ 97th percentile, to highs of 6–9 %
for sheltered fuel at higher elevations during moder-
ately dry conditions (when ERC-G was between the
80th and 90th percentile).
FSim fire occurrence inputs
FSim requires an FDist input file that specifies three
inputs: (1) logistic regression coefficients that relate the
probability of a large-fire day to ERC-G, (2) Acre-
Fract—the ratio of the Fire Occurrence Area (FOA)
size used in the FOD to the FOA size within the
landscape—and (3) the distribution of the number of
large fires per large-fire day. The AcreFract input was
used in early implementations of FSim to account for
the lack of complete fire occurrence data across an LCP.
Until publication of the Short (2014) FOD, it was
common to have historical fire records for only a
fraction of the fire modeling landscape, so a logistic
regression model of fire occurrence would under-
simulate occurrence for thewhole landscape.AcreFract
is an adjustment factor on the probability of a large-fire
day to make up for this lack of data. If fire occurrence
data were available for only half of the LCP, then
AcreFract = 0.5, and FSim effectively doubles the
number of simulated fires to make up for the effect of
the missing data on the logistic regression coefficients.
The FOA—the area within which we simulated fire
starts—includes a 60-km buffer around the National
Forest to the north/northwest and south, and a 30-km
buffer to the west. A buffer was not added to the east
because the forest boundary at that location is the
Sierra Crest, and fires do not traverse the boundary
from the east to the west. Buffers are necessary to
account for fires that ignite outside of but can spread
into the study area; buffer sizes were informed by
analyzing past fires in the area and also by our
experience with FSim.
To generate the FDist inputs we selected from the
FOD only those large fires (C100 ha) that started
within the FOA (Fig. 1) and then generated logistic
regression coefficients that estimate the probability
of a large-fire day in relation to ERC-G as sampled
from the NARR 4-km ERC-G at the location of the
Trimmer RAWS. The FOA size in the FOD is
identical to the FOA on the landscape, so Acre-
Fract = 1.0. We also tabulated a frequency distri-
bution of the number of large fires that occurred on
each large-fire day.
Based on the historical large-fire start locations
archived in the FOD, we used the Kernel Density tool
of ERSI ArcGIS (with a 30 km search neighborhood
and a 2 km pixel size) to create an ignition density grid
(IDG). FSim uses this IDG to locate simulated fires on
the landscape, placing more wildfires where the
density of historical large wildfires is higher. Because
we wanted to simulate only fires starting within the
FOA, we set the IDG value outside the FOA to 0 so
that FSim would not start any fires there. Because our
LCP is larger than the FOA, a simulated fire could
spread outside the FOA without immediately encoun-
tering the edge of the LCP. This buffer outside of the
GeoJournal
123
FOA is important for comparing the simulated fire-
size distribution to the historical.
Model calibration
We began by first calibrating, to the extent possible,
the simulated large-fire size distribution and mean
large-fire size compared to the historical. We accom-
plished this fire-size calibration using a combination
of inputs—rate-of-spread adjustment factors by fuel
model, dead and live fuel moisture contents by fuel
model and percentile ERC-G bin, and perimeter
trimming factor. We did not limit the maximum size
of simulated wildfires.
After calibrating the fire-size distribution, we then
calibrated the annual number of large-fire occurrences.
FSim’s fire occurrence inputs (logistic regression
coefficients) are designed to simulate the probability
of a large-fire day in relation to historical ERC-
G. However, there are two known biases in FSim that
can result in an under-simulation of the number of
large fires compared to historical. First, FSim only
ignites its simulated fires at or above the 80th
percentile ERC-G, whereas historically, some per-
centage of large fires may have started when the ERC-
G was below the 80th percentile. Those historical fires
are represented in the logistic regression coefficients
but are missing from the simulation. Second, the fire
occurrence module of FSim implicitly assumes that
each simulated fire becomes a large fire, meaning that
it grows to at least the large-fire threshold of 100 ha. In
the simulations, some percentage of simulated fires
does not reach this threshold fire size. Those fires, too,
are missing from the simulation.
It is easy to overcome these biases using the
AcreFract input. Modifying the default AcreFract by
(1) the fraction of historical large fires that started
above the 80th percentile ERC-G and (2) by the
fraction of all simulated fires that reached the large-fire
size threshold gives an adjusted AcreFract that de-
biases the number of large fires in the simulation
AcreFractadjusted ¼ Acrefractdefault �NHist80
NHistAll
� NSimLarge
NSimAll
where NHist80 is the number of historical large-fire
days for which ERC-G was at or above the 80th
percentile, NHistAll is the total number historical large-
fire days, NSimLarge is the number of simulated fires
that reached the large-fire threshold, and NSimAll is the
total number of simulated fires.
Characterizing the human community
We used three datasets to characterize the human
community in the study area. The Westwide Wildfire
Risk Assessment (WWRA) produced a Where People
Live (WPL) raster that represents the density of houses
(houses/km2) at a native cell size of 30 m (Oregon
Department of Forestry 2013). Each WPL pixel
therefore covers 900 m2, or 0.0009 km2. We multi-
plied the WPL density value by 0.0009 to produce an
estimate of the number of houses per 30-m pixel.
Houses
pixel¼ Houses
km2� 0:0009 km
2
pixel
WPL is based on the LandScan population database
from the Oakridge National Laboratory. LandScan
represents spatially distributed population counts by
the 2010 U.S. Census within census blocks polygons
based on advanced modeling approaches which
incorporate remotely sensed data such as nighttime
lights and high-resolution imagery, along with local
spatial data (Oregon Department of Forestry 2013).
We then found polygons representing 37 recog-
nized communities, according to the U.S. Census
Bureau’s Incorporated Places and Census Designated
Places data layer (U.S. Census 2014), located wholly
or partially within the study area. These places are
cities, towns, or Census Designated Places which
provided a delineated boundary of concentrated pop-
ulations, but are not legally incorporated in the state
(U.S. Census 2014). We clipped these community
polygons to the study area boundary, and then
extracted the adjusted WPL values raster generated
above. By definition, ‘‘communities only’’ population
counts will be less than the WPL dataset.
Finally, we obtained cadastral data (parcel cen-
troids) for the study area for portions of Fresno,
Madera, Mariposa, Tulare, and Tuolumne counties,
collected as part of the Federal Geographic Data
Committee cadastral subcommittee efforts to map
parcel data for 11 western states for fire management
purposes (Calkin et al. 2011). Each improved-parcel
centroid was taken to represent a single house (though
in actuality improvement value could be for more than
one structure per parcel).
GeoJournal
123
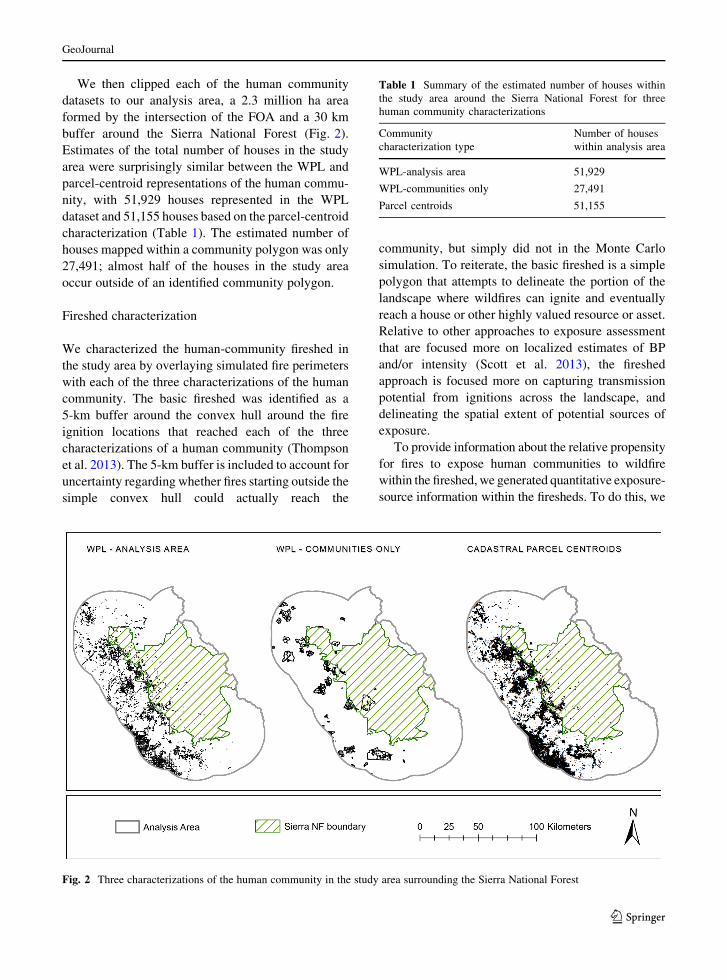
We then clipped each of the human community
datasets to our analysis area, a 2.3 million ha area
formed by the intersection of the FOA and a 30 km
buffer around the Sierra National Forest (Fig. 2).
Estimates of the total number of houses in the study
area were surprisingly similar between the WPL and
parcel-centroid representations of the human commu-
nity, with 51,929 houses represented in the WPL
dataset and 51,155 houses based on the parcel-centroid
characterization (Table 1). The estimated number of
houses mapped within a community polygon was only
27,491; almost half of the houses in the study area
occur outside of an identified community polygon.
Fireshed characterization
We characterized the human-community fireshed in
the study area by overlaying simulated fire perimeters
with each of the three characterizations of the human
community. The basic fireshed was identified as a
5-km buffer around the convex hull around the fire
ignition locations that reached each of the three
characterizations of a human community (Thompson
et al. 2013). The 5-km buffer is included to account for
uncertainty regarding whether fires starting outside the
simple convex hull could actually reach the
community, but simply did not in the Monte Carlo
simulation. To reiterate, the basic fireshed is a simple
polygon that attempts to delineate the portion of the
landscape where wildfires can ignite and eventually
reach a house or other highly valued resource or asset.
Relative to other approaches to exposure assessment
that are focused more on localized estimates of BP
and/or intensity (Scott et al. 2013), the fireshed
approach is focused more on capturing transmission
potential from ignitions across the landscape, and
delineating the spatial extent of potential sources of
exposure.
To provide information about the relative propensity
for fires to expose human communities to wildfire
within the fireshed, we generated quantitative exposure-
source information within the firesheds. To do this, we
Fig. 2 Three characterizations of the human community in the study area surrounding the Sierra National Forest
Table 1 Summary of the estimated number of houses within
the study area around the Sierra National Forest for three
human community characterizations
Community
characterization type
Number of houses
within analysis area
WPL-analysis area 51,929
WPL-communities only 27,491
Parcel centroids 51,155
GeoJournal
123
summed the number of houses occurring within each
simulated fire perimeter, and then attributed those
measures back to the fire’s start location. For the WPL
raster, we estimated the total number of houses exposed
to each wildfire. For community polygons, we esti-
mated the total number of houses within the community
polygon, also based on theWPL raster. For the cadastral
data, we estimated the number of improved-parcel
centroids exposed to each fire.
With these three attributes now associated with the
simulated fire start locations, we generated spatial
exposure-source results by summarizing the mean
number of houses exposed per simulated wildfire, for
each measure of human community. We summarized
results for ignitions occurring within sixth-level
hydrologic units, the finest level available across the
entire analysis area.
Results
Historical occurrence
There were 200 historical large-fire occurrences
within the 2.3 million ha FOA during the period
1992–2013, for a mean of 3.93 large fires per million
ha per year. Large fires represented only 1.6 % of all
fires but accounted for 93 % of the area burned. Those
large fires occurred on 167 large-fire days, for an
average of 1.2 large fires per large-fire day. The mean
annual area burned by those large fires was 12,472 ha/
year. The mean large-fire size was therefore 1372 ha.
The arithmetic mean of the common logarithm of
historical large-fire size was 2.61, for a characteristic
fire size of 102.61, or 410 ha (Lehsten et al. 2014).
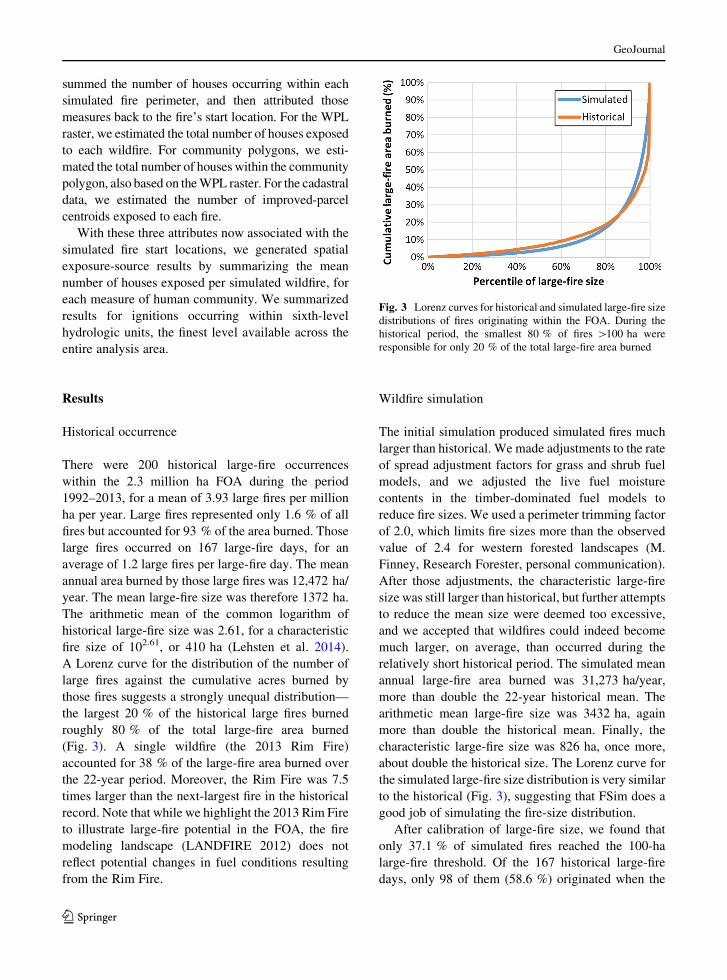
A Lorenz curve for the distribution of the number of
large fires against the cumulative acres burned by
those fires suggests a strongly unequal distribution—
the largest 20 % of the historical large fires burned
roughly 80 % of the total large-fire area burned
(Fig. 3). A single wildfire (the 2013 Rim Fire)
accounted for 38 % of the large-fire area burned over
the 22-year period. Moreover, the Rim Fire was 7.5
times larger than the next-largest fire in the historical
record. Note that while we highlight the 2013 Rim Fire
to illustrate large-fire potential in the FOA, the fire
modeling landscape (LANDFIRE 2012) does not
reflect potential changes in fuel conditions resulting
from the Rim Fire.
Wildfire simulation
The initial simulation produced simulated fires much
larger than historical. We made adjustments to the rate
of spread adjustment factors for grass and shrub fuel
models, and we adjusted the live fuel moisture
contents in the timber-dominated fuel models to
reduce fire sizes. We used a perimeter trimming factor
of 2.0, which limits fire sizes more than the observed
value of 2.4 for western forested landscapes (M.
Finney, Research Forester, personal communication).
After those adjustments, the characteristic large-fire
size was still larger than historical, but further attempts
to reduce the mean size were deemed too excessive,
and we accepted that wildfires could indeed become
much larger, on average, than occurred during the
relatively short historical period. The simulated mean
annual large-fire area burned was 31,273 ha/year,
more than double the 22-year historical mean. The
arithmetic mean large-fire size was 3432 ha, again
more than double the historical mean. Finally, the
characteristic large-fire size was 826 ha, once more,
about double the historical size. The Lorenz curve for
the simulated large-fire size distribution is very similar
to the historical (Fig. 3), suggesting that FSim does a
good job of simulating the fire-size distribution.
After calibration of large-fire size, we found that
only 37.1 % of simulated fires reached the 100-ha
large-fire threshold. Of the 167 historical large-fire
days, only 98 of them (58.6 %) originated when the
Fig. 3 Lorenz curves for historical and simulated large-fire size
distributions of fires originating within the FOA. During the
historical period, the smallest 80 % of fires [100 ha were
responsible for only 20 % of the total large-fire area burned
GeoJournal
123
ERC-G was at or above the 80th percentile. We then
calculated an adjusted AcreFract per the equation
below:
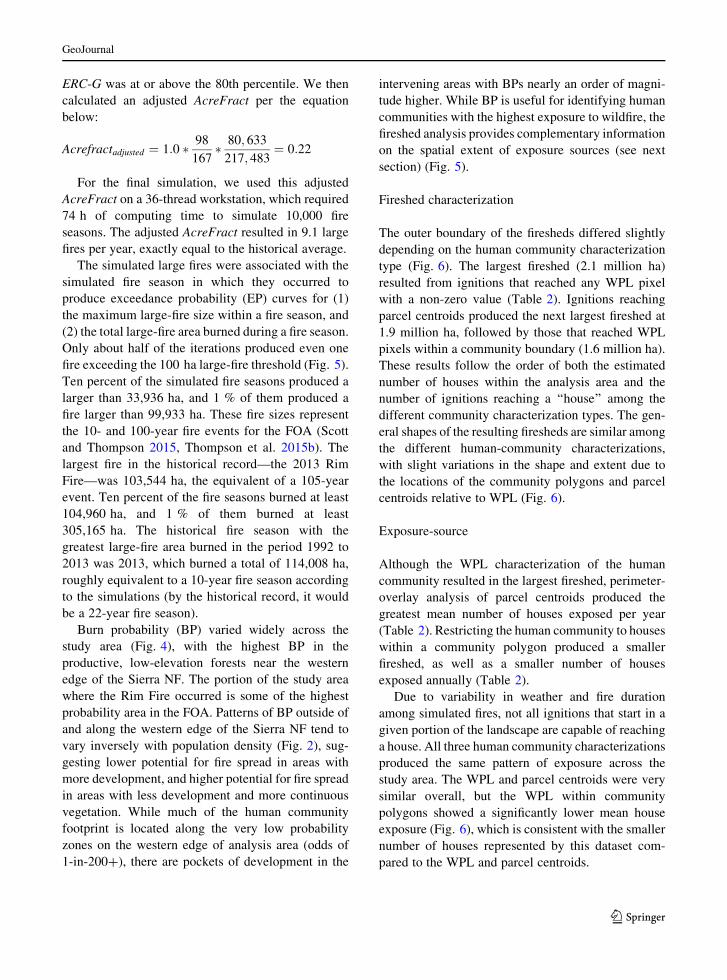
Acrefractadjusted ¼ 1:0 � 98
167� 80; 633
217; 483¼ 0:22
For the final simulation, we used this adjusted
AcreFract on a 36-thread workstation, which required
74 h of computing time to simulate 10,000 fire
seasons. The adjusted AcreFract resulted in 9.1 large
fires per year, exactly equal to the historical average.
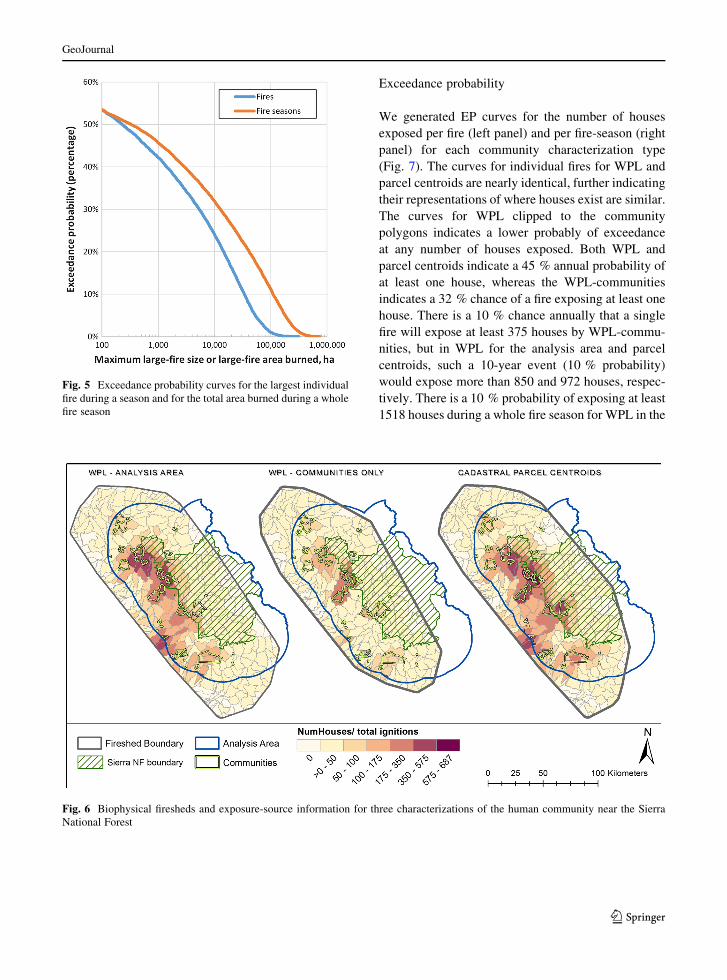
The simulated large fires were associated with the
simulated fire season in which they occurred to
produce exceedance probability (EP) curves for (1)
the maximum large-fire size within a fire season, and
(2) the total large-fire area burned during a fire season.
Only about half of the iterations produced even one
fire exceeding the 100 ha large-fire threshold (Fig. 5).
Ten percent of the simulated fire seasons produced a
larger than 33,936 ha, and 1 % of them produced a
fire larger than 99,933 ha. These fire sizes represent
the 10- and 100-year fire events for the FOA (Scott
and Thompson 2015, Thompson et al. 2015b). The
largest fire in the historical record—the 2013 Rim
Fire—was 103,544 ha, the equivalent of a 105-year
event. Ten percent of the fire seasons burned at least
104,960 ha, and 1 % of them burned at least
305,165 ha. The historical fire season with the
greatest large-fire area burned in the period 1992 to
2013 was 2013, which burned a total of 114,008 ha,
roughly equivalent to a 10-year fire season according
to the simulations (by the historical record, it would
be a 22-year fire season).
Burn probability (BP) varied widely across the
study area (Fig. 4), with the highest BP in the
productive, low-elevation forests near the western
edge of the Sierra NF. The portion of the study area
where the Rim Fire occurred is some of the highest
probability area in the FOA. Patterns of BP outside of
and along the western edge of the Sierra NF tend to
vary inversely with population density (Fig. 2), sug-
gesting lower potential for fire spread in areas with
more development, and higher potential for fire spread
in areas with less development and more continuous
vegetation. While much of the human community
footprint is located along the very low probability
zones on the western edge of analysis area (odds of
1-in-200?), there are pockets of development in the
intervening areas with BPs nearly an order of magni-
tude higher. While BP is useful for identifying human
communities with the highest exposure to wildfire, the
fireshed analysis provides complementary information
on the spatial extent of exposure sources (see next
section) (Fig. 5).
Fireshed characterization
The outer boundary of the firesheds differed slightly
depending on the human community characterization
type (Fig. 6). The largest fireshed (2.1 million ha)
resulted from ignitions that reached any WPL pixel
with a non-zero value (Table 2). Ignitions reaching
parcel centroids produced the next largest fireshed at
1.9 million ha, followed by those that reached WPL
pixels within a community boundary (1.6 million ha).
These results follow the order of both the estimated
number of houses within the analysis area and the
number of ignitions reaching a ‘‘house’’ among the
different community characterization types. The gen-
eral shapes of the resulting firesheds are similar among
the different human-community characterizations,
with slight variations in the shape and extent due to
the locations of the community polygons and parcel
centroids relative to WPL (Fig. 6).
Exposure-source
Although the WPL characterization of the human
community resulted in the largest fireshed, perimeter-
overlay analysis of parcel centroids produced the
greatest mean number of houses exposed per year
(Table 2). Restricting the human community to houses
within a community polygon produced a smaller
fireshed, as well as a smaller number of houses
exposed annually (Table 2).
Due to variability in weather and fire duration
among simulated fires, not all ignitions that start in a
given portion of the landscape are capable of reaching
a house. All three human community characterizations
produced the same pattern of exposure across the
study area. The WPL and parcel centroids were very
similar overall, but the WPL within community
polygons showed a significantly lower mean house
exposure (Fig. 6), which is consistent with the smaller
number of houses represented by this dataset com-
pared to the WPL and parcel centroids.
GeoJournal
123
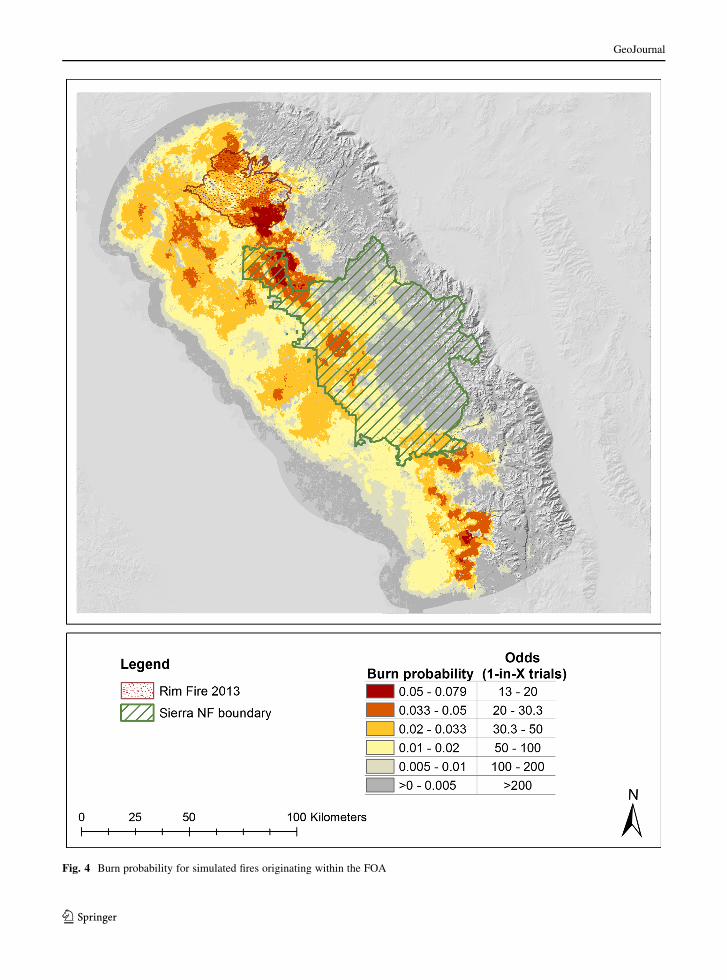
Fig. 4 Burn probability for simulated fires originating within the FOA
GeoJournal
123
Exceedance probability
We generated EP curves for the number of houses
exposed per fire (left panel) and per fire-season (right
panel) for each community characterization type
(Fig. 7). The curves for individual fires for WPL and
parcel centroids are nearly identical, further indicating
their representations of where houses exist are similar.
The curves for WPL clipped to the community
polygons indicates a lower probably of exceedance
at any number of houses exposed. Both WPL and
parcel centroids indicate a 45 % annual probability of
at least one house, whereas the WPL-communities
indicates a 32 % chance of a fire exposing at least one
house. There is a 10 % chance annually that a single
fire will expose at least 375 houses by WPL-commu-
nities, but in WPL for the analysis area and parcel
centroids, such a 10-year event (10 % probability)
would expose more than 850 and 972 houses, respec-
tively. There is a 10 % probability of exposing at least
1518 houses during a whole fire season for WPL in the
Fig. 5 Exceedance probability curves for the largest individual
fire during a season and for the total area burned during a whole
fire season
Fig. 6 Biophysical firesheds and exposure-source information for three characterizations of the human community near the Sierra
National Forest
GeoJournal
123
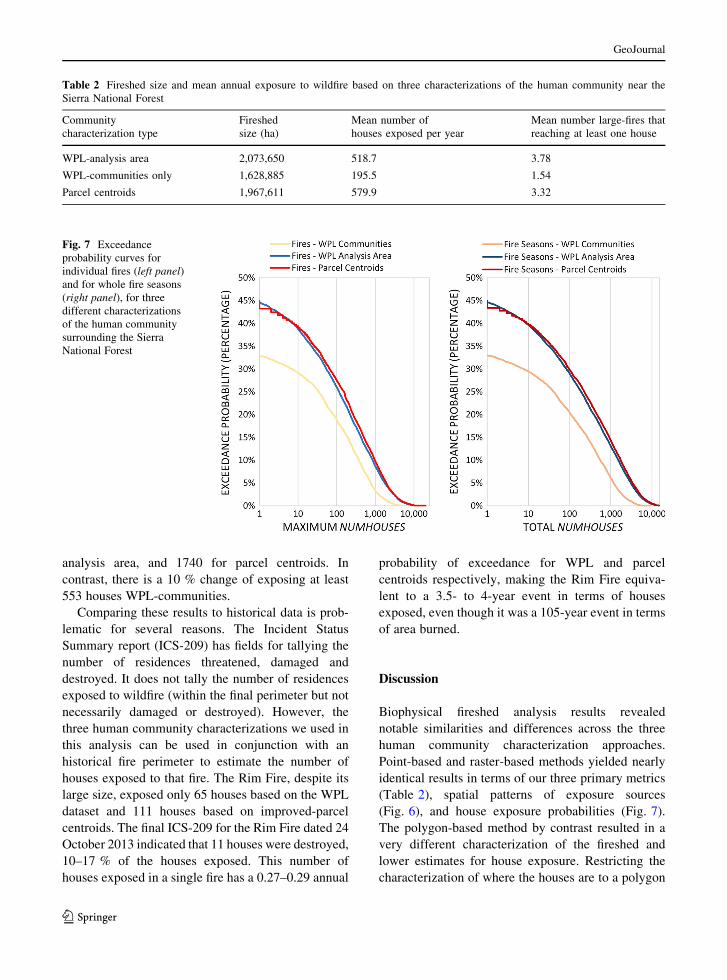
analysis area, and 1740 for parcel centroids. In
contrast, there is a 10 % change of exposing at least
553 houses WPL-communities.
Comparing these results to historical data is prob-
lematic for several reasons. The Incident Status
Summary report (ICS-209) has fields for tallying the
number of residences threatened, damaged and
destroyed. It does not tally the number of residences
exposed to wildfire (within the final perimeter but not
necessarily damaged or destroyed). However, the
three human community characterizations we used in
this analysis can be used in conjunction with an
historical fire perimeter to estimate the number of
houses exposed to that fire. The Rim Fire, despite its
large size, exposed only 65 houses based on the WPL
dataset and 111 houses based on improved-parcel
centroids. The final ICS-209 for the Rim Fire dated 24
October 2013 indicated that 11 houses were destroyed,
10–17 % of the houses exposed. This number of
houses exposed in a single fire has a 0.27–0.29 annual
probability of exceedance for WPL and parcel
centroids respectively, making the Rim Fire equiva-
lent to a 3.5- to 4-year event in terms of houses
exposed, even though it was a 105-year event in terms
of area burned.
Discussion
Biophysical fireshed analysis results revealed
notable similarities and differences across the three
human community characterization approaches.
Point-based and raster-based methods yielded nearly
identical results in terms of our three primary metrics
(Table 2), spatial patterns of exposure sources
(Fig. 6), and house exposure probabilities (Fig. 7).
The polygon-based method by contrast resulted in a
very different characterization of the fireshed and
lower estimates for house exposure. Restricting the
characterization of where the houses are to a polygon
Table 2 Fireshed size and mean annual exposure to wildfire based on three characterizations of the human community near the
Sierra National Forest
Community
characterization type
Fireshed
size (ha)
Mean number of
houses exposed per year
Mean number large-fires that
reaching at least one house
WPL-analysis area 2,073,650 518.7 3.78
WPL-communities only 1,628,885 195.5 1.54
Parcel centroids 1,967,611 579.9 3.32
Fig. 7 Exceedance
probability curves for
individual fires (left panel)
and for whole fire seasons
(right panel), for three
different characterizations
of the human community
surrounding the Sierra
National Forest
GeoJournal
123
representing census-designated places eliminated
almost half of the houses from the analysis. For this
specific case study, community polygons are inade-
quate representations of where houses actually exist
across a large landscape.
That mapping human communities with a smaller
collective footprint would lead to lower exposure
levels might appear self-evident, but carries significant
implications. First, the magnitude of the problem
might be understated, leading to insufficient invest-
ments of time and resources in mitigation. Second,
prioritization of exposure sources on the landscape
might be targeting the wrong areas, limiting the
effectiveness and efficiency of mitigation measures
like fuel treatments. This latter point is particularly
noticeable in Fig. 6, where the identification of
sources of ignitions that reach homes is highly variable
across the mapping methods. Using the polygon
approach, planning efforts might fail to consider
investing in mitigation within a high risk-source area
along the southwestern flank of the fireshed.
Ager et al. (2015) caution that the scale of
community wildfire protection planning is often
mismatched with the scale of landscape risk analysis.
Our findings build from this critique and highlight the
importance of identifying the correct scale for land-
scape risk analysis. While analysis of potential
wildfire threats to community boundaries likely pro-
vides utility for a variety of planning purposes (e.g.,
for local agencies and fire districts), it may come at the
expense of identifying more socially optimal mitiga-
tion investments if analyses do not also consider a
more comprehensive representation of house loca-
tions. We should note that this critique speaks only to
the biophysical dimensions of fireshed planning, and
not to social issues related to capacity, collaboration,
communication, or education. Our point is that it is
important to have a complete and accurate under-
standing of landscape scale exposure and risk trans-
mission before deciding the scale at which
collaborative planning and co-management of risk
will take place.
Our analysis is strategic rather than tactical in
nature, intended to provide a ‘‘big picture’’ overview
of human community exposure to wildfire. The
methods we developed could be used at a finer scale,
and our analysis suggests two things to support that
work: (1) which communities should receive the first
such attention; and (2) which characterization of the
human community may be most appropriate for that
finer-scale analysis. At the broader scale, our analysis
can help identify which areas and landowners com-
prise the greatest exposure sources, and whether
options like hazardous fuel reduction treatments are
appropriate and feasible in these areas. For instance,
Fig. 6 indicates that most sources of exposure lie
outside the boundary of the Sierra NF, suggesting that
fuel treatments on the federal estate alone may not be
likely to significantly reduce human community
exposure and risk. Accurately characterizing the
nature of the problem is a critical first step in
mitigation efforts, and the fireshed analysis provides
richer information on sources of exposure relative to
focusing on localized exposure using only BP outputs.
However, our analysis also reveals some limitations
of the biophysical fireshed concept. If we were to
change the size, shape, or location of the fire modeling
landscape, it is possible that we would change the
extent of mapped human communities, leading to
different spatial characterizations of firesheds and
exposure sources. This issue is likely more problem-
atic as population is more continuously connected in
fire-prone areas, for instance the Front Range of
Colorado, USA. In such cases a stronger focus on
identifying exposure and risk sources is likely more
useful than the actual size and shape of the fireshed
itself. The ratios of the number of houses exposed per
total ignitions within a watershed (Fig. 6) could
therefore offer more readily actionable information
for mitigation planning. This summarization approach
is similar to other fireshed-related work characterizing
exposure sources according to the distance from the
resource or asset of interest (Thompson et al. 2013).
The fireshed approach likely still has great utility
however for other resources and assets with more
readily definable boundaries, such as municipal
watersheds and critical infrastructure.
Future work could begin by applying similar
exposure source methods to other landscapes, and
seeing if similar relationships between human com-
munity characterization hold. WPL is available for 17
western states (Oregon Department of Forestry 2013),
parcel data is available for approximately 70 % of the
United States (Calkin et al. 2011), and a raster dataset
similar to WPL is available nationwide (Haas et al.
2013). Analysis could actually identify risk sources by
incorporating susceptibility to fire (Thompson et al.
2015b; Scott and Thompson 2015). Additional
GeoJournal
123
analysis could explore how the size and shape of
firesheds change seasonally and under alternative fire
and fuel management scenarios.
Acknowledgments The Rocky Mountain Research Station
and the National Fire Decision Support Center supported this
research.
Compliance with ethical standards
Conflict of interest None.
Human and animal rights This article does not contain any
studies with human or animal subjects.
References
Ager, A. A., Day, M. A., Finney, M. A., Vance-Borland, K., &
Vaillant, N. M. (2014a). Analyzing the transmission of
wildfire exposure on a fire-prone landscape in Oregon,
USA. Forest Ecology and Management, 334(15 December
2014), 377–390.
Ager, A. A., Day, M. A., McHugh, C. W., Short, K., Gilbertson-
Day, J., Finney, M. A., et al. (2014b). Wildfire exposure
and fuel management on western US national forests.
Journal of Environmental Management, 145(1 December
2014), 54–70.
Ager, A. A., Kline, J. D., & Fischer, A. P. (2015). Coupling the
biophysical and social dimensions of wildfire risk to
improve wildfire mitigation planning. Risk Analysis, 35(8),
1393–1406.
Alcasena, F., Salis, M., Ager, A., Arca, B., Molina, D., & Spano,
D. (2015). Assessing Landscape Scale wildfire exposure
for highly valued resources in a Mediterranean area. En-
vironmental Management, 55(5), 1200–1216.
Calkin, D. E., Cohen, J. D., Finney, M. A., & Thompson, M. P.
(2014). How risk management can prevent future wildfire
disasters in the wildland–urban interface. Proceedings of
the National Academy of Sciences, 111(2), 746–751.
Calkin, D. E., Rieck, J. D., Hyde, K. D., & Kaiden, J. D. (2011).
Built structure identification in wildland fire decision
support. International Journal of Wildland Fire, 20(1),
78–90.
Cova, T. J., Theobald, D. M., Norman, J. B, I. I. I., & Siebeneck,
L. K. (2013). Mapping wildfire evacuation vulnerability in
the western US: The limits of infrastructure. GeoJournal,
78(2), 273–285.
Dennison, P. E., Cova, T. J., &Mortiz, M. A. (2007). WUIVAC:
A wildland–urban interface evacuation trigger model
applied in strategic wildfire scenarios. Natural Hazards,
41(1), 181–199.
Finney, M. A. (1998). FARSITE: Fire area simulator—Model
development and evaluation. Research paper RMRS-RP-4.
Fort Collins: U.S. Department of Agriculture, Forest Ser-
vice, Rocky Mountain Research Station.
Finney, M. A. (2002). Fire growth using minimum travel time
methods. Canadian Journal of Forest Research, 32(8),
1420–1424.
Finney, M. A., McHugh, C. W., Grenfell, I. C., Riley, K. L., &
Short, K. C. (2011). A simulation of probabilistic wildfire
risk components for the continental United States.
Stochastic Environmental Research and Risk Assessment,
25(7), 973–1000.
Haas, J. R., Calkin, D. E., & Thompson,M. P. (2013). A national
approach for integrating wildfire simulation modeling into
Wildland Urban Interface risk assessments within the
United States. Landscape and Urban Planning,
119(November 2013), 44–53.
Haas, J. R., Calkin, D. E., & Thompson, M. P. (2015). Wildfire
risk transmission in the Colorado Front Range, USA. Risk
Analysis, 35(2), 226–240.
Kalabokidis, K., Palaiologou, P., Gerasopoulos, E., Gian-
nakopoulos, C., Kostopoulou, E., & Zerefos, C. (2015).
Effect of climate change projections on forest fire behavior
and values-at-risk in Southwestern Greece. Forests, 6(6),
2214.
Lehsten, V., de Groot, W. J., Flannigan, M., George, C., Har-
mand, P., & Balzter, H. (2014). Wildfires in boreal ecore-
gions: Evaluating the power law assumption and intra-
annual and interannual variations. Journal of Geophysical
Research: Biogeosciences, 119(1), 14–23.
Mitsopoulos, I., Mallinis, G., & Arianoutsou, M. (2015).
Wildfire risk assessment in a typical Mediterranean wild-
land–urban interface of Greece. Environmental Manage-
ment, 55(4), 900–915.
Moritz, M. A., Batllori, E., Bradstock, R. A., Gill, A. M.,
Handmer, J., Hessburg, P. F., et al. (2014). Learning to
coexist with wildfire. Nature, 515(7525), 58–66.
Oregon Department of Forestry, Western Forestry Leadership
Coalition, and Council of Western State Foresters. (2013).
Westwide wildfire risk assessment final report. Salem:
Oregon Department of Forestry. http://www.odf.state.or.
us/gis/data/Fire/West_Wide_Assessment/WWA_Final
Report.pdf. Accessed June 24, 2015.
Pacheco, A. P., Claro, J., Fernandes, P. M., de Neufville, R.,
Oliveira, T. M., Borges, J. G., et al. (2015). Cohesive fire
management within an uncertain environment: A review of
risk handling and decision support systems. Forest Ecology
and Management, 347(1 July 2015), 1–17.
Radeloff, V. C., Hammer, R. B., Stewart, S. I., Fried, J. S.,
Holcomb, S. S., & McKeefry, J. F. (2005). The wildland–
urban interface in the United States. Ecological Applica-
tions, 15(3), 799–805.
Ryan, K. C., &Opperman, T. S. (2013). LANDFIRE–A national
vegetation/fuels data base for use in fuels treatment,
restoration, and suppression planning. Forest Ecology and
Management, 294(15 April 2013), 208–216.
Scott, J. H., & Burgan, R. E. (2005). Standard fire behavior fuel
models: A comprehensive set for use with Rothermel’s
surface fire spread model (p. 72). Fort Collins: USDA
Forest Service, RockyMountain Research Station, General
Technical Report RMRS-GTR-153.
Scott, J. H., & Reinhardt, E. (2001). Assessing crown fire
potential by linking models of surface and crown fire
behavior. Research Paper RMRS-RP-29 (p. 56). Fort
Collins: U.S. Department of Agriculture, Forest Service,
Rocky Mountain Research Station.
Scott, J., Helmbrecht, D., Parks, S., & Miller, C. (2012).
Quantifying the threat of unsuppressed wildfires reaching
GeoJournal
123
the adjacent wildland–urban interface on the Bridger-Te-
ton National Forest, Wyoming, USA. Fire Ecology, 8(2),
125–142.
Scott, J. H., & Thompson, M. P. (2015). Emerging concepts in
wildfire risk assessment and management. In Proceedings
of the large-fire conference; Missoula, Montana; May
2014. Proc. RMRS-P-73. Fort Collins: U.S. Department of
Agriculture, Forest Service, Rocky Mountain Research
Station.
Scott, J. H., Thompson, M. P. & Calkin, D. E. (2013). A wildfire
risk assessment framework for land and resource man-
agement. In Gen. Tech. Rep. RMRS-GTR-315. U.S.
Department of Agriculture, Forest Service, Rocky Moun-
tain Research Station.
Short, K. C. (2014). Spatial wildfire occurrence data for the
United States, 1992–2012 [FPA_FOD_20140428] (2nd
ed.). Fort Collins: Forest Service Research Data Archive.
Strauss, D., Bender, L., & Mees, R. (1989). Do one percent of
forest fires cause ninety-nine percent of the damage?
Forest Science, 35(2), 319–328.
Thompson, M. P., & Calkin, D. E. (2011). Uncertainty and risk
in wildland fire management: A review. Journal of Envi-
ronmental Management, 92(8), 1895–1909.
Thompson, M. P., Gilbertson-Day, J. W. & Scott, J. H. (2015b).
Integrating pixel-and polygon-based approaches to wildfire
risk assessment: Application to a high-value watershed on
the Pike and San Isabel National Forests, Colorado, USA.
Environmental Modeling & Assessment, 1–15. doi:10.
1007/s10666-015-9469-z.
Thompson, M. P., Haas, J. R., Gilbertson-Day, J. W., Scott, J.
H., Langowski, P., Bowne, E., et al. (2015a). Development
and application of a geospatial wildfire exposure and risk
calculation tool. Environmental Modelling and Software,
63(January 2015), 61–72.
Thompson, M. P., Scott, J., Kaiden, J. D., & Gilbertson-Day, J.
W. (2013). A polygon-based modeling approach to assess
exposure of resources and assets to wildfire. Natural
Hazards, 67(2), 627–644.
U.S. Census. (2014). Cartographic Boundary Shapefiles—Pla-
ces (Incorporated Places and Census Designated Places).
https://www.census.gov/geo/maps-data/data/cbf/cbf_
place.html. Accessed May 26, 2015.
Williams, J. (2013). Exploring the onset of high-impact mega-
fires through a forest land management prism. Forest
Ecology and Management, 294(15 April 2013), 4–10.
Williams, D. R., Jakes, P. J., Burns, S., Cheng, A. S., Nelson, K.
C., Sturtevant, V., et al. (2012). Community wildfire pro-
tection planning: The importance of framing, scale, and
building sustainable capacity. Journal of Forestry, 110(8),
415–420.
GeoJournal
123