Embed Size (px)
Citation preview
A
Mapping Research Excellence
Research ReportSeptember 2011
Mapping Research Excellence: exploring the links between research excellence and research funding policy
in partnership with
110915_MappingResearchExcellence.indd A110915_MappingResearchExcellence.indd A 15/09/2011 11:1215/09/2011 11:12

The 1994 Group
> The 1994 Group is established to promote excellence in university research and teaching. It represents 19 of the UK’s leading research-intensive, student focused universities. Around half of the top 20 universities in UK national league tables are members of the group.
> Each member institution delivers an extremely high standard of education, demonstrating excellence in research, teaching and academic support, and provides learning in a research-rich community.
> 12 of the top 20 universities in the Guardian University Guide 2012 league table are 1994 Group members. 8 of the top 20 universities in the 2012 Sunday Times University League Table are 1994 Group members. 9 of the top 20 universities in the 2012 Complete University Guide are 1994 Group members. 8 of the top 200 universities in the 2011/12 QS World University Rankings are 1994 Group members. In 17 major subject areas 1994 Group universities are the UK leaders, achieving 1st place in their fi eld (THE RAE subject rankings 2008). 57% of the 1994 Group’s research is rated 4* ‘world-leading’ or 3* ‘internationally excellent’ (RAE 2008, HEFCE).
> The 1994 Group represents: University of Bath, Birkbeck University of London, Durham University, University of East Anglia, University of Essex, University of Exeter, Goldsmiths University of London, Institute of Education University of London, Royal Holloway University of London, Lancaster University, University of Leicester, Loughborough University, Queen Mary University of London, University of Reading, University of St Andrews, School of Oriental and African Studies, University of Surrey, University of Sussex, University of York.
110915_MappingResearchExcellence.indd B110915_MappingResearchExcellence.indd B 15/09/2011 11:1215/09/2011 11:12

Research ReportSeptember 2011
Mapping Research Excellence: exploring the links between research excellence and research funding policy
A research report by Professor Paul Wellingsand Rachel Winzer
in partnership with
110915_MappingResearchExcellence.indd i110915_MappingResearchExcellence.indd i 15/09/2011 11:1215/09/2011 11:12

110915_MappingResearchExcellence.indd ii110915_MappingResearchExcellence.indd ii 15/09/2011 11:1215/09/2011 11:12
iii
Mapping Research Excellence
Executive summary ......................................................... 1
1. Introduction ................................................................. 5
2. Generating national research excellence .................... 8
3. Excellence across the disciplines ............................. 14
4. Growing and strengthening excellence ..................... 21
5. Contribution of research intensive institutions to national research excellence ................................. 28
6. Conclusions .............................................................. 34
Contents
110915_MappingResearchExcellence.indd iii110915_MappingResearchExcellence.indd iii 15/09/2011 11:1215/09/2011 11:12

110915_MappingResearchExcellence.indd iv110915_MappingResearchExcellence.indd iv 15/09/2011 11:1215/09/2011 11:12
1
Mapping Research Excellence
Executive SummaryIntroduction
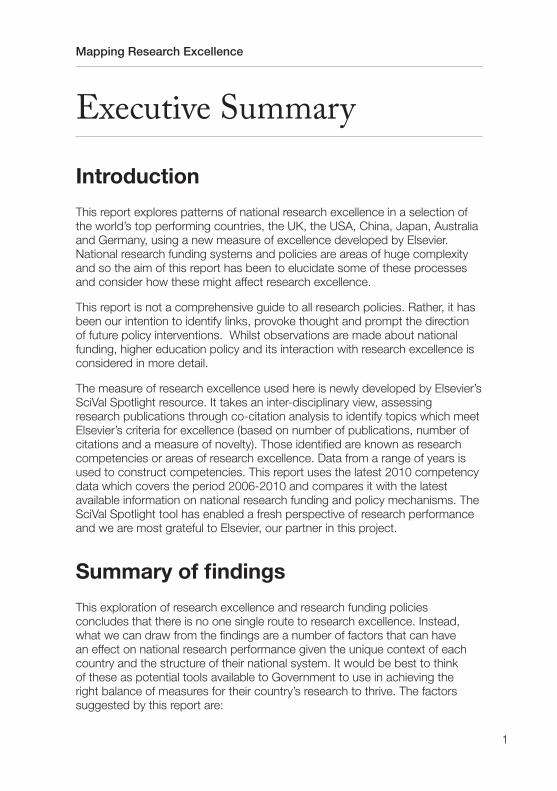
This report explores patterns of national research excellence in a selection of the world’s top performing countries, the UK, the USA, China, Japan, Australia and Germany, using a new measure of excellence developed by Elsevier. National research funding systems and policies are areas of huge complexity and so the aim of this report has been to elucidate some of these processes and consider how these might affect research excellence.
This report is not a comprehensive guide to all research policies. Rather, it has been our intention to identify links, provoke thought and prompt the direction of future policy interventions. Whilst observations are made about national funding, higher education policy and its interaction with research excellence is considered in more detail.
The measure of research excellence used here is newly developed by Elsevier’s SciVal Spotlight resource. It takes an inter-disciplinary view, assessing research publications through co-citation analysis to identify topics which meet Elsevier’s criteria for excellence (based on number of publications, number of citations and a measure of novelty). Those identifi ed are known as research competencies or areas of research excellence. Data from a range of years is used to construct competencies. This report uses the latest 2010 competency data which covers the period 2006-2010 and compares it with the latest available information on national research funding and policy mechanisms. The SciVal Spotlight tool has enabled a fresh perspective of research performance and we are most grateful to Elsevier, our partner in this project.
Summary of fi ndings
This exploration of research excellence and research funding policies concludes that there is no one single route to research excellence. Instead, what we can draw from the fi ndings are a number of factors that can have an effect on national research performance given the unique context of each country and the structure of their national system. It would be best to think of these as potential tools available to Government to use in achieving the right balance of measures for their country’s research to thrive. The factors suggested by this report are:
110915_MappingResearchExcellence.indd 1110915_MappingResearchExcellence.indd 1 15/09/2011 11:1215/09/2011 11:12

2
1994 Group
• an underlying core of Government funded research and support for higher education;
• higher education policies for distributing funding to disciplines and targeting those disciplines appropriate to the country;
• continuing investment to support growth; and
• a competitive research funding environment which rewards excellence wherever it is found.
What we learn from this report is that there are likely to be variations in how these factors affect research excellence depending on national contexts and interaction between factors. This is a complex area and the scope of this study means that we can only raise top level factors likely to play a role.
The UK leads in producing research excellence. This report fi nds the UK to be the leader in generating topics of research excellence relative to total research and development expenditure. The UK is also one of the most effi cient countries examined here in producing competencies in terms of the higher education sector alone, although this may be a less stable measure.
National expenditure on research and development is connected to the number of areas of research excellence but there are also other factors at play. The ability of the UK to produce more ‘bang per buck’ may rest on systems in place in the UK for funding research and development. Factors shared by the UK and Australia, which also performs well on this measure, suggest that high proportions of research competencies are associated with an underlying core of Government funding for national research and greater funding in higher education research and development. This suggests a well supported higher education sector and an underlying core of Government support for research contribute to national research excellence and productivity.
Research excellence in different disciplines is linked with national funding priorities. The UK has a widely distributive approach to funding research in higher education, with resources provided across all disciplines. This is refl ected in the fi nding that UK research excellence is located within all disciplines. A similar pattern is found in the USA, but is not replicated elsewhere. Australia’s research excellence profi le demonstrates the effects of a tightly targeted funding policy, mirroring research themes identifi ed nationally. Interestingly, China, which is competing with the USA in size of research output, so far dominates in areas of research excellence which would seem to complement rather than challenge the USA. The USA has a special focus on medical sciences whereas China’s competencies are less developed in this discipline. However, this may change in the future, with health identifi ed as one of China’s research priorities.
110915_MappingResearchExcellence.indd 2110915_MappingResearchExcellence.indd 2 15/09/2011 11:1215/09/2011 11:12
3
Mapping Research Excellence
Countries have taken different approaches to funding different disciplines; this may contribute to productivity in research excellence but is not the only factor. The UK does not tend to target funding to particular disciplines. This may be why research excellence is found across all subject areas, and a broad discipline base of excellence may have contributed to high productivity in research excellence. However, this is not the only way of creating research excellence. Australia achieves high productivity in research excellence even though it tightly targets funding to particular discipline areas.
When assessing the research excellence of a nation, it is necessary to look also at indicators of health of the system and possible trends for future growth. This report fi nds that growth and sustainability of research excellence may be linked with increased research spending. The UK has some of the lowest indicators of competency growth despite its current high levels of excellence and productivity. This, combined with one of the lowest proportional rises in research and development spending, whilst other countries, such as the USA and China, are increasing commitments, may be a warning signal for the UK. Whilst currently the UK has the highest performance comparatively in research excellence this position is vulnerable.
The contribution of research intensive institutions to national competencies varies. Indications are this is linked to how funding is concentrated within higher education institutions. It is suggested here that research intensive institutions contribute most highly to national research excellence when funding concentrates according to merit. Where funding follows excellence, and thus concentrates naturally at a certain level, there are signs that research intensive institutions make the largest contributions to national research excellence. Systems which allow for this natural level of concentration include the dual funding system in the UK and Australia and the USA’s mainly competitive system. Responsive systems for funding institutions are linked to productivity of research excellence but are only part of the picture. The UK and Australia achieve high competency productivity with their widely distributive schemes, but China is also able to achieve effi ciency even though it targets funding to institutions in a more concentrated manner.
Competitive funding schemes must be appropriate for the country and retain Government support. Japan provides a case in point that funding systems must be tailored to the structure of academe in country. It also suggests that Government support is important for higher education, and industry cannot be expected to play the same funding role as Government.
The UK’s strong performance suggests a good policy balance has been achieved for the UK to reach high research excellence. We suggest factors contributing to the UK’s success have been:
110915_MappingResearchExcellence.indd 3110915_MappingResearchExcellence.indd 3 15/09/2011 11:1215/09/2011 11:12

4
1994 Group
• an underlying core of Government support for research and for higher education;
• a higher education sector which plays a strong role in producing national research;
• funding which supports all disciplines; and
• a competitive funding environment through the dual support mechanism which rewards excellence wherever it is found.
Looking ahead, if the UK wishes to maintain its current levels of excellence we may have to look to innovative solutions. This analysis suggests that increasing research and development spending would be one way of boosting growth. However, in the UK’s current fi scal situation alternatives may need to be sought.
The research performance of the UK is refl ective of the researchers and academics working in Britain. The UK has a track record in being able to attract the best staff internationally to work in the UK and establish their careers here. Being able to recruit from a global talent-pool is undoubtedly an advantage for the UK in terms of its research performance and the contribution academia is able to make to the UK economically and socially. It is imperative that the UK should continue to be able to recruit the brightest and best from around the world. Research staff are increasingly mobile and the UK needs to be able to recruit and retain the very best staff who will contribute to the research excellence of the UK. To fail on this would have drastic consequences for the UK’s research excellence.
The UK should continue to build on its strengths in the changing fi nancial environment. New research funding and policy mechanisms which are implemented should build upon the strengths which have established the UK as a leader in producing research competencies.
110915_MappingResearchExcellence.indd 4110915_MappingResearchExcellence.indd 4 15/09/2011 11:1215/09/2011 11:12
5
Mapping Research Excellence
1. Introduction
1. HEFCE and UUK (2009) ‘Securing world-class research in UK universities’, p.4; Evidence (commissioned by the Department for Business, Innovation and Skills) (2009), ‘International benchmarking study of UK research performance 2009’.
This report brings a fresh perspective to national research performance through an examination of national areas of research excellence identifi ed as research competencies. Research competencies are a new measure of research excellence developed by Elsevier and are topics of research identifi ed through co-citation analysis which meet standards of excellence set by Elsevier. This has allowed us to form a new view of the UK’s research strengths in comparison to other research leading countries. Considered alongside the UK are the USA, China, Japan, Australia and Germany. By observing trends and patterns in the performance of research excellence we are able to elucidate how these are linked to national research funding policies.
UK research is world leading, this was the conclusion of a 2009 analysis of UK research performance commissioned by the Department for Business, Innovation and Skills (BIS). The UK was shown to be second only to the USA on leading scientifi c indicators and ranked top in output productivity and citation analysis taking public spend on research and development into account.1 This analysis, based on publication and citation counts, is currently being revised for publication in autumn 2011. Meanwhile, research competency analysis is able to explore, in a different dimension, the excellence of UK research in relation to its comparators. It goes beyond publication counts and citation analysis, to look at the number of areas of research excellence, the distribution of research excellence across the different disciplines and growth trends in research competencies. Data from a range of years is used to construct competencies. This report uses the latest SciVal Spotlight 2010 competency data which covers the period 2006-2010.
110915_MappingResearchExcellence.indd 5110915_MappingResearchExcellence.indd 5 15/09/2011 11:1215/09/2011 11:12

6
1994 Group
A new indicator of excellence
Analysis of research strengths traditionally looks to data on research outputs and citation analysis to generate indicators of impact and excellence. With their SciVal Spotlight resource, Elsevier has produced a new measure of research excellence which provides a different way of examining research performance. It captures a different dimension of research performance by using articles and co-citation analysis. This approach is based on research competencies and has the advantage of taking into account multi-disciplinary research topics. Data used in this report is from SciVal Spotlight 2010 which is based on articles from 2006-2010.
Competencies are identifi ed topics of research excellence and are formulated in a three stage process:
1. Identifying article clustersResearchers organise themselves around highly specifi c research topics in which they cite each other’s work. To identify these research topics, SciVal Spotlight performs a co-citation analysis2 on all the articles published in a specifi c year. This groups the references that meet the citation threshold into “article clusters” that represent the specifi c areas of research. All articles published in a fi ve year window (for example, 2006 - 2010) are then assigned to article clusters based on their references.
2. Determining which article clusters are strengthsNext, SciVal Spotlight determines which article clusters represent strengths. These are the clusters where the institution/country as a whole is highly ranked in article contribution compared to other institutions/countries worldwide.
3. Grouping article clusters The article clusters identifi ed in Step 2 are then grouped together based on articles they share from an institution/country. Grouped clusters might share one article or share multiple articles. These grouped clusters are the competencies seen in SciVal Spotlight. The competencies represent research areas where the entire institution or country is a leader.
2. For further information on SciVal Spotlight co-citation methodology see Elsevier (2009), Co-Citation Analysis: The Methodology of SciVal Spotlight, http://www.americalatina.elsevier.com/sul/pt-br/scival/pdf/Co-Citation_Analysis_SciVal_Spotlight.pdf.
110915_MappingResearchExcellence.indd 6110915_MappingResearchExcellence.indd 6 15/09/2011 11:1215/09/2011 11:12

7
Mapping Research Excellence
To be determined as a competency the research topic must meet thresholds for the market size plus at least one of three possible defi nitions of research quality. These are:
Publication leadership – whereby the relative article share is high in comparison to global activity.
Reference leadership – whereby the share of citations gained by articles published within a research topic is high in comparison to competing countries.
State of the art leadership – a measure of leadership which looks at how recent the articles cited by researchers of the institution/country are within the research topic, in comparison with the community of researchers dealing with the same subject.
Whilst this new form of assessing research strengths is designed to give a broader and deeper view of research performance, there are nevertheless limitations to be aware of. The source of journal articles is Scopus, which is predominantly science focused, and therefore conclusions about trends in the arts and humanities are likely to be weak. These diffi culties are encountered by any abstract and indexing database as research outputs in the arts and humanities tend to be published in books which therefore cannot be comprehensively covered. This is an industry-wide problem. Discussion of arts and humanities disciplines are therefore mainly excluded from this report.
There are also doubts within the academic community about the reliability of evidence on research excellence based upon journal citations due to problems with assessing article quality and citation time lags in different disciplines. These are, however, wider concerns which apply to all forms of analysis of research performance based on bibliometrics.
Competency analysis does bring an additional dimension to the measurement of research performance and allows international comparison. Considering the importance of high quality research, this is a welcome addition to the other methods of research assessment already in use.
We would like to acknowledge the invaluable support of Elsevier, our partner in this project.
110915_MappingResearchExcellence.indd 7110915_MappingResearchExcellence.indd 7 15/09/2011 11:1215/09/2011 11:12
8
1994 Group
2. Generating national research excellence
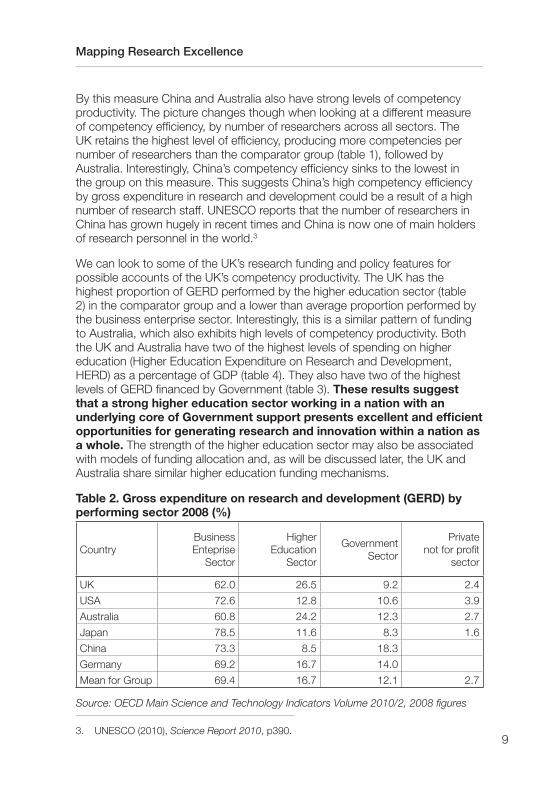
As can be expected, the number of areas of research excellence identifi ed in different countries varies according to the amount of research activity (table 1). Accordingly, the USA is the leader in the number of competencies with 1817 areas of research excellence identifi ed from 2006-2010 data. The UK has 418 identifi ed research competencies, a similar number to Japan and Germany.
However, it is more useful to examine what might be termed competency productivity, the number of areas of research excellence produced when accounting for research funding. Taking the most recent gross expenditure on research and development (GERD) into consideration, the UK tops the comparator group in competencies produced (table 1). Gross expenditure on research and development (GERD) comprises that undertaken by the business, higher education and Government sectors. In 2008, UK GERD stood at $40.1 billion, the second lowest in the comparator group, meaning that per billion $ the UK produces the highest number of competencies in the comparator group and leads on this measure of research excellence. This refl ects the fi ndings of BIS in 2009 which demonstrated the UK’s high effi ciency in producing articles.
Table 1. Research competencies by gross domestic expenditure on research and development (GERD) 2008 and national researchers 2008
CountryNo. of
competencies(2006-2010)
GERD $Bn*
National Researchers
FTE(Thousands)
CompetencyProductivity:
Competenciesper $ Bn(GERD)
Competencies per thousand
researchers
UK 418 40.10 251.93 10.42 1.66
USA 1817 398.19 1412.64** 4.56 1.29
Australia 130 18.76 91.62 6.93 1.42
Japan 398 148.72 656.68 2.68 0.61
China 885 120.61 1592.42 7.34 0.56
Germany 396 81.85 302.47 4.84 1.31
*Purchasing Power Parity (PPP)**2007 fi gures used as 2008 fi gures unavailableSource: OECD Main Science and Technology Indicators Volume 2010/2, GERD 2008
110915_MappingResearchExcellence.indd 8110915_MappingResearchExcellence.indd 8 15/09/2011 11:1215/09/2011 11:12
9
Mapping Research Excellence
3. UNESCO (2010), Science Report 2010, p390.
By this measure China and Australia also have strong levels of competency productivity. The picture changes though when looking at a different measure of competency effi ciency, by number of researchers across all sectors. The UK retains the highest level of effi ciency, producing more competencies per number of researchers than the comparator group (table 1), followed by Australia. Interestingly, China’s competency effi ciency sinks to the lowest in the group on this measure. This suggests China’s high competency effi ciency by gross expenditure in research and development could be a result of a high number of research staff. UNESCO reports that the number of researchers in China has grown hugely in recent times and China is now one of main holders of research personnel in the world.3
We can look to some of the UK’s research funding and policy features for possible accounts of the UK’s competency productivity. The UK has the highest proportion of GERD performed by the higher education sector (table 2) in the comparator group and a lower than average proportion performed by the business enterprise sector. Interestingly, this is a similar pattern of funding to Australia, which also exhibits high levels of competency productivity. Both the UK and Australia have two of the highest levels of spending on higher education (Higher Education Expenditure on Research and Development, HERD) as a percentage of GDP (table 4). They also have two of the highest levels of GERD fi nanced by Government (table 3). These results suggest that a strong higher education sector working in a nation with an underlying core of Government support presents excellent and effi cient opportunities for generating research and innovation within a nation as a whole. The strength of the higher education sector may also be associated with models of funding allocation and, as will be discussed later, the UK and Australia share similar higher education funding mechanisms.
Table 2. Gross expenditure on research and development (GERD) by performing sector 2008 (%)
CountryBusinessEnteprise
Sector
HigherEducation
Sector
GovernmentSector
Privatenot for profi t
sector
UK 62.0 26.5 9.2 2.4
USA 72.6 12.8 10.6 3.9
Australia 60.8 24.2 12.3 2.7
Japan 78.5 11.6 8.3 1.6
China 73.3 8.5 18.3
Germany 69.2 16.7 14.0
Mean for Group 69.4 16.7 12.1 2.7
Source: OECD Main Science and Technology Indicators Volume 2010/2, 2008 fi gures
110915_MappingResearchExcellence.indd 9110915_MappingResearchExcellence.indd 9 15/09/2011 11:1215/09/2011 11:12

10
1994 Group
Table 3. Gross expenditure on research and development (GERD) by source of funds, 2008 (%)
Country Industry GovernmentOther National
SourcesFrom Abroad
UK 45.4 30.7 6.2 17.7
USA 67.3 27.1 5.7
Australia 61.4 34.9 1.9 1.7
Japan 78.2 15.6 5.8 0.4
China 71.7 23.6 1.2
Germany 67.3 28.4 0.3 4.0
Mean for Group 65.2 26.7 4.0 5.0
Source: OECD Main Science and Technology Indicators Volume 2010/2, 2008 fi gures
Table 4. Gross expenditure and higher education expenditure on research and development (GERD and HERD) as a % of Gross Domestic Product (GDP) 2008 and average annual growth in GERD 2005-2008
CountryGERD as a % of
GDP 2008
Annual AverageGrowth in Total
GERD 2005-2008(%)
HERD as a % ofGDP 2008
UK 1.77 5.59 0.47
USA 2.79 7.22 0.36
Australia 2.21 0.54
Japan 3.44 4.99 0.43
China 1.54 19.30 0.13
Germany 2.68 8.40 0.45
Source: OECD Main Science and Technology Indicators Volume 2010/2, 2005-2008 fi gures
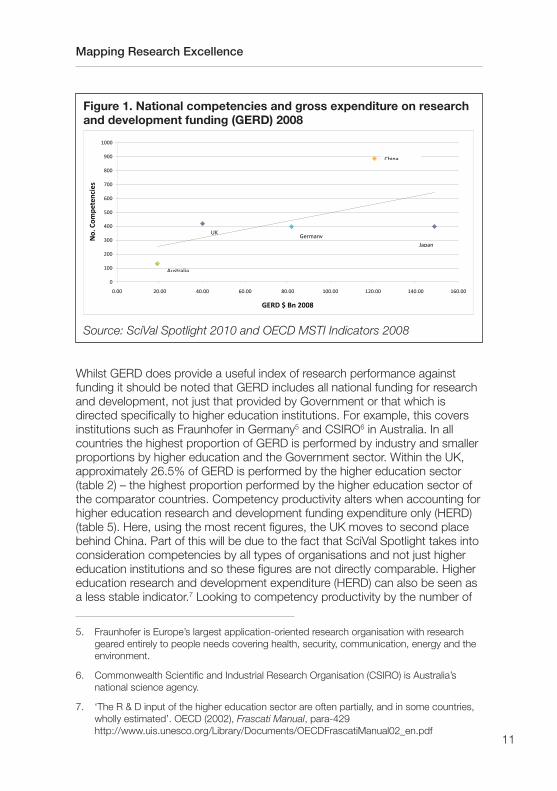
A simple analysis of the relationship between gross expenditure on research and development (GERD) and the number of research competencies in the comparator group4 demonstrates that, as can be expected, there is a positive relationship between funding (GERD) and the number of competencies produced by a country (fi gure 1). This is not a perfect relationship, indicating that other factors contribute to a country’s competency productivity. We can expect that national research policies and the distribution of funds have roles to play in competency productivity.
4. In this analysis the USA is excluded because of its large skewing effect as an outlier.
110915_MappingResearchExcellence.indd 10110915_MappingResearchExcellence.indd 10 15/09/2011 11:1215/09/2011 11:12
11
Mapping Research Excellence
5. Fraunhofer is Europe’s largest application-oriented research organisation with research geared entirely to people needs covering health, security, communication, energy and the environment.
6. Commonwealth Scientifi c and Industrial Research Organisation (CSIRO) is Australia’s national science agency.
7. ‘The R & D input of the higher education sector are often partially, and in some countries, wholly estimated’. OECD (2002), Frascati Manual, para-429http://www.uis.unesco.org/Library/Documents/OECDFrascatiManual02_en.pdf
Whilst GERD does provide a useful index of research performance against funding it should be noted that GERD includes all national funding for research and development, not just that provided by Government or that which is directed specifi cally to higher education institutions. For example, this covers institutions such as Fraunhofer in Germany5 and CSIRO6 in Australia. In all countries the highest proportion of GERD is performed by industry and smaller proportions by higher education and the Government sector. Within the UK, approximately 26.5% of GERD is performed by the higher education sector (table 2) – the highest proportion performed by the higher education sector of the comparator countries. Competency productivity alters when accounting for higher education research and development funding expenditure only (HERD) (table 5). Here, using the most recent fi gures, the UK moves to second place behind China. Part of this will be due to the fact that SciVal Spotlight takes into consideration competencies by all types of organisations and not just higher education institutions and so these fi gures are not directly comparable. Higher education research and development expenditure (HERD) can also be seen as a less stable indicator.7 Looking to competency productivity by the number of
Figure 1. National competencies and gross expenditure on research and development funding (GERD) 2008
Source: SciVal Spotlight 2010 and OECD MSTI Indicators 2008
110915_MappingResearchExcellence.indd 11110915_MappingResearchExcellence.indd 11 15/09/2011 11:1215/09/2011 11:12
12
1994 Group
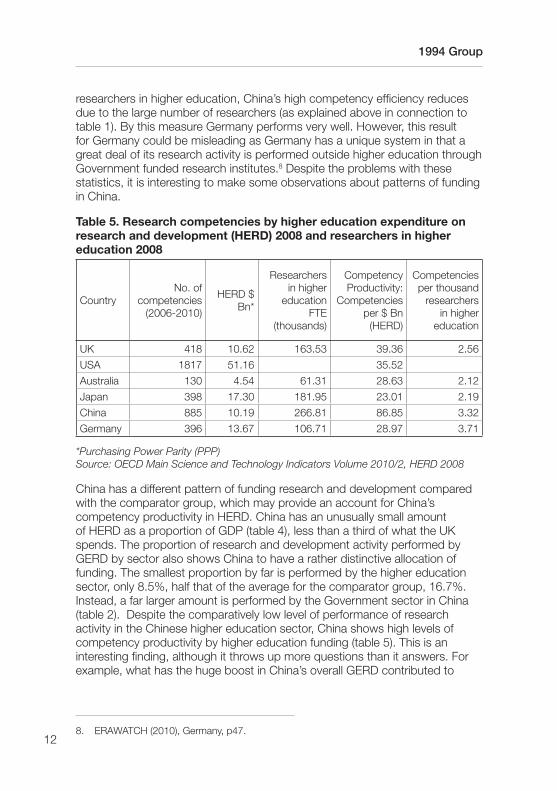
researchers in higher education, China’s high competency effi ciency reduces due to the large number of researchers (as explained above in connection to table 1). By this measure Germany performs very well. However, this result for Germany could be misleading as Germany has a unique system in that a great deal of its research activity is performed outside higher education through Government funded research institutes.8 Despite the problems with these statistics, it is interesting to make some observations about patterns of funding in China.
Table 5. Research competencies by higher education expenditure on research and development (HERD) 2008 and researchers in higher education 2008
CountryNo. of
competencies(2006-2010)
HERD $Bn*
Researchersin higher
educationFTE
(thousands)
CompetencyProductivity:
Competenciesper $ Bn
(HERD)
Competencies per thousand
researchersin higher
education
UK 418 10.62 163.53 39.36 2.56
USA 1817 51.16 35.52
Australia 130 4.54 61.31 28.63 2.12
Japan 398 17.30 181.95 23.01 2.19
China 885 10.19 266.81 86.85 3.32
Germany 396 13.67 106.71 28.97 3.71
*Purchasing Power Parity (PPP)Source: OECD Main Science and Technology Indicators Volume 2010/2, HERD 2008
China has a different pattern of funding research and development compared with the comparator group, which may provide an account for China’s competency productivity in HERD. China has an unusually small amount of HERD as a proportion of GDP (table 4), less than a third of what the UK spends. The proportion of research and development activity performed by GERD by sector also shows China to have a rather distinctive allocation of funding. The smallest proportion by far is performed by the higher education sector, only 8.5%, half that of the average for the comparator group, 16.7%. Instead, a far larger amount is performed by the Government sector in China (table 2). Despite the comparatively low level of performance of research activity in the Chinese higher education sector, China shows high levels of competency productivity by higher education funding (table 5). This is an interesting fi nding, although it throws up more questions than it answers. For example, what has the huge boost in China’s overall GERD contributed to
8. ERAWATCH (2010), Germany, p47.
110915_MappingResearchExcellence.indd 12110915_MappingResearchExcellence.indd 12 15/09/2011 11:1215/09/2011 11:12

13
Mapping Research Excellence
9. UNESCO (2010), Science Report 2010, p389.
10. UNESCO (2010), Science Report 2010, p390.
this fi nding? What is the cross-over between Government sector research and development and higher education? What kind of research are these competencies formed of, that is, is this basic or applied research?
Looking more widely at research and development spending in China, it is interesting that UNESCO report that the majority of GERD in China goes to experimental development (83%), compared to 5% for basic research.9 This may be a result of the huge role industry plays in research and development in China, with business becoming a large source of spending and many public institutes having been changed into technology-based enterprises.10 With a relatively small amount of funding going to basic research, this may produce different patterns in research excellence in the future as the longer term effects of such a policy take place.
Further research beyond the scope of this report would be needed to determine how different measures of expenditure on research and development affect the productivity of areas of research excellence. GERD can be considered a more stable indicator of spending on research and development. Therefore, the remainder of this report concentrates upon GERD, which is also taken as a proxy of funding for higher education. Research expenditure and links with research excellence is clearly a complex area, but what these results do suggest is that there is no one ‘correct’ way to distribute funding to produce research excellence. The UK, with its stronger focus on higher education led research, and China, with its apparently lower allocation to university research, both achieve high competency productivity but in different ways.
110915_MappingResearchExcellence.indd 13110915_MappingResearchExcellence.indd 13 15/09/2011 11:1215/09/2011 11:12
14
1994 Group
3. Excellence across the disciplines
Research excellence is not simply a question of the number of competencies, and this section examines areas of research excellence across the disciplines. Results from Elsevier show that the UK’s research competencies are widespread and extend across all disciplines, as do competencies in the USA. This pattern is not replicated in other countries in the comparator group, instead research excellence is either absent in some disciplinary areas or very tightly focused in some specialised areas as a result of targeted funding allocations, as in Australia. Distribution of funding across the disciplines may well link with the overall competency productivity discussed in the previous section, but is likely to depend upon the context within the country.
SciVal Spotlight presents the discipline distribution of competencies in a wheel with coloured segments (fi gures 3, 5, 7, 9, 11, 13) representing the different disciplines as shown in the key (fi gure 2). Each competency is represented as a small circle within the wheel and the location of the circle is decided by the competency disciplines. Circles within the centre of the wheel are those which have the highest levels of interdisciplinarity. The size of the circle depends upon the number of articles in the competency. The competencies depicted here are based on SciVal Spotlight 2010 which uses 2006-2010 data.
Presented alongside the competency view are graphs based on publications rather than competencies (fi gures 4, 6, 8, 10, 12, 14). This assigns each publication to the main discipline area its content relates to, rather than the multi-disciplinary view which competencies show.11
Figure 2: Colour Key
11. The locations of the subject areas on the two types of graphs are identical. Thus to fi nd out which subject area a certain colour represents it is possible to look across at the publication distribution graph, without referring to the colour coded key in fi gure 2.
110915_MappingResearchExcellence.indd 14110915_MappingResearchExcellence.indd 14 15/09/2011 11:1215/09/2011 11:12

15
Mapping Research Excellence
Figure 3: Competencies in the UK
Figure 5: Competencies in the USA
Figure 7: Competencies in China
Figure 4: Publication Distribution UK and Mean of Comparator Group
Figure 6: Publication Distribution USA and Mean of Comparator Group
Figure 8: Publication Distribution China and Mean of Comparator Group
110915_MappingResearchExcellence.indd 15110915_MappingResearchExcellence.indd 15 15/09/2011 11:1215/09/2011 11:12
16
1994 Group
Figure 9: Competencies in Japan
Figure 11: Competencies in Germany
Figure 13: Competencies in Australia
Figure 10: Publication Distribution Japan and Mean of Comparator Group
Figure 12: Publication Distribution Germany and Mean of Comparator Group
Figure 14: Publication Distribution Australia and Mean of Comparator Group
110915_MappingResearchExcellence.indd 16110915_MappingResearchExcellence.indd 16 15/09/2011 11:1215/09/2011 11:12
17
Mapping Research Excellence
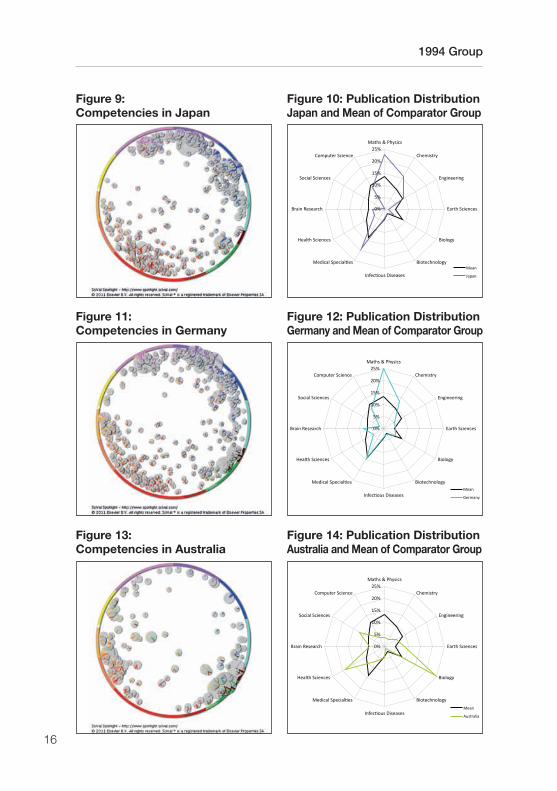
The fi gures above reveal the distribution of competencies based on articles from 2006-2010 across the different disciplines. These show some interesting results and can be linked back to national higher education funding policies.
Research excellence in the UK is shown to extend across the disciplines, although there is a special clustering of competencies in the social sciences and the medical and health sciences, as shown by the continuous distribution of competencies within the circle (fi gure 3) and the ‘spikes of activity’ in the publication distribution graph (fi gure 4). An immediate account of this is offered by the UK’s broad approach to funding without disciplinary bias in higher education, both through quality-related funding, which rewards excellence wherever it is found, and responsive mode funding through Research Councils UK.
The UK does not tend to tightly target research funding but its seven research councils12 ensure research is funded across the different disciplines. Although the EPSRC and MRC receive greater proportions of the total allocation made to the research councils,13 we can consider this to be a refl ection of the more costly nature of this research rather than a refl ection of strategic priorities. Encouraging further disciplinary integration are six cross cutting themes identifi ed by the Research Councils for additional funding.14 With this multidisciplinary focus and widely distributive approach to responsive mode funding, it is unsurprising to fi nd research excellence within all disciplines in the UK. It would be easy, by extension, to assume that this wide base of excellence and an interdisciplinary approach offers the UK the right conditions for building excellence and high competency productivity.
The USA demonstrates that the UK model is not the only way to achieve excellence across all disciplines. The USA also has a continuous spread of research competencies across all disciplines (fi gure 5), this is a denser arrangement owing to the quantity of competencies in the USA. The USA takes a broad and distributive approach to allocating funds for research. The federal Government does not generally provide block grant or quality related funding directly to institutions, as opposed to the UK, although states differ in their funding arrangements. Instead, the majority of federal research and
12. Arts and Humanities Research Council (AHRC), Biotechnology and Biological Science Research Council (BBSRC), Economic and Social Research Council (ESRC), Engineering and Physical Sciences Research Council (EPSRC), Medical Research Council (MRC), Natural Environment Research Council (NERC) and Science and Technology Facilities Council (STFC)
13. BIS (Dec 2010), ‘The allocation of science and research funding 2011/12 to 2014/15, investing in world-class science and research’ http://www.bis.gov.uk/assets/biscore/science/docs/a/10-1356-allocation-of-science-and-research-funding-2011-2015.pdf
14. Ibid.
110915_MappingResearchExcellence.indd 17110915_MappingResearchExcellence.indd 17 15/09/2011 11:1215/09/2011 11:12
18
1994 Group
15. ERAWATCH (2010), Research Inventory Report for United States, p37 http://cordis.europa.eu/erawatch/index.cfm?fuseaction=ri.content&topicID=4&countryCode=US
16. ERAWATCH (2010), Research Inventory Report for China, p4 http://cordis.europa.eu/erawatch/index.cfm?fuseaction=ri.content&topicID=4&countryCode=CN
17. Otto, A. And Mika, N. (2010), ‘University research funding and publication performance – An international comparison’ Research Policy, 39.6, pp822-834.
17. World Bank (2009), The challenge of establishing world-class universities, p26 http://siteresources.worldbank.org/EDUCATION/Resources/278200-1099079877269/ 547664-1099079956815/547670-1237305262556/WCU.pdf
development funding is made available through ‘merit based competitive awards’15 distributed through research agencies such as the National Institutes of Health (NIH) and its science and technology counterpart the National Science Foundation (NSF). The competitive nature of these schemes ensures that excellence is rewarded. The USA does have some trends in allocating funding for different disciplines. The largest shares of funding available are for defence research, followed by health, aerospace and energy. Health was a particular area of investment in the 1990s, when the NIH budget doubled, which, alongside the continued interest in health, is likely to have contributed to the ‘spike’ of excellence in this area (fi gure 6). The USA’s system of distributing research and development funding is a competitive model without tightly targeted themes, this would seem to have contributed to the widespread areas of excellence revealed by the Elsevier data.
In contrast, China’s research competencies are more tightly focused in the sciences, mathematics and technology (fi gure 7). The publication footprint shows a distinctive profi le of excellence for China in these areas not replicated by the other comparator countries (fi gure 8). This distribution broadly refl ects China’s medium- to long-term national plan for science and technology development (2006-2020) which outlines ten prioritised fi elds mainly associated with the sciences and technology (energy, water and mineral resources, environment, agriculture, manufacturing technologies, information technology) although with some other broader areas like population and health, and urbanisation and public security.16 In comparison with the USA and the UK a minority of research competencies are associated with medical and health sciences despite this being a current priority. There is typically a six year time lag for changes in research funding policy to become apparent,17 and as this competency data is based on articles from 2006 to 2010 we may well see China expanding its number of research competencies in this area in the future. Research competencies are largely absent for the social sciences in China, a particular area of excellence for the UK, and neither is funding in these disciplines identifi ed as a priority.
110915_MappingResearchExcellence.indd 18110915_MappingResearchExcellence.indd 18 15/09/2011 11:1215/09/2011 11:12

19
Mapping Research Excellence
18. ERAWATCH (2010), Research Inventory Report for Germany, p7 http://cordis.europa.eu/erawatch/index.cfm?fuseaction=ri.content&topicID=4&countryCode=DE
19. ERAWATCH (2010), Research Inventory Report for Japan, p2 http://cordis.europa.eu/erawatch/index.cfm?fuseaction=ri.content&topicID=4&countryCode=JP
20. Ibid, p6.
21. UNESCO (2010), Science Report 2010, p437.
Japan and Germany have similarities in the distribution of research excellence across the disciplines, concentrating in maths and physics, chemistry and medical specialities (fi gures 9, 10, 11, 12). In addition, Germany also has a clustering of research competencies in the biological sciences. In Germany about 46% of research and development expenditures is on project funding, which is mainly through thematic programmes in specifi c scientifi c areas, although non-aligned funding does also have a role.18 For 2007 the most important thematic priorities (as a % of the total federal R&D budget) were defence, space, health, information and communication technologies and sustainability. We may, therefore, see a shift in discipline competencies in the future to technology related competencies, especially with the ‘High-Tech Strategy’ injecting funding into technology related areas. Interestingly, social sciences are scarce among Germany’s research competencies but have not been identifi ed as a priority area.
Japan’s disciplinary profi le of research excellence is noteworthy also in its absence of social science competencies (fi gure 10). The identifi cation of social structures as a priority for research in the Third Science and Technology Basic Plan20 which, alongside science and technology focused priorities, spans 2006 to 2010 may rectify this. Competencies may yet emerge in the social sciences as Japan extends its focus to cover social and natural issues, including problems associated with an aging population.21
We must consider that the low presence of social science competencies in Japan, China and Germany may in part be attributable to the role of language. The UK has the benefi t of publishing in English, therefore increasing accessibility to articles globally. This may assist research topics achieve competency status. This may be more diffi cult in countries which do not publish in English.
Perhaps the most targeted funding policies, and resultant focus in research competencies, can be found in Australia. UNESCO identifi es Australia as having a series of sharply defi ned priorities.20 Continuing from 2002 these are: environmental sustainability, health, frontier technologies and defence. These distinct priorities infl uence the distribution of competitive grants although not institutional grants. Institutional grants though the Excellence in Research for Australia (ERA) initiative and before it the Research Quality Framework distributes funds across all disciplines. These priorities in competitive
110915_MappingResearchExcellence.indd 19110915_MappingResearchExcellence.indd 19 15/09/2011 11:1215/09/2011 11:12
20
1994 Group
grants would seem to have translated very clearly into Australia’s research competencies with distinct clusters in the health sciences and the biological/earth sciences. Possibly refl ecting the broader defence and technology themes, competencies are also spread across maths, physics and chemistry.
Looking again to the social sciences, Australia has more competencies in this area than Japan, despite its lack of strategic focus in this area. We may speculate this is an effect of the quality related funding directed to institutions through the ERA. It may also be in part due to publishing in English. Australia would seem to achieve relative balance in its distribution of competencies across the disciplines with a two dimensional funding strategy.
These results suggest that research funding policies do translate to areas of national research excellence, although the extent to which this happens varies. This is not a precise science and links can only be suggested here, especially considering the time delay between policy implementation and this taking effect in academic outputs.
Each country takes a different approach to research funding priorities and yet there are some interesting overlaps in terms of competency profi les within different countries. The UK and the USA have similarities, as do Japan and Germany. Australia and China have both carved out profi les which are distinct from each other and the rest of the comparator group. Despite the overlaps differences in the competency productivity do not necessarily lead on from this. The UK has higher levels of competency productivity than the USA, and Germany exceeds the effi ciency of Japan. It follows that effi ciency is not necessarily linked to disciplines which are less expensive, such as the social sciences. Despite their similar profi les in research competencies and absence of social sciences competencies, Japan and Germany have differing levels of productivity.
Australia and China have carved out distinct research excellence profi les. Though China is considered a challenger to the USA in terms of publication outputs, so far competencies are in different areas of excellence to the USA. China’s areas of research excellence are focused in the sciences, not in the medical subjects where the USA dominates. Whilst China’s development may not have rivalled the USA in this discipline area thus far, this may change with health identifi ed as one of China’s priorities. Australia and China with their more structured approaches to distributing funding to disciplines have high levels of competency productivity. However, this is by no means the only way of generating research excellence or high productivity, as the UK’s competency profi le has shown.
110915_MappingResearchExcellence.indd 20110915_MappingResearchExcellence.indd 20 15/09/2011 11:1215/09/2011 11:12

21
Mapping Research Excellence
4. Growing and strengthening excellence
In assessing a nation’s research excellence it is vital to take into consideration the health and dynamism of research competencies. This has been proxied here by looking at the percentage of articles a country contributes to the competencies it is involved with, that is, its contribution to a competency (competency article share), how this has grown over the fi ve year period 2006-2010 (competency article share growth) and how this compares with the growth in competencies in the market as a whole (competency market growth). The growth of competency article share is taken to be a positive indicator that the country is expanding and strengthening its areas of excellence and a positive sign for national growth in research excellence overall.
Defi nitions of growth and article share termsCompetency article share – SciVal Spotlight provides the percentage of articles a country contributes to the competency it is involved with. For example, the UK contributes 21.5% of the articles in competency 414.
Average competency article share – this is the average (mean) of competency article share for all competencies a country is involved with. For example, on average the UK contributes 20.9% of the articles in competencies it is involved with.
Competency article share growth – the average annual growth in the country’s article share within the competency over the period 2006 to 2010. For example, the UK article share in competency 414 grows on average 0.2% each year. An average (mean) is also calculated for the country in all competencies. For example, the average growth of UK competencies over the period 2006 to 2010 is -0.4%.
Competency market growth – this is the average market article growth of the competencies the country is involved in, not the country’s own share but the share of the global market, in the period 2006 to 2010. For example, the number of articles contributing to competency 414 grew by 2.85% worldwide in the period 2006 to 2010. Globally, the number of articles contributing to the competencies the UK is involved with grew by 6.55%.
110915_MappingResearchExcellence.indd 21110915_MappingResearchExcellence.indd 21 15/09/2011 11:1215/09/2011 11:12
22
1994 Group
22. UNESCO (2010), Science Report 2010, p389.
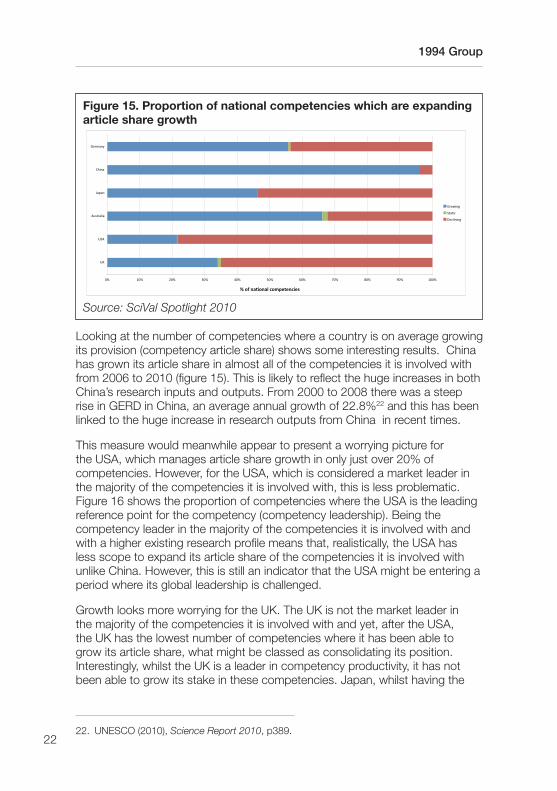
Looking at the number of competencies where a country is on average growing its provision (competency article share) shows some interesting results. China has grown its article share in almost all of the competencies it is involved with from 2006 to 2010 (fi gure 15). This is likely to refl ect the huge increases in both China’s research inputs and outputs. From 2000 to 2008 there was a steep rise in GERD in China, an average annual growth of 22.8%22 and this has been linked to the huge increase in research outputs from China in recent times.
This measure would meanwhile appear to present a worrying picture for the USA, which manages article share growth in only just over 20% of competencies. However, for the USA, which is considered a market leader in the majority of the competencies it is involved with, this is less problematic. Figure 16 shows the proportion of competencies where the USA is the leading reference point for the competency (competency leadership). Being the competency leader in the majority of the competencies it is involved with and with a higher existing research profi le means that, realistically, the USA has less scope to expand its article share of the competencies it is involved with unlike China. However, this is still an indicator that the USA might be entering a period where its global leadership is challenged.
Growth looks more worrying for the UK. The UK is not the market leader in the majority of the competencies it is involved with and yet, after the USA, the UK has the lowest number of competencies where it has been able to grow its article share, what might be classed as consolidating its position. Interestingly, whilst the UK is a leader in competency productivity, it has not been able to grow its stake in these competencies. Japan, whilst having the
Figure 15. Proportion of national competencies which are expanding article share growth
Source: SciVal Spotlight 2010
110915_MappingResearchExcellence.indd 22110915_MappingResearchExcellence.indd 22 15/09/2011 11:1215/09/2011 11:12

23
Mapping Research Excellence
least competency productivity in the comparator group, has a much higher proportion of competencies which are growing. It is pertinent to question here the link between national competency productivity and competency growth and what this could mean for the long term health of national research excellence. It may be that though the UK currently has high levels of competency productivity this could change in the future if the UK cannot maintain growth.
Looking to a different measure of competency health, the average competency article share of a country is mapped against the average market growth of the competencies the country is involved with (fi gure 17). We expect that countries with a high competency article share as well as competency market growth are those which have the healthiest outlook. Whilst the USA contributes a large article share to the competencies it is involved, with the overall worldwide market growth in these competencies is less than average (the axis are placed on the average for the comparator group). Meanwhile, China shows the largest levels of market competency growth, over 8%, and contributes a large proportion of articles to the competencies it is involved with, second only to the USA.
We should note that this graph does not take funding differences between the countries into consideration. We can suppose that the largest article shares are obtained by the countries with the largest expenditure on research and development (GERD) which can produce higher numbers of outputs. The USA and China are certainly two countries with high levels of expenditure in the comparator group, although Japanese GERD is actually higher than Chinese (table 1). Looking at the positioning in fi gure 17, Japan not only has a lower than expected article share considering its size of investment in GERD, but it also has the lowest competency market growth of all the countries in the
Figure 16. Competency leadership: proportion of competencies where the country is the leading reference point
Source: SciVal Spotlight 2010
110915_MappingResearchExcellence.indd 23110915_MappingResearchExcellence.indd 23 15/09/2011 11:1215/09/2011 11:12

24
1994 Group
Figure 17. Competency market growth and country competency share
Source: SciVal Spotlight 2010Notes: Size of bubbles relates to average article size of competencies, axis are placed on the average for the comparator group.
comparator group. The Japanese case is interesting; despite spending $148.7 billion in GERD in 2008, equating to 3.44% of GDP, Japan has not contributed to the competencies it is involved with as strongly as China and the USA proportionately and is behind the average for the group. Japan is also working in competencies which have the lowest market growth of all the countries examined here.
Tracking national competency article share growth against worldwide market growth in the same competencies produces some interesting results (fi gure 18). For a country to maintain its position in the market its competency article share growth must be zero. A higher competency article share growth indicates that the country has faster growth than the market and a negative competency article share growth means the country is not keeping pace with the market. Figure 18 shows that China’s growth in the competencies it is involved with is outstripping the market by a large extent. None of the other countries in the comparator group refl ect this to the same extent, although Australia and Germany also have higher growth in their competencies compared with the market. UK article share growth is a little behind market competency growth and has one of the lowest levels in the comparator group.
This fi gure highlights the same potential warning signs for the UK as fi gures 15 and 16 do. The UK has one of the lowest competency article share growths of the comparator group, second only to the USA, and competency article share growth is not keeping pace with market growth. This position is of greater concern for the UK than the USA. As has been shown in fi gure 16, the USA is the leading reference point in almost all of the competencies it is involved with, it therefore has less scope to expand its article share growth. For the UK, which is not a reference leader to the same extent, these results are more worrying.
110915_MappingResearchExcellence.indd 24110915_MappingResearchExcellence.indd 24 15/09/2011 11:1215/09/2011 11:12
25
Mapping Research Excellence
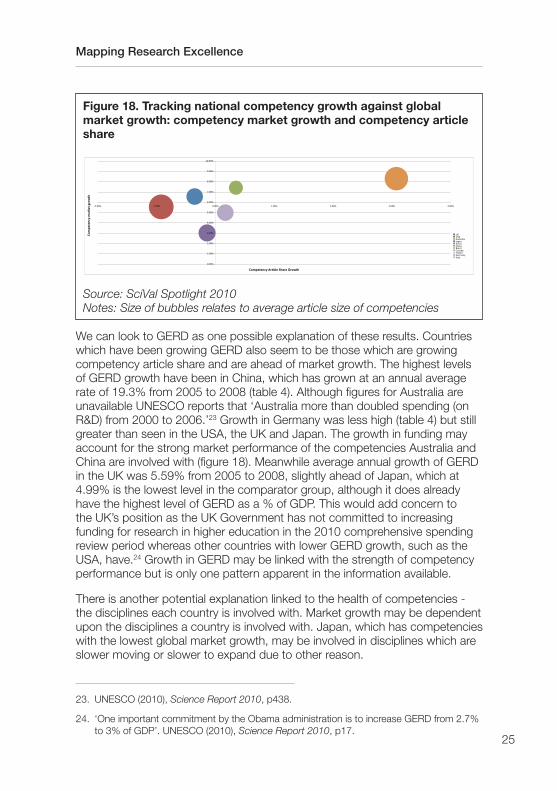
Figure 18. Tracking national competency growth against global market growth: competency market growth and competency article share
Source: SciVal Spotlight 2010Notes: Size of bubbles relates to average article size of competencies
We can look to GERD as one possible explanation of these results. Countries which have been growing GERD also seem to be those which are growing competency article share and are ahead of market growth. The highest levels of GERD growth have been in China, which has grown at an annual average rate of 19.3% from 2005 to 2008 (table 4). Although fi gures for Australia are unavailable UNESCO reports that ‘Australia more than doubled spending (on R&D) from 2000 to 2006.’23 Growth in Germany was less high (table 4) but still greater than seen in the USA, the UK and Japan. The growth in funding may account for the strong market performance of the competencies Australia and China are involved with (fi gure 18). Meanwhile average annual growth of GERD in the UK was 5.59% from 2005 to 2008, slightly ahead of Japan, which at 4.99% is the lowest level in the comparator group, although it does already have the highest level of GERD as a % of GDP. This would add concern to the UK’s position as the UK Government has not committed to increasing funding for research in higher education in the 2010 comprehensive spending review period whereas other countries with lower GERD growth, such as the USA, have.24 Growth in GERD may be linked with the strength of competency performance but is only one pattern apparent in the information available.
There is another potential explanation linked to the health of competencies - the disciplines each country is involved with. Market growth may be dependent upon the disciplines a country is involved with. Japan, which has competencies with the lowest global market growth, may be involved in disciplines which are slower moving or slower to expand due to other reason.
23. UNESCO (2010), Science Report 2010, p438.
24. ‘One important commitment by the Obama administration is to increase GERD from 2.7% to 3% of GDP’. UNESCO (2010), Science Report 2010, p17.
110915_MappingResearchExcellence.indd 25110915_MappingResearchExcellence.indd 25 15/09/2011 11:1215/09/2011 11:12

26
1994 Group
It may be that different countries have different strategic approaches to growing research excellence, choosing either to invest in new disciplines or to consolidate their positions in those areas which are already considered excellent. Whilst the UK has a high level of competency productivity it does not have the same levels of competency article share growth as Germany which has a comparable number of competencies. Germany has a lower level of competency productivity, but this may be because it is investing in expanding its provision of current areas of research excellence. It may be that certain disciplines have a greater ability to evolve into new discipline areas and therefore have a greater potential to produce new research competencies. This may impact upon the observed growth rates and the productivity of each country in producing research competencies. The high competency productivity of the UK certainly suggests that the UK has an innovative approach to developing new areas of research excellence whilst other countries may be more interested, or predisposed, to strengthening current areas of excellence.
China’s rapid period of expansion in research and development would seem to have had positive results in research excellence with competencies thriving. However, Chinese success is not guaranteed. There may be drawbacks in the future if ‘the academic culture that demands quick results hampers innovative and long term research efforts.’25 China’s investment in research and development has concentrated upon applied rather than basic research which may affect China’s future success. UNESCO reports that the majority of GERD in China is spent on experimental development with an estimated 5% on basic research. Whilst China is currently performing well and is expanding its research excellence, sustainability issues may emerge. We are reminded that ‘great universities are not only useful in their own time, but in preparing for future times.’26
Although the UK has a high level of competency productivity, there are warning signs apparent in the growth and strengthening of research excellence. The UK has thus far performed well in comparison with countries such as Germany, which receive similar levels of funding, both in productivity and competency article share. However, there are warning signs that this may change in the future. The UK currently has the second lowest proportion of competencies where the article share is growing (fi gure 15), second only to the USA. The USA and the UK also have the two lowest levels of average competency article share growth (fi gure 18). This is more serious for the UK than the USA. The USA is the leading reference point for the majority of its competencies (fi gure 16) and with such high existing research performance has less scope to expand.
25. World Bank (2009), The challenge of establishing world-class universities, p59.
26. Ibid.
110915_MappingResearchExcellence.indd 26110915_MappingResearchExcellence.indd 26 15/09/2011 11:1215/09/2011 11:12

27
Mapping Research Excellence
To conclude, the interaction between growth of research excellence and national research funding policies is understandably complex. However, we are able to speculate on factors which may affect the strength of research excellence. Amount of GERD in absolute terms is likely to infl uence the competency article share a country achieves, which is why we see the USA and China with high levels of article share, although Japan does not perform as well on this as might be expected. Meanwhile annual average growth in GERD may be linked with the article share growth within competencies and with the ability to keep pace with the market. Japan and the UK, for instance, have some of the lowest growth in GERD and some of the lowest competency article share growths of all countries. The small growth in UK GERD may point to a decline in the UK’s current position of research excellence, especially when coupled with the low number of competencies which are growing.
The UK may so far have been protected from a decline in competency productivity by its effi cient use of funding, the underlying core of Government funding for research and a strong higher education sector. Whilst UK performance in research excellence has thus far been strong, we should take low competency article share growth indicators as early warnings that this may change in the future.
110915_MappingResearchExcellence.indd 27110915_MappingResearchExcellence.indd 27 15/09/2011 11:1215/09/2011 11:12
28
1994 Group
27. HEPI (2010), Funding selectivity, concentration and excellence – how good is the UK’s research?, p2 http://www.hepi.ac.uk/455-1793/Funding-selectivity,-concentration-and-excellence---how-good-is-the-UK’s-research.html
28. Full lists of the 1994 Group and Russell Group membership can be found at the websites http://www.1994group.ac.uk/memberinstitutions and http://www.russellgroup.ac.uk/our-universities.aspx
5. Contribution of research intensive institutions to national research excellence
Research and development policies in different countries follow different methods of distributing funding to higher education institutions. Links can be drawn between approaches which concentrate research and development funding at institutional level and how this might contribute to the achievement of research excellence by the country as a whole. Interestingly, it would seem that funding strategically focused to a select number of institutions does not necessarily translate into a greater contribution by research intensive institutions to national funding competencies.
With its policy of funding research through the dual support mechanism the UK follows a widely distributive funding approach. Quality related funding or block grant funding in the UK is distributed on the basis of merit through the Research Assessment Exercise (RAE) (from 2014 to change to the Research Excellence Framework (REF)). Excellence is rewarded wherever it is found without regard to activity size or critical mass. With this widely distributive approach research funding concentrates naturally, 90% of research funding is accounted for by 48 institutions.27 This group features strongly the 39 research intensive institutions of the 1994 Group and the Russell Group. But what is the contribution to competencies of the research intensive universities in the UK and how does this compare with research intensive institutions within other countries?
1994 Group and Russell Group28 institutions make a signifi cant (top 10) contribution to 92% of all research competencies in the UK. This is comparable
110915_MappingResearchExcellence.indd 28110915_MappingResearchExcellence.indd 28 15/09/2011 11:1215/09/2011 11:12

29
Mapping Research Excellence
to the involvement of the USA’s research intensive institutions29 which stands at 94% and Australia30 95%. A sample of research intensive institutions in China, Japan and Germany on the other hand appear to show that they play a less signifi cant role in national competencies. In Japan what can be classed as the Research University 1131 signifi cantly contribute to 84% of national competencies, the Chinese Group of 932 institutions to 72% of competencies and the German Elite 933 to 52% of competencies. It is not straightforward to classify research intensive institutions and whilst the results point to some interesting trends we should be mindful of the effects of the proxies used.
Table 6. Proportion of national competencies research intensive institutions contribute to (%)
Country% of national competencies contributed to (top 10)
UK 92
USA 93
Australia 95
Japan 84
China 72
Germany 52
Source: Scival Spotlight 2010
29. As a proxy these have been classed as the 63 members of the American Association of Universities (AAU).
30. Australia’s research intensive institutions have here been proxied as the Group of 8 institutions. These are: University of Queensland; Australian National University; University of Sydney; University of Western Australia; University of New South Wales; University of Adelaide; Monash University and University of Melbourne.
31. The Research University 11 of Japan was formed in 2010 and is a group of universities that focuses on research and development. These are: University of Tokyo; Kyoto University; Tohoku University; Osaka University; Nagoya University; Hokkaido University; Kyushu University; Tokyo Institute of Technology; Tskuba University; Keio University and Waseda University.
32. The China Group of 9 (C9) also known as ‘Project 985’ Phase 1 are Peking University; Tsinghua University; Fudan University; Shanghai Jio Tong University; Nanjing University; Zhejiang University; Xi’an Jiaotong University; University of Technology and Science China and Harbin institute of Technology (http://www.go8.edu.au/university-staff/international-collaboration/go8-vice-chancellors-and-china-9-presidents-signed-mou).
33. The 9 Elite German Universities are defi ned as those which have achieved funding through the Excellence Initiative for Institutional Strategies. These are: Ludwig Maximilan University (LMU) Munich; Technical University of Munich; Karlsruhe Institute of Technology (KIT); RWTH Aachen University; Freie University Berlin; University of Freiburg; University of Gottingen; University of Heidelberg and University of Konstanz.http://www.dfg.de/download/pdf/dfg_im_profi l/geschaeftsstelle/publikationen/exin_broschuere_1104_en.pdf).
110915_MappingResearchExcellence.indd 29110915_MappingResearchExcellence.indd 29 15/09/2011 11:1215/09/2011 11:12
30
1994 Group
In the UK, Australia and the USA research intensive institutions contribute the most to national competencies, these countries also pursue more widely distributive funding policies. Australia has a similar dual support system to the UK, both have been described as more competitive funding systems.34 The USA has a strongly competitive funding model, and the freedom in funding allocation and the spirit of competitiveness which this engenders have been attributed to the USA’s success in producing excellent universities.35 Even in this widely distributive funding system UNESCO reports that the top 100 USA universities account for 80% of all research and development expenditure in federal grants and the top 200 universities for 96%.36
China, Japan and Germany have all adopted policies which target funding at a focused number of institutions yet interestingly the sample of research intensive institutions considered here do not refl ect a greater contribution to national research competencies. China provides block funding more intensively to approximately 100 institutions, reportedly to compensate for prior underfunding, as part of its 211 Project launched in 1996. This has been supplemented by the 985 Project which has provided additional fi nancial support to 34 top universities to concentrate resources at those institutions with the greatest potential for international success.37 Japan has chosen a similar number of institutions for targeted funding through the ‘Japan Top-30 Centres of Excellence for the 21st Century’ launched in 2002. Under this scheme additional funding is provided for 31higher education institutions. Germany, which has traditionally had a non-competitive distribution of research funding, has started to concentrate additional funds as part of its Germany Excellence Initiative (launched in 2006 with ongoing rounds), part of which sees 10 universities (9 in earlier rounds) of excellence receive additional support.
The World Bank38 has linked a competitive environment with research performance, citing ‘the ‘absolute lack of competition among universities’ in Germany as holding back the performance of its universities. In recent years German funding policy has moved away from the tradition of non-competitive block grant funding by supplementing this with additional funds under the Germany Excellence Initiative in a conscious approach to differentiate its universities. Although targeted allocations under this scheme are based on competition we are yet to see whether long term funding schemes of this nature will produce the necessary competitive environment or whether the
34. Otto, A. And Mika, N. (2010), ‘University research funding and publication performance – An international comparison’ Research Policy, 39.6, pp822-834.
35. World Bank (2009), The challenge of establishing world-class universities, p26.
36. UNESCO (2010), Science Report 2010, p47.
37. World Bank (2009), The challenge of establishing world-class universities, p40.
38. Ibid, p29.
110915_MappingResearchExcellence.indd 30110915_MappingResearchExcellence.indd 30 15/09/2011 11:1215/09/2011 11:12
31
Mapping Research Excellence
scheme will simply concentrate resource without enhancing competition. The same principles can be applied to Japan and China. Although these countries select institutions to receive concentrated funding through competitive measures these long term competitions and mechanisms may not have the same effect of establishing a natural level of concentration as the policies in the UK, the USA and Australia can be seen to have done.
A competitive funding environment would seem to be linked to successful research intensive institutions by allowing funds to concentrate responsively to institutional excellence. The success of competitive funding policies will depend upon the unique situation within each country and the methods and types of funding used, as the Japanese case demonstrates.
Japan has moved to a more competitive system of higher education funding in a period of substantial change in the structure of Japanese higher education. Japanese higher education institutions have been semi-privatised and given higher levels of fi nancial autonomy with the intention of replicating the competitive grant system in the USA. This has been coupled with a decline in Government support. Rather than the greater industry-university collaboration this was intended to foster, it is reported that in fact many national university corporations are now facing fi nancial diffi culties, as only a select number of institutions have been able to benefi t from more competitive funding arrangements.39 It is understood that the Japanese Government is now reconsidering the balance between regular and competitive funding. The more competitive system may have been implemented too quickly to allow the sector to respond and for funding to concentrate at a natural level. UNESCO also argues that such policy changes need to be matched to the culture of academe in the country: ‘the Government’s policy of focusing investment on the nation’s top universities may have improved their performance but, at the same time, damaged the research and development capacities of other universities, thereby destroying the domestic networks of researchers along with the diverse capabilities and approaches these have to offer.’40
Although the contributions of research intensive institutions to national competencies vary, the rate at which these institutions convert articles into competencies is remarkably similar. Research intensive institutions in most countries contribute to two national competencies with every 100 articles (table 7 and fi gure 19). The USA and China contribute to four competencies for the same number of articles. This may be as a result of higher levels of funding which are not taken into account in this calculation. Although research intensive institutions would seem to contribute to national research competencies to different degrees, possibly as a result of the concentration of research funding, this does not seem to affect competency productivity at institutions.
39. UNESCO (2010), Science Report 2010, p404.
40. Ibid.
110915_MappingResearchExcellence.indd 31110915_MappingResearchExcellence.indd 31 15/09/2011 11:1215/09/2011 11:12
32
1994 Group
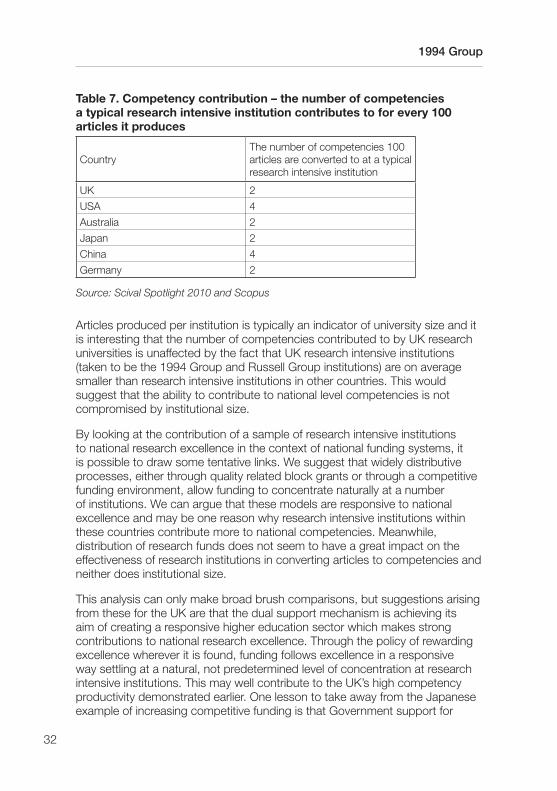
Table 7. Competency contribution – the number of competencies a typical research intensive institution contributes to for every 100 articles it produces
CountryThe number of competencies 100 articles are converted to at a typical research intensive institution
UK 2
USA 4
Australia 2
Japan 2
China 4
Germany 2
Source: Scival Spotlight 2010 and Scopus
Articles produced per institution is typically an indicator of university size and it is interesting that the number of competencies contributed to by UK research universities is unaffected by the fact that UK research intensive institutions (taken to be the 1994 Group and Russell Group institutions) are on average smaller than research intensive institutions in other countries. This would suggest that the ability to contribute to national level competencies is not compromised by institutional size.
By looking at the contribution of a sample of research intensive institutions to national research excellence in the context of national funding systems, it is possible to draw some tentative links. We suggest that widely distributive processes, either through quality related block grants or through a competitive funding environment, allow funding to concentrate naturally at a number of institutions. We can argue that these models are responsive to national excellence and may be one reason why research intensive institutions within these countries contribute more to national competencies. Meanwhile, distribution of research funds does not seem to have a great impact on the effectiveness of research institutions in converting articles to competencies and neither does institutional size.
This analysis can only make broad brush comparisons, but suggestions arising from these for the UK are that the dual support mechanism is achieving its aim of creating a responsive higher education sector which makes strong contributions to national research excellence. Through the policy of rewarding excellence wherever it is found, funding follows excellence in a responsive way settling at a natural, not predetermined level of concentration at research intensive institutions. This may well contribute to the UK’s high competency productivity demonstrated earlier. One lesson to take away from the Japanese example of increasing competitive funding is that Government support for
110915_MappingResearchExcellence.indd 32110915_MappingResearchExcellence.indd 32 15/09/2011 11:1215/09/2011 11:12
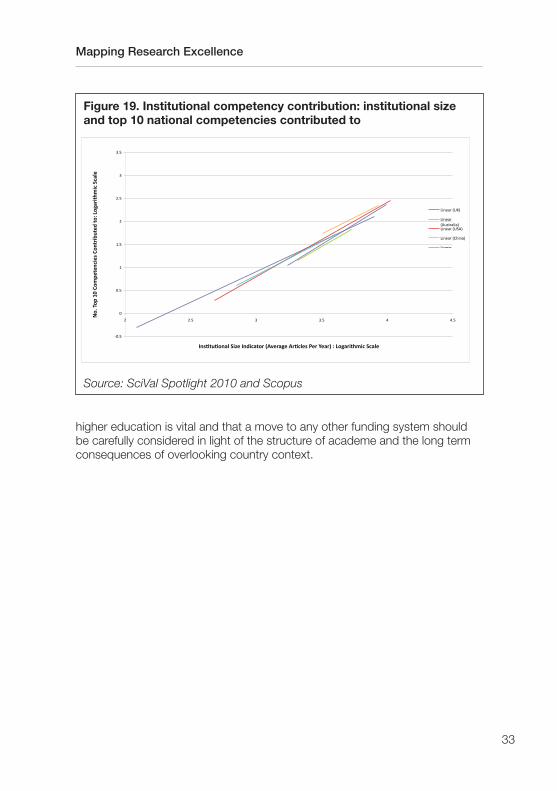
33
Mapping Research Excellence
higher education is vital and that a move to any other funding system should be carefully considered in light of the structure of academe and the long term consequences of overlooking country context.
Figure 19. Institutional competency contribution: institutional size and top 10 national competencies contributed to
Source: SciVal Spotlight 2010 and Scopus
110915_MappingResearchExcellence.indd 33110915_MappingResearchExcellence.indd 33 15/09/2011 11:1215/09/2011 11:12
34
1994 Group
6. ConclusionsIt is clear from the brief examination here that there is no universal ‘right way’ to produce national research excellence. Policies and systems for funding research vary widely between countries according to national context and differing strategic aims. Research excellence is not a one dimensional concept and it is only right that such a wide variety of research support mechanisms have emerged both in the higher education sector and in wider national research and development funding.
Through the new perspective of research excellence generated by Elsevier’s SciVal Spotlight and in light of differences in higher education funding mechanisms we are able to put forward several factors which would seem to be linked to excellent national research performance. We put these forward now for consideration by the sector and to prompt further investigation . The factors suggested by this report are:
• an underlying core of Government funded research and support for higher education;
• higher education policies for distributing funding to particular disciplines which are appropriate to the country;
• continuing investment to support growth; and
• a competitive research funding environment which rewards excellence wherever it is found.
Whilst national expenditure on research and development is connected to the number of areas of research excellence there are other factors at play. The UK attains a far higher number of research competencies than its level of funding would predict, in fact the UK is the highest producer of research competencies relative to funding out of the world leading countries examined here. The UK produces more ‘bang per buck’ in producing research excellence. An examination of national research and development funding patterns leads us to suggest that a strong underlying core of Government funding for national research and greater funding in higher education research and development are associated with high levels of competency productivity. This suggests that a well supported higher education sector and an underlying core of Government support for research contributes to national research excellence and productivity.
Research excellence in different disciplines is linked with national funding priorities. The UK has a widely distributive approach to funding research in higher education with resources provided across all disciplines.
110915_MappingResearchExcellence.indd 34110915_MappingResearchExcellence.indd 34 15/09/2011 11:1215/09/2011 11:12
35
Mapping Research Excellence
This is refl ected in the fi nding that UK research excellence is found within all disciplines. A similar pattern is found in the USA but is not replicated elsewhere. Australia’s research excellence profi le demonstrates the effects of a tightly targeted funding policy, mirroring research themes identifi ed nationally. Interestingly, China, which is competing with the USA in size of research output, so far dominates in areas of research excellence which would seem to complement rather than challenge the USA. The USA has a special focus on medical sciences whereas China’s competencies are less developed in this discipline. However, this may change in the future with health identifi ed as one of China’s research priorities.
Countries have taken different approaches to funding different disciplines; this may contribute to productivity in research excellence but is not the only factor. The UK does not tend to target funding to particular disciplines. This may be why research excellence is found across all subject areas. A broad discipline base of excellence may have contributed to high productivity in research excellence. However, this is not the only way of creating research excellence. Australia also achieves high productivity in research excellence though it tightly targets funding to particular discipline areas.
When assessing the research excellence of a nation it is necessary to look also at indicators of health of the system and possible trends for future growth. This report fi nds that growth and sustainability of research excellence may be linked with increased research spending. The UK has some of the lowest indicators of competency growth despite its current high levels of excellence and productivity. This, combined with one of the lowest proportional rises in research and development spending, whilst other countries such as the USA and China are increasing commitments, may be warning signal for the UK. Whilst currently the UK has the highest performance comparatively in research excellence this position is vulnerable.
The contribution of research intensive institutions to national competencies varies. Indications are this is linked to how funding is concentrated within higher education institutions. It is suggested here that research intensive institutions contribute most highly to national research excellence when funding concentrates according to merit. Where funding follows excellence, and thus concentrates naturally at a certain level, there are signs that research intensive institutions make the largest contributions to national research excellence. Systems which allow for this natural level of concentration include the dual funding system in the UK and Australia and the USA’s mainly competitive system. Responsive systems for funding institutions are linked to national excellence productivity but are only part of the picture. The UK and Australia achieve high competency productivity with their widely distributive schemes, but China is also able to achieve effi ciency though it targets funding to institutions in a more concentrated manner.
110915_MappingResearchExcellence.indd 35110915_MappingResearchExcellence.indd 35 15/09/2011 11:1215/09/2011 11:12

36
1994 Group
Competitive funding schemes must be appropriate for the country and retain Government support. Japan provides a case in point that funding systems must be tailored to the structure of academe in the country. It also suggests that Government support is important for higher education, and industry cannot be expected to play the same funding role as Government.
The UK’s strong performance suggests a good policy balance has been achieved for the UK to reach high research excellence. We suggest factors contributing to the UK’s success have been:
• an underlying core of Government support for research and for higher education;
• a higher education sector which plays a strong role in producing national research;
• funding which supports all disciplines; and
• a competitive funding environment through the dual support mechanism which rewards excellence wherever it is found.
Looking ahead though, if the UK wishes to maintain its current levels of excellence we may have to look to innovative solutions. This analysis suggests increasing research and development spending would be one way of boosting growth. However, in the UK’s current fi scal situation alternatives may need to be sought.
The research performance of the UK is refl ective of the researchers and academics working in Britain. The UK has a track record of being able to attract the best staff internationally to work in the UK and establish their careers here. Being able to recruit from a global talent-pool is undoubtedly an advantage for the UK in terms of its research performance and the contribution academia is able to make to the UK economically and socially. It is imperative that the UK should continue to be able to recruit the brightest and best from around the world. Research staff are increasingly mobile and the UK needs to be able to recruit and retain the very best staff who will contribute to the research excellence of the UK. To fail to be able to recruit the best staff would have drastic consequences for the UK’s research excellence.
The UK should continue to build on its strengths in the changing fi nancial environment. New research funding and policy mechanisms which are implemented should build upon these strengths which have established the UK as a leader in producing research competencies. We should continue with our widely distributive funding policies, funding which rewards excellence wherever it is found supported by a strong core of Government support to national research and higher education.
110915_MappingResearchExcellence.indd 36110915_MappingResearchExcellence.indd 36 15/09/2011 11:1215/09/2011 11:12

110915_MappingResearchExcellence.indd 37110915_MappingResearchExcellence.indd 37 15/09/2011 11:1215/09/2011 11:12

Visit us online at www.1994group.co.uk
Telephone: +44 (0)20 7872 5598Email: [email protected]
1994 Group1 Northumberland AvenueTrafalgar SquareLondon WC2N 5BW
110915_MappingResearchExcellence.indd 38110915_MappingResearchExcellence.indd 38 15/09/2011 11:1215/09/2011 11:12