Embed Size (px)
Citation preview
Exploring Genetic and Phenotypic Approaches to Aggregating Disease VariantsAnn CirincioneLHNCBC Medical Informatics Training ProgramDr. Olivier BodenreiderAugust 11, 2017
1
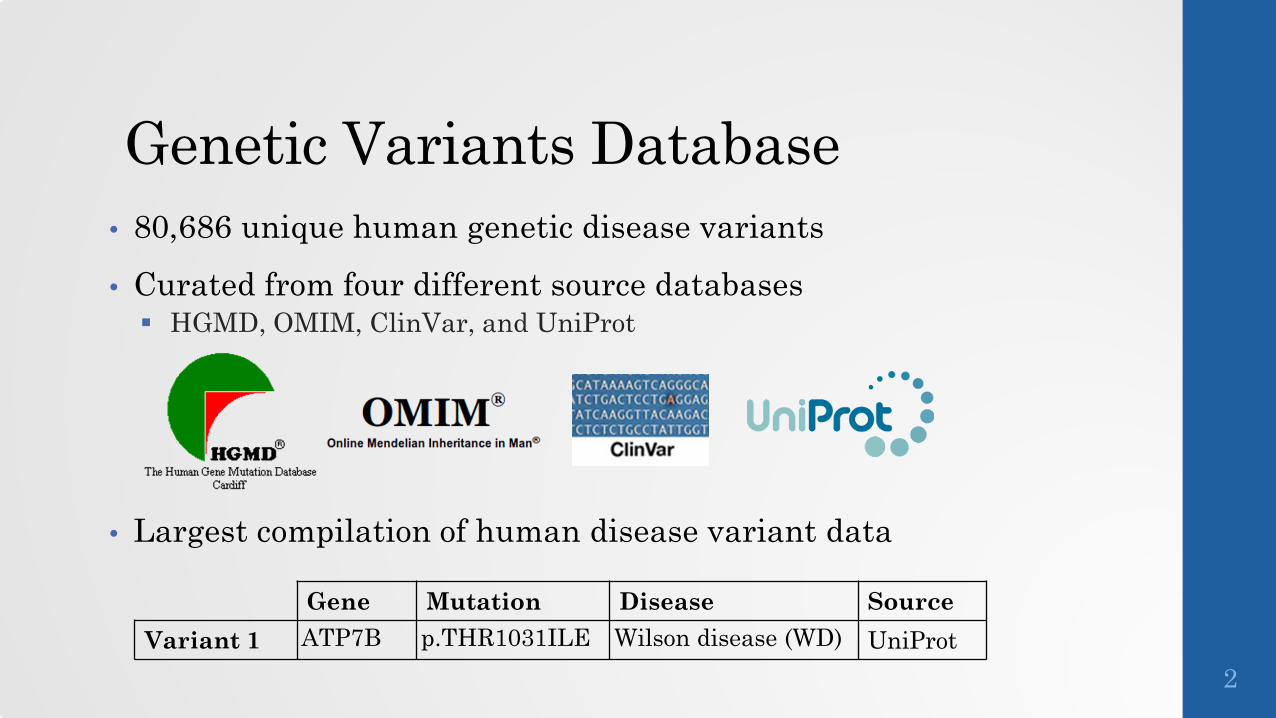
Genetic Variants Database• 80,686 unique human genetic disease variants
• Curated from four different source databases HGMD, OMIM, ClinVar, and UniProt
• Largest compilation of human disease variant data
2
Gene Mutation Disease SourceVariant 1 ATP7B p.THR1031ILE Wilson disease (WD) UniProt
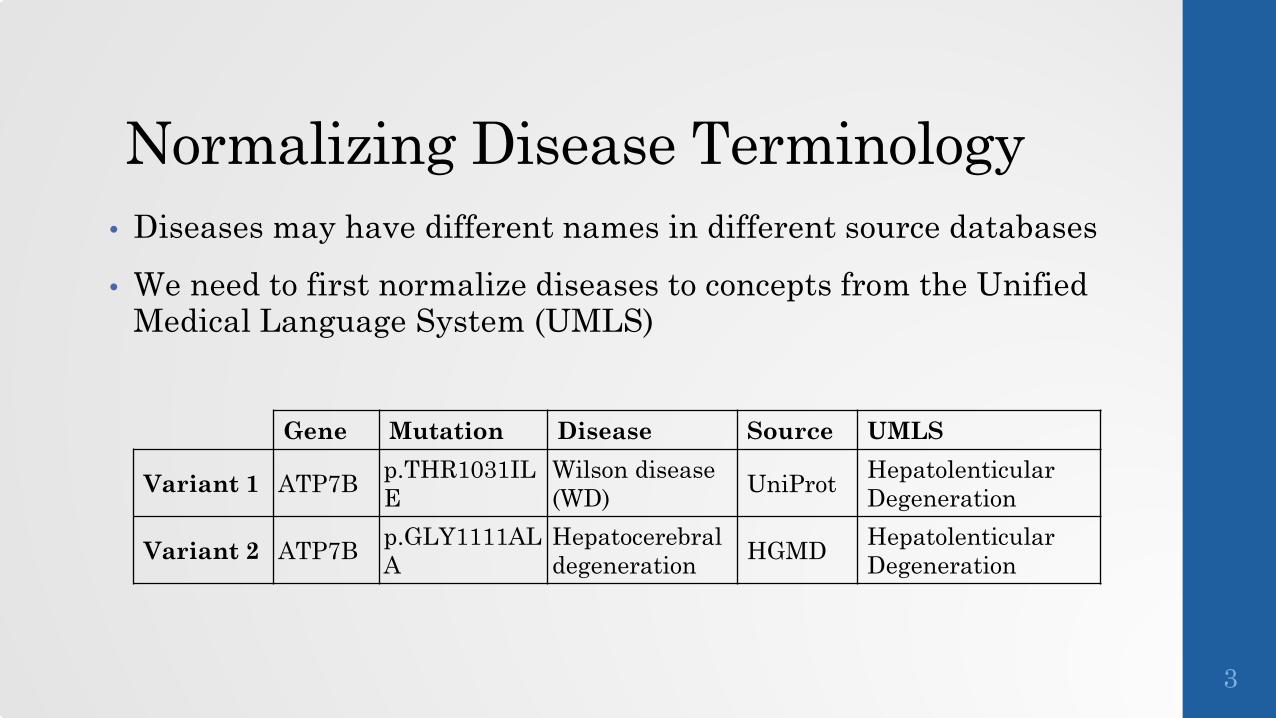
Normalizing Disease Terminology• Diseases may have different names in different source databases
• We need to first normalize diseases to concepts from the Unified Medical Language System (UMLS)
3
Gene Mutation Disease Source UMLS
Variant 1 ATP7B p.THR1031ILE
Wilson disease (WD) UniProt Hepatolenticular
Degeneration
Variant 2 ATP7B p.GLY1111ALA
Hepatocerebraldegeneration HGMD Hepatolenticular
Degeneration
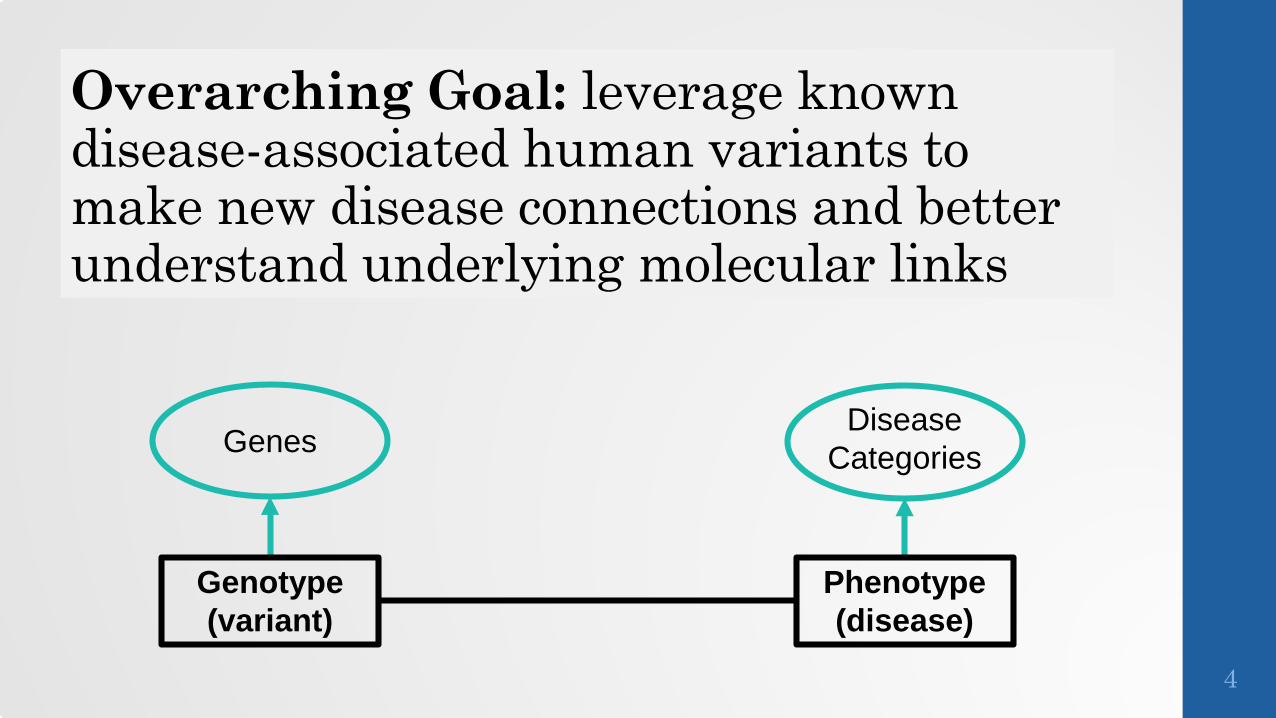
Overarching Goal: leverage known disease-associated human variants to make new disease connections and better understand underlying molecular links
Genotype (variant)
Phenotype (disease)
Disease CategoriesGenes
4
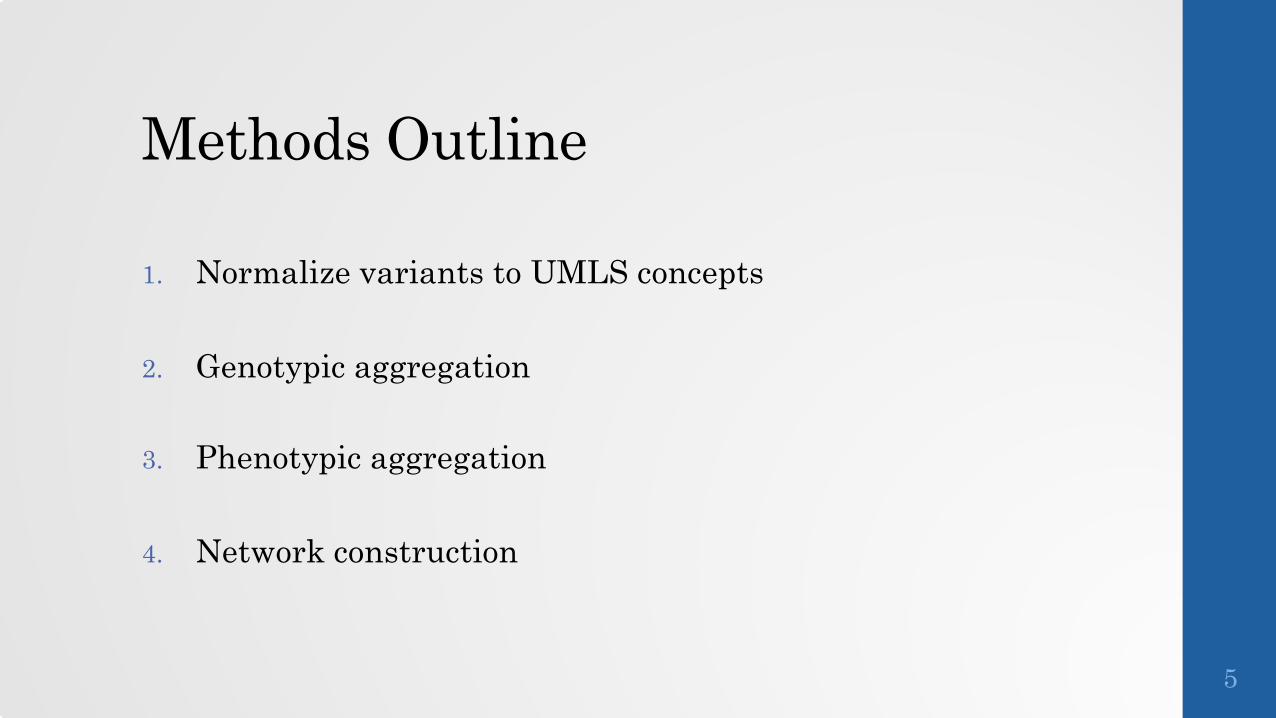
Methods Outline
1. Normalize variants to UMLS concepts
2. Genotypic aggregation
3. Phenotypic aggregation
4. Network construction
5
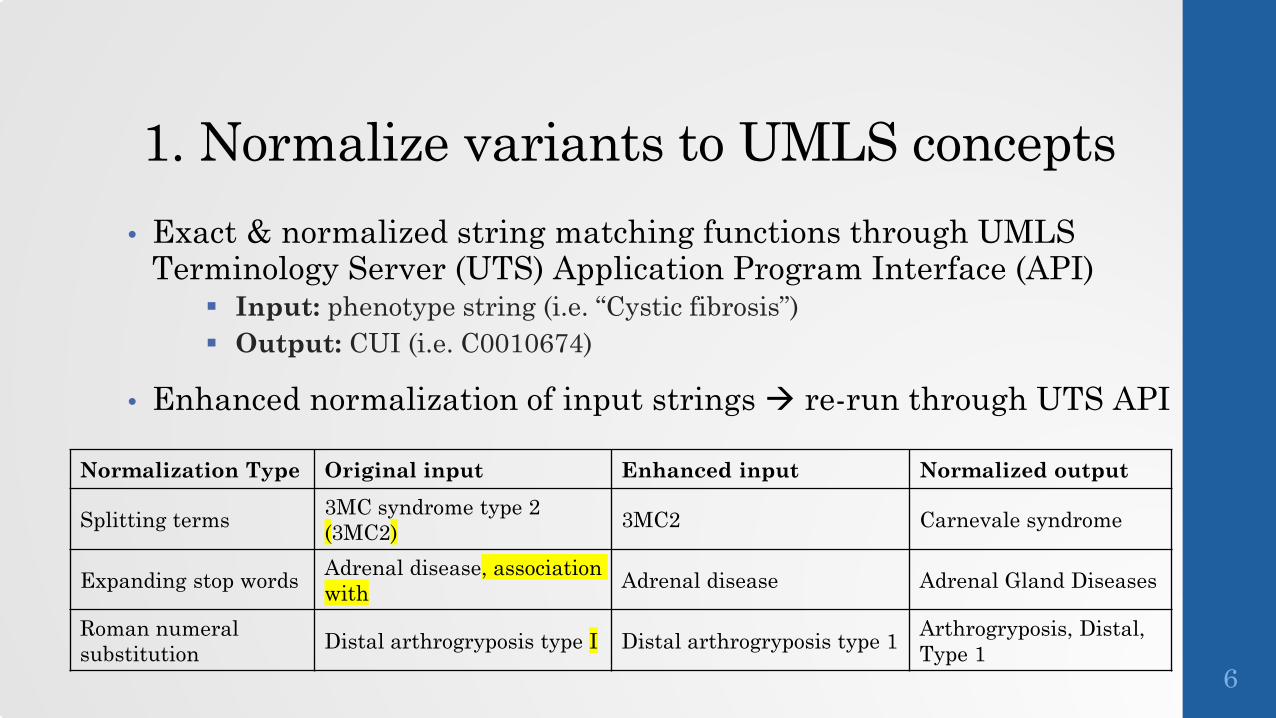
1. Normalize variants to UMLS concepts• Exact & normalized string matching functions through UMLS
Terminology Server (UTS) Application Program Interface (API) Input: phenotype string (i.e. “Cystic fibrosis”) Output: CUI (i.e. C0010674)
• Enhanced normalization of input strings re-run through UTS API
6
Normalization Type Original input Enhanced input Normalized output
Splitting terms 3MC syndrome type 2 (3MC2) 3MC2 Carnevale syndrome
Expanding stop words Adrenal disease, association with Adrenal disease Adrenal Gland Diseases
Roman numeral substitution Distal arthrogryposis type I Distal arthrogryposis type 1 Arthrogryposis, Distal,
Type 1
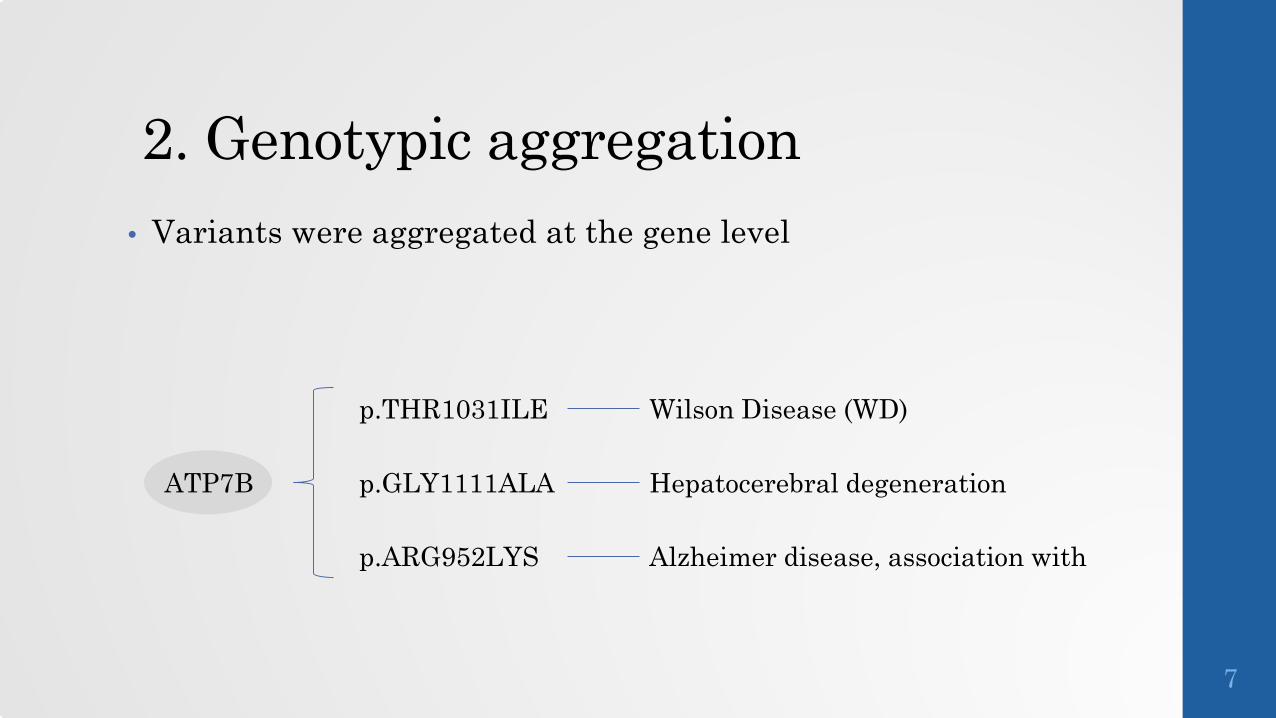
2. Genotypic aggregation• Variants were aggregated at the gene level
7
p.GLY1111ALA
p.THR1031ILE
p.ARG952LYS
ATP7B Hepatocerebral degeneration
Wilson Disease (WD)
Alzheimer disease, association with
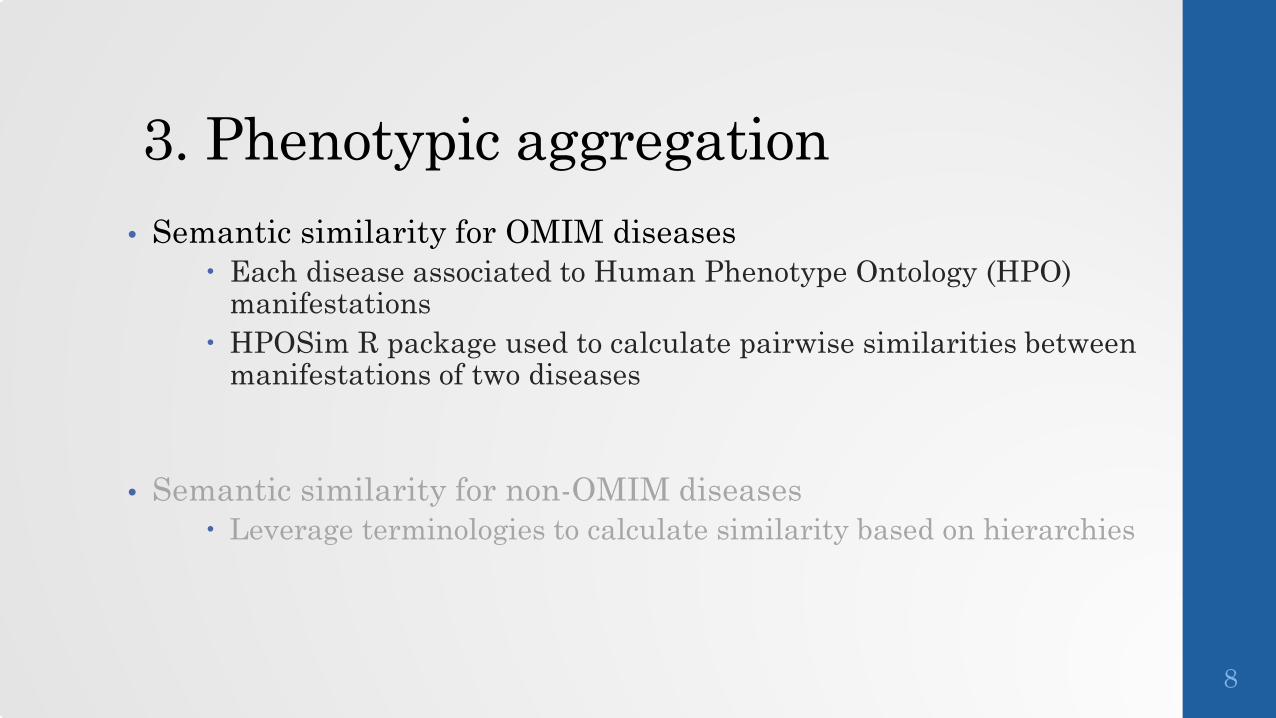
3. Phenotypic aggregation
8
• Semantic similarity for OMIM diseases Each disease associated to Human Phenotype Ontology (HPO)
manifestations HPOSim R package used to calculate pairwise similarities between
manifestations of two diseases
• Semantic similarity for non-OMIM diseases Leverage terminologies to calculate similarity based on hierarchies
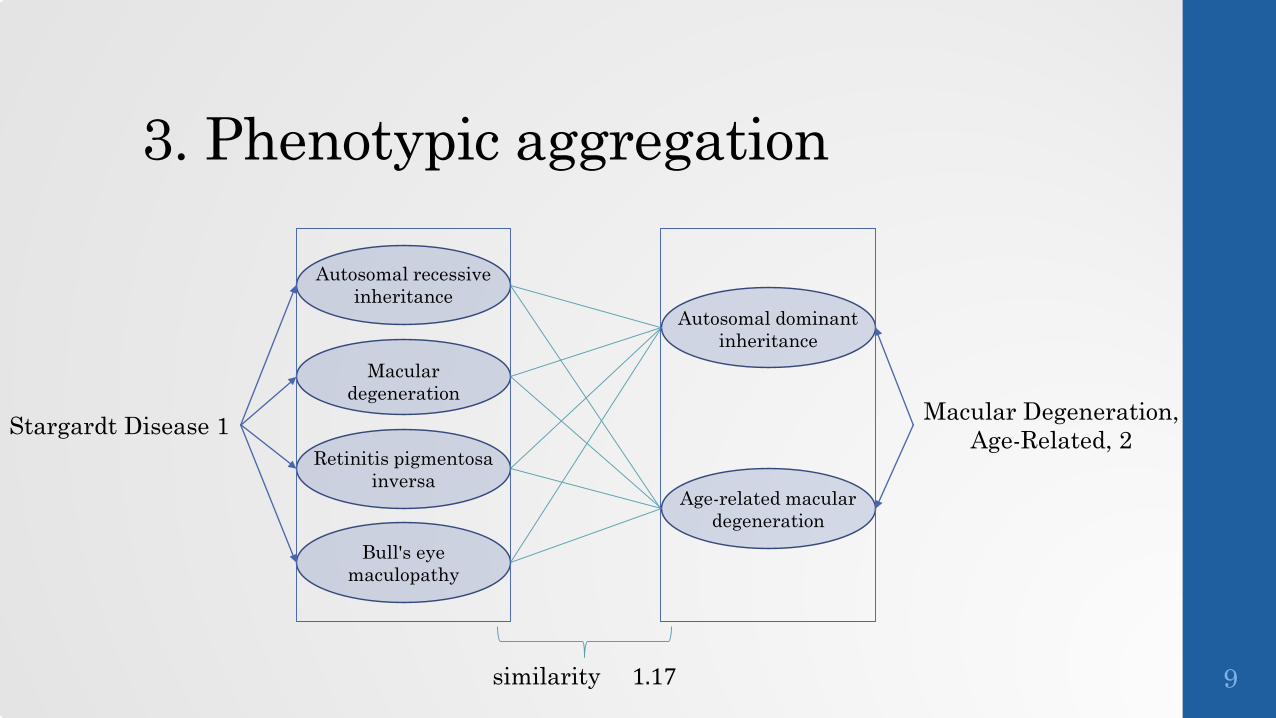
Autosomal recessive inheritance
Macular degeneration
Retinitis pigmentosa inversa
Bull's eye maculopathy
Autosomal dominant inheritance
Age-related macular degeneration
9
Stargardt Disease 1 Macular Degeneration, Age-Related, 2
3. Phenotypic aggregation
similarity = 1.17
3. Phenotypic aggregation
10
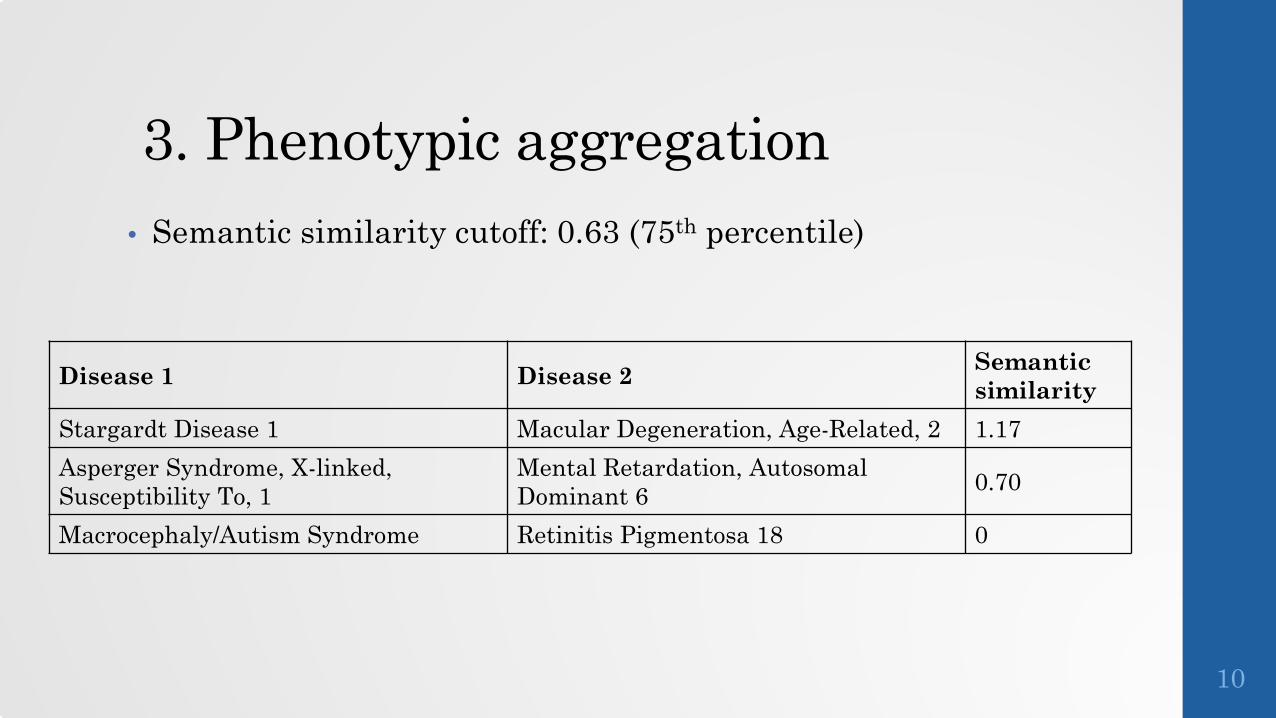
• Semantic similarity cutoff: 0.63 (75th percentile)
Disease 1 Disease 2 Semantic similarity
Stargardt Disease 1 Macular Degeneration, Age-Related, 2 1.17Asperger Syndrome, X-linked, Susceptibility To, 1
Mental Retardation, Autosomal Dominant 6 0.70
Macrocephaly/Autism Syndrome Retinitis Pigmentosa 18 0
4. Network construction
11
• A bipartite graph was constructed, linking human genetic variants to diseases Looking for disease hubs, where one disease is linked to many variants
• A disease-disease connection graph was constructed, with links between diseases that have similar manifestations and/or are mapped to the same gene Looking for connections that differ between approaches
12
A B
C
Results:Bipartite graph
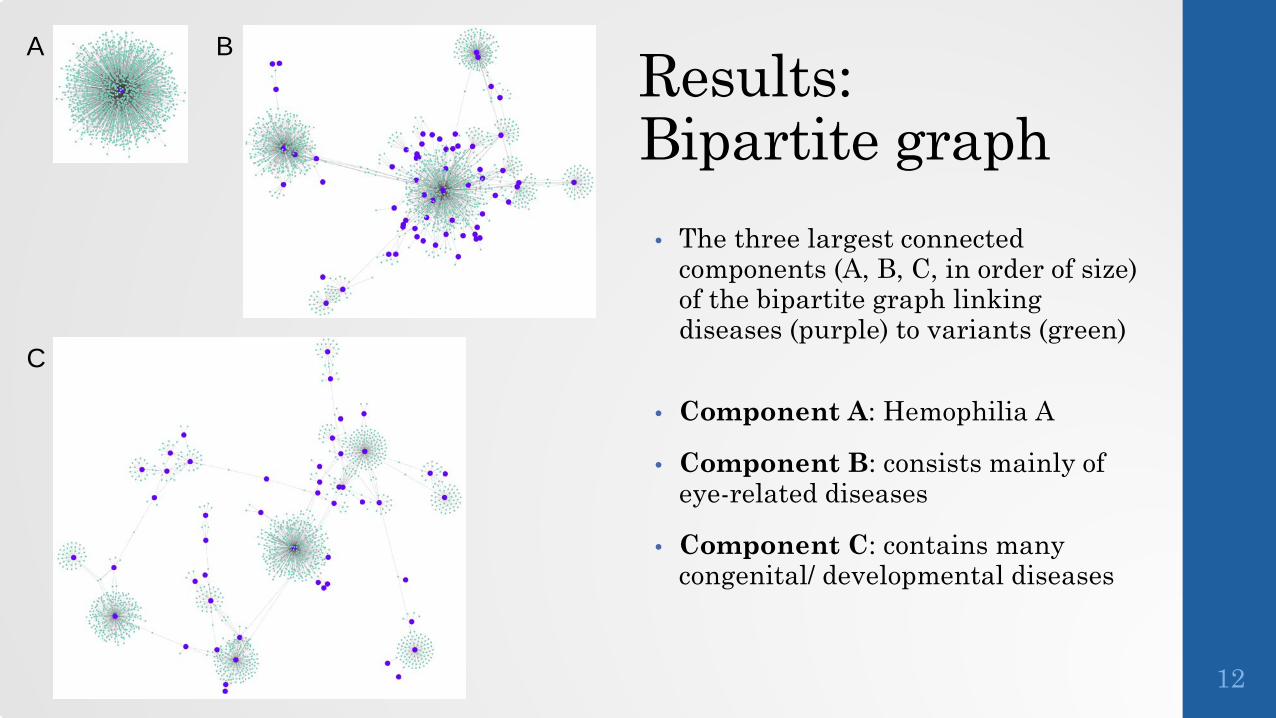
• The three largest connected components (A, B, C, in order of size) of the bipartite graph linking diseases (purple) to variants (green)
• Component A: Hemophilia A
• Component B: consists mainly of eye-related diseases
• Component C: contains many congenital/ developmental diseases

13
Results:Disease-disease graph
• Subset of diseases from top three connected components were linked if they shared the same gene or similar manifestations (similarity >= 0.63)
Edge Gene ManifestationsPink ✓
Orange ✓Blue ✓ ✓
Results: Disease-association examples
14
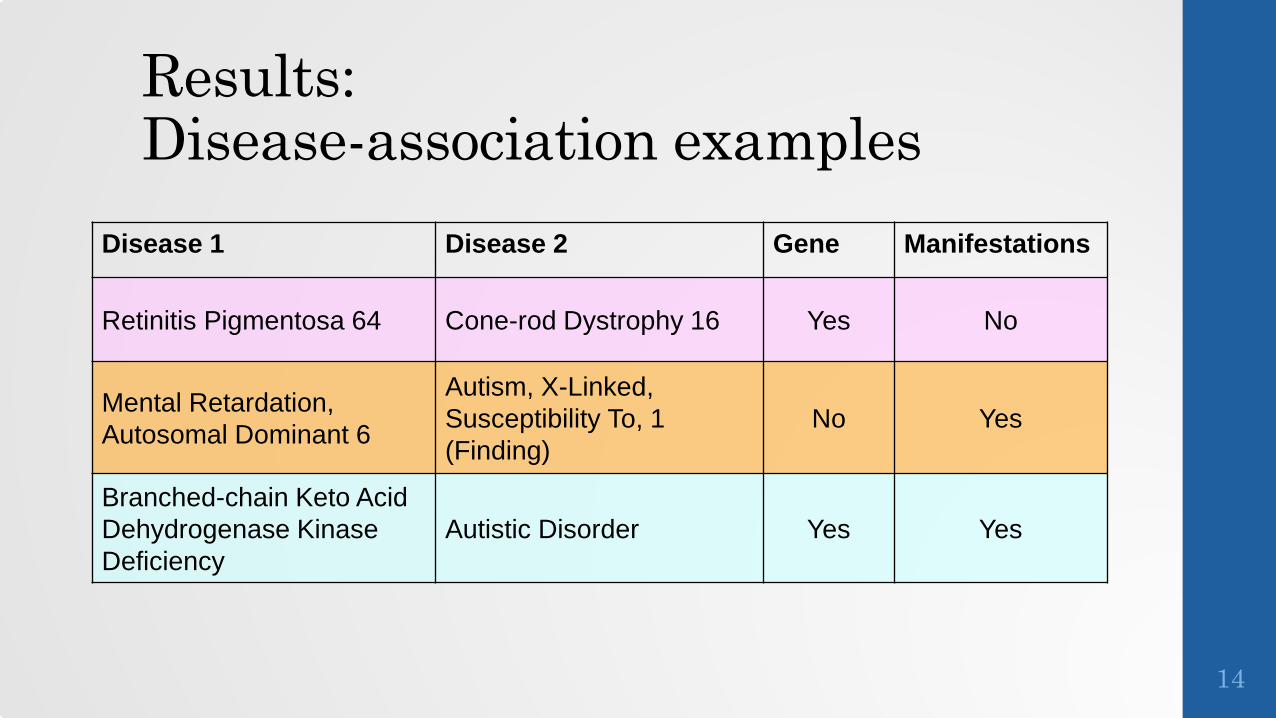
Disease 1 Disease 2 Gene Manifestations
Retinitis Pigmentosa 64 Cone-rod Dystrophy 16 Yes No
Mental Retardation, Autosomal Dominant 6
Autism, X-Linked, Susceptibility To, 1 (Finding)
No Yes
Branched-chain Keto Acid Dehydrogenase Kinase Deficiency
Autistic Disorder Yes Yes
Conclusions
15
• Variants were aggregated by gene, and diseases were aggregated by similar manifestations
• Disease-disease associations through both genotypic and phenotypic approaches were analyzed
• Future Work: Aggregate hierarchical (non-OMIM) diseases Continue exploring ways to aggregate variants genotypically (e.g.,
protein domain, metabolic pathway) Incorporate drug associations to create a tripartite relationship
Acknowledgements
16
• Special thanks to Dr. Olivier Bodenreider, Tiffany Callahan, Raja Cholan, Dr. Paul Fontelo, Dr. Clement McDonald, and the LHNCBC Medical Informatics Training Program