Embed Size (px)
Citation preview
Dr. John R. Everett, Ronald J. Staskowski, and Christopher Jengo Earth Satellite Corporation, Rockville, Maryland
Just over 30 years ago, the first
Landsat satellite launch unofficially ushered in the remote sensing era. Of course, air photos, aeromag and a variety of airborne scanner data were available before this time (air photos since early in the 20th century). Nonetheless, for the first time, almost anyone could acquire image coverage of almost any place on the Earth.
Compared to sub-meter resolu-tion and hundreds of bands of hyperspectral data available today, the ERTS-1 (Landsat-1) 80-m resolution, four-spectral-band data from the Multispectral Scanner seem rather crude. However, the data revealed previously unrecog-nized fault zones more than 1,000 km long (e.g., the Zagros suture), and the number of known volcanic edifices increased by an order of magnitude.
Every major oil company and many large independents acquired remote sensing groups. Most of those specialists are gone, but many explorationists have some knowledge of satellite data. Times have changed - it is useful to look at several trends prevalent in the use of remote sensing and its sister technology, GIS (geographic information systems).
Sensors
The trend in sensors is toward higher resolution (spatial and spectral domains), more sensor types, and decreased prices for some of the most widely available data. There are now civilian satellites (e.g., IKONOS and Quickbird) with meter- and sub-
meter resolution, panchromatic data and three- or four-meter multi-spectral data. These sensors have relatively narrow swaths of about a dozen kilometers. However, they are pointable and able to image a given area repeatedly over a short time.
Broader area sensors have increased their resolution. The French SPOT and Indian IRS offer reasonably high spatial resolution (2.5 and 5.6 m, respectively), with relatively large coverage (swath greater than 60 km). Even the Landsat system now has a 15-m panchromatic band. Thanks to increased resolution and stereoscopic coverage, one can extract more accurate, digital elevation models (DEM). This greatly improves the data's stereo applications.
Airborne sensors have followed a similar trend. Traditional aerial photography has given way to digital photography and acquisition of LIDAR (Light Detection and Ranging).
Thus, almost as soon as the plane lands, rectified, geo-coded DEMs are available, along with digital mosaics of the photographs.
The trend begun in 1984 by the Landsat Thematic Mapper sensor toward higher spectral resolution has continued. ASTER has 14 spectral bands - three in the visible and very near infrared (VNIR), six in the short wavelength infrared (SWIR), and five in the thermal infrared (TIR) portion. This makes it possible to recognize specific mineral compositions that are important in mineral exploration
and seep
Hevenspectrecogminenumbcondquiteapplievide
AincreSeve(e.g.128 are resolorder
Swill cmay speciwell.banda sencarefvegeseepsystecovesensocohemappeveneleva
DPerhaplungthe per sfor a(SPOdecli
EXPLORATIONTECHNOLOGY
Remote sensing and GIS enexploration success New technologies in remote sensinginformation systems are becoming s
Gulf Publishing Company November 2002www.worldoil.com
in searching for hydrocarbon age effects. yperion has carried the trend
further, collecting data in 220 ral bands. This facilitates nition of a wider variety of rals, and distinguishes a large er of vegetation types and
itions. These attributes are valuable in environmental cations and in looking for nce of hydrocarbon seepage. irborne sensors have also
ased spectral resolution. ral hyperspectral systems , HyMap, 128 bands; Probe, bands; SpecTIR, 222 bands) flying commercially. Ground ution of these sensors is on the of a few meters. pectral and spatial resolution ontinue to improve. One trend be toward sensors that do
fic sets of jobs exceedingly Instead of acquiring 220 s over a broad spectral region, sor may collect a dozen bands ully chosen to detect tation effects of hydrocarbon age. Satellite-borne radar ms have eliminated cloud r problems that plague optical rs. These active systems'
rent energy allows detailed ing of elevation differences,
centimeter-scale changes in tion through time. ata prices have decreased. ps the most dramatic price e is for Landsat TM data. In
1990s, the price was $4,400 cene. Today, it is $600. Prices rchived data of other sensors T, RADARSAT, etc.) have also ned dramatically. A few data
Nov. 2002 Vol. 223 No. 11 Feature Article
able future
and geographic tandard tools for E&P
sets are still relatively expensive, but the overall price trend is downward.
Data Processing
Data processing is trending toward more versatile, powerful, image processing software and closer ties to GIS. Image processing packages routinely handle various data formats from numerous different sensors. They rapidly perform geometric correction (or reprojection) operations, and offer a wide range of spectral and spatial enhancement.
Perhaps the most important trend is the growing tie between remote sensing and GIS. The only way to exploit the information extracted from remote sensing data is with a GIS system. Conversely, one of the best ways to populate a GIS system is by directly extracting information from remote sensing data. GIS systems make images and extracted information compatible with existing mapping systems. GIS systems also provide convenient data modeling and information extraction using complex queries. This greatly facilitates prospecting and pre-paring exhibits for presentation.
A worldwide, cloud-free, ortho-rectified data set is now available with absolute, geodetic positional error of less than 50 m. This data set is inexpensive (about $100 per scene), immediately available, and forms an excellent image layer for GIS systems.
Using high resolution, stereoscopic data and power-ful software packages, one can extract accurate, quan-titative structural data (bedding attitude, elevation of stratigraphic contacts, thicknof beds, etc.) directly from remsensing data. This "virtual field tdoes not replace actual field woIt can, however, answer maquestions before entering the fieand extend observations with reliability beyond the area visitIt is also a means of reviewing fconditions in 3D with colleaguesan office setting.
Applications
The range of remote sensuses has increased in recent yeaand now the role inclu
integration into sophisticated, quantitative, structural models; surface layers for data cubes; backdrops for GIS models; detailed fracture analyses; logistical and route planning; and environmental assessment, documentation and monitoring.
Part of the broader usage results from new capabilities, such as monitoring subsidence with interferrometric satellite radar. However, much of the use results from increased familiarity with, and greater availability of, data. Remote sensing is often a prelude to seismic acquisition. Judicious use of the tool, even relatively expensive hyperspectral data, can save substantial time and money.
Two application types receiving considerable attention are the mapping and analysis of fractures, and the search for seeping hydrocarbons. In areas as diverse as western New York, central Texas, the Powder River basin and central China, there is a strong correlation between fracture density highs of specific orientations, as mapped from remotely sensed data, and hydrocarbon production. Where accumulation is related to fracture porosity and permeability (e.g., Texas and China) the
vertical migration of hydrocarbons along fractures may make the fractures more obvious. Vertical fractures may constitute critical pathways for fluid migration from generating source beds to reservoirs. Thus, traps are preferentially charged in the vicinity of fractures. Some of these fractures may be derived from overpressuring of source beds during generation and expulsion.
Fracture density and orientation are important factors. Wells that encounter relatively open, standing fractures (those parallel to the maximum principal compressive stress in most areas) are the most prolific. Digital technology allows one to rapidly digitize fractures, compute and map fracture density and analyze fracture orientation.
The approach is useful for identifying new exploration targets, extending producing trends, choosing optimal locations for development wells, and selecting the orientation of horizontal well bores. Fracture analysis is relatively inexpensive. Like other tools, it is best used in concert with sound geologic thinking and other conventional tools and techniques. One example of effective use of fracture density mapping is in
Wyoming's Powder River basin.
ess ote rip" rk. ny ld,
fair ed. ield in
ing rs,
des
Powder River Basin
Most hydrocarbon pro-duction in the Powder River basin comes from strat-igraphic traps, many of which are fracture-enhanced and not related to such traditional, structural traps as anticlines or domes. Thus, they are not observed easily on seismic data.
In the Powder River basin, fracturing is important in several ways. Faulting and
Fig. 1. Fracture density contours over Kaye and Lance fields, and field
relationship is anticipated. The relationship also persistsin areas with other structural / stratigraphic traps.
The relationship between fracture density and accumulation of hydrocarbons is complex. Faulting and fracturing influence locations of channels and offshore bars; differential compaction over buried sand or carbonate bodies may produce higher fracture density. Alteration related to
associated fracturing influenced the locations of channels and long-shore bars during deposition of several productive Lower Cretaceous units. Fracturing enhances permeability and bulk porosity of several tight-sand intervals.
Fractures were mapped on ortho-rectified Landsite Thematic Mapper imagery at a 1:100,000 scale. Fracture density was calculated by digitizing fractures into a GIS using standard
algorithms. Fracture density values were contoured and compared to existing production, based on Wyoming Geologic Survey's 1996 Oil and Gas Map.
Fracture directions and the trends of fracture density highs coincide with the orientation of sand bodies and oil fields in this region. At many locations, there is a strong congruity between fracture distribution and production (e.g., House Creek, Kitty, Dead Horse Creek, Fiddler Creek, Highlight, Clareton, Lance Creek, Kaye and Big Muddy fields).
As examples, both Kaye and Lance Creek fields show a correlation between the extent of production and fracture density, even though these fields produce from different formations, Fig. 1. Lance Creek output is predominantly from the Jurassic Canyon Springs sandstone. Canyon Springs sandstones are a beach and near-shore marine sandstone complex. Kaye field produces predominantly from the Teapot sandstones of the Mesa Verde group, deposited as delta front and barrier bars during a regressive cycle. In each of these formations, reservoir-quality sand deposition was apparently controlled by fractures or small faults.
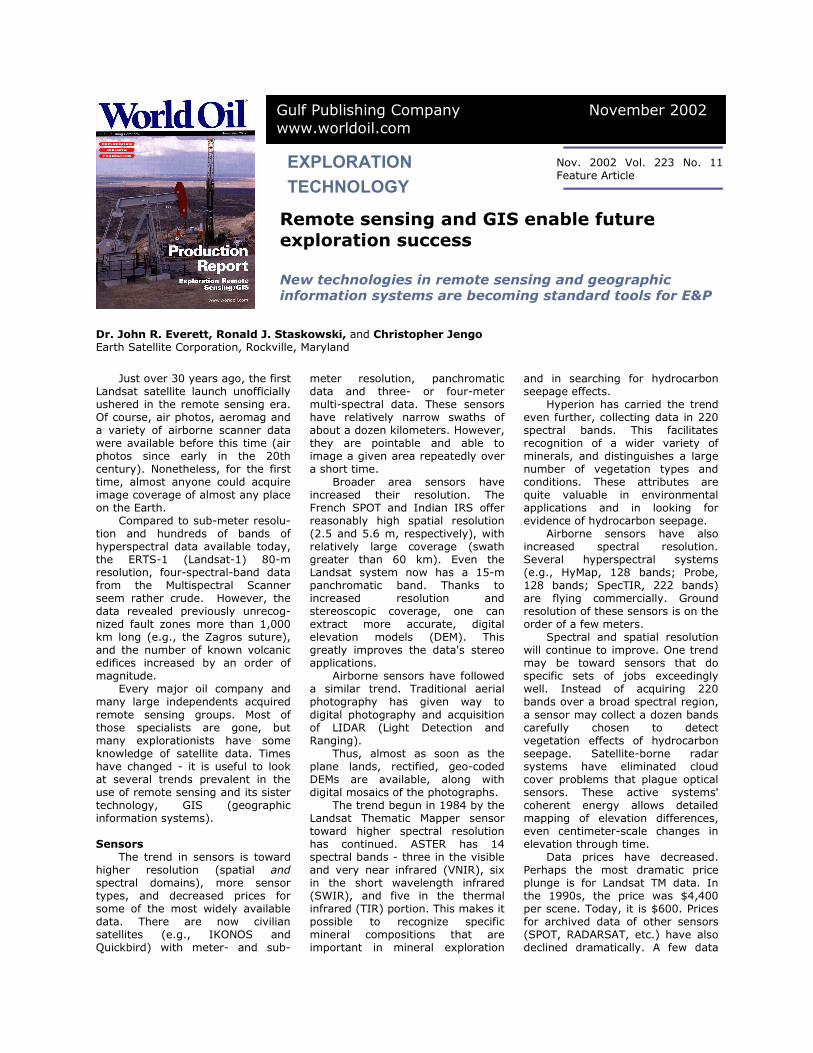
Another example from the eastern Powder River basin is a comparison between the extent of Clareton field production and fracture density, Fig. 2. Clareton produces from Lower Cretaceous formations, such as the Muddy, that were deposited in a complex fluvial, marginal marine environment. The Lower Muddy channel sandstone at Clareton is localized along the downthrown side of northeast-trending faults.
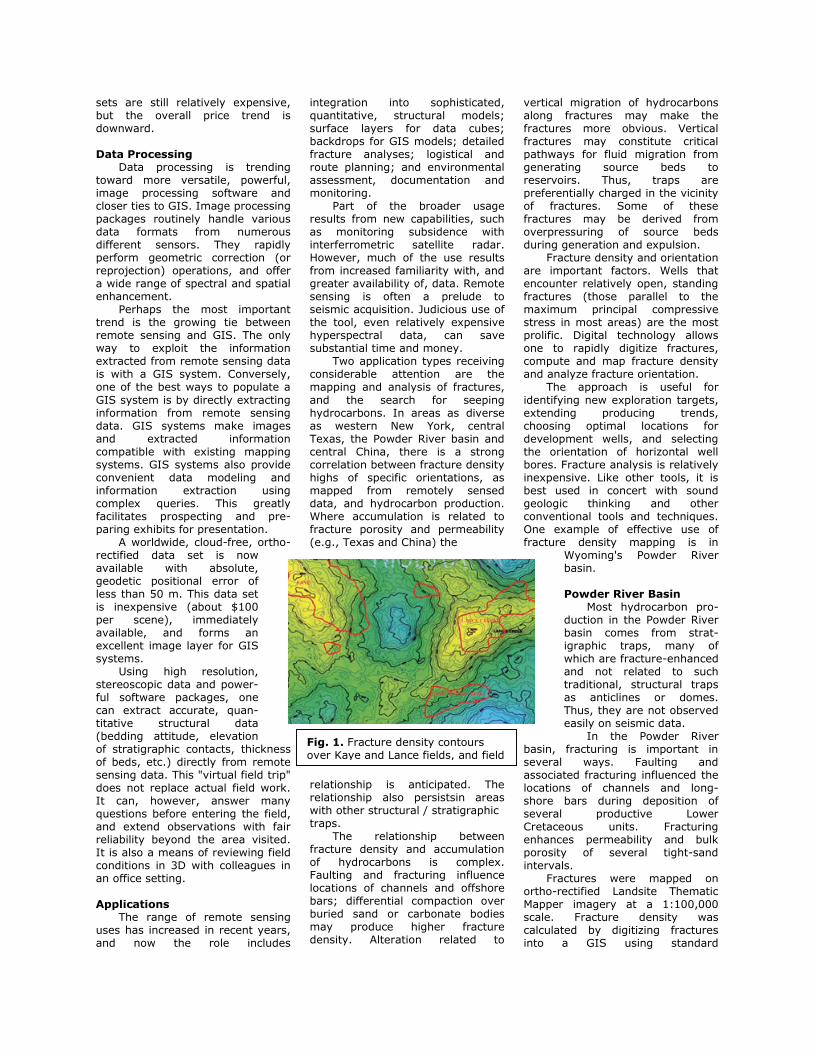
An example from the western Powder River basin is shown in Fig. 3. Harzog Draw produces predominantly from the Upper Cretaceous Shannon formation. Shannon sandstones are interpreted as offshore marine sands initially deposited by long-shore currents on the continental shelf. These sands were later reworked into discrete, sand bodies by storm waves and tidal currents.
At Harzog Draw, traps are largely stratigraphic, where permeable sand lenses change updip to impermeable sandstone, siltstone or shale. The range of
fincfw
fwsUcpwIuh
as the stress field orientation through time in specific locations. One must then analyze the fracture network for specific orientations.
In numerous instances, fracture highs of a specific orientation do not coincide with overall fracture highs. Yet, they are critically important to exploration. GIS systems are important in analysis, comparison and eval-uation of fracture density infor-mation with other data sets, such as estimated ultimate recovery, lease availability, etc.
Hydrocarbon Seeps
Petroleum exploration began with the search for hydrocarbon indications at the surface. Now, sophisticated airborne and remote sensing tools continue that search.
Hydrocarbon trap seals range from very efficient to relatively inefficient. Thus, many hydrocarbon accumulations have some leakage to the surface. Leaking
Fig. 2. The extent of production at Clareton field compared to fracture density.
racture density values is less than other examples. Yet, even in this
ase, it is still apparent that racture density trends correlate ith the extent of productivity.
In the Powder River basin, total racture density highs correlated ell with production. Not urprisingly, in many areas like the inta basin of Utah or the Austin halk of north-central Texas, roduction is closely associated ith fractures of a particular trend.
n these areas, one must nderstand the thermal maturation istory of source rock units, as well
hydrocarbons effect a host of changes on the rocks and soils through which they pass. At the surface, subtle differences in mineral composition or vegetation manifest these changes.
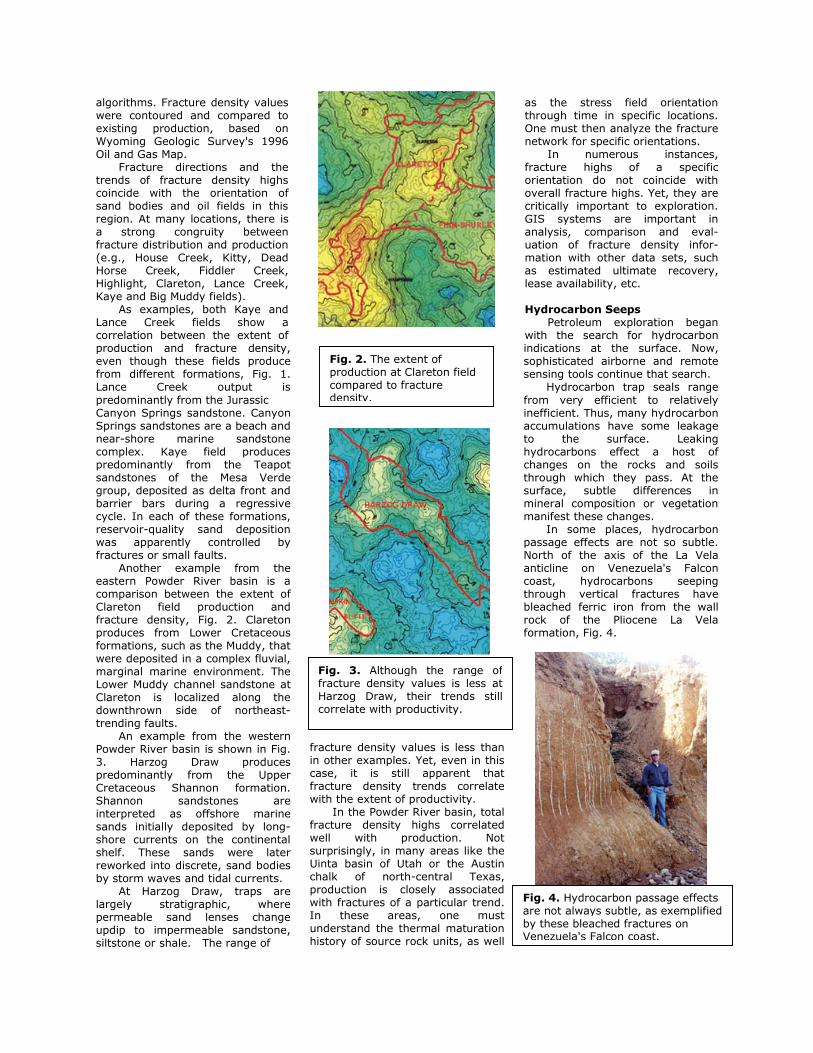
In some places, hydrocarbon passage effects are not so subtle. North of the axis of the La Vela anticline on Venezuela's Falcon coast, hydrocarbons seeping through vertical fractures have bleached ferric iron from the wall rock of the Pliocene La Vela formation, Fig. 4.
Fig. 3. Although the range of fracture density values is less atHarzog Draw, their trends stillcorrelate with productivity.
Fig. 4. Hydrocarbon passage effects are not always subtle, as exemplified by these bleached fractures on Venezuela's Falcon coast.
In the marine environment, leaking hydrocarbons promote chemosynthetic sea floor com-munities, produce char-acteristic bottom topography of crater pits and mounds, and form surface slicks. Satellite radar can detect surface slicks (Oil damps the small capillary waves and makes the sea surface appear smooth on the radar.). TM data and other, more powerful multispectral or hyper-spectral instruments (e.g., ASTER and Hyperion) detect sea-surface hydrocarbons. These instruments can distinguish a genuine oil slick from slicks caused by other means (floating vegetation, wind shadows, downbursts, etc.).
Using sophisticated spectral processing, one can emphasize some of these subtle differences, even when using the relatively crude spectral bands of Landsat TM imagery. Using instruments that are spectrally more powerful (ASTER, Hyperion, Probe, HyMap, SpecTIR, etc.), the task becomes much easier.
In arid areas, geochemistry, geophysics and drilling have corroborated spectral signatures associated with leaking hydro-carbons. In humid areas, the task is more difficult. Preliminary findings in East Africa suggest that hydrocarbon microseepage effects on vegetation can be detected using TM data and robust digital techniques. Sophisticated hyper-spectral data processing near Santa Barbara, California, has identified geo-botanical spectral anomalies associated with known hydrocarbon seeps.
Each chemical element and molecular compound has a unique spectral signature. So, one should be able to spectrally identify areas altered by hydrocarbon passage. Several conditions complicate the picture: vegetation may totally cover an area's soils and rocks; a picture element (pixel) may include several different materials (mixed pixel problem); or spectral resolution (bandwidth) may be too coarse to make subtle distinctions.
However, improved remote sensing tools and advanced spectral processing algorithms provide some solutions. Many mineralogical changes that hydrocarbons produce are known. In areas not completely vegetation-covered, using a sophisticated sensor like ASTER
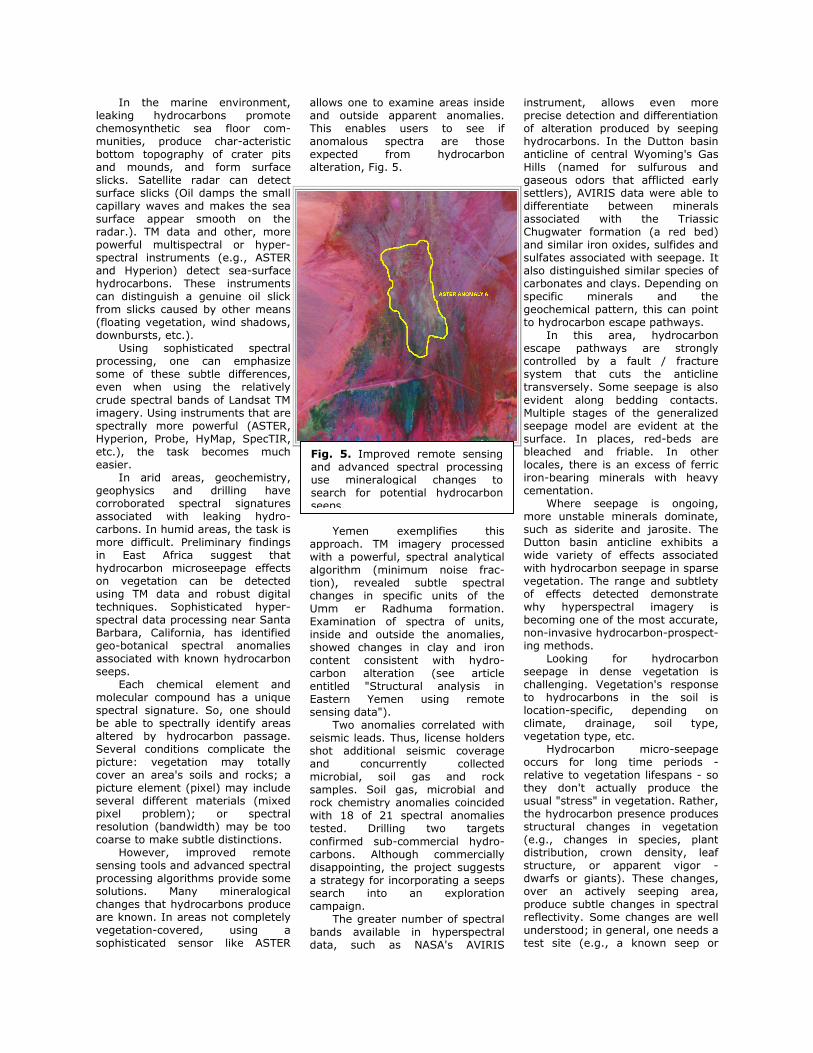
allows one to examine areas inside and outside apparent anomalies. This enables users to see if anomalous spectra are those expected from hydrocarbon alteration, Fig. 5.
Yemen exemplifies this
approach. TM imagery processed with a powerful, spectral analytical algorithm (minimum noise frac-tion), revealed subtle spectral changes in specific units of the Umm er Radhuma formation. Examination of spectra of units, inside and outside the anomalies, showed changes in clay and iron content consistent with hydro-carbon alteration (see article entitled "Structural analysis in Eastern Yemen using remote sensing data").
Two anomalies correlated with seismic leads. Thus, license holders shot additional seismic coverage and concurrently collected microbial, soil gas and rock samples. Soil gas, microbial and rock chemistry anomalies coincided with 18 of 21 spectral anomalies tested. Drilling two targets confirmed sub-commercial hydro-carbons. Although commercially disappointing, the project suggests a strategy for incorporating a seeps search into an exploration campaign.
The greater number of spectral bands available in hyperspectral data, such as NASA's AVIRIS
instrument, allows even more precise detection and differentiation of alteration produced by seeping hydrocarbons. In the Dutton basin anticline of central Wyoming's Gas Hills (named for sulfurous and gaseous odors that afflicted early settlers), AVIRIS data were able to differentiate between minerals associated with the Triassic Chugwater formation (a red bed) and similar iron oxides, sulfides and sulfates associated with seepage. It also distinguished similar species of carbonates and clays. Depending on specific minerals and the geochemical pattern, this can point to hydrocarbon escape pathways.
In this area, hydrocarbon escape pathways are strongly controlled by a fault / fracture system that cuts the anticline transversely. Some seepage is also evident along bedding contacts. Multiple stages of the generalized seepage model are evident at the surface. In places, red-beds are bleached and friable. In other locales, there is an excess of ferric iron-bearing minerals with heavy cementation.
Where seepage is ongoing, more unstable minerals dominate, such as siderite and jarosite. The Dutton basin anticline exhibits a wide variety of effects associated with hydrocarbon seepage in sparse vegetation. The range and subtlety of effects detected demonstrate why hyperspectral imagery is becoming one of the most accurate, non-invasive hydrocarbon-prospect-ing methods.
Looking for hydrocarbon seepage in dense vegetation is challenging. Vegetation's response to hydrocarbons in the soil is location-specific, depending on climate, drainage, soil type, vegetation type, etc.
Hydrocarbon micro-seepage occurs for long time periods - relative to vegetation lifespans - so they don't actually produce the usual "stress" in vegetation. Rather, the hydrocarbon presence produces structural changes in vegetation (e.g., changes in species, plant distribution, crown density, leaf structure, or apparent vigor - dwarfs or giants). These changes, over an actively seeping area, produce subtle changes in spectral reflectivity. Some changes are well understood; in general, one needs a test site (e.g., a known seep or
Fig. 5. Improved remote sensing and advanced spectral processinguse mineralogical changes tosearch for potential hydrocarbonseeps.
existing production) to act as a model for recognition of particular spectral changes. A favored methodology is the tried-and-true approach of scouring for "look-alikes."
Hyperspectral data are particularly useful for this task - they can accurately define several key parameters. These include the steep rise in vegetation reflectivity from red to infrared portions of the spectrum ("red edge"); changes in slope, inflection point, height, etc., of the vegetation spectral curve; and identification of several important characteristics of vege-tation. Sophisticated processing that identifies specific vegetation communities, and then analyzes differences within them, is useful for recognizing anomalous areas resulting from hydrocarbons.
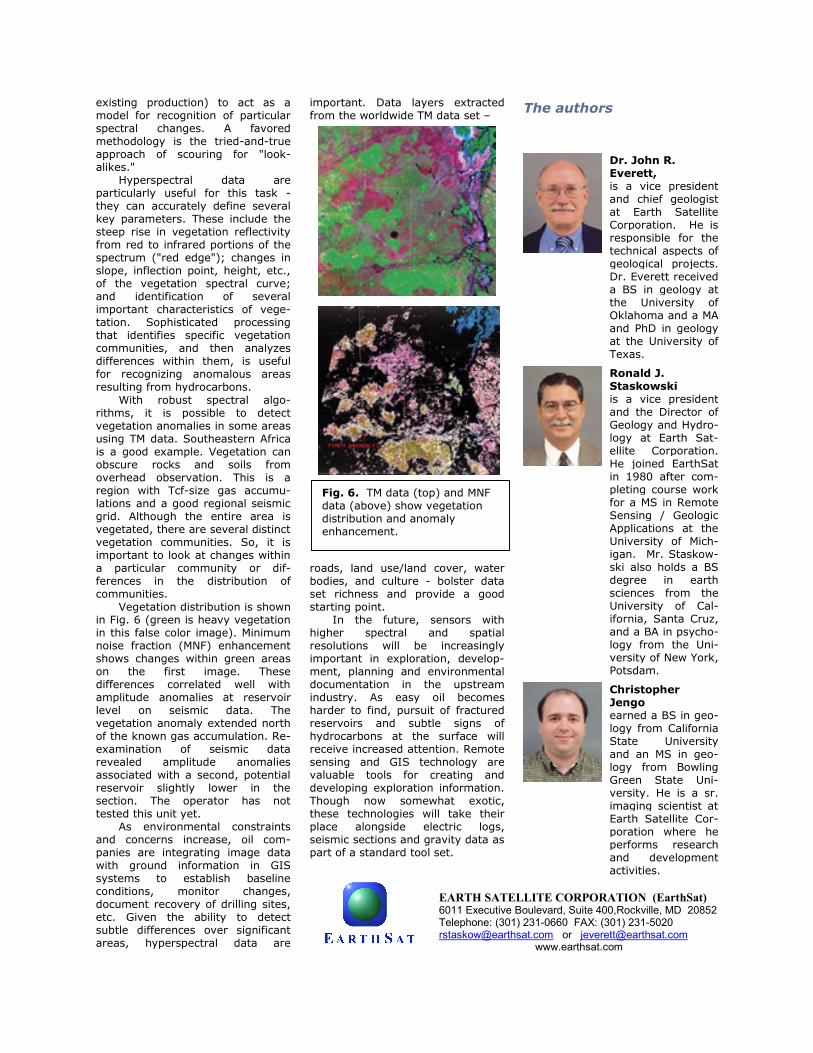
With robust spectral algo-rithms, it is possible to detect vegetation anomalies in some areas using TM data. Southeastern Africa is a good example. Vegetation can obscure rocks and soils from overhead observation. This is a region with Tcf-size gas accumu-lations and a good regional seismic grid. Although the entire area is vegetated, there are several distinct vegetation communities. So, it is important to look at changes within a particular community or dif-ferences in the distribution of communities.
Vegetation distribution is shown in Fig. 6 (green is heavy vegetation in this false color image). Minimum noise fraction (MNF) enhancement shows changes within green areas on the first image. These differences correlated well with amplitude anomalies at reservoir level on seismic data. The vegetation anomaly extended north of the known gas accumulation. Re-examination of seismic data revealed amplitude anomalies associated with a second, potential reservoir slightly lower in the section. The operator has not tested this unit yet.
As environmental constraints and concerns increase, oil com-panies are integrating image data with ground information in GIS systems to establish baseline conditions, monitor changes, document recovery of drilling sites, etc. Given the ability to detect subtle differences over significant areas, hyperspectral data are
important. Data layers extracted from the worldwide TM data set –
The authors
Dr. John R. Everett, is a vice president and chief geologist at Earth Satellite Corporation. He is responsible for the technical aspects of geological projects. Dr. Everett received a BS in geology at the University of Oklahoma and a MA
rbss
hrimmdinhrhrsvdTthpsp
and PhD in geology at the University of Texas.
Ronald J. Staskowski is a vice president and the Director of Geology and Hydro-logy at Earth Sat-ellite Corporation. He joined EarthSat in 1980 after com-pleting course work for a MS in Remote Sensing / Geologic Applications at the
Fig. 6. TM data (top) and MNF data (above) show vegetation distribution and anomaly enhancement.
oads, land use/land cover, water odies, and culture - bolster data et richness and provide a good tarting point.
In the future, sensors with igher spectral and spatial esolutions will be increasingly
portant in exploration, develop-ent, planning and environmental ocumentation in the upstream dustry. As easy oil becomes arder to find, pursuit of fractured eservoirs and subtle signs of ydrocarbons at the surface will eceive increased attention. Remote ensing and GIS technology are aluable tools for creating and eveloping exploration information. hough now somewhat exotic, ese technologies will take their
lace alongside electric logs, eismic sections and gravity data as art of a standard tool set.
University of Mich-igan. Mr. Staskow-ski also holds a BS degree in earth sciences from the University of Cal-ifornia, Santa Cruz, and a BA in psycho-logy from the Uni-versity of New York, Potsdam.
Christopher Jengo earned a BS in geo-logy from California State University and an MS in geo-logy from Bowling Green State Uni-versity. He is a sr. imaging scientist at Earth Satellite Cor-poration where he performs research and development activities.
EARTH SATELLITE CORPORATION (EarthSat) 6011 Executive Boulevard, Suite 400,Rockville, MD 20852Telephone: (301) 231-0660 FAX: (301) 231-5020 [email protected] or [email protected]
www.earthsat.com