Embed Size (px)
Citation preview
GIS Project Steps and Map Audiences
GIS 2
GIS Project Steps and Map Audiences•GIS project steps and major phases•Map audiences-Exploration-General Public
•Presenting maps and data
Copyright– Kristen S. Kurland, Carnegie Mellon University
GIS 3
GIS Project Steps
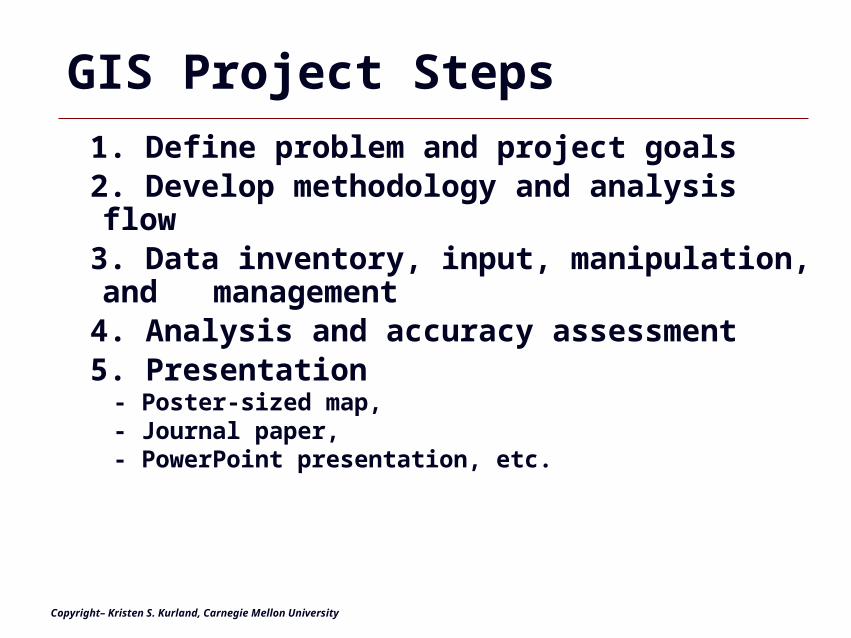
1. Define problem and project goals2. Develop methodology and analysis flow3. Data inventory, input, manipulation, and management
4. Analysis and accuracy assessment5. Presentation
- Poster-sized map, - Journal paper, - PowerPoint presentation, etc.
Copyright– Kristen S. Kurland, Carnegie Mellon University
GIS 4
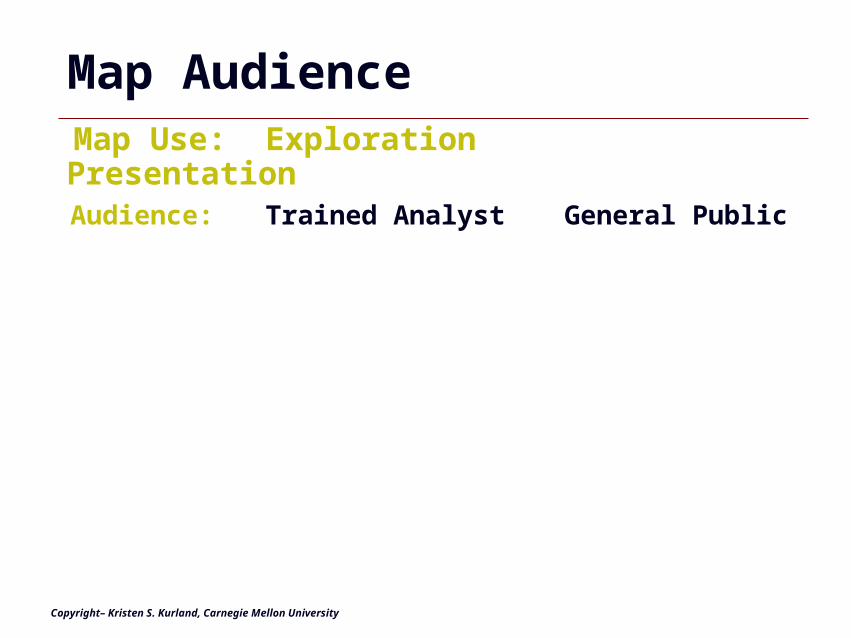
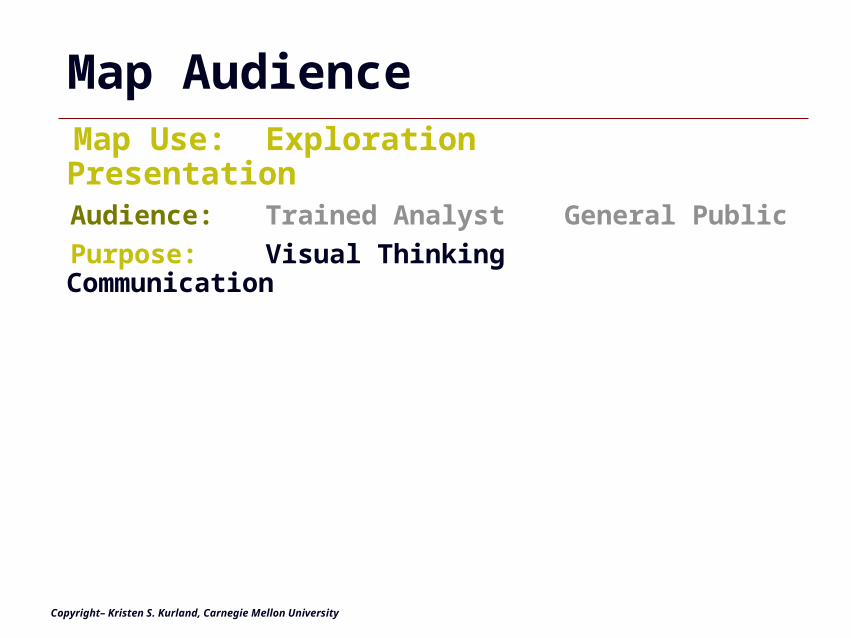
Map Audience Map Use: Exploration Presentation Audience: Trained Analyst General Public
Copyright– Kristen S. Kurland, Carnegie Mellon University
GIS 5
Map Audience Map Use: Exploration Presentation Audience: Trained Analyst General Public
Purpose: Visual Thinking Communication
Copyright– Kristen S. Kurland, Carnegie Mellon University
GIS 6
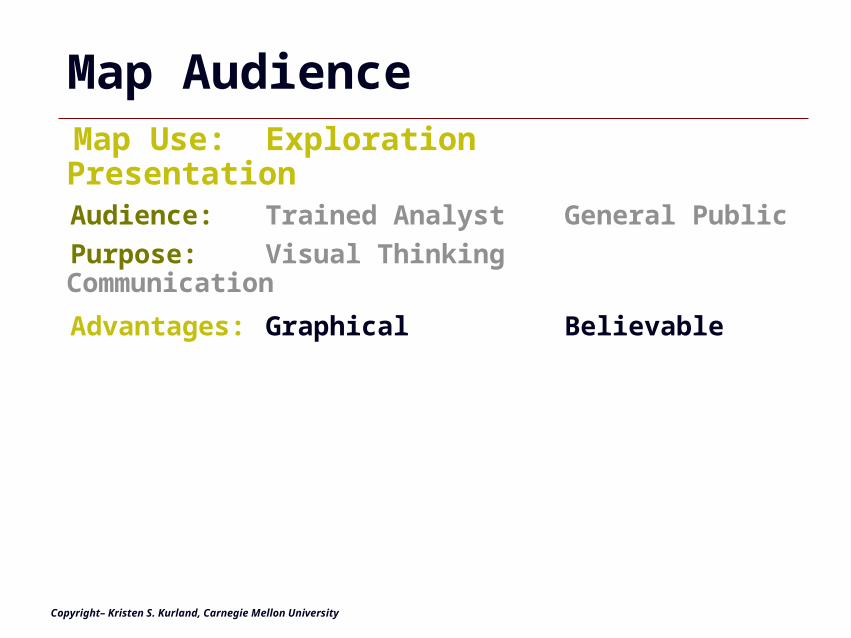
Map Audience Map Use: Exploration Presentation Audience: Trained Analyst General Public
Purpose: Visual Thinking Communication
Advantages: Graphical Believable
Copyright– Kristen S. Kurland, Carnegie Mellon University
GIS 7
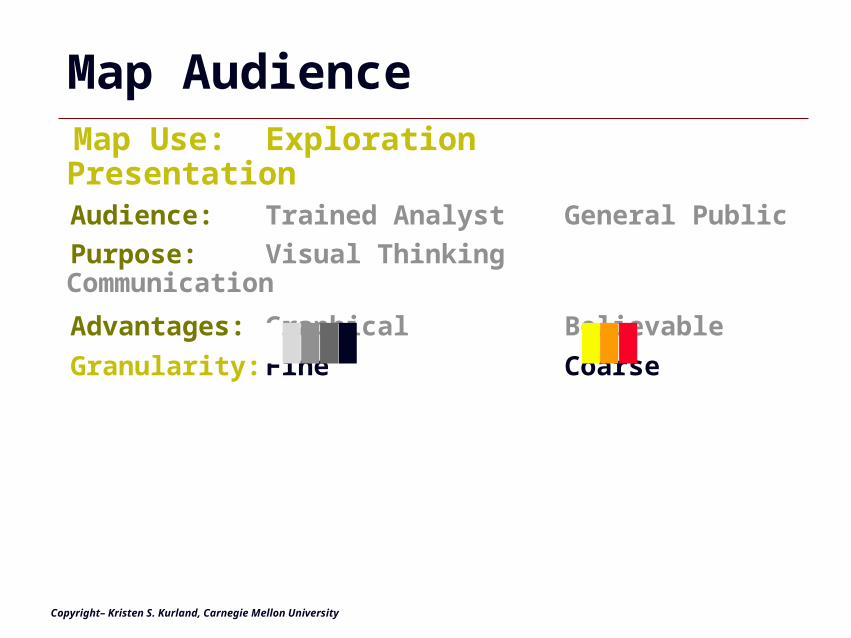
Map Audience Map Use: Exploration Presentation Audience: Trained Analyst General Public
Purpose: Visual Thinking Communication
Advantages: Graphical Believable
Granularity: Fine Coarse
Copyright– Kristen S. Kurland, Carnegie Mellon University
GIS 8
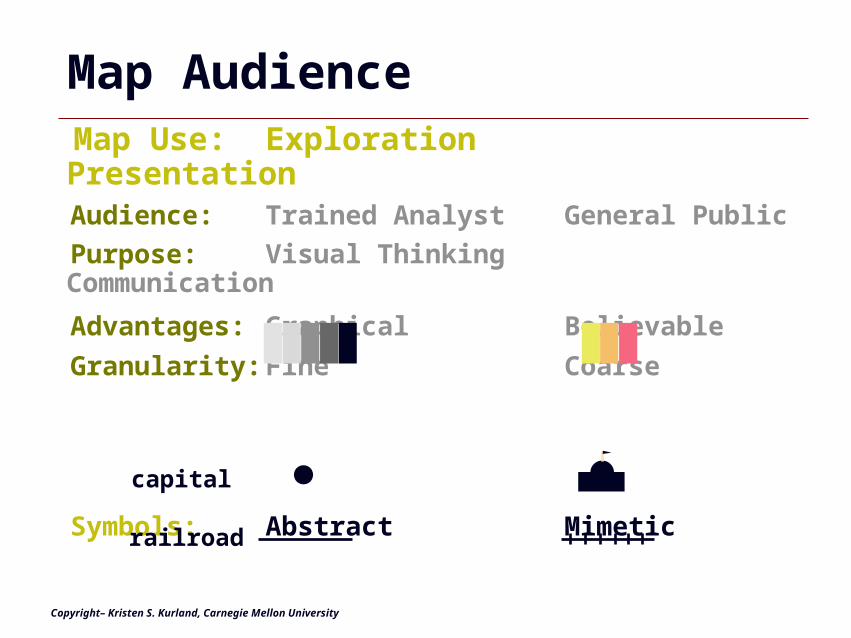
Map Audience Map Use: Exploration Presentation Audience: Trained Analyst General Public
Purpose: Visual Thinking Communication
Advantages: Graphical Believable
Granularity: Fine Coarse
Symbols: Abstract Mimeticcapital
railroad
Copyright– Kristen S. Kurland, Carnegie Mellon University
GIS 9
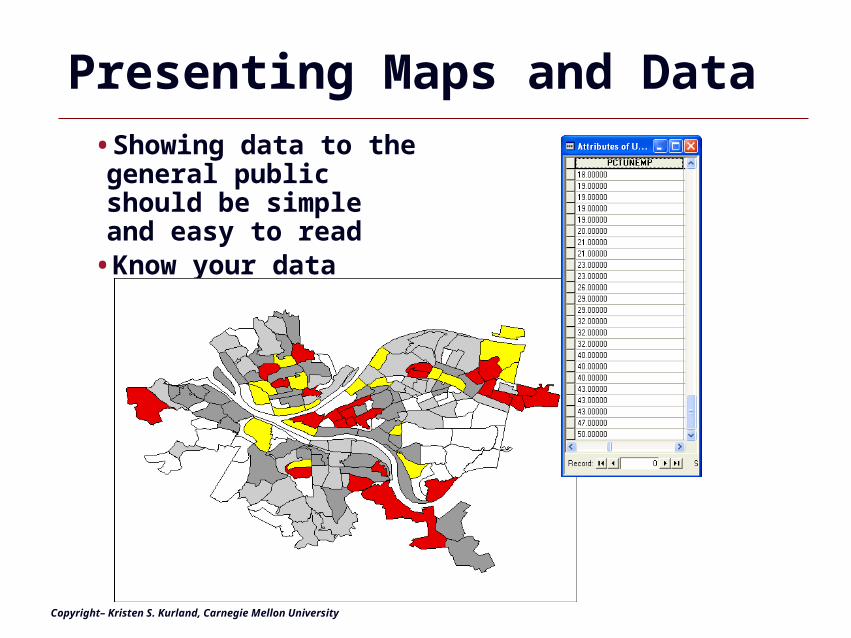
Presenting Maps and Data•Showing data to the general public should be simple and easy to read
•Know your data
Copyright– Kristen S. Kurland, Carnegie Mellon University
GIS 10
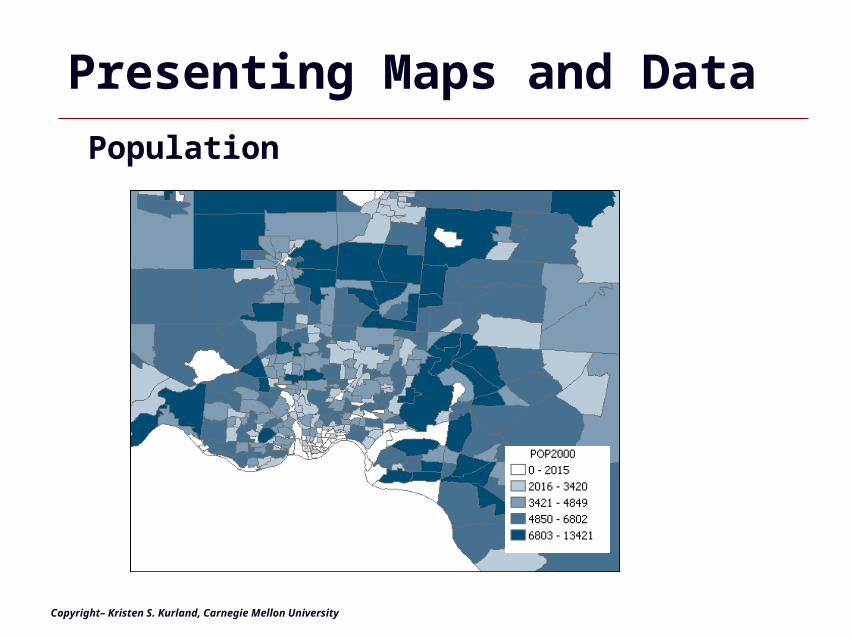
Presenting Maps and Data
Population
Copyright– Kristen S. Kurland, Carnegie Mellon University
GIS 11
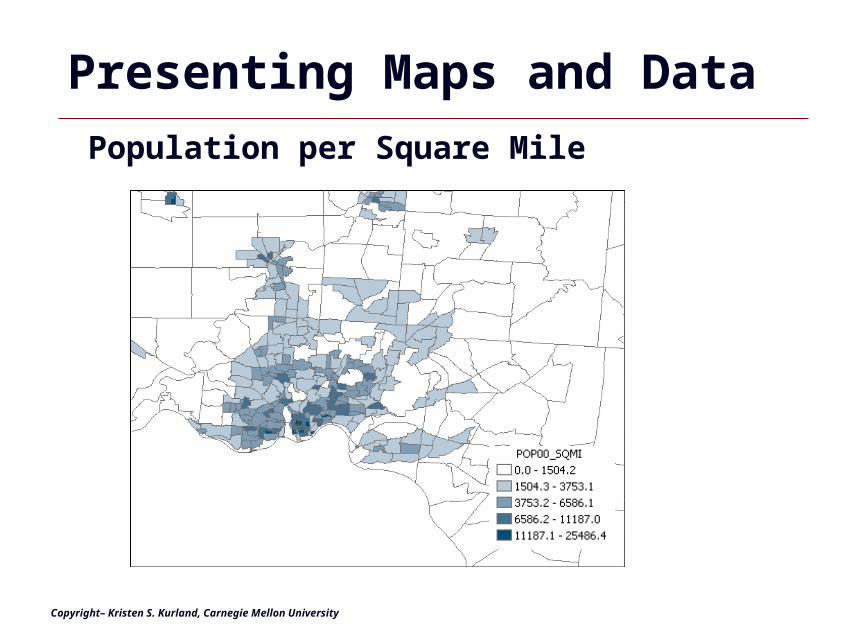
Presenting Maps and Data
Population per Square Mile
Copyright– Kristen S. Kurland, Carnegie Mellon University
GIS 12
Project Processes and Map Audiences•Project Steps and Major Phases•Map Audiences-Exploration-General Public
•Presenting Maps and Data
Copyright– Kristen S. Kurland, Carnegie Mellon University

Map Layouts
GIS 14
Map Layouts
•ArcView Layouts•Printed Map Layouts•Map Elements•Map Examples
Copyright– Kristen S. Kurland, Carnegie Mellon University
GIS 15
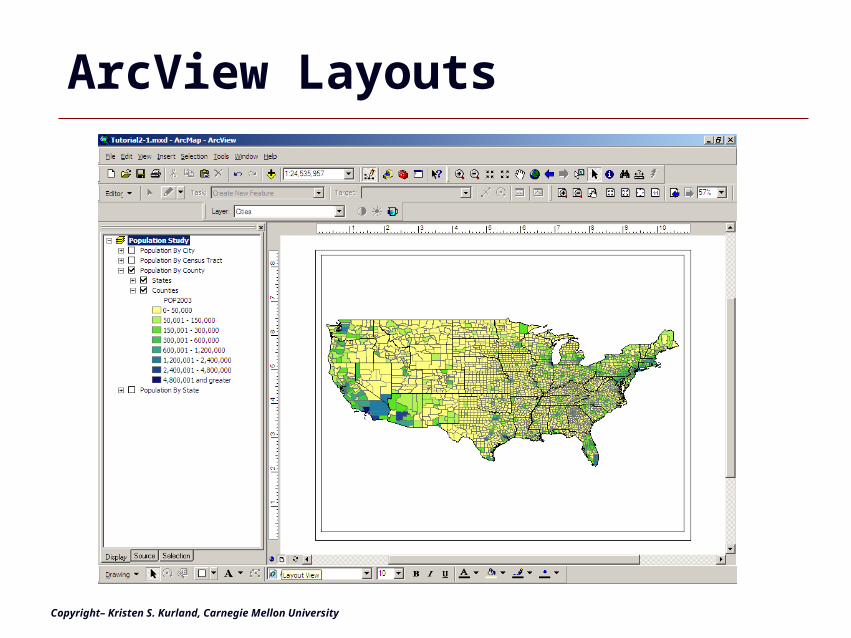
ArcView Layouts
Copyright– Kristen S. Kurland, Carnegie Mellon University
GIS 16
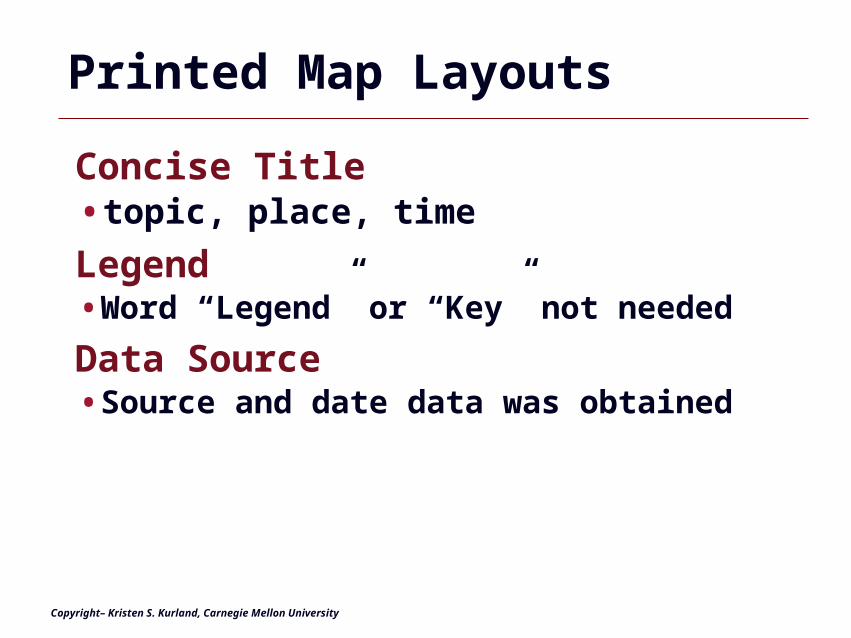
Printed Map Layouts
Concise Title•topic, place, time
Legend•Word “Legend” or “Key” not needed
Data Source•Source and date data was obtained
Copyright– Kristen S. Kurland, Carnegie Mellon University
GIS 17
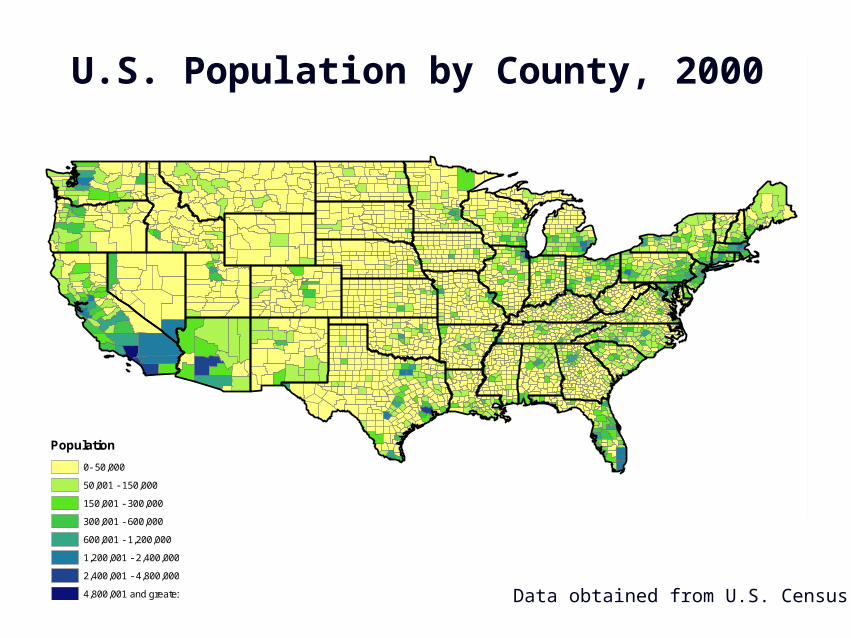
Population
0- 50,000
50,001 - 150,000
150,001 - 300,000
300,001 - 600,000
600,001 - 1,200,000
1,200,001 - 2,400,000
2,400,001 - 4,800,000
4,800,001 and greater
U.S. Population by County, 2000
Data obtained from U.S. Census
GIS 18
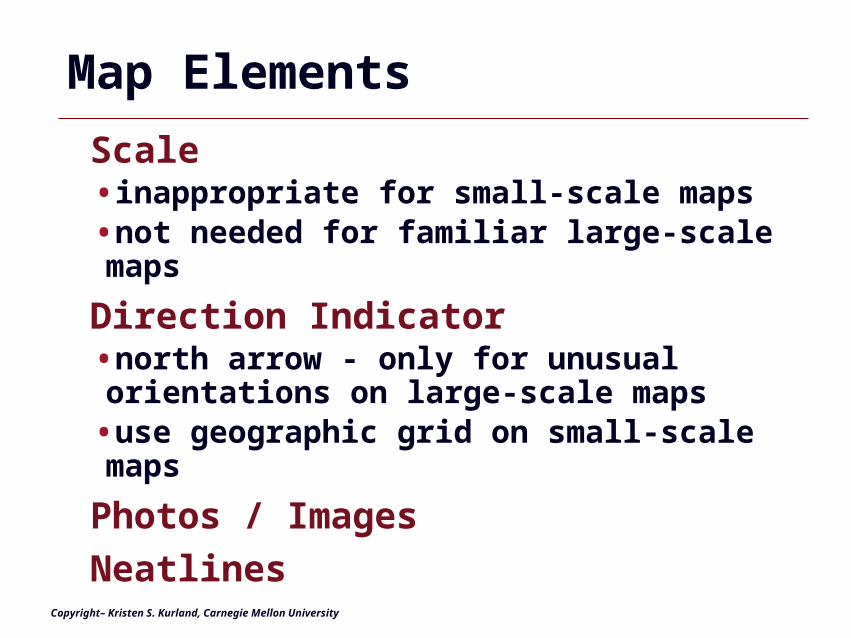
Map Elements
Scale •inappropriate for small-scale maps•not needed for familiar large-scale maps
Direction Indicator•north arrow - only for unusual orientations on large-scale maps
•use geographic grid on small-scale maps
Photos / Images
Neatlines
Copyright– Kristen S. Kurland, Carnegie Mellon University
GIS 19
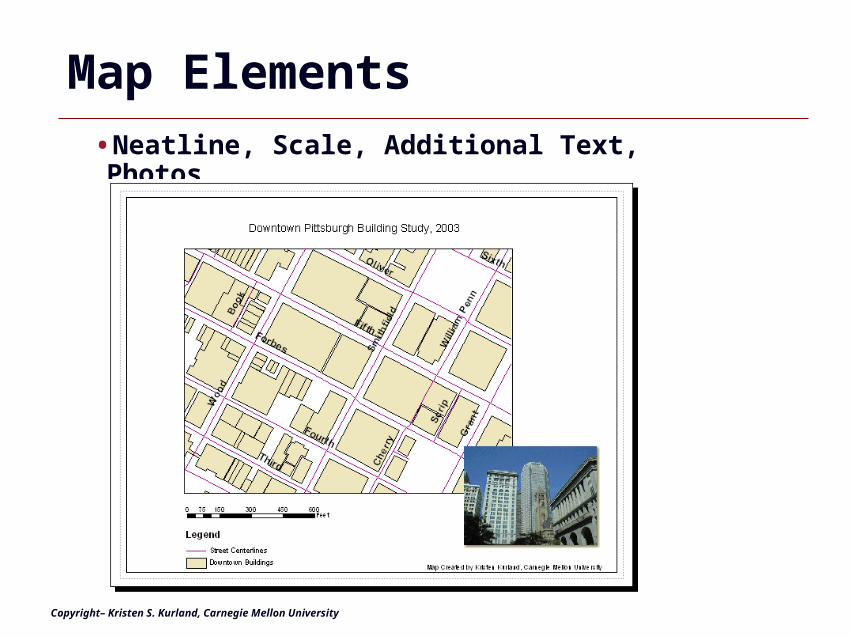
Map Elements•Neatline, Scale, Additional Text, Photos
Copyright– Kristen S. Kurland, Carnegie Mellon University
GIS 20
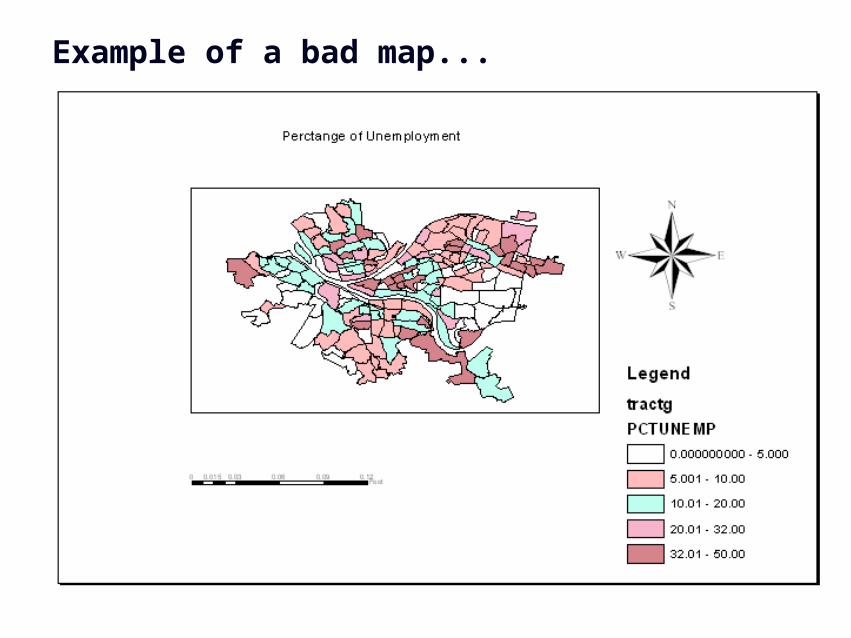
Example of a bad map...
GIS 21
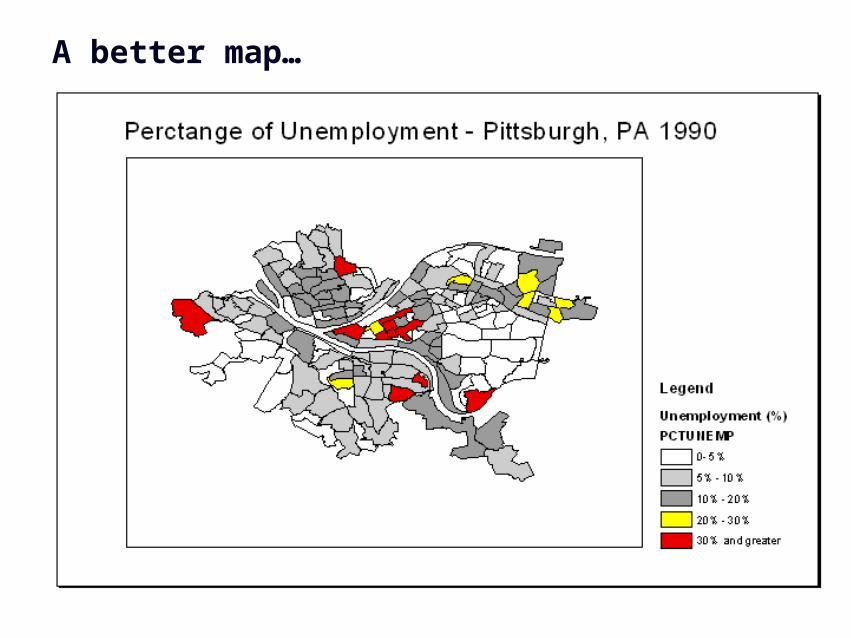
A better map…
GIS 22
Additional Layout Examples
GIS 23
GIS 24
GIS 25
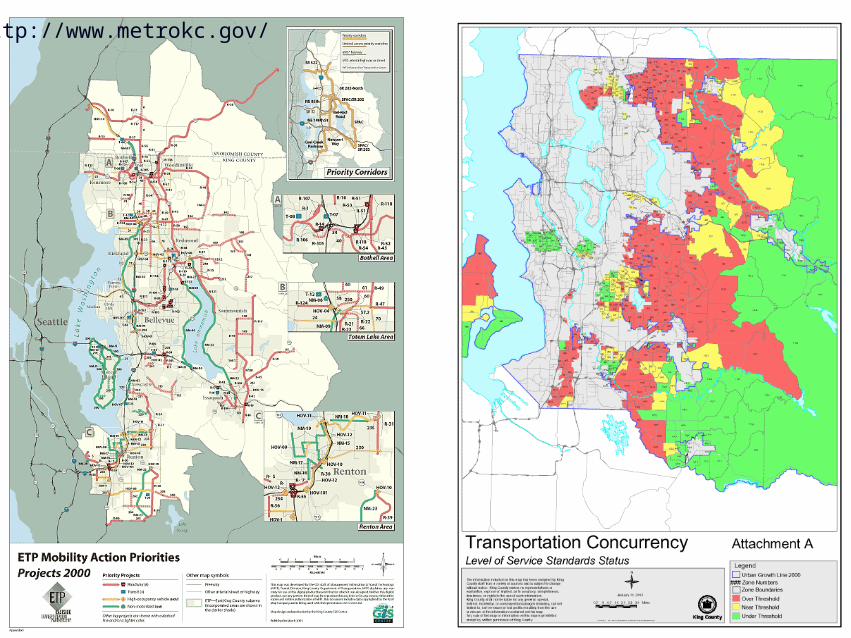
http://www.metrokc.gov/
Map Scales
GIS 27
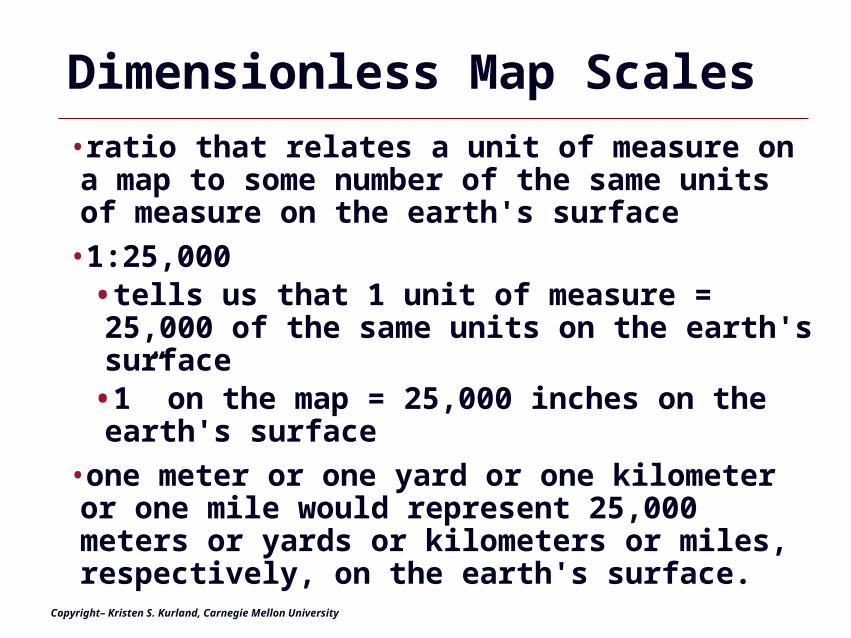
Dimensionless Map Scales
•ratio that relates a unit of measure on a map to some number of the same units of measure on the earth's surface
•1:25,000•tells us that 1 unit of measure = 25,000 of the same units on the earth's surface
•1” on the map = 25,000 inches on the earth's surface
•one meter or one yard or one kilometer or one mile would represent 25,000 meters or yards or kilometers or miles, respectively, on the earth's surface.
Copyright– Kristen S. Kurland, Carnegie Mellon University
GIS 28
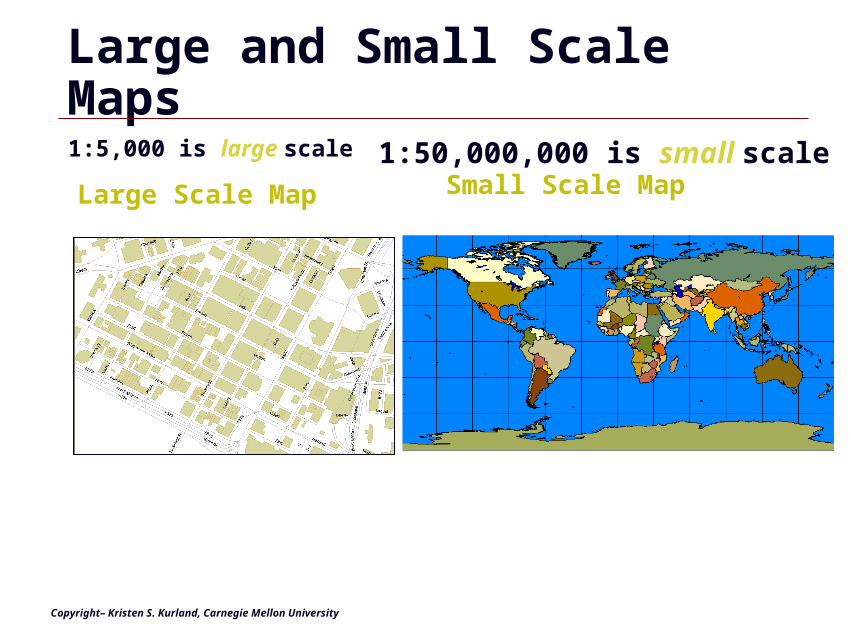
Large and Small Scale Maps
1:5,000 is large scale
Large Scale Map Small Scale Map
Copyright– Kristen S. Kurland, Carnegie Mellon University
1:50,000,000 is small scale
GIS 29
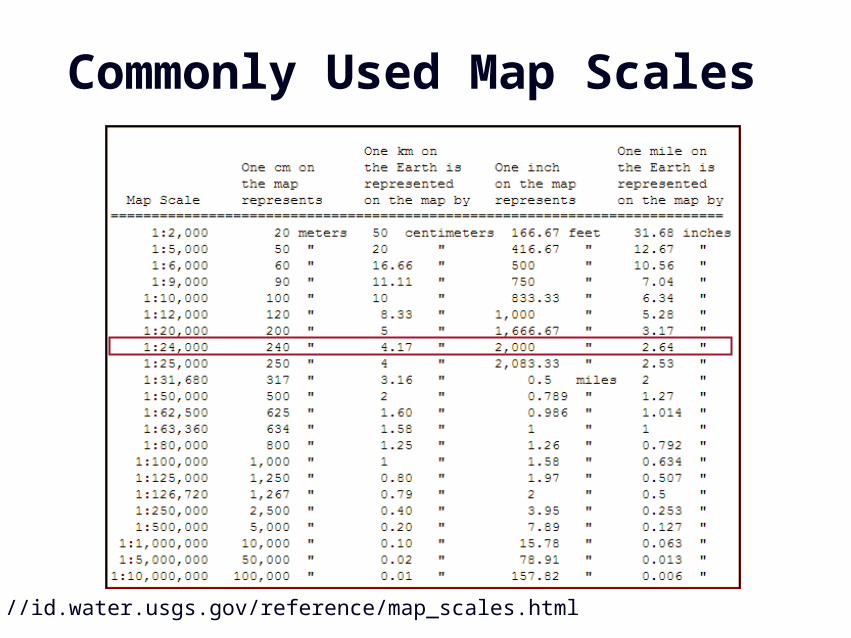
Commonly Used Map Scales
http://id.water.usgs.gov/reference/map_scales.html
GIS 30
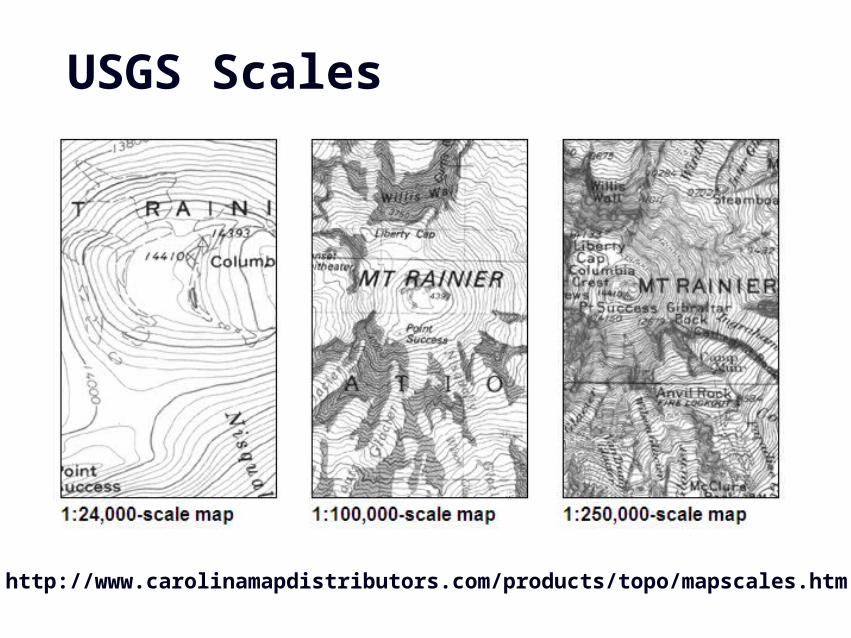
USGS Scales
http://www.carolinamapdistributors.com/products/topo/mapscales.htm
GIS 31
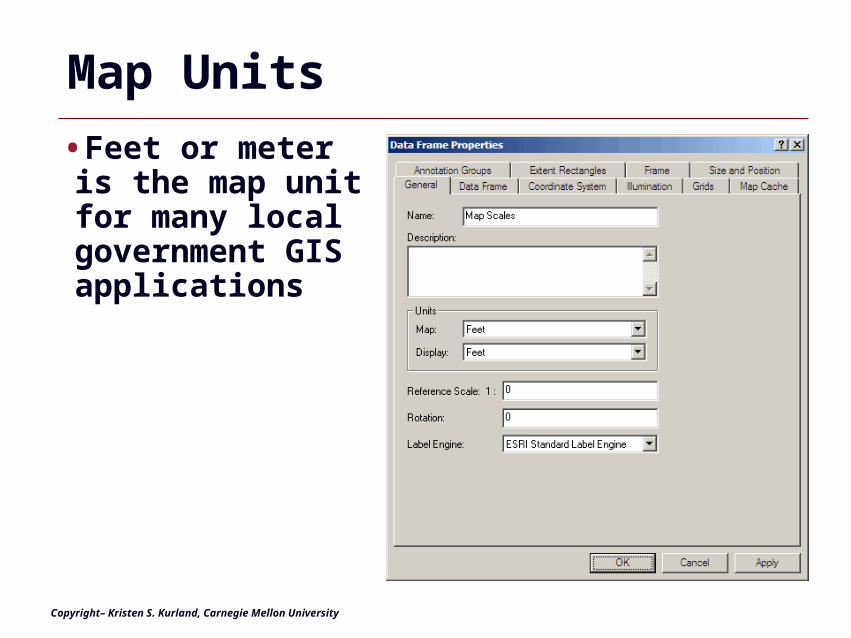
Map Units
•Feet or meter is the map unit for many local government GIS applications
Copyright– Kristen S. Kurland, Carnegie Mellon University
GIS 32
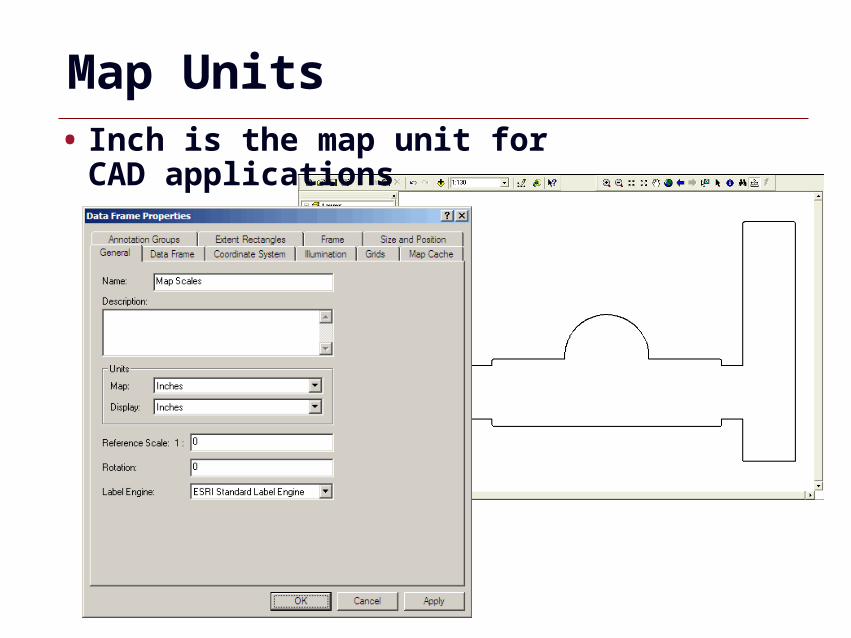
Map Units• Inch is the map unit for CAD
applications
GIS 33
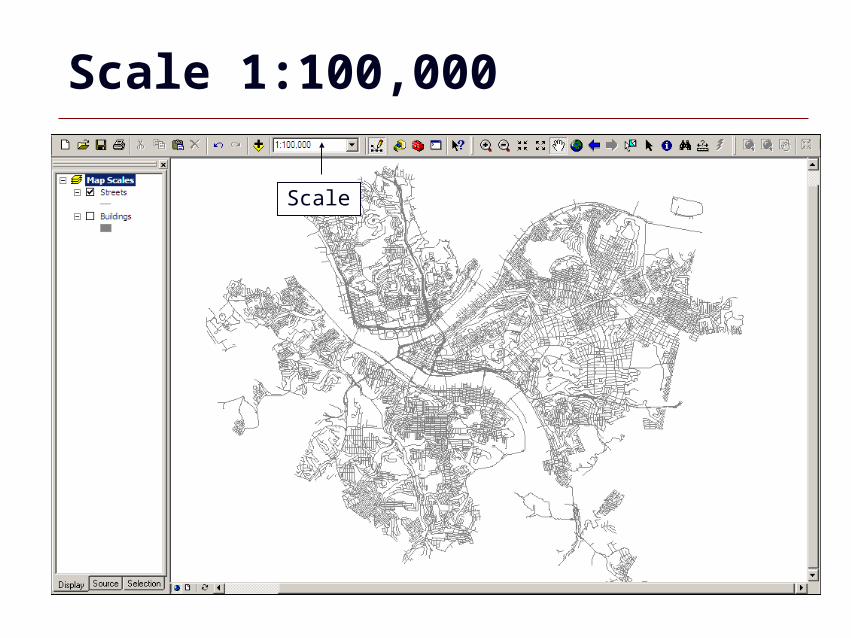
Scale 1:100,000
Scale
GIS 34
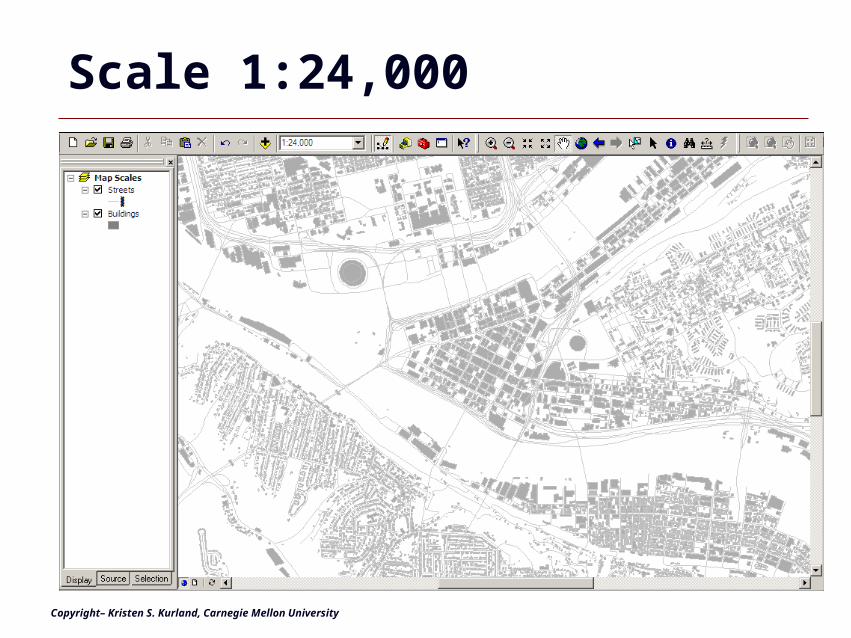
Scale 1:24,000
Copyright– Kristen S. Kurland, Carnegie Mellon University
GIS 35
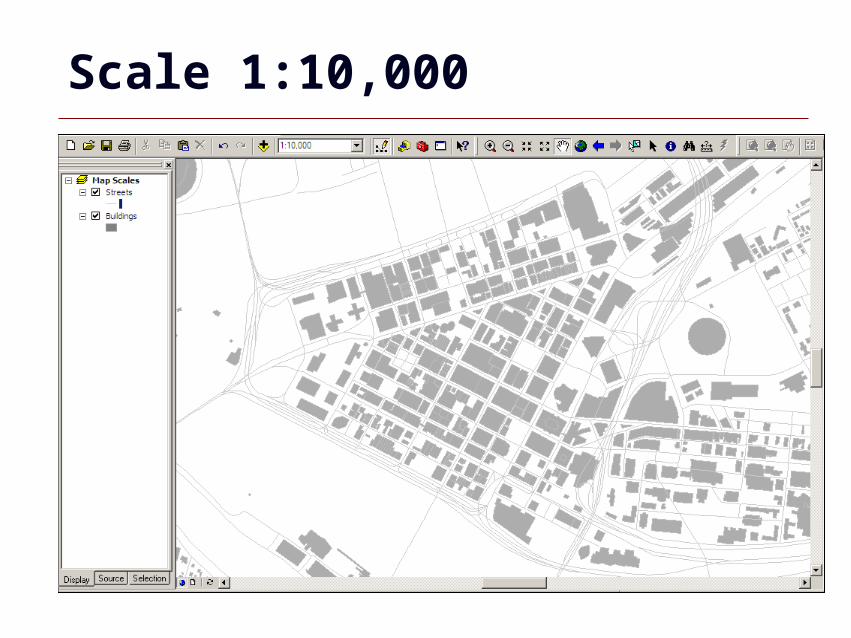
Scale 1:10,000
GIS 36
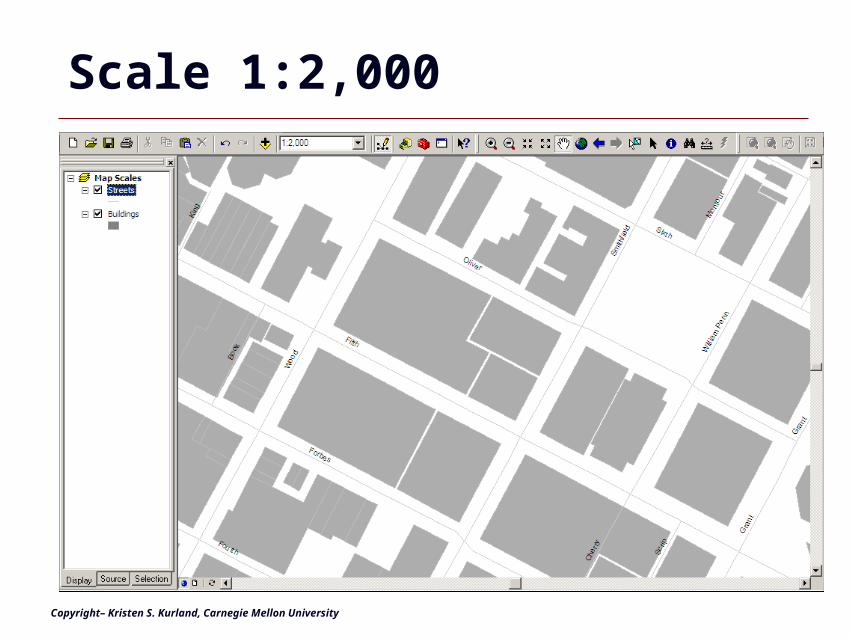
Scale 1:2,000
Copyright– Kristen S. Kurland, Carnegie Mellon University
Multiple Maps, Reports, and Graphs
GIS 38
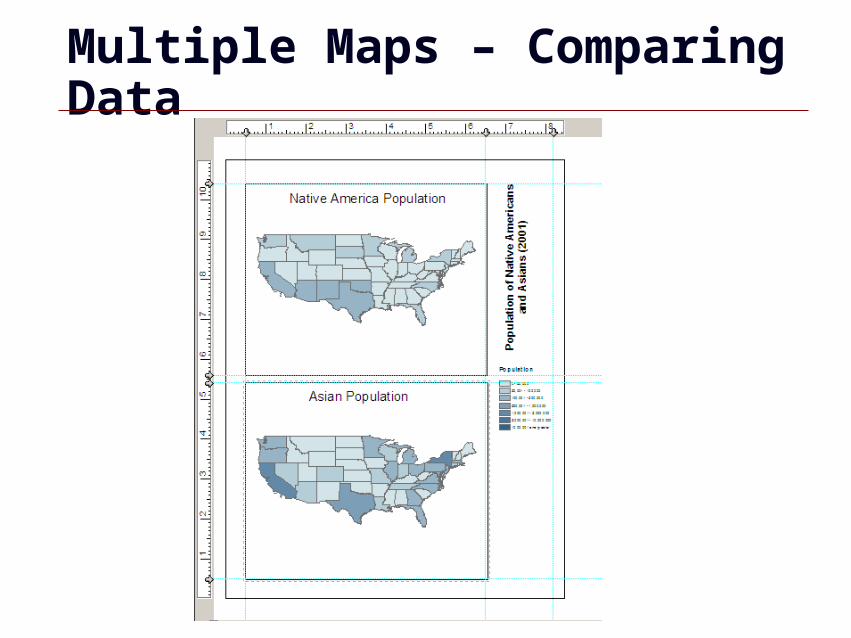
Multiple Maps – Comparing Data

Reports and Graphs
GIS 40
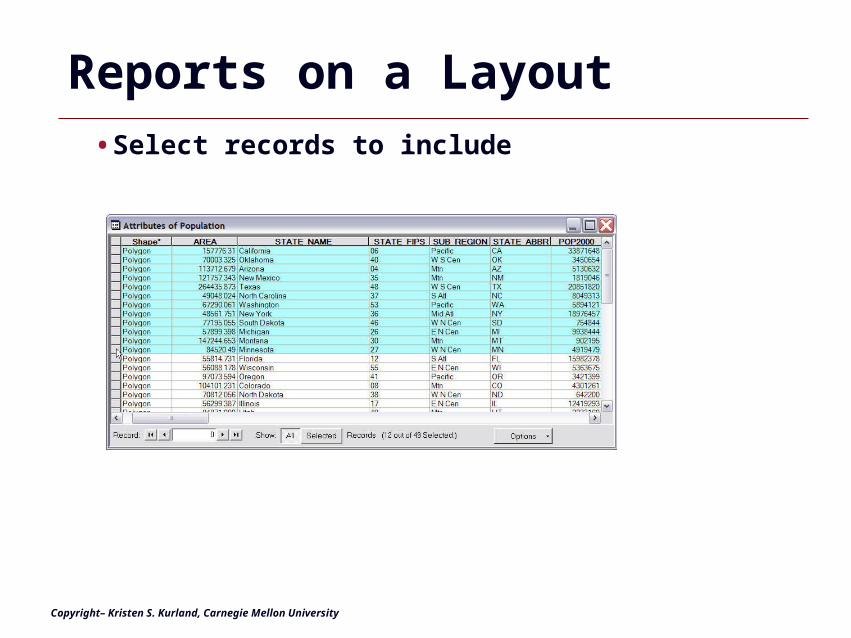
Reports on a Layout•Select records to include
Copyright– Kristen S. Kurland, Carnegie Mellon University
GIS 41
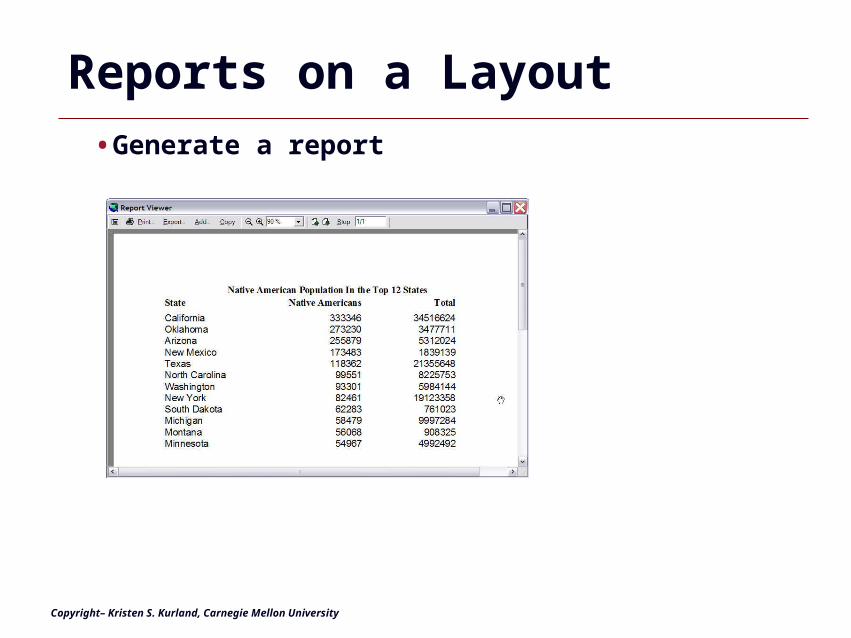
Reports on a Layout•Generate a report
Copyright– Kristen S. Kurland, Carnegie Mellon University
GIS 42
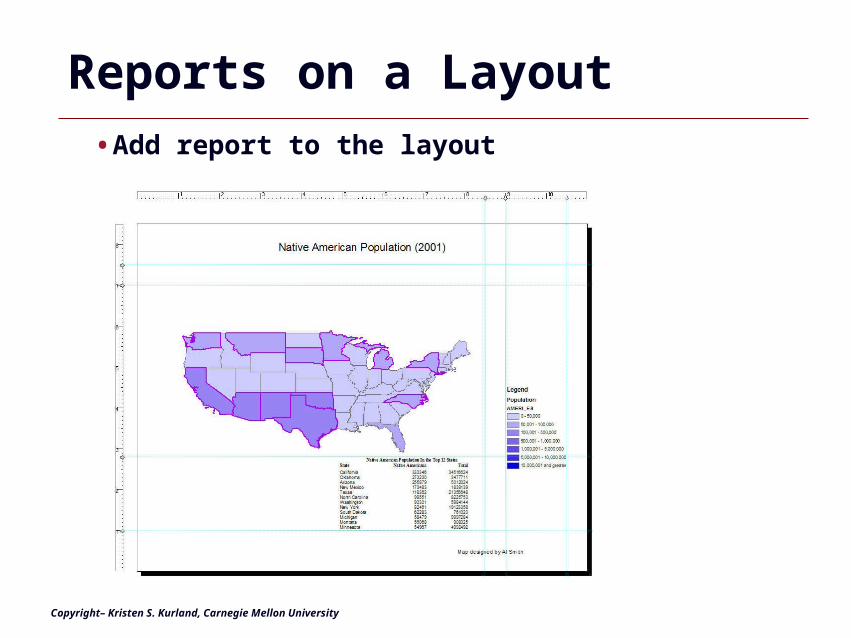
Reports on a Layout•Add report to the layout
Copyright– Kristen S. Kurland, Carnegie Mellon University
GIS 43
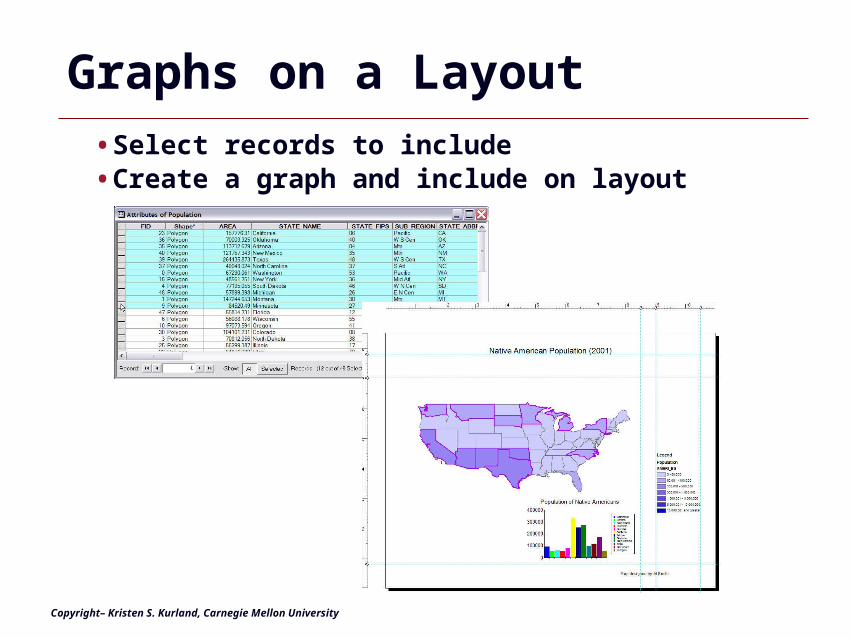
Graphs on a Layout•Select records to include•Create a graph and include on layout
Copyright– Kristen S. Kurland, Carnegie Mellon University
GIS 44
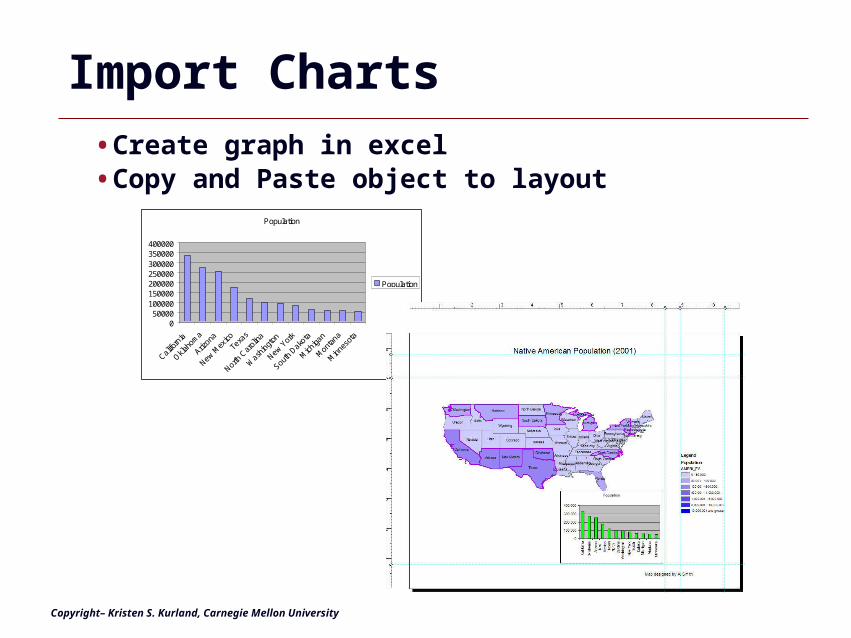
Import Charts•Create graph in excel•Copy and Paste object to layout
Population
050000
100000150000200000250000300000350000400000
Califo
rnia
Oklaho
ma
Arizon
a
New M
exico
Texa
s
North
Car
olina
Wash
ingt
on
New Y
ork
South
Dak
ota
Mich
igan
Mon
tana
Minn
esot
a
Population
Copyright– Kristen S. Kurland, Carnegie Mellon University
Exporting Maps
GIS 46
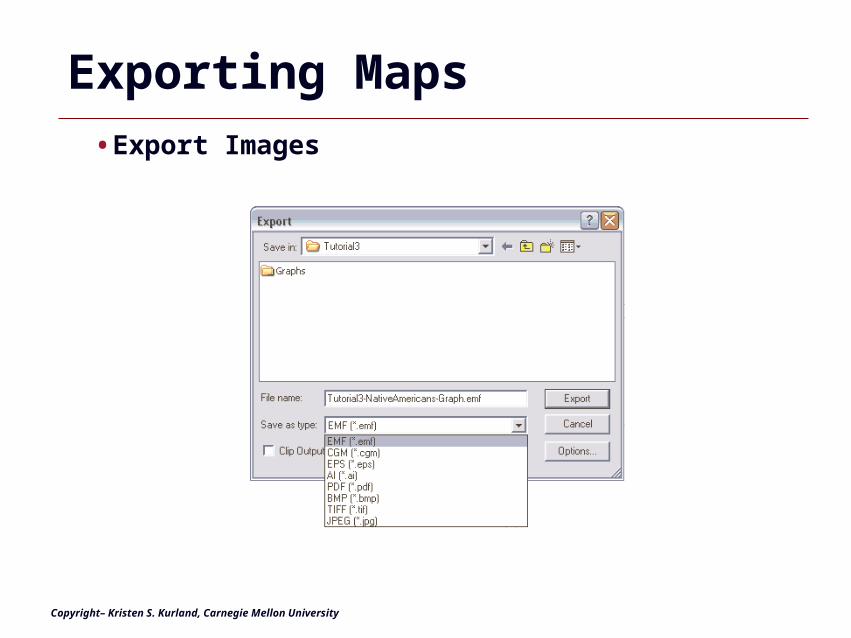
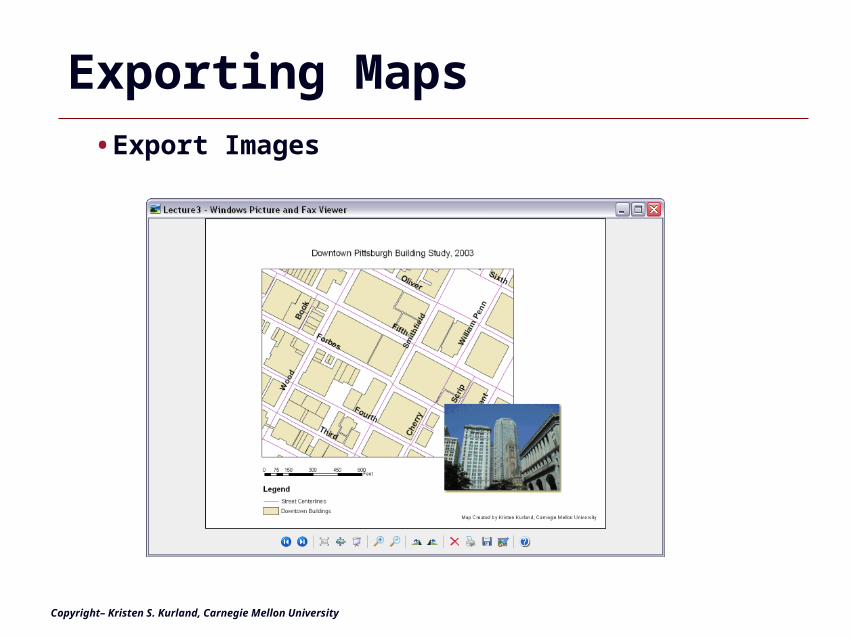
Exporting Maps•Export Images
Copyright– Kristen S. Kurland, Carnegie Mellon University
GIS 47
Exporting Maps•Export Images
Copyright– Kristen S. Kurland, Carnegie Mellon University
GIS 48
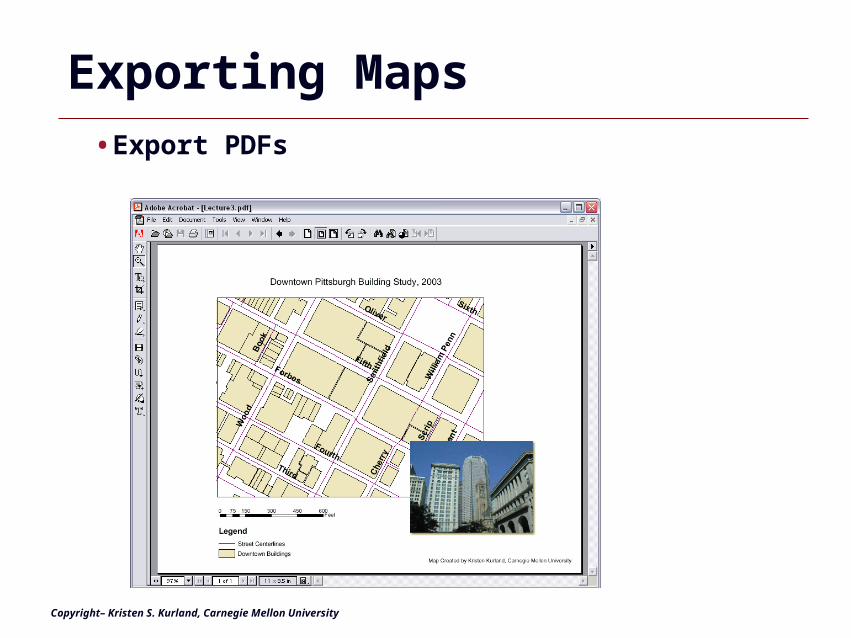
Exporting Maps•Export PDFs
Copyright– Kristen S. Kurland, Carnegie Mellon University
GIS 49
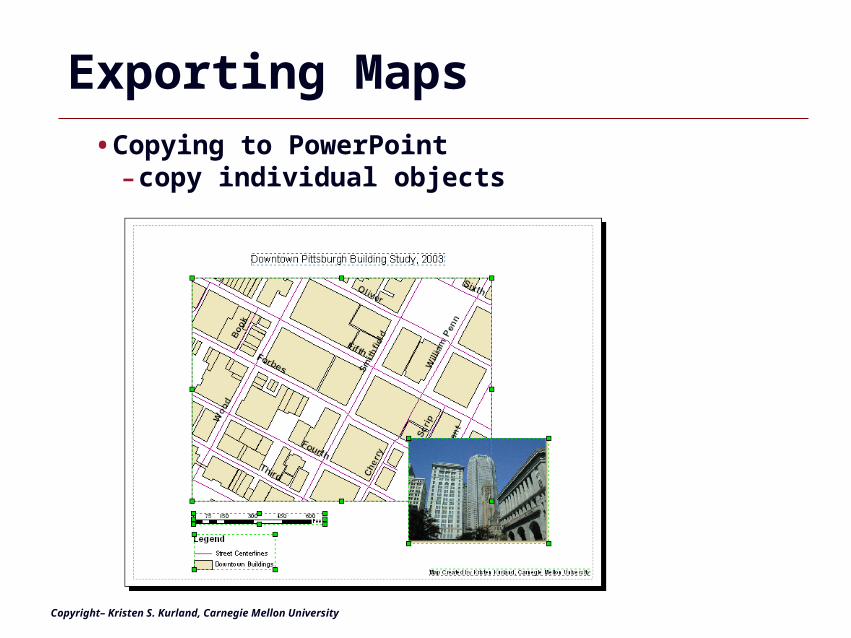
Exporting Maps•Copying to PowerPoint-copy individual objects
Copyright– Kristen S. Kurland, Carnegie Mellon University
GIS 50
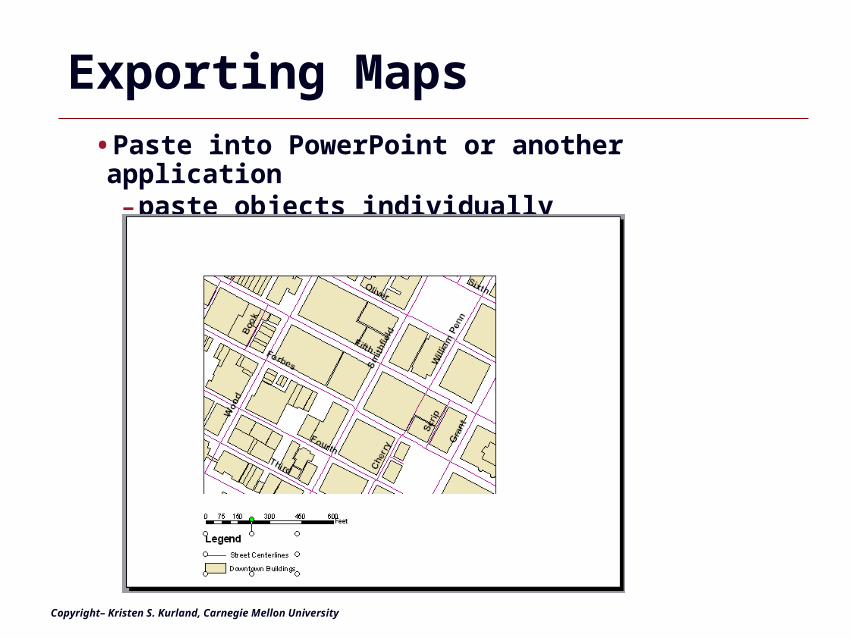
Exporting Maps•Paste into PowerPoint or another application-paste objects individually
Copyright– Kristen S. Kurland, Carnegie Mellon University

Other Outputs
GIS 52
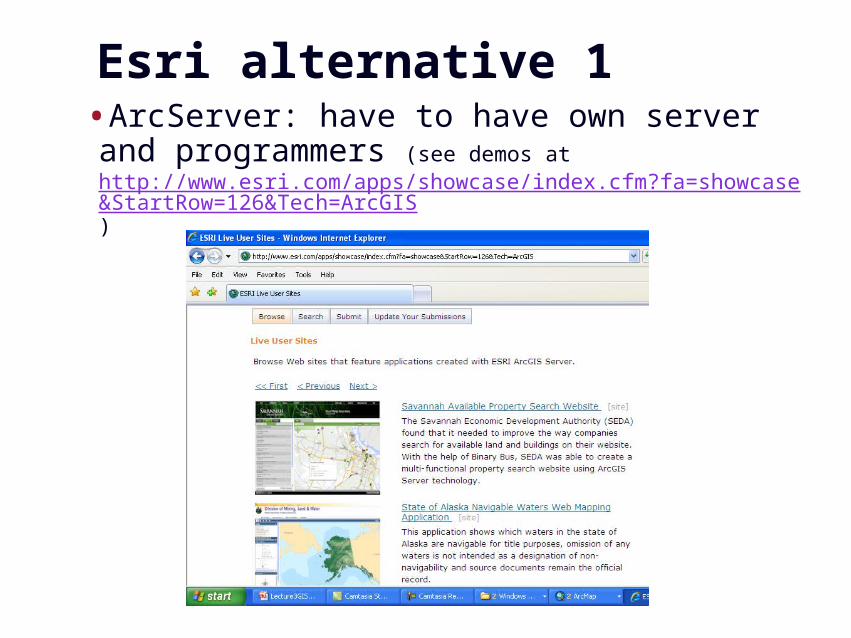
Esri alternative 1•ArcServer: have to have own server and programmers (see demos at http://www.esri.com/apps/showcase/index.cfm?fa=showcase&StartRow=126&Tech=ArcGIS)
GIS 53
Esri alternative 2
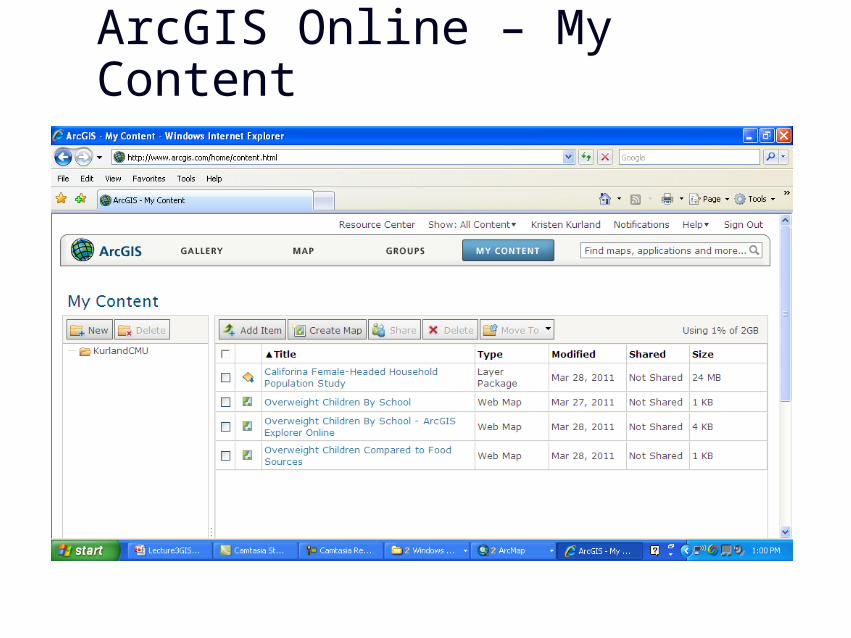
•Web map publishing using ArcGIS Desktop, Online, and Explorer
http://resources.arcgis.com/content/arcgis-explorer/1500/download
1. Get free accounts at Esri
2. Create map composition in ArcGIS Desktop and save as layer
package (file with data and symmbolization)
3. Upload layer packages to your ArcGIS Online account (up to 2GB)
4. Author and provide access to map composition in ArcGIS Explorer
GIS 54
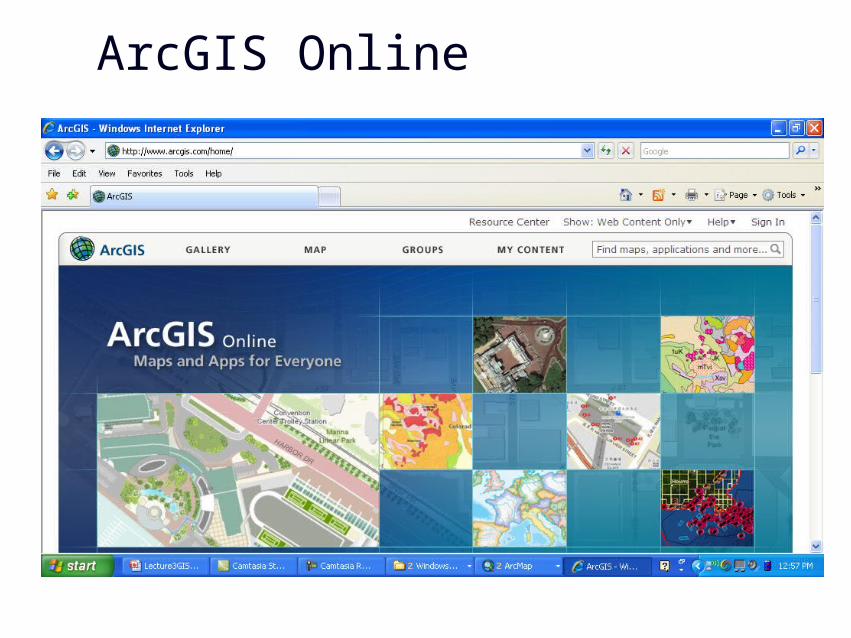
ArcGIS Online
GIS 55
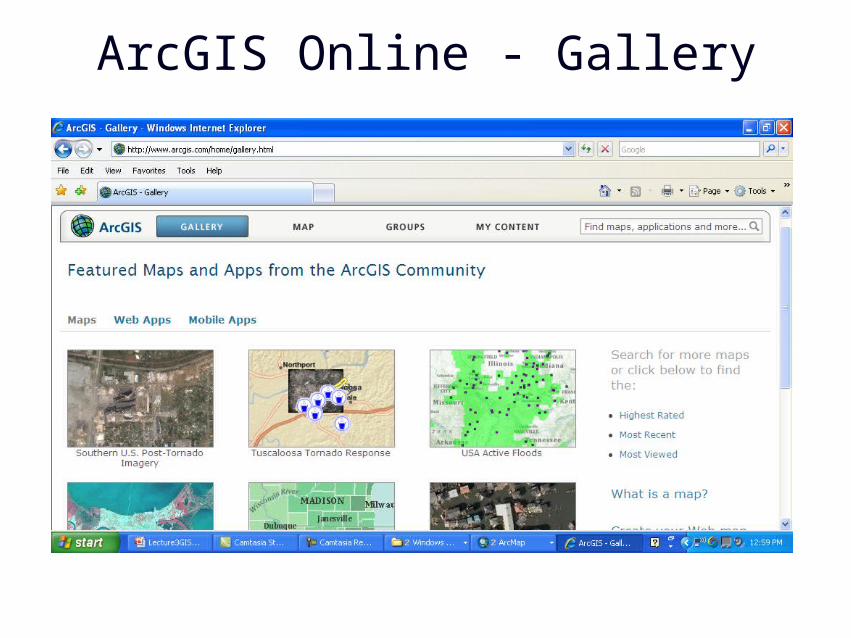
ArcGIS Online - Gallery
GIS 56
ArcGIS Online – My Content
GIS 57
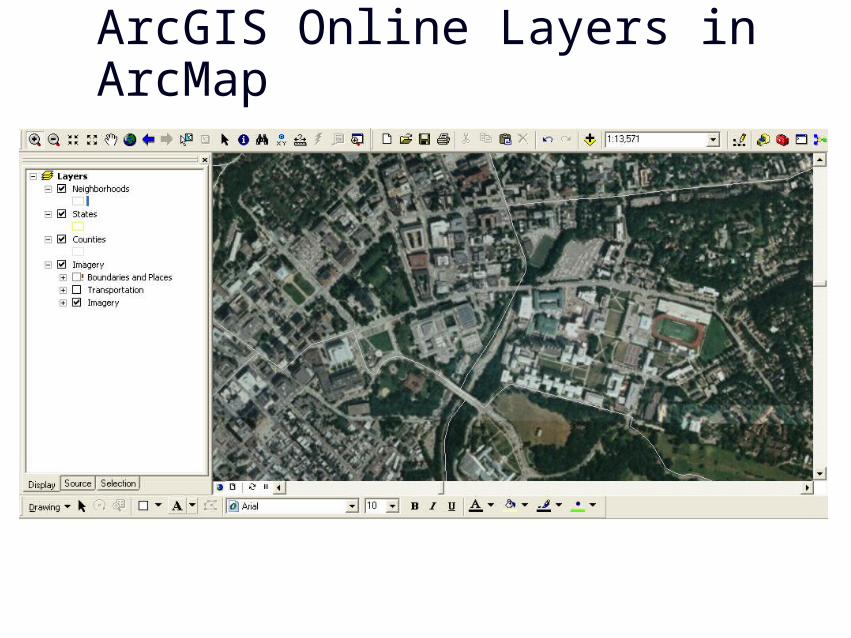
ArcGIS Online Layers in ArcMap
GIS 58
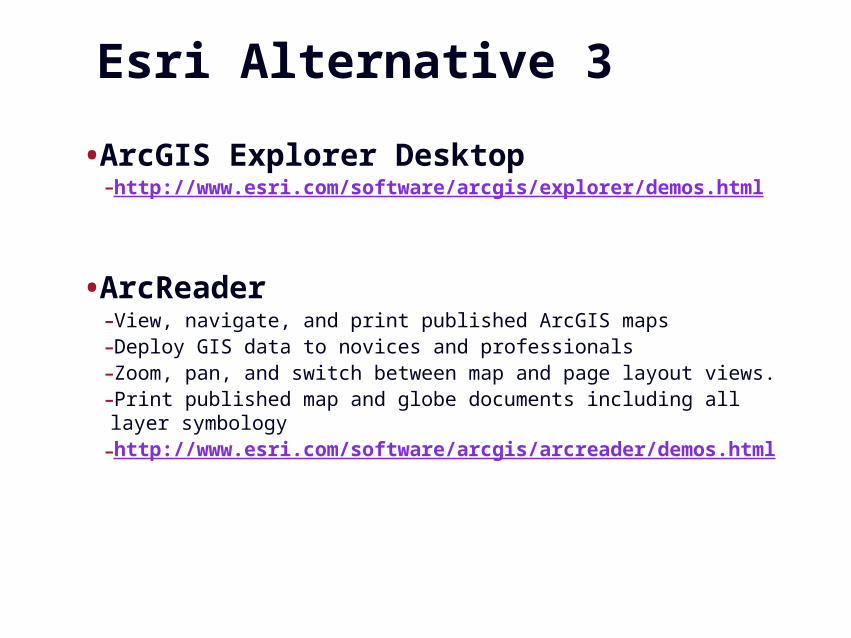
Esri Alternative 3
•ArcGIS Explorer Desktop-http://www.esri.com/software/arcgis/explorer/demos.html
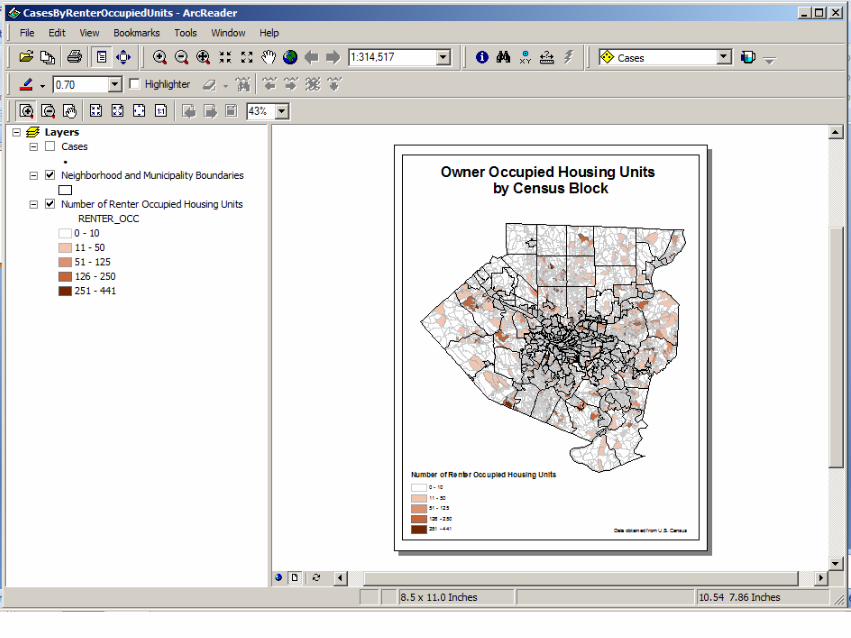
•ArcReader-View, navigate, and print published ArcGIS maps-Deploy GIS data to novices and professionals-Zoom, pan, and switch between map and page layout views. -Print published map and globe documents including all layer symbology-http://www.esri.com/software/arcgis/arcreader/demos.html
GIS 59
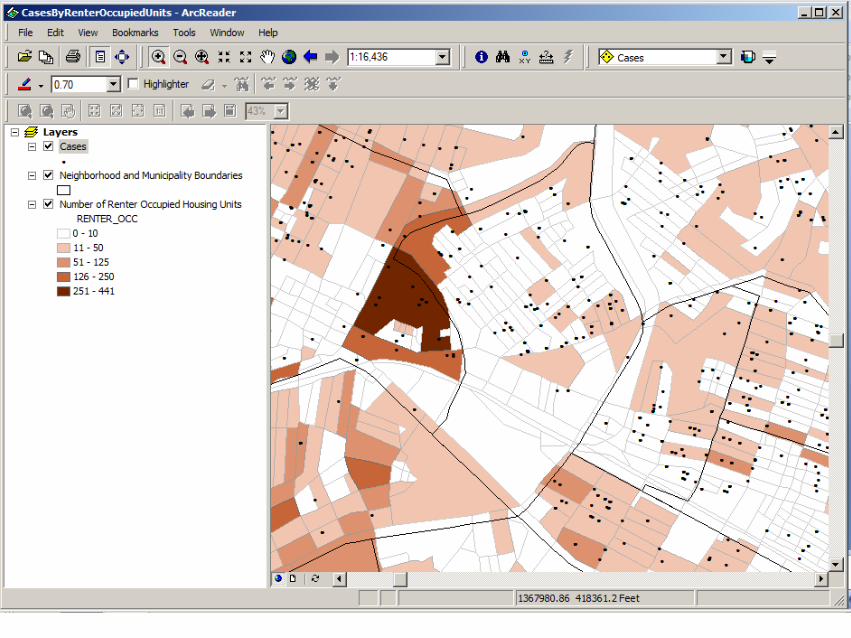
GIS 60
GIS 61
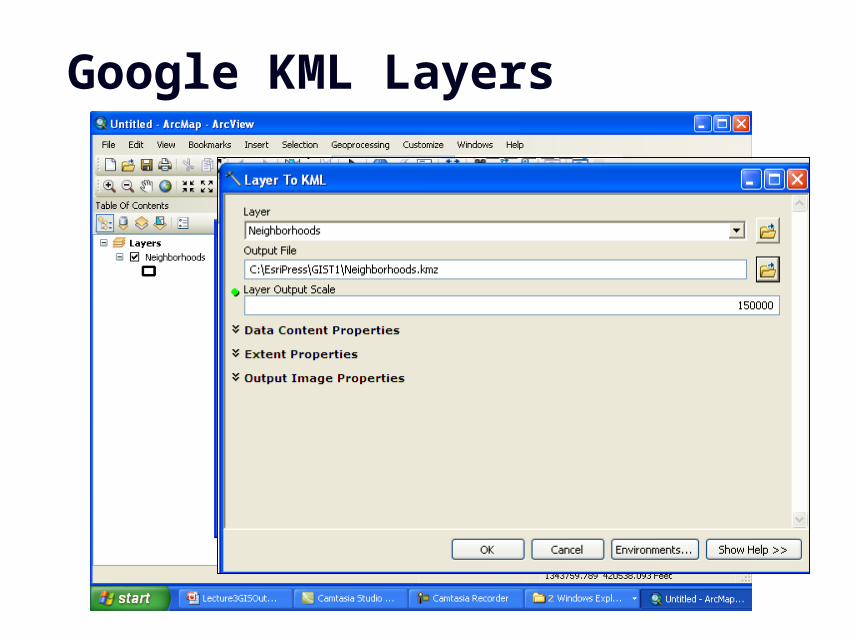
Google KML Layers
GIS 62
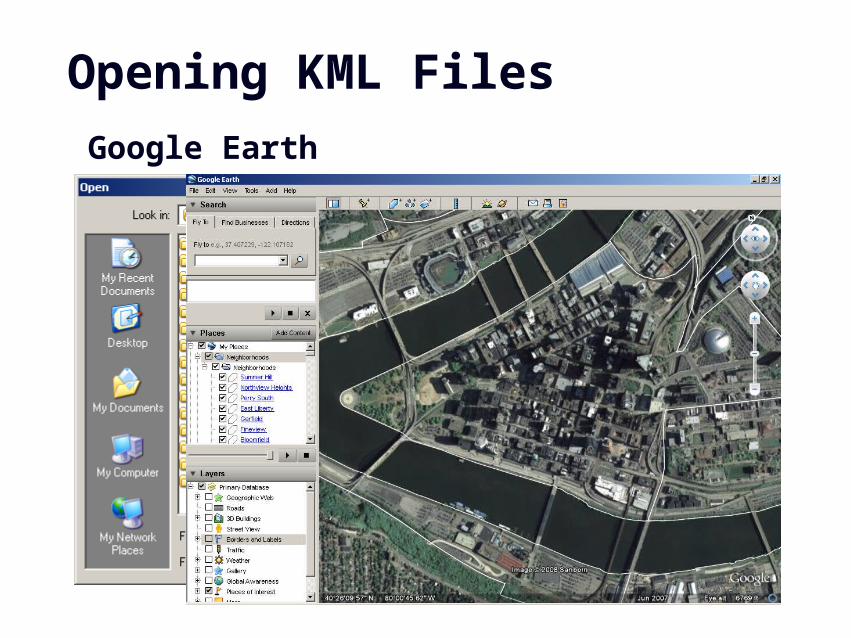
Opening KML Files
Google Earth