Embed Size (px)
Citation preview
GIS @ Tufts:GIS @ Tufts:New Developments in Spatial Exploration and Analysis for the Tufts Community
Patrick FloranceGIS Center Manager &Senior GIS Specialist
UIT
Barbara ParmenterGIS Research Specialist
& LecturerUIT & UEPP
GIS @ Tufts:GIS @ Tufts:New Developments in Spatial Exploration and Analysis for the Tufts Community
• Introductions• Overview of GIS• GIS Resources & Services• Geography 2.0
– Google Earth
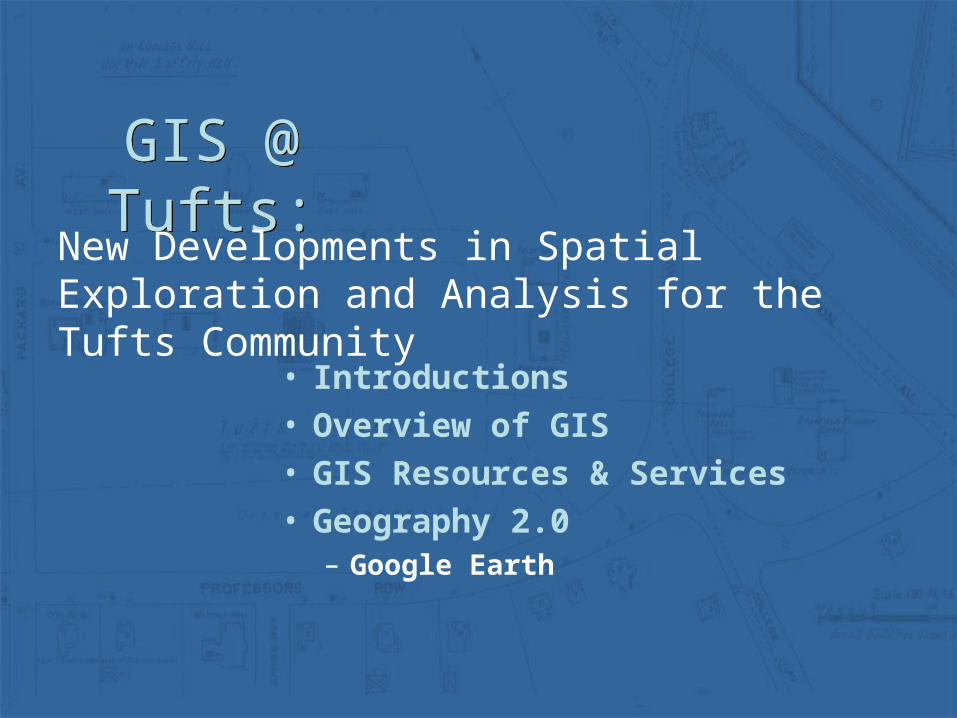
UIT GIS Resources & ServicesUIT GIS Resources & Servicesgis.tufts.edu
Details at gis.tufts.edu
• Instruction and tutorials
• Consulting for individual faculty, students, and research teams
• Data acquisition and distribution
• Software distribution and management
• Class lectures on spatial analysis and GIS
• Course activity advising and development
• Application development (e.g., Google Earth for teaching)
• Research design and database design consultations
GIS Support for Research and TeachingGIS Support for Research and Teaching
What is GIS?What is GIS?• A spatial database• GIS helps you integrate tabular and spatial
information• Display information on a map• Explore spatial relationships (e.g., children’s
access to open space)• Combine data for traditional statistical
analysis (e.g., toxic releases from specific sites combined with census data)
• Perform spatial analysis
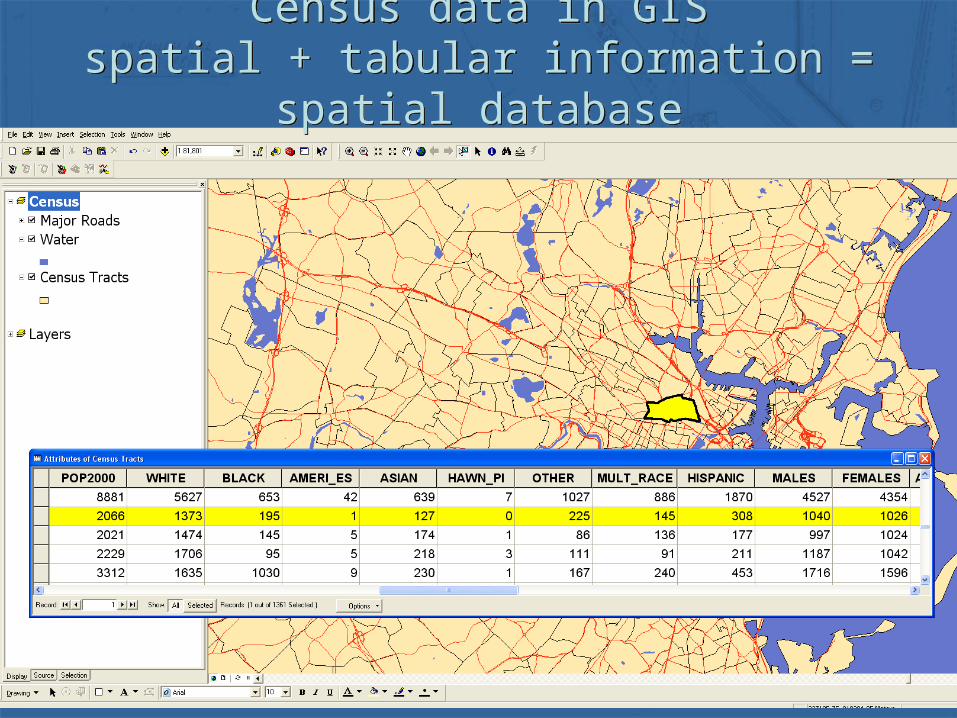
Census data in GISspatial + tabular information = spatial database
Census data in GISspatial + tabular information = spatial database
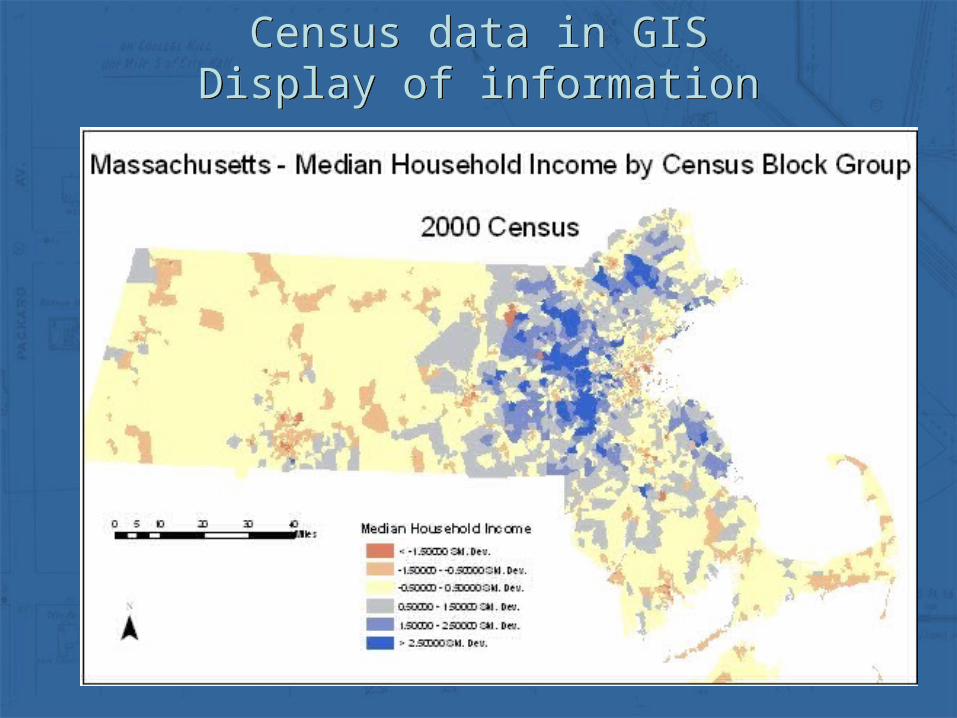
Census data in GISDisplay of informationCensus data in GIS
Display of information
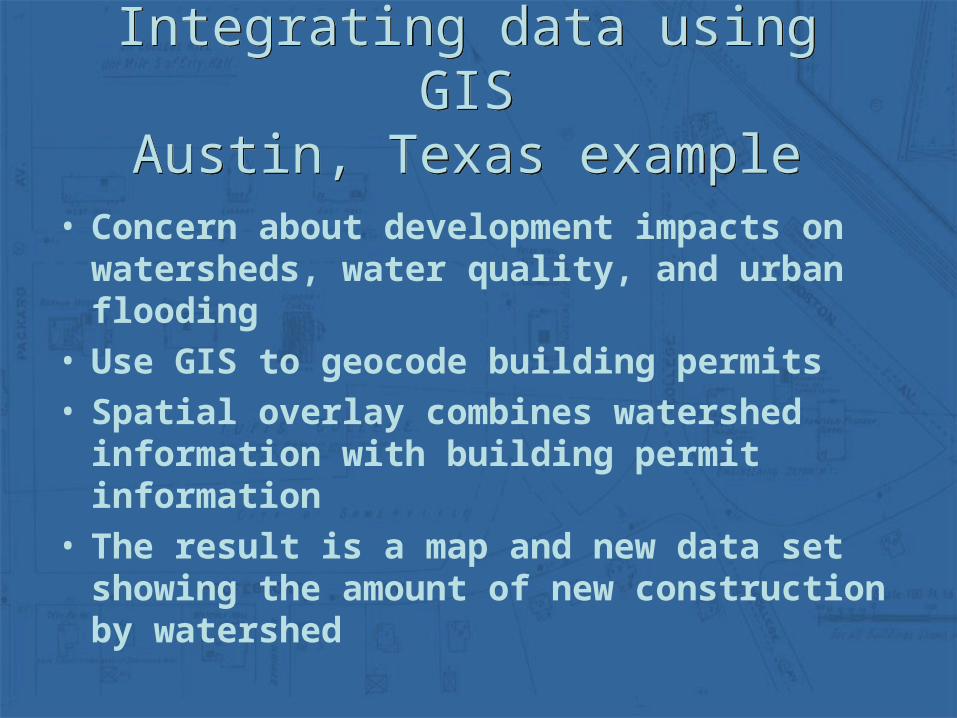
Integrating data using GISAustin, Texas example
Integrating data using GISAustin, Texas example
• Concern about development impacts on watersheds, water quality, and urban flooding
• Use GIS to geocode building permits• Spatial overlay combines watershed
information with building permit information• The result is a map and new data set showing
the amount of new construction by watershed
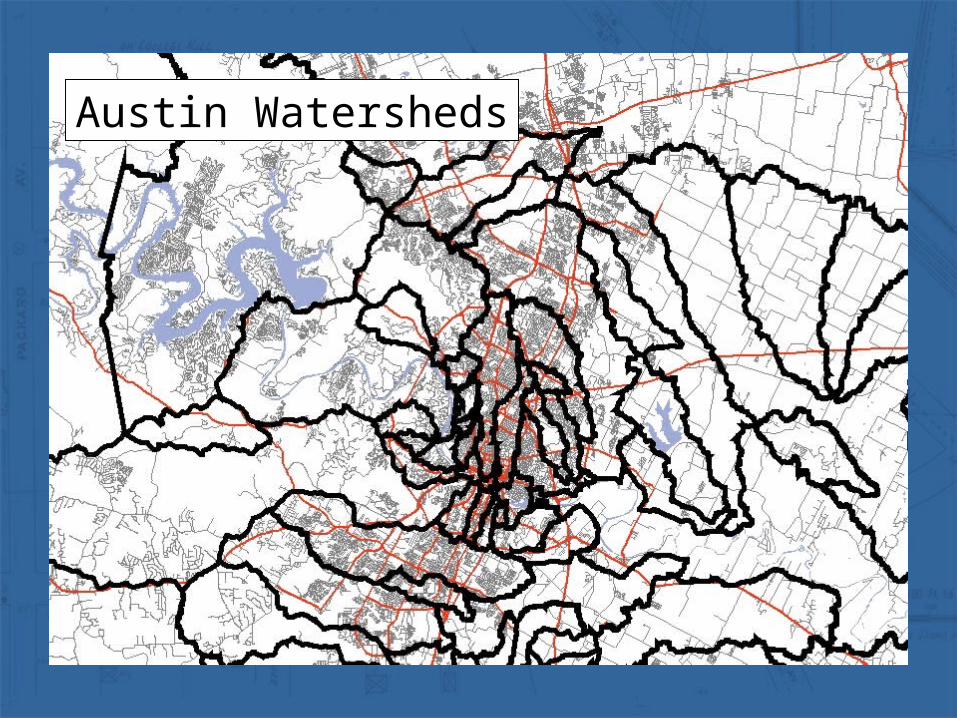
Austin Watersheds
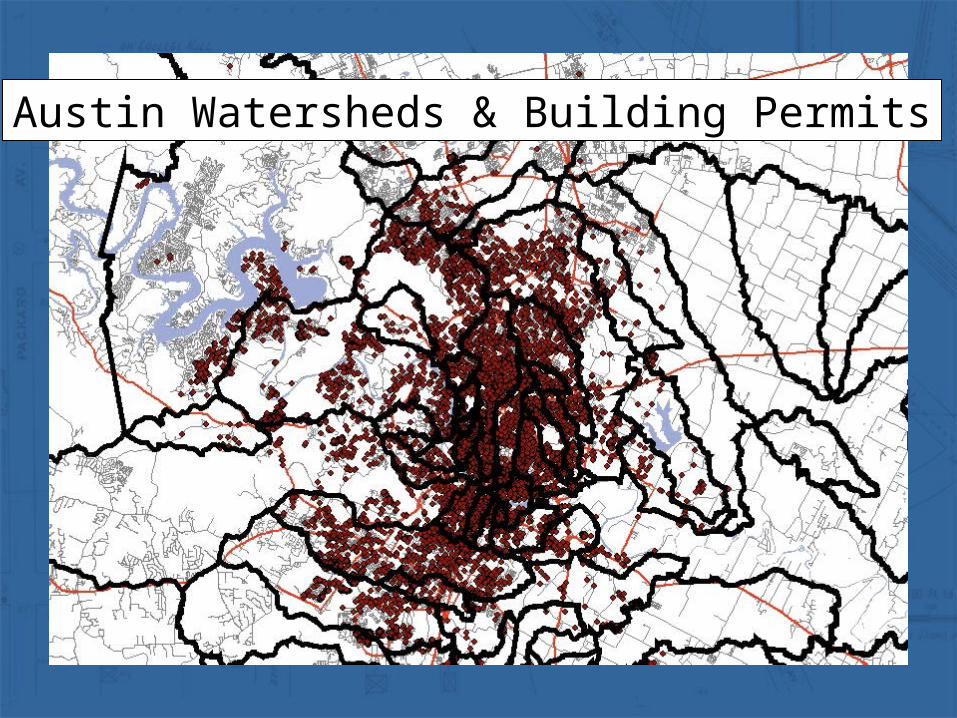
Austin Watersheds & Building Permits
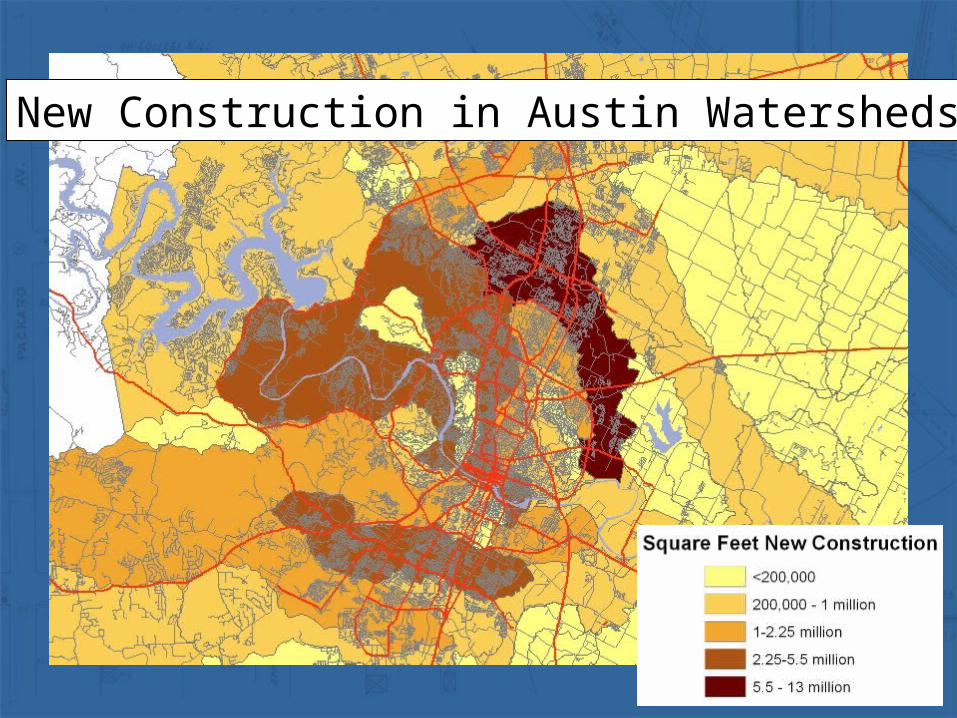
New Construction in Austin Watersheds
Using historical data in GISAustin, Texas example
Using historical data in GISAustin, Texas example
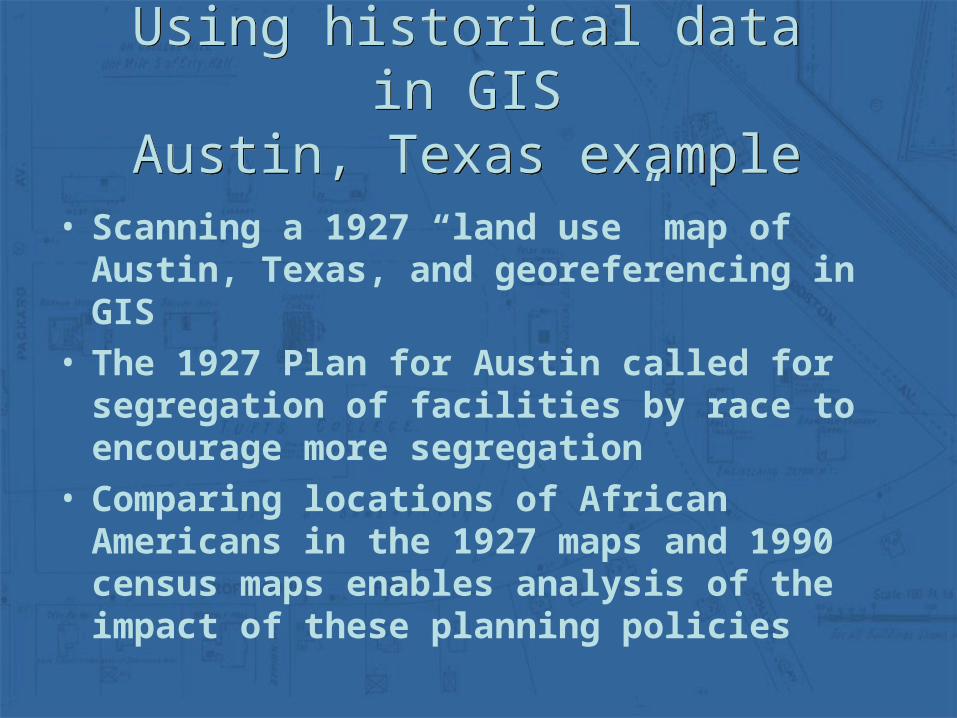
• Scanning a 1927 “land use” map of Austin, Texas, and georeferencing in GIS
• The 1927 Plan for Austin called for segregation of facilities by race to encourage more segregation
• Comparing locations of African Americans in the 1927 maps and 1990 census maps enables analysis of the impact of these planning policies
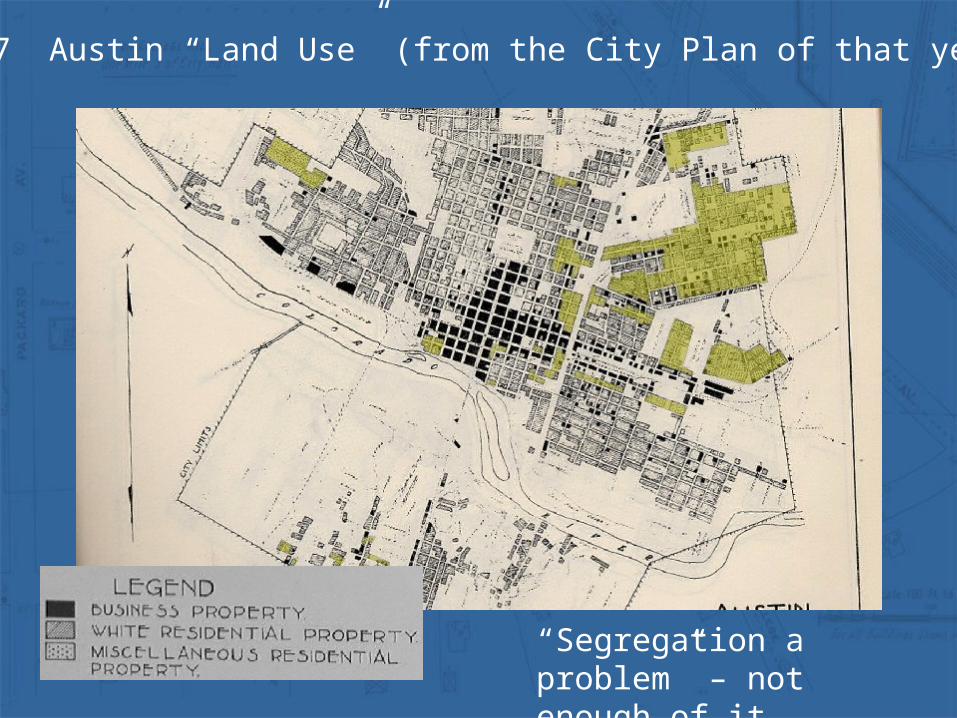
1927 Austin “Land Use” (from the City Plan of that year)
“Segregation a problem” – not enough of it….
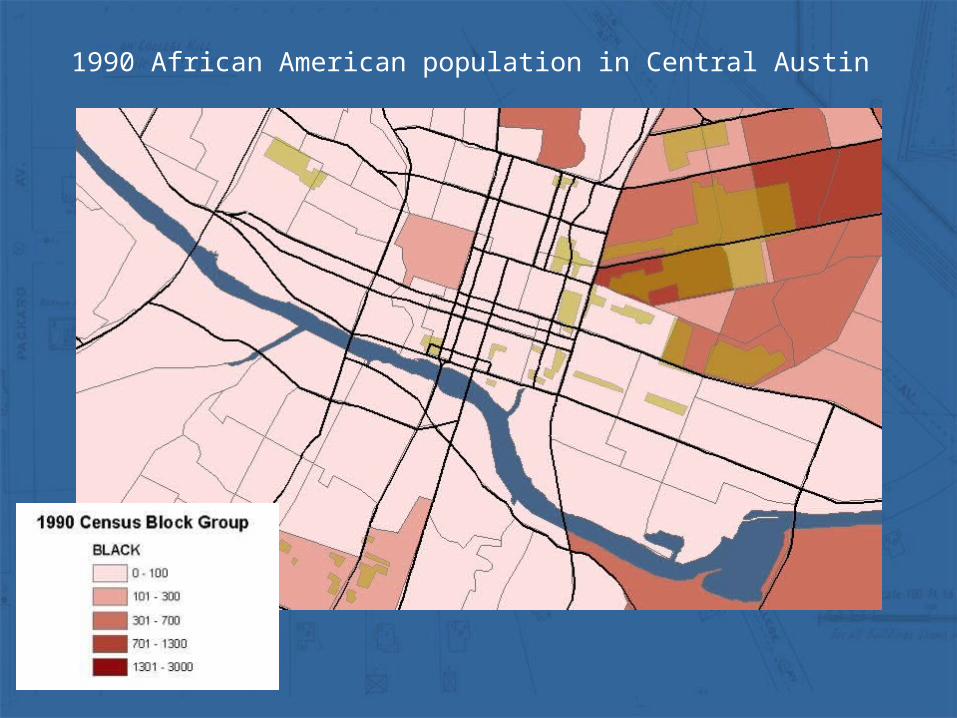
1990 African American population in Central Austin
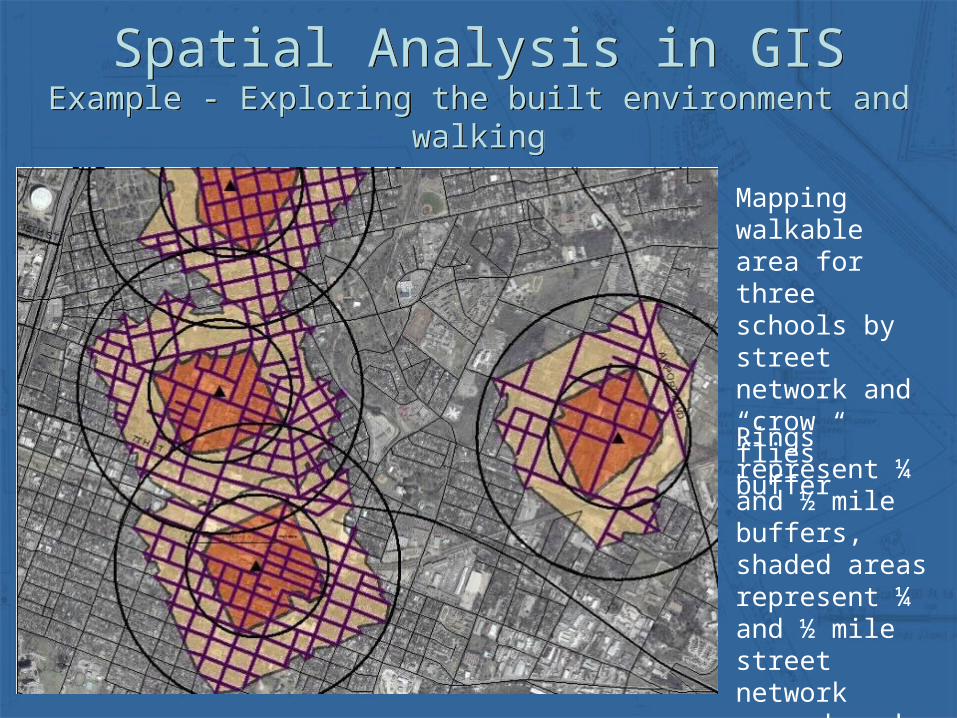
Mapping walkable area for three schools by street network and “crow flies” buffer
Rings represent ¼ and ½ mile buffers, shaded areas represent ¼ and ½ mile street network around each school
Spatial Analysis in GISExample - Exploring the built environment and walking
Spatial Analysis in GISExample - Exploring the built environment and walking
Spatial Analysis in GISExample - Exploring the built environment and walking
Spatial Analysis in GISExample - Exploring the built environment and walking
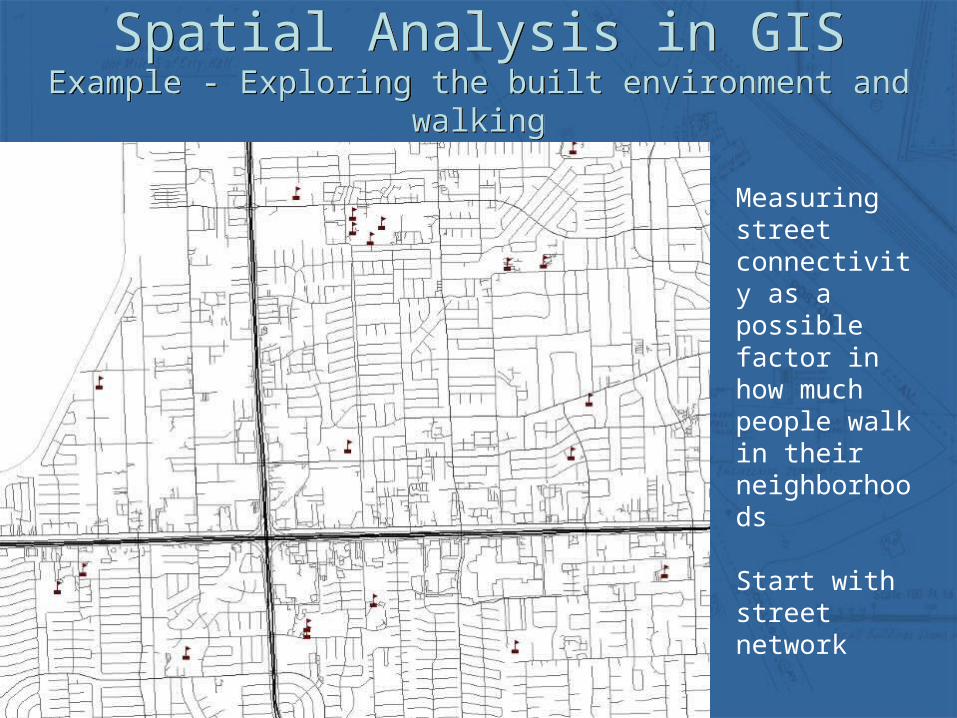
Measuring street connectivity as a possible factor in how much people walk in their neighborhoods
Start with street network
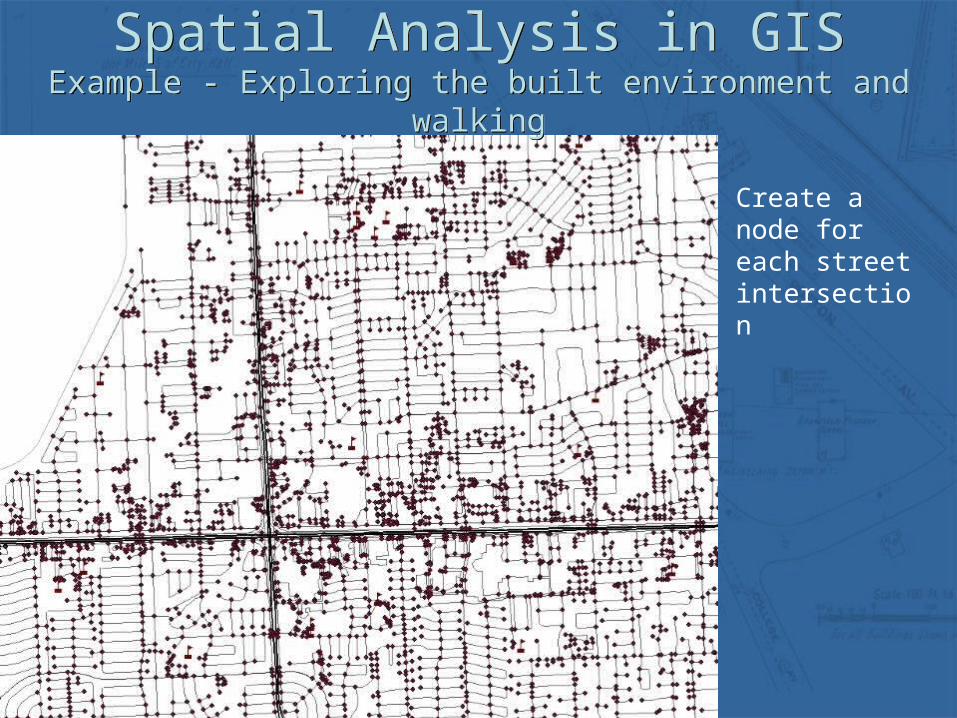
Create a node for each street intersection
Spatial Analysis in GISExample - Exploring the built environment and walking
Spatial Analysis in GISExample - Exploring the built environment and walking
Spatial Analysis in GISExample - Exploring the built environment and walking
Spatial Analysis in GISExample - Exploring the built environment and walking
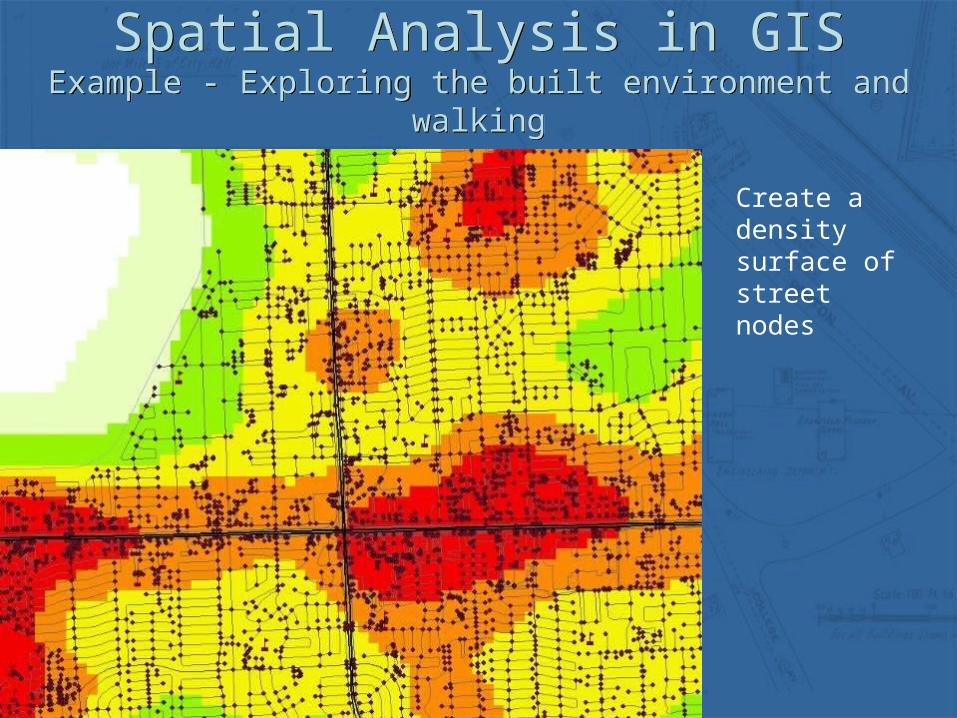
Create a density surface of street nodes
Spatial Analysis in GISExample - Exploring the built environment and walking
Spatial Analysis in GISExample - Exploring the built environment and walking
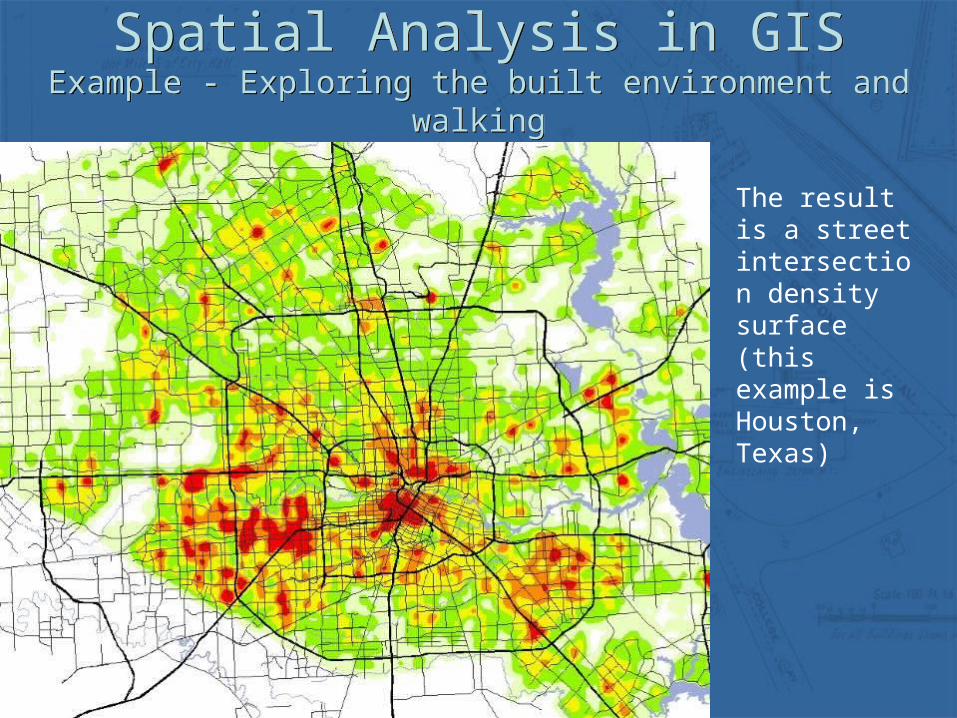
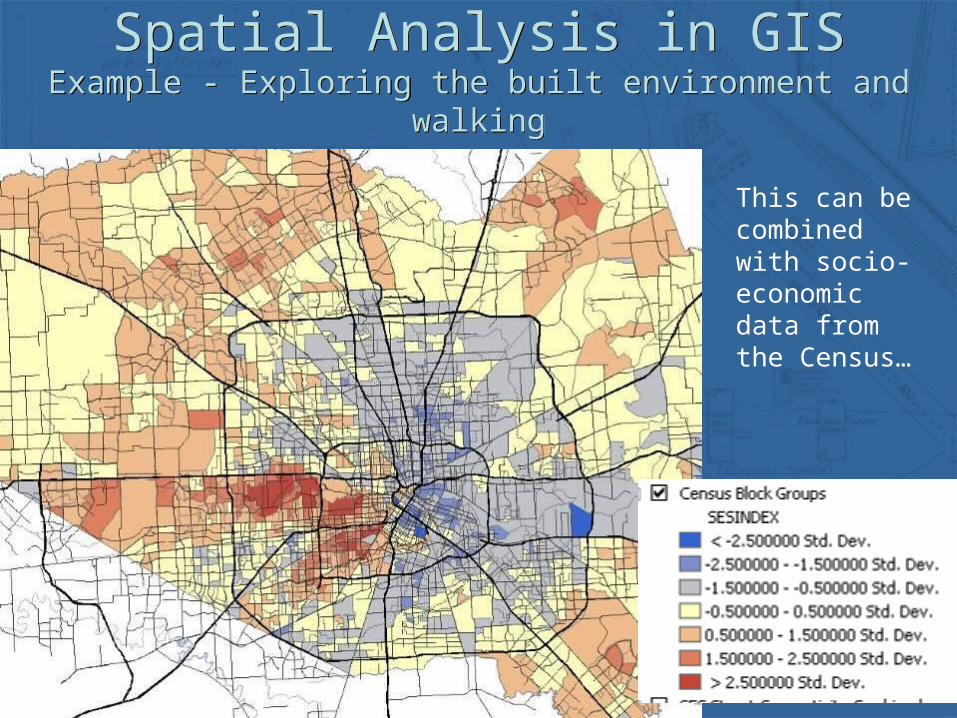
The result is a street intersection density surface (this example is Houston, Texas)
Spatial Analysis in GISExample - Exploring the built environment and walking
Spatial Analysis in GISExample - Exploring the built environment and walking
This can be combined with socio-economic data from the Census…
Spatial Analysis in GISExample - Exploring the built environment and walking
Spatial Analysis in GISExample - Exploring the built environment and walking
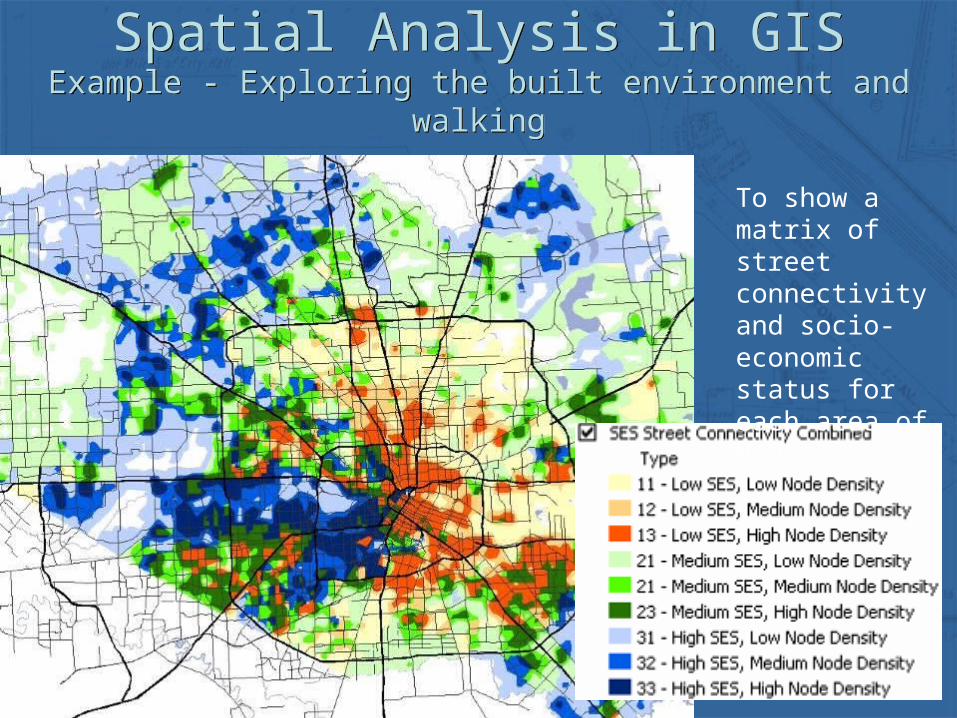
To show a matrix of street connectivity and socio-economic status for each area of Houston
Example of data designed for spatial analysis
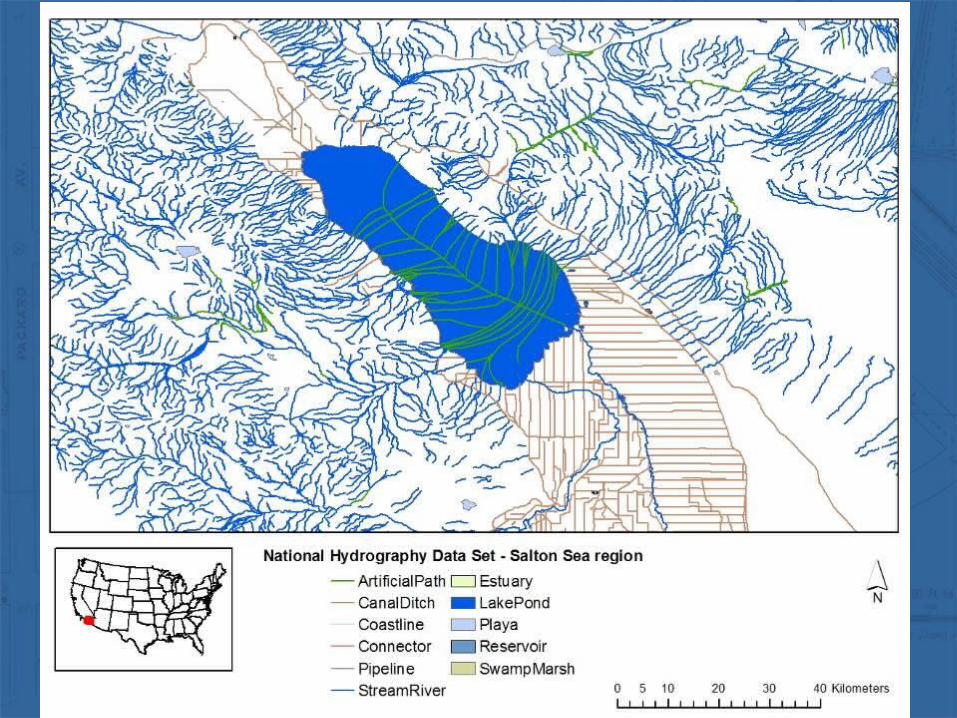
The National Hydrography Data Set
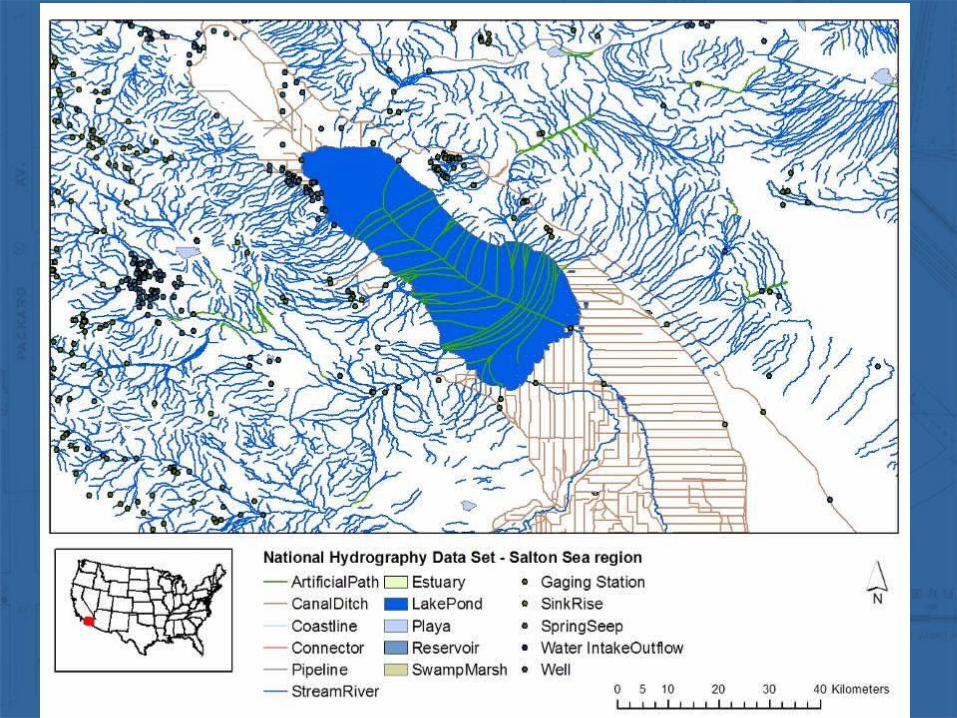
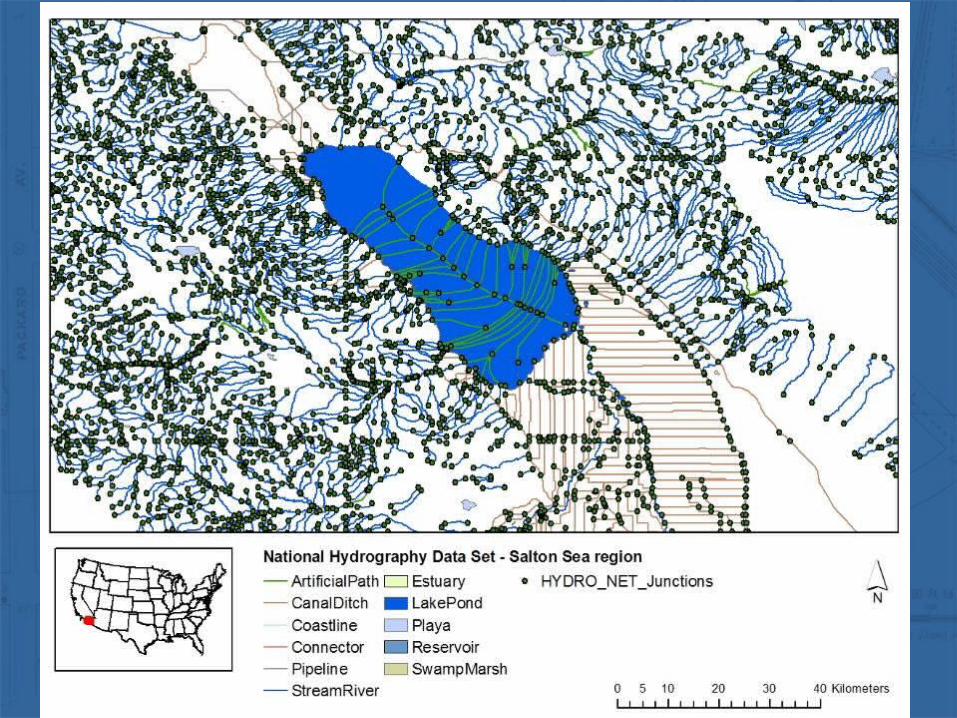
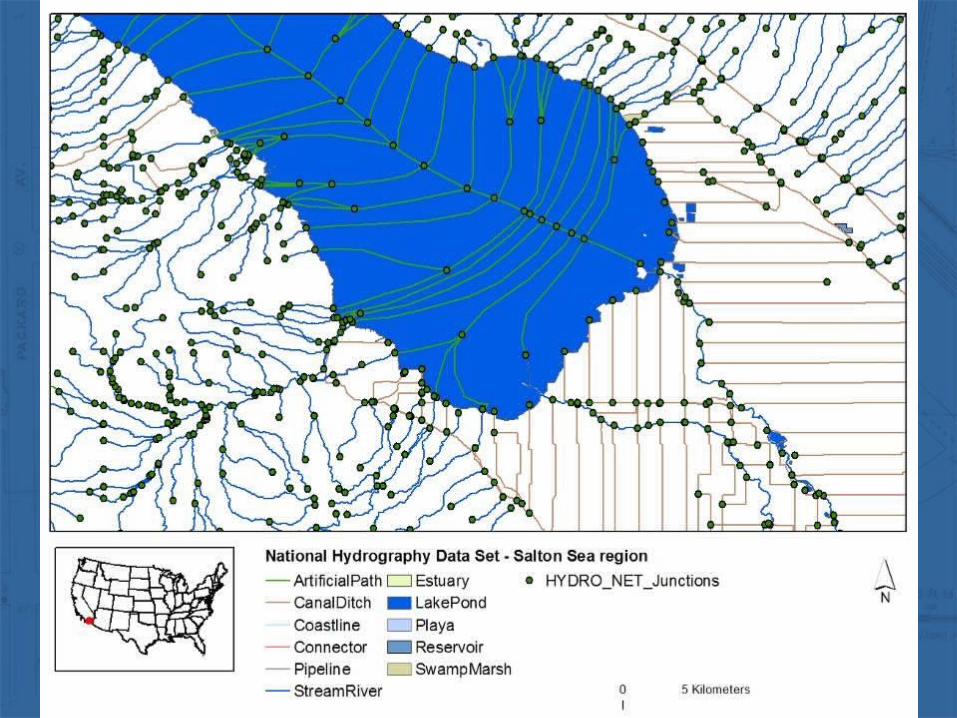
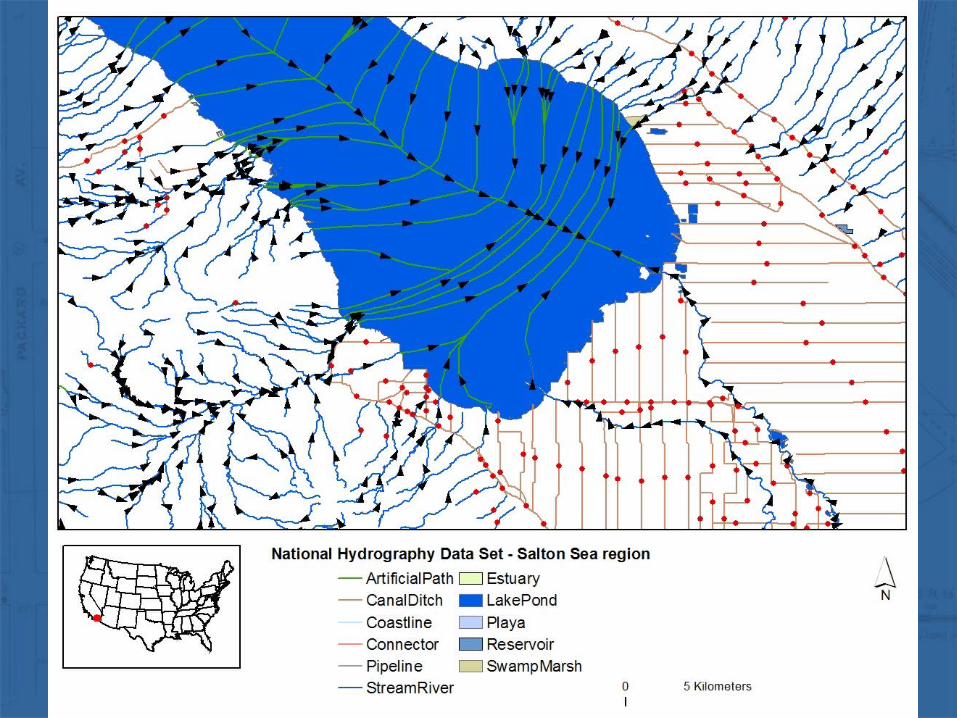
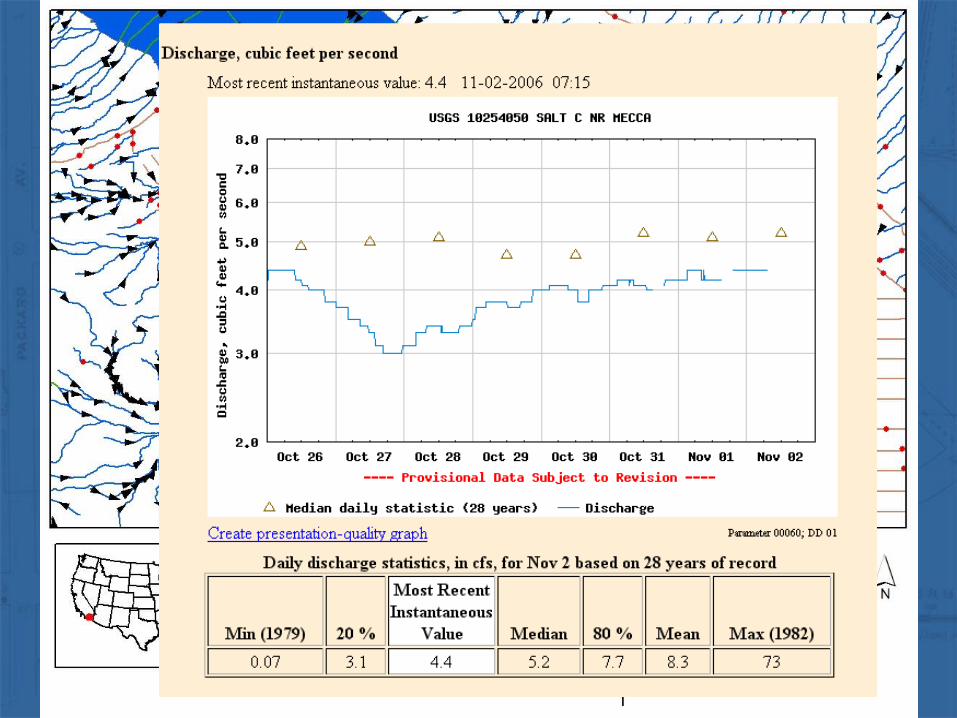
Example of data designed for spatial analysis
The National Hydrography Data Set
• A new water-related data source to support hydrological analysis
• Water “flow” lines are designed to model the flow of water through a system – follow a raindrop from the mountains to the sea
• The data set includes hyper-links to real-time data from stream and precipitation gauges
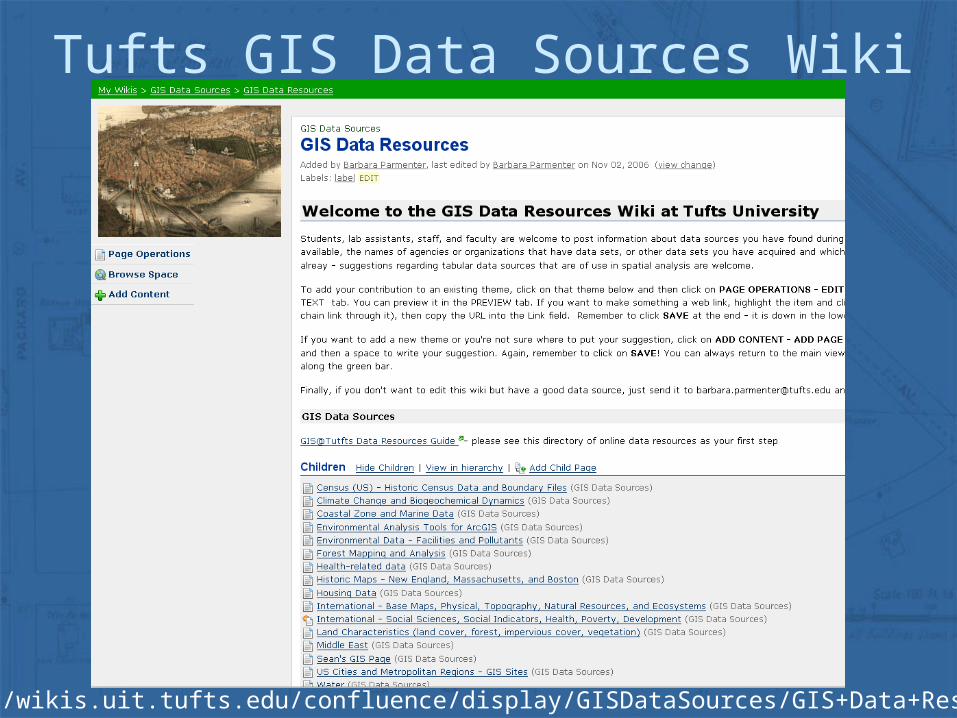
Tufts GIS Data Sources Wiki
https://wikis.uit.tufts.edu/confluence/display/GISDataSources/GIS+Data+Resources
Teaching & Learning with Google Earth
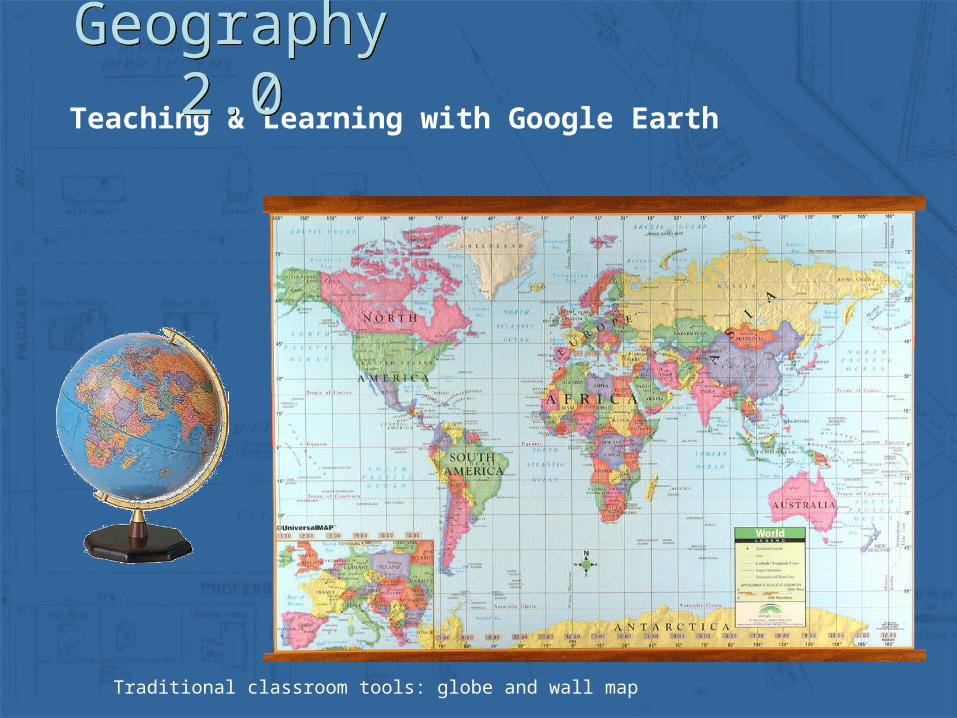
Geography 2.0Geography 2.0
Traditional classroom tools: globe and wall map
Teaching & Learning with Google Earth
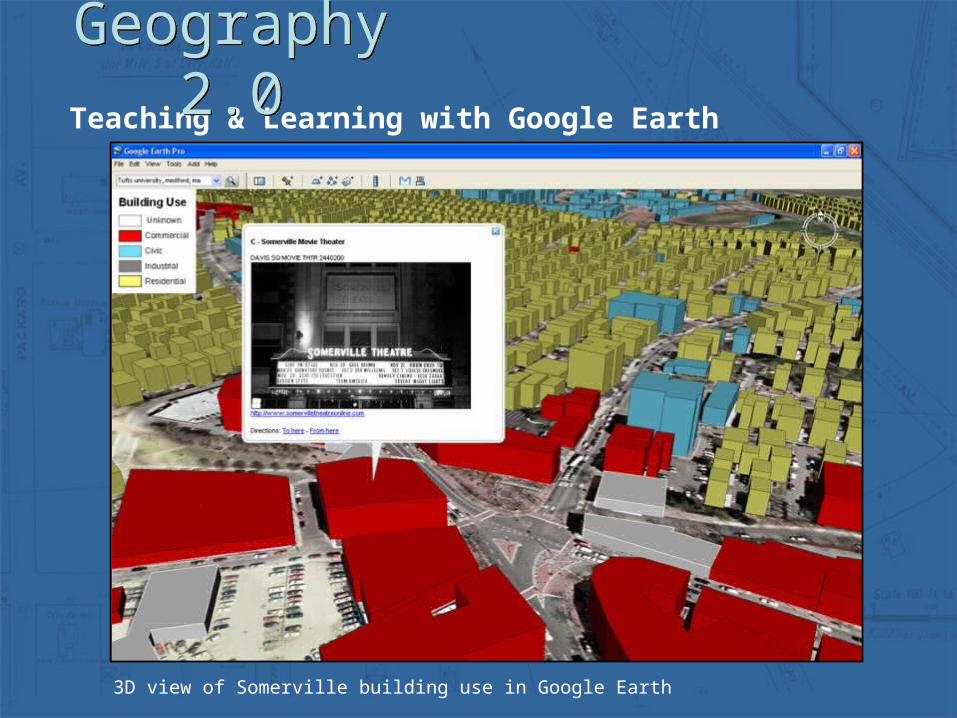
Geography 2.0Geography 2.0
3D view of Somerville building use in Google Earth
Teaching & Learning with Google Earth
Geography 2.0Geography 2.0
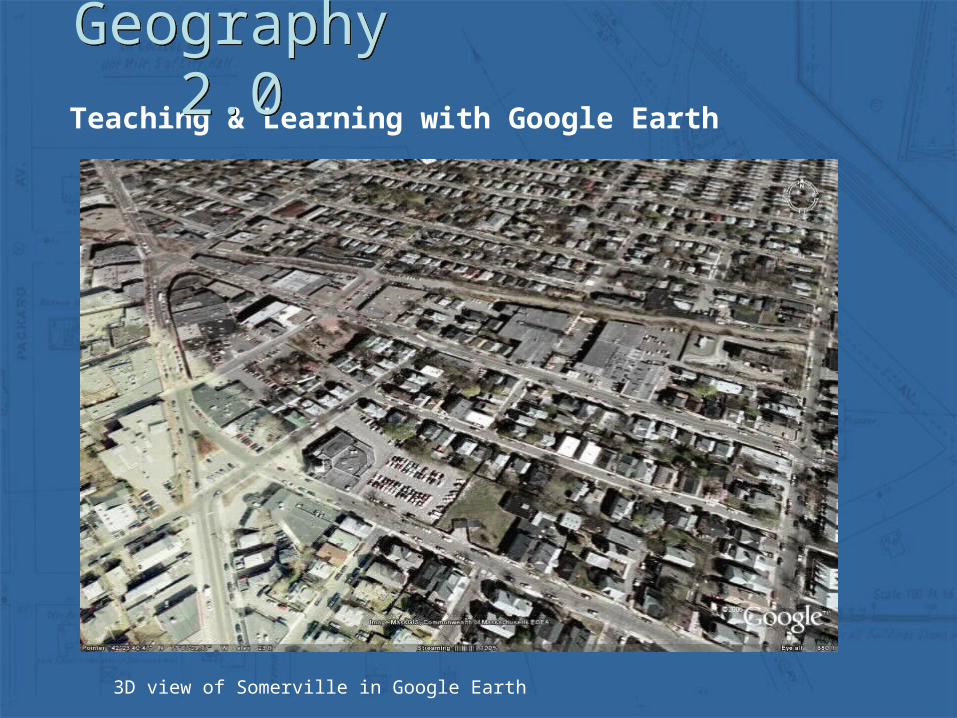
3D view of Somerville in Google Earth
Teaching & Learning with Google Earth
Geography 2.0Geography 2.0
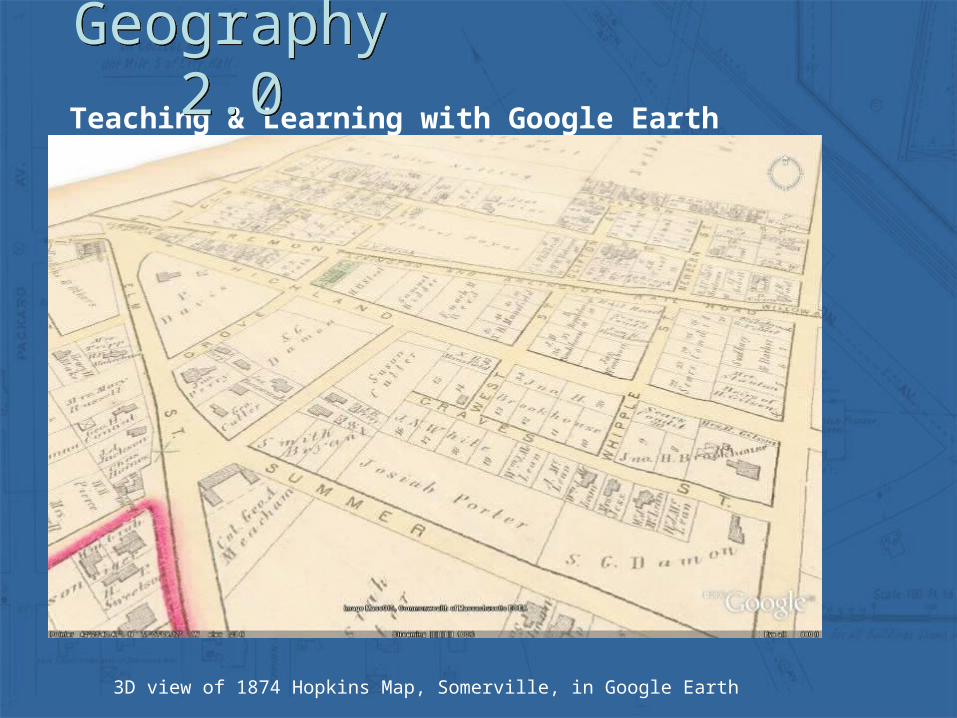
3D view of 1874 Hopkins Map, Somerville, in Google Earth
Teaching & Learning with Google Earth
Geography 2.0Geography 2.0
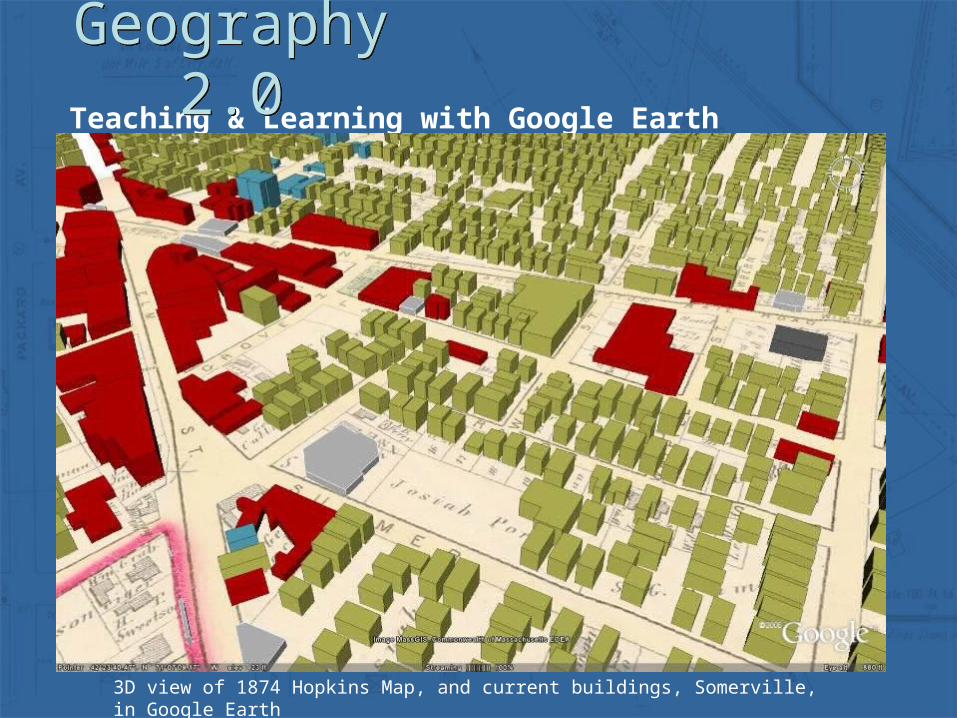
3D view of 1874 Hopkins Map, and current buildings, Somerville, in Google Earth
Teaching & Learning with Google Earth
Geography 2.0Geography 2.0
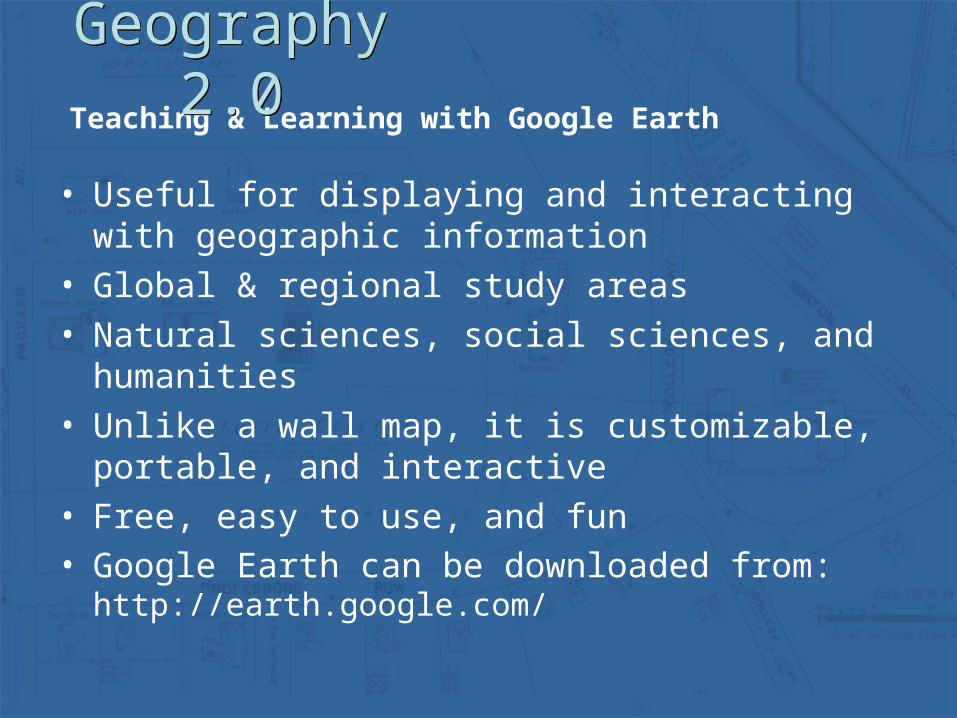
• Useful for displaying and interacting with geographic information
• Global & regional study areas
• Natural sciences, social sciences, and humanities
• Unlike a wall map, it is customizable, portable, and interactive
• Free, easy to use, and fun• Google Earth can be downloaded from:
http://earth.google.com/
For more information about using GIS and spatial tools teaching and research
For more information about using GIS and spatial tools teaching and research
See the GIS Center Web Site:gis.tufts.edu
Or Contact:Patrick Florance
Barbara [email protected]