Embed Size (px)
Citation preview
Journal of Engg. Research Vol. 9 No. (2) June 2021 pp. 336-359 https://doi.org/10.36909/jer.v9i2.9067
Expert solution for effects of input parameters on multiphase flow correlations
Mohamed A. Abd El-Moniem* and Ahmed H. El-Banbi**
*Amal Petroleum Company, Cairo, Egypt**The American University in Cairo, Cairo, Egypt*Corresponding Author: [email protected]
Submitted: 19/11/2019Revised: 10/07/2020Accepted: 17/07/2020
ABSTRACT
Oil and gas production represents an essential source of energy. Optimization of oil and gas production systems requires accurate calculation of pressure drop in tubing and flowlines.
Many empirical correlations and mechanistic models exist to calculate pressure drop in tubing and flowlines. Previous work has shown that some correlations provide more accurate results under certain flow conditions, PVT data, and well configurations than others. However, the effects of errors in input data on the selection of which correlations to use have not been investigated. This paper studies different multiphase flow correlations to determine the effects of their input parameters on (1) the accuracy of calculated pressure drop and (2) the selection of best correlation. A database consisting of 33 oil wells and 32 gas wells was selected, and a commercial software was used to build different well models. A total of 715 well models were constructed and used to investigate the effects of errors in correlations inputs on both the calculated bottomhole pressure and the selection of best correlation(s). The methodology was based on perturbing the values of the selected input parameters and calculating the new predicted bottomhole flowing pressure. Then, the effects of error in input parameters on how the calculated bottomhole pressure was different from observed data were quantified. The effect of this error in input parameters was also checked against the algorithm that selects the best correlation(s).
It was found that errors in input GOR have the greatest effects for oil wells, while gas specific gravity and the tubing roughness are the most effective parameters for gas wells. The results were integrated into a rule-based expert system. A new set of data, consisting of 220 cases from 10 new oil wells and 10 new gas wells, was used to validate the expert system. The expert system was found to predict the best correlation(s) with a success rate of 80%, and it also identifies the input parameters whose error would affect the value of calculated bottomhole pressure significantly. Finally, the rules of the expert system were programmed into a VBA-Code to ease its use.
Keywords: Multiphase Correlations; Data Error; Outflow Performance; Well Modeling; Pressure Drop.
INTRODUCTIONPetroleum engineers work on maintaining oil and gas production from petroleum reservoirs. They also attempt
to provide accurate forecasts for future production profiles and optimize well completion and artificial lift. Nodal analysis is often used for all these purposes. Nodal analysis requires pressure drop calculations in both the production tubing and the flowlines.
337Mohamed A. Abd El-Moniem and Ahmed H. El-Banbi
Many investigators have worked on developing different methods to calculate pressure drop in tubing and pipes. Different correlations and models were developed since the 1930s and until today. The different models used for pressure drop in pipes calculations can be classified into three categories: (1) empirical correlations, (2) mechanistic models, and (3) neural network models.
In empirical correlations, researchers worked on developing different correlations using experimental data coming from either flow loops or actual wells. Three distinct categories of correlations can be identified as follows: (1) correlations that do not consider slippage and flow regimes, such as Fancher and Brown (1963); (2) correlations that consider slippage but not flow regimes, such as Hagedorn and Brown (1964); and (3) correlations that consider both slippage and flow regimes. Examples of the latter include Duns and Ros (1963), Beggs and Brill (1973), and Mukherjee and Brill (1983).
All of these correlations are derived from the general energy equation as follows:
…………………………………………..………….(1)
The different terms of hydrostatics, friction, and acceleration are calculated using different input parameters. The hydrostatic term mainly depends on the production and PVT parameters like GOR, W.C., CGR, WGR, API, and ɣg. The friction term mainly depends on the tubing size and roughness.
Another class of models (mechanistic models) was also used in a trial to improve the models prediction of multiphase pressure drop. These models rely on the use of physics laws and models to more accurately describe the multiphase flow in pipes. Several mechanistic models were published. Aziz et al. (1972) developed a simple mechanistic model for the prediction of pressure drop in oil and gas wells. They developed a new map for the different flow patterns; the model depended on dividing each well into small segments that started from the known well head pressure; then, they calculated the pressure drop at the end of each segment. The model showed good pressure prediction with less error compared to the different empirical correlations. Hasan et al. (1986) developed another model to predict the pressure drop in vertical oil wells only. They developed a new map for flow patterns identification by defining new transition regions between bubble, slug, churn, and annular flow. They used mixture properties between oil and gas to calculate the frictional factor unlike the work by Aziz et al. Moreover, the model gave better pressure drop prediction than Aziz et al. model and different empirical correlations. More improvement in the mechanistic model for the pressure drop and liquid holdup prediction for different flow patterns has been achieved by Ansari et al. (1990) who developed another mechanistic model by defining new transition boundaries between bubble, slug, and annular flow patterns. The model showed a better accuracy for the prediction of pressure drop compared to the different empirical correlations and the mechanistic models developed by Aziz et al. and Hasan et al. Abdul-Majeed et al. (2000) developed a mechanistic model for the calculation of the pressure drop for the upward movement in both vertical and inclined pipes. They worked on the data of two-phase slug flow (1712 cases) since they considered it the dominant flow regime in most producing wells. The error resulting from the model was found to be lower than the error from the previous mentioned mechanistic models and empirical correlations.
Starting in the 2000s and with the aid of computer technology, new methods that use artificial intelligence techniques were investigated. Osman et al. (2001) developed artificial neural network (ANN) model using 199 points to identify flow regimes and calculate the liquid holdup in horizontal pipes. Shippen et al. (2002) used 627 liquid holdup measurements to develop an ANN model for the prediction of liquid holdup and flow patterns in horizontal pipes. Mohammadi (2006) developed ANN model using 2292 data points for predicting liquid holdup that will be used in the pressure drop calculation. Alizadehdake et al. (2009) conducted an experiment to study the flow regimes
Expert solution for effects of input parameters on multiphase flow correlations338
and calculate the pressure drop in both vertical and horizontal pipes. They developed an ANN model that used data from Computational Fluid Dynamics (CFD) simulation to predict the pressure drop. They also compared their model with the experimental results. Al-Shammari (2011) developed a model using fuzzy logic to predict bottomhole flowing pressure in oil wells using 795 data points. Attia et al. (2015) developed two models for flowline and well tubing. They used four artificial intelligence techniques: adaptive-network-based fuzzy inference system (ANFIS), ANN, support vector machine (SVM), and decision tree (DT). They used 239 field data points for the flowline model and 795 for well tubing model. They calculated pressure drop from wellhead to gas oil separation plant (GOSP) for flowline model and from sandface to well head for well tubing model. Abd El-Moniem et al. (2015) collected a large database (3250 bottomhole flowing pressure data points) from 880 oil and gas wells to select the best correlation that gives the lowest error for different flowing conditions. Chen et al. (2017) developed a model based on SVM technique to predict bottomhole flowing pressure for gas wells based on statistical theory. Abd El-Moniem et al. (2018) developed an expert system for selecting the best multiphase flow correlations for oil wells for different flow conditions using 2874 points. The expert system has been validated using a new set of data (144 points), and a Visual Basic Application (VBA) for excel has been developed to automate the selection process of the best correlation for the different flowing conditions and well configuration. El-Kadi et al. (2019) developed an ANN model to predict the pressure drop in different oil and gas fields. They used 7581 points and divided the well into segments to increase the accuracy of the pressure drop prediction. Abd El-Moniem et al. (2020) studied the effect of the different input parameters of the different multiphase flow correlations for gas wells.
In this work, we studied the pressure drop in the tubing from the sandface to the wellhead using a database of actual wells with measured bottomhole flowing pressure for different production conditions, PVT data, and well configurations. The objective is to provide guidelines to identify which input parameters have the highest impact on pressure drop calculations at different flow conditions and well configurations. These guidelines are used to develop a rule-based expert system. The expert system was programmed using VBA-code to facilitate its use.
EXPERT SYSTEM DEVELOPMENT
A large database of bottomhole flowing pressure points from both the literature (e.g., Ashiem (1986), Baxendell and Thomas (1961), Chierici et al. (1974), Hill and Wood (1994), Peffer et al. (1988), and Reinicke et al. (1987)) and actual data from different fields around the world has been collected. The data was collected from pressure measurements performed in either flowing gradient surveys or recorded by permeant downhole pressure gauges. The data covers wells that have natural production or are under gas lift or ESP. Estimation of bottomhole pressure from multiphase flow correlations requires input data that may have some measurement errors or uncertainties. These errors in input data may affect the prediction of bottomhole pressure to variable degrees under different flow conditions and well configurations. The large database gave us the chance to cover wide range of different fluid types, production conditions, and well configurations.
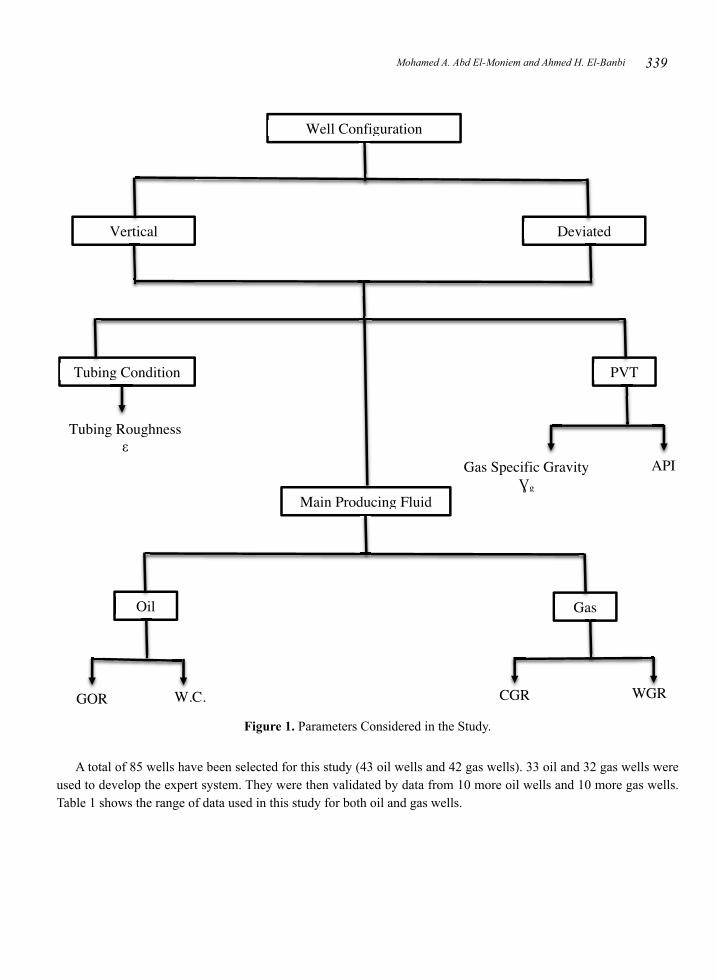
We classified the data according to fluid type into oil and gas, then according to well configuration to vertical or deviated hole. Figure 1 shows a flow chart for the different classifications.
339Mohamed A. Abd El-Moniem and Ahmed H. El-Banbi
Figure 1. Parameters Considered in the Study.
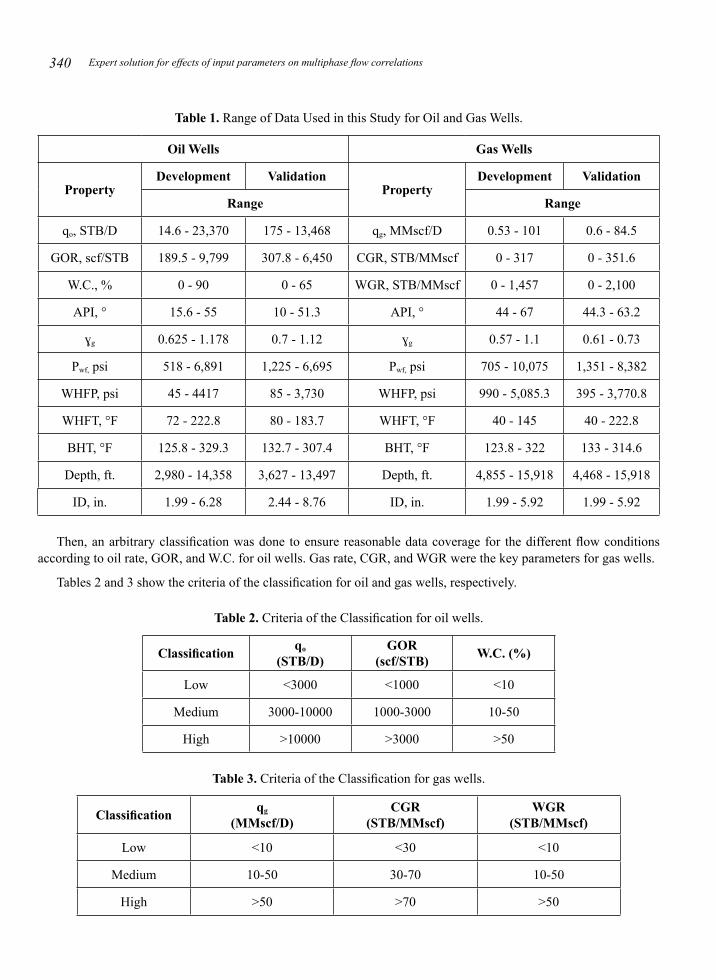
A total of 85 wells have been selected for this study (43 oil wells and 42 gas wells). 33 oil and 32 gas wells were used to develop the expert system. They were then validated by data from 10 more oil wells and 10 more gas wells. Table 1 shows the range of data used in this study for both oil and gas wells.
Expert solution for effects of input parameters on multiphase flow correlations340
Table 1. Range of Data Used in this Study for Oil and Gas Wells.
Oil Wells Gas Wells
Property Development Validation
Property Development Validation
Range Range
qo, STB/D 14.6 - 23,370 175 - 13,468 qg, MMscf/D 0.53 - 101 0.6 - 84.5
GOR, scf/STB 189.5 - 9,799 307.8 - 6,450 CGR, STB/MMscf 0 - 317 0 - 351.6
W.C., % 0 - 90 0 - 65 WGR, STB/MMscf 0 - 1,457 0 - 2,100
API, ° 15.6 - 55 10 - 51.3 API, ° 44 - 67 44.3 - 63.2
ɣg 0.625 - 1.178 0.7 - 1.12 ɣg 0.57 - 1.1 0.61 - 0.73
Pwf, psi 518 - 6,891 1,225 - 6,695 Pwf, psi 705 - 10,075 1,351 - 8,382
WHFP, psi 45 - 4417 85 - 3,730 WHFP, psi 990 - 5,085.3 395 - 3,770.8
WHFT, °F 72 - 222.8 80 - 183.7 WHFT, °F 40 - 145 40 - 222.8
BHT, °F 125.8 - 329.3 132.7 - 307.4 BHT, °F 123.8 - 322 133 - 314.6
Depth, ft. 2,980 - 14,358 3,627 - 13,497 Depth, ft. 4,855 - 15,918 4,468 - 15,918
ID, in. 1.99 - 6.28 2.44 - 8.76 ID, in. 1.99 - 5.92 1.99 - 5.92
Then, an arbitrary classification was done to ensure reasonable data coverage for the different flow conditions according to oil rate, GOR, and W.C. for oil wells. Gas rate, CGR, and WGR were the key parameters for gas wells.
Tables 2 and 3 show the criteria of the classification for oil and gas wells, respectively.
Table 2. Criteria of the Classification for oil wells.
Classification qo (STB/D)
GOR(scf/STB) W.C. (%)
Low <3000 <1000 <10
Medium 3000-10000 1000-3000 10-50
High >10000 >3000 >50
Table 3. Criteria of the Classification for gas wells.
Classification qg
(MMscf/D)CGR
(STB/MMscf)WGR
(STB/MMscf)
Low <10 <30 <10
Medium 10-50 30-70 10-50
High >50 >70 >50
341Mohamed A. Abd El-Moniem and Ahmed H. El-Banbi
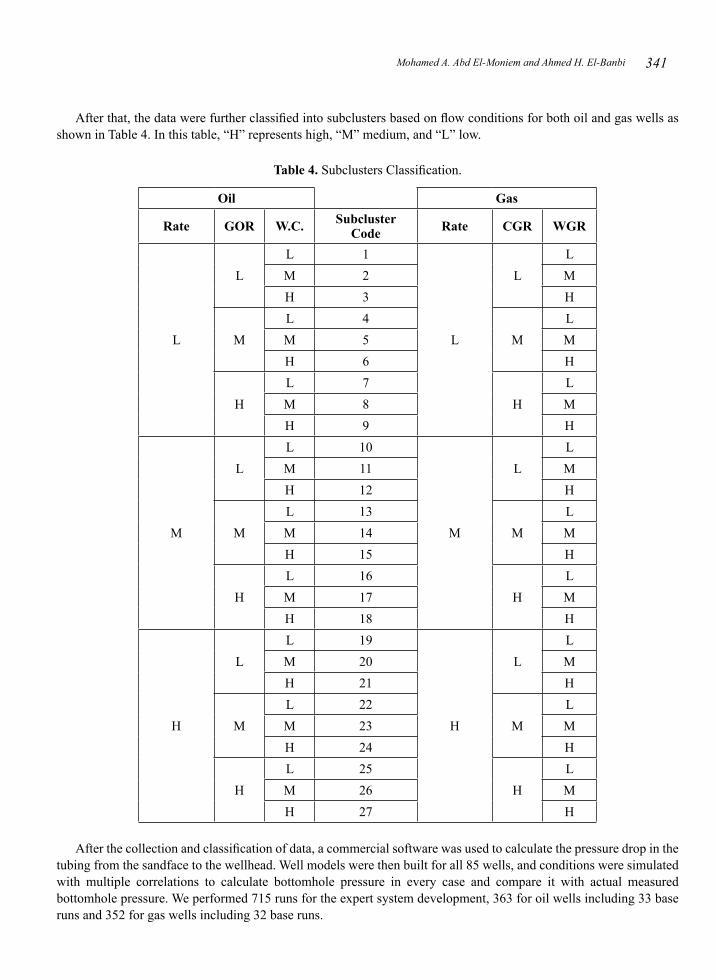
After that, the data were further classified into subclusters based on flow conditions for both oil and gas wells as shown in Table 4. In this table, “H” represents high, “M” medium, and “L” low.
Table 4. Subclusters Classification.
Oil Gas
Rate GOR W.C. Subcluster Code Rate CGR WGR
L
LL 1
L
LL
M 2 MH 3 H
ML 4
ML
M 5 MH 6 H
HL 7
HL
M 8 MH 9 H
M
LL 10
M
LL
M 11 MH 12 H
ML 13
ML
M 14 MH 15 H
HL 16
HL
M 17 MH 18 H
H
LL 19
H
LL
M 20 MH 21 H
ML 22
ML
M 23 MH 24 H
HL 25
HL
M 26 MH 27 H
After the collection and classification of data, a commercial software was used to calculate the pressure drop in the tubing from the sandface to the wellhead. Well models were then built for all 85 wells, and conditions were simulated with multiple correlations to calculate bottomhole pressure in every case and compare it with actual measured bottomhole pressure. We performed 715 runs for the expert system development, 363 for oil wells including 33 base runs and 352 for gas wells including 32 base runs.
Expert solution for effects of input parameters on multiphase flow correlations342
We determined the predicted pressure using the available fourteen different multiphase flow correlations in the software and then calculated the error resulting from each correlation using
………………………………..……...……. (2)
After finishing the calculations of the error resulting from comparing the actual data with the calculated bottomhole pressure from different correlations, we moved to study the effect of some input parameters on the pressure drop calculations. We selected GOR, W.C., API, gas specific gravity, and tubing roughness for oil wells and CGR, WGR, API, gas specific gravity, and tubing roughness for gas wells. These parameters usually have measurements uncertainty and are believed to be the most influential on correlations calculations (Abd El-Moniem et al., 2018).
The idea for this study stems from the fact that many engineers prepare the above input data for multiphase correlations calculations without recognizing their uncertainty on the calculated results. The study should reveal which input parameters are the most influential on the calculated bottomhole pressure for different flow conditions and well configurations.
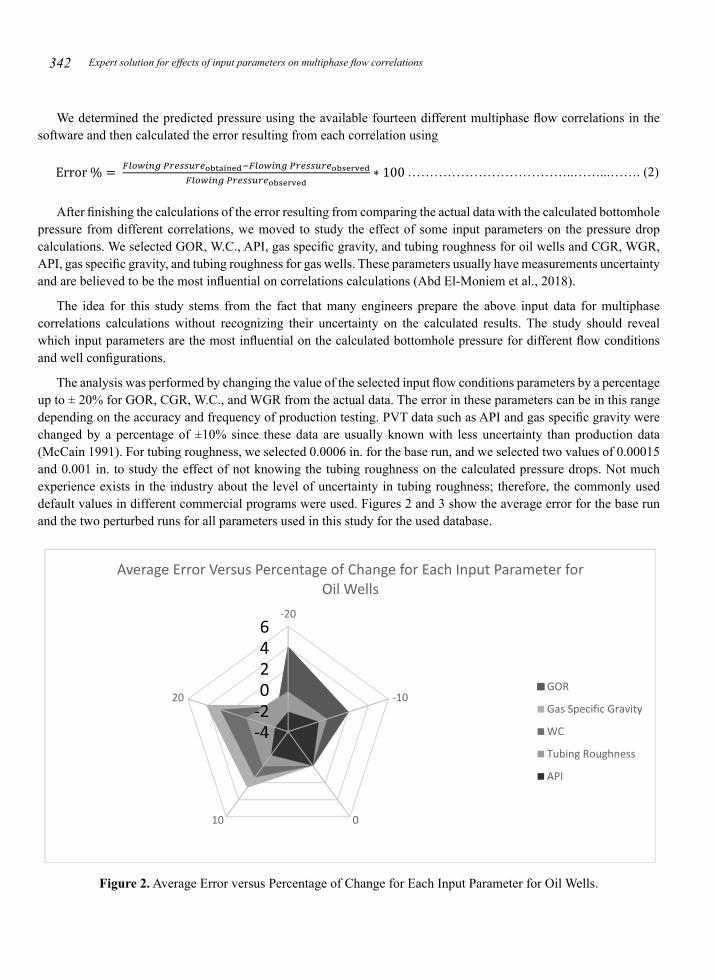
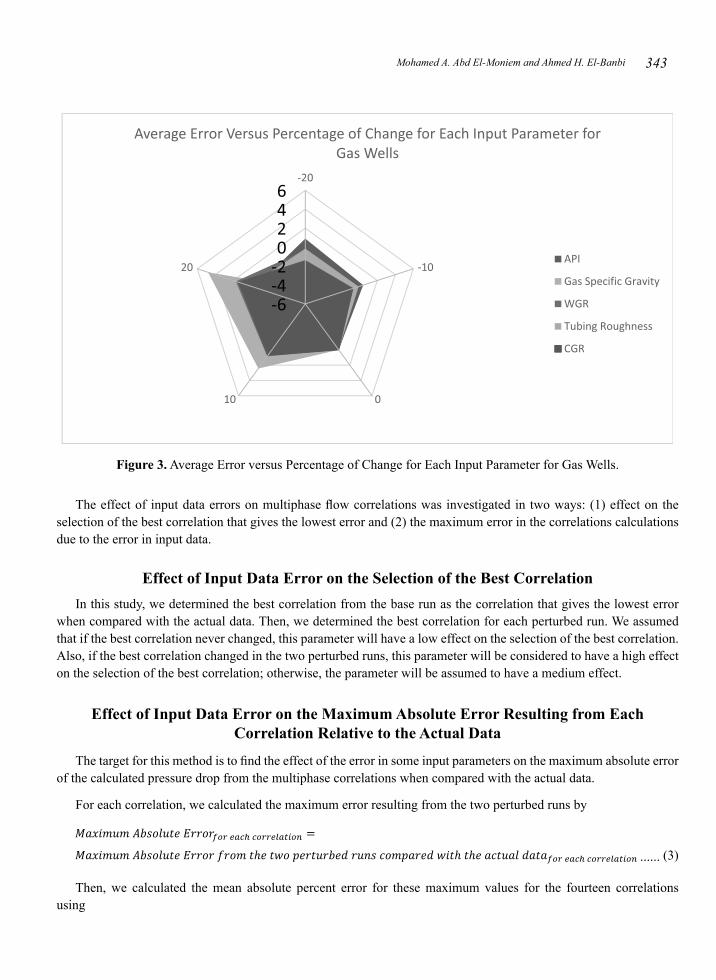
The analysis was performed by changing the value of the selected input flow conditions parameters by a percentage up to ± 20% for GOR, CGR, W.C., and WGR from the actual data. The error in these parameters can be in this range depending on the accuracy and frequency of production testing. PVT data such as API and gas specific gravity were changed by a percentage of ±10% since these data are usually known with less uncertainty than production data (McCain 1991). For tubing roughness, we selected 0.0006 in. for the base run, and we selected two values of 0.00015 and 0.001 in. to study the effect of not knowing the tubing roughness on the calculated pressure drops. Not much experience exists in the industry about the level of uncertainty in tubing roughness; therefore, the commonly used default values in different commercial programs were used. Figures 2 and 3 show the average error for the base run and the two perturbed runs for all parameters used in this study for the used database.
Figure 2. Average Error versus Percentage of Change for Each Input Parameter for Oil Wells.
343Mohamed A. Abd El-Moniem and Ahmed H. El-Banbi
Figure 3. Average Error versus Percentage of Change for Each Input Parameter for Gas Wells.
The effect of input data errors on multiphase flow correlations was investigated in two ways: (1) effect on the selection of the best correlation that gives the lowest error and (2) the maximum error in the correlations calculations due to the error in input data.
Effect of Input Data Error on the Selection of the Best CorrelationIn this study, we determined the best correlation from the base run as the correlation that gives the lowest error
when compared with the actual data. Then, we determined the best correlation for each perturbed run. We assumed that if the best correlation never changed, this parameter will have a low effect on the selection of the best correlation. Also, if the best correlation changed in the two perturbed runs, this parameter will be considered to have a high effect on the selection of the best correlation; otherwise, the parameter will be assumed to have a medium effect.
Effect of Input Data Error on the Maximum Absolute Error Resulting from Each Correlation Relative to the Actual Data
The target for this method is to find the effect of the error in some input parameters on the maximum absolute error of the calculated pressure drop from the multiphase correlations when compared with the actual data.
For each correlation, we calculated the maximum error resulting from the two perturbed runs by
...... (3)
Then, we calculated the mean absolute percent error for these maximum values for the fourteen correlations using
Expert solution for effects of input parameters on multiphase flow correlations344
……………………………………………..…………..……… (4)
Then, we calculated the MAPE2 for the errors resulting from the fourteen correlations of the base run by
……………………………………..…………….…………..…………. (5)
The qualitative indicator for the relative error was calculated to study the effect of the input parameters on the maximum error calculated from the 14 different correlations by
……………………………………..……………….……….……….…….…………..…………. (6)
We assumed that if RE is less than 1.1, the input data parameter will be considered to have a low effect on the calculated pressure, and if RE is higher than 1.2, this parameter will be considered to have high effect. Otherwise, it will be considered to have a medium effect.
Finally, the average values between the two methods were calculated to help visualize the effects of different input parameters on calculated bottomhole pressure. A color code was also assigned to quickly reveal which input parameters have the highest effect in different flow conditions and well configurations. The high, medium, and low effects are shown by red, orange, and green colors, respectively.
RESULTSThe target was to study the effect of different input parameters of production, PVT data, and tubing roughness. We
could obtain the results after applying the two methods mentioned above. We separate the results of the vertical wells to compare them with the others from deviated wells. This step helped us in studying the effect of the deviation as a secondary parameter in addition to the main input parameters.
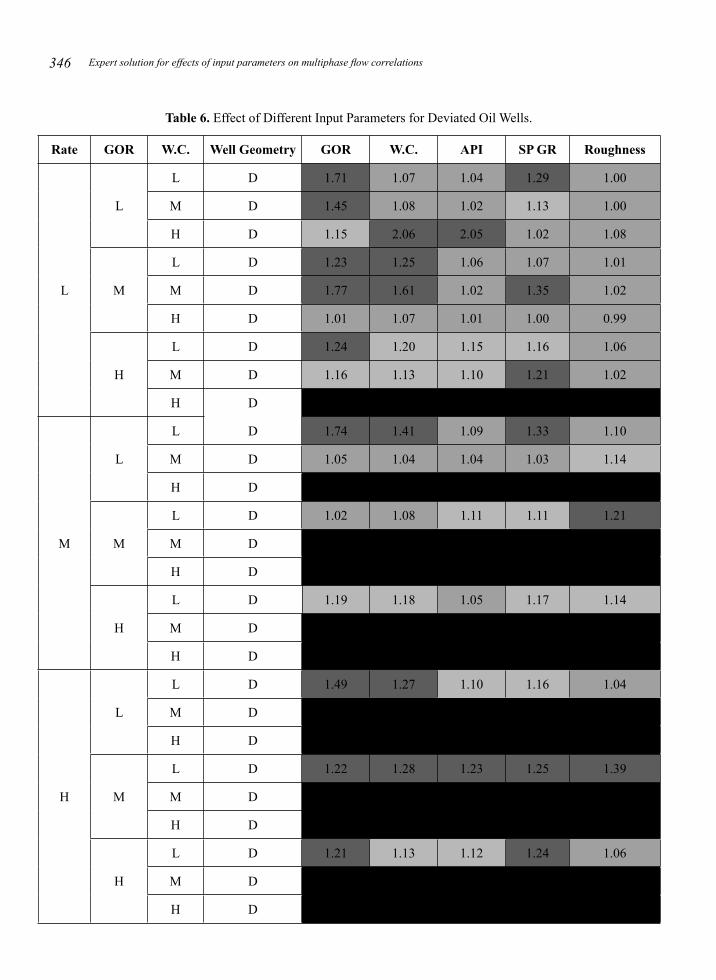
Oil WellsTables 5 and 6 show the results of the effect of error in different input parameters for vertical and deviated oil wells.
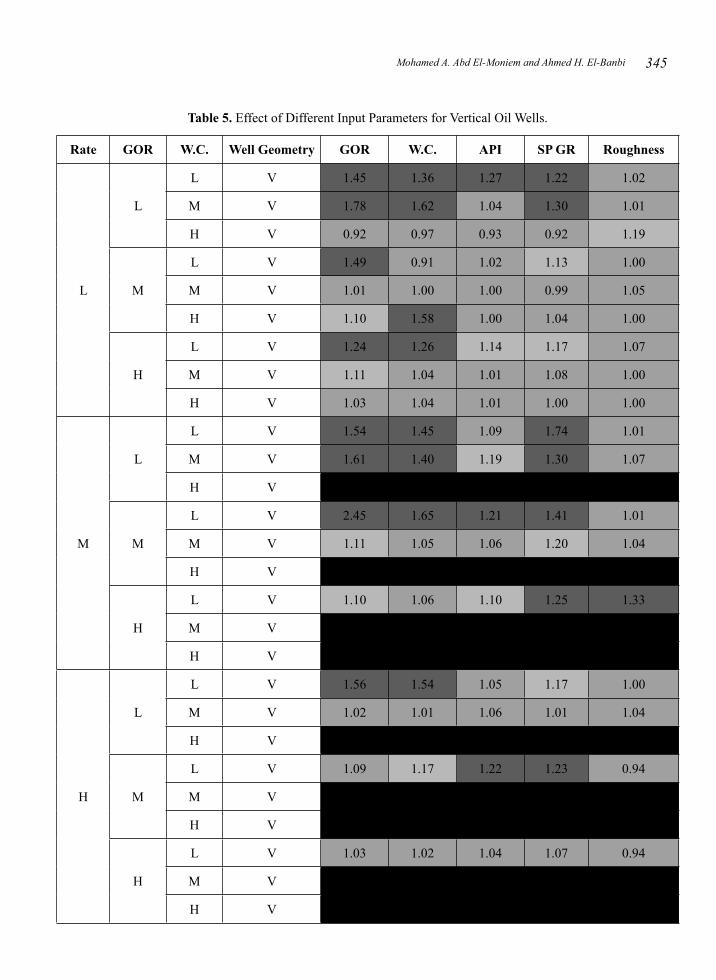
345Mohamed A. Abd El-Moniem and Ahmed H. El-Banbi
Table 5. Effect of Different Input Parameters for Vertical Oil Wells.
Rate GOR W.C. Well Geometry GOR W.C. API SP GR Roughness
L
L
L V 1.45 1.36 1.27 1.22 1.02
M V 1.78 1.62 1.04 1.30 1.01
H V 0.92 0.97 0.93 0.92 1.19
M
L V 1.49 0.91 1.02 1.13 1.00
M V 1.01 1.00 1.00 0.99 1.05
H V 1.10 1.58 1.00 1.04 1.00
H
L V 1.24 1.26 1.14 1.17 1.07
M V 1.11 1.04 1.01 1.08 1.00
H V 1.03 1.04 1.01 1.00 1.00
M
L
L V 1.54 1.45 1.09 1.74 1.01
M V 1.61 1.40 1.19 1.30 1.07
H V 0.00 0.00 0.00 0.00 0.00
M
L V 2.45 1.65 1.21 1.41 1.01
M V 1.11 1.05 1.06 1.20 1.04
H V 0.00 0.00 0.00 0.00 0.00
H
L V 1.10 1.06 1.10 1.25 1.33
M V 0.0 0.0 0.0 0.0 0.0
H V
H
L
L V 1.56 1.54 1.05 1.17 1.00
M V 1.02 1.01 1.06 1.01 1.04
H V 0.00 0.00 0.00 0.00 0.00
M
L V 1.09 1.17 1.22 1.23 0.94
M V 0.00 0.00 0.00 0.00 0.00
H V 0.00 0.00 0.00 0.00 0.00
H
L V 1.03 1.02 1.04 1.07 0.94
M V
H V
Expert solution for effects of input parameters on multiphase flow correlations346
Table 6. Effect of Different Input Parameters for Deviated Oil Wells.
Rate GOR W.C. Well Geometry GOR W.C. API SP GR Roughness
L
L
L D 1.71 1.07 1.04 1.29 1.00
M D 1.45 1.08 1.02 1.13 1.00
H D 1.15 2.06 2.05 1.02 1.08
M
L D 1.23 1.25 1.06 1.07 1.01
M D 1.77 1.61 1.02 1.35 1.02
H D 1.01 1.07 1.01 1.00 0.99
H
L D 1.24 1.20 1.15 1.16 1.06
M D 1.16 1.13 1.10 1.21 1.02
H D
M
L
L D 1.74 1.41 1.09 1.33 1.10
M D 1.05 1.04 1.04 1.03 1.14
H D 0.00 0.00 0.00 0.00 0.00
M
L D 1.02 1.08 1.11 1.11 1.21
M D 0.00 0.00 0.00 0.00 0.00
H D 0.00 0.00 0.00 0.00 0.00
H
L D 1.19 1.18 1.05 1.17 1.14
M D
H D
H
L
L D 1.49 1.27 1.10 1.16 1.04
M D 0.00 0.00 0.00 0.00 0.00
H D 0.00 0.00 0.00 0.00 0.00
M
L D 1.22 1.28 1.23 1.25 1.39
M D 0.00 0.00 0.00 0.00 0.00
H D 0.00 0.00 0.00 0.00 0.00
H
L D 1.21 1.13 1.12 1.24 1.06
M D
H D
347Mohamed A. Abd El-Moniem and Ahmed H. El-Banbi
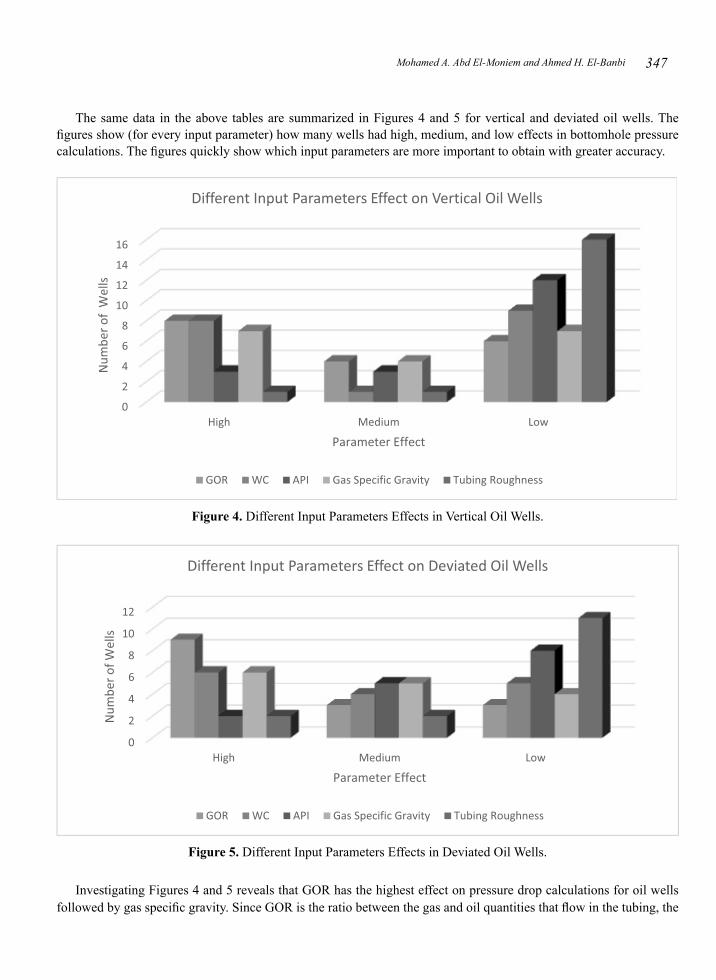
The same data in the above tables are summarized in Figures 4 and 5 for vertical and deviated oil wells. The figures show (for every input parameter) how many wells had high, medium, and low effects in bottomhole pressure calculations. The figures quickly show which input parameters are more important to obtain with greater accuracy.
Figure 4. Different Input Parameters Effects in Vertical Oil Wells.
Figure 5. Different Input Parameters Effects in Deviated Oil Wells.
Investigating Figures 4 and 5 reveals that GOR has the highest effect on pressure drop calculations for oil wells followed by gas specific gravity. Since GOR is the ratio between the gas and oil quantities that flow in the tubing, the
Expert solution for effects of input parameters on multiphase flow correlations348
superficial velocities of oil and gas are responsible for the different flow patterns that are used in the pressure drop calculations of the hydrostatic term for oil wells.
We found that, for high flow rate wells with high and medium GOR, well deviation increases the effect of GOR in the pressure drop calculations. Generally, GOR has a high to medium effect except for vertical wells with low flow rates and high W.C.
W.C. has medium to low effect, and well deviation exaggerates the effect of W.C. in most cases of low flow rates. This could be explained by the following: (1) the effect of water appears with oil in the liquid term for the calculation of the liquid holdup, and (2) the gas slippage and change of the flow patterns are affected by the presence of gas, and they are considered the most influential parameters in the calculation of pressure drop. Therefore, W.C. has medium to low effect following the GOR effect.
The error in API has low effect in most cases, but its effect increases to medium effect in some cases of deviated wells with medium and high flow rates. Gas specific gravity error has medium to high effect, but it decreases to low effect for wells with low flow rates with medium and high W.C. and GOR. The high effect of densities represented in gas specific gravity compared to API also confirms the explanation of the significant effect of the gas and its related properties in the calculation of the pressure drop.
Finally, the error in tubing roughness has low effect but can have medium effect in some cases of medium flow rate with low W.C.
For deviated wells, it was found that well deviation increases the effects of GOR, W.C., and gas specific gravity (Ɣg) on the pressure drop calculations, especially for high flow rate wells. This could be explained by changing flow patterns due to the gas slippage, which in turn affects the pressure drop calculations.
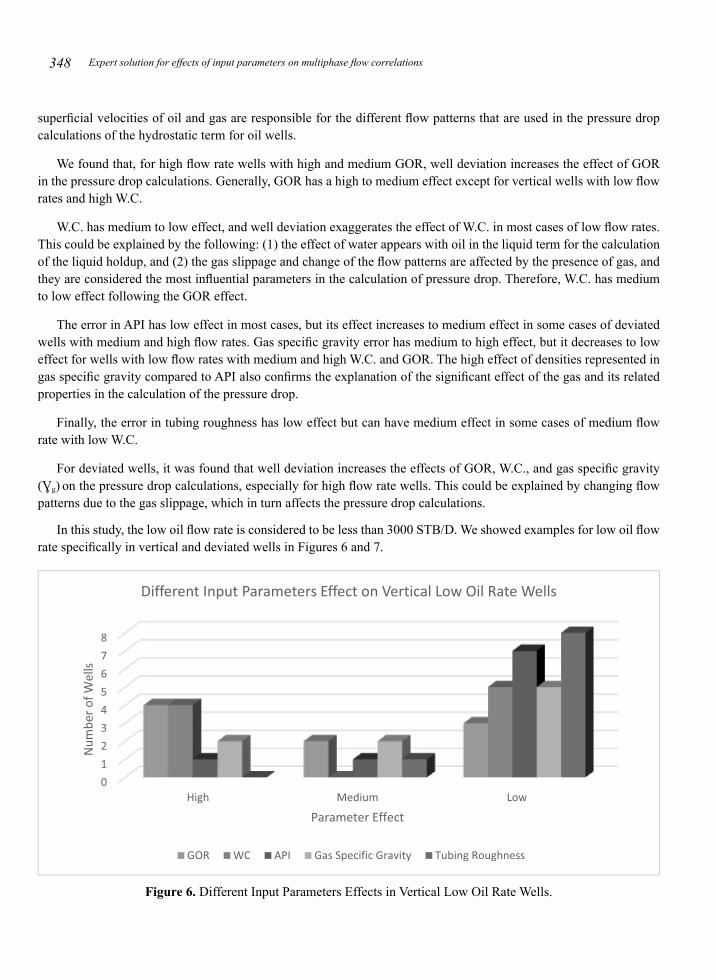
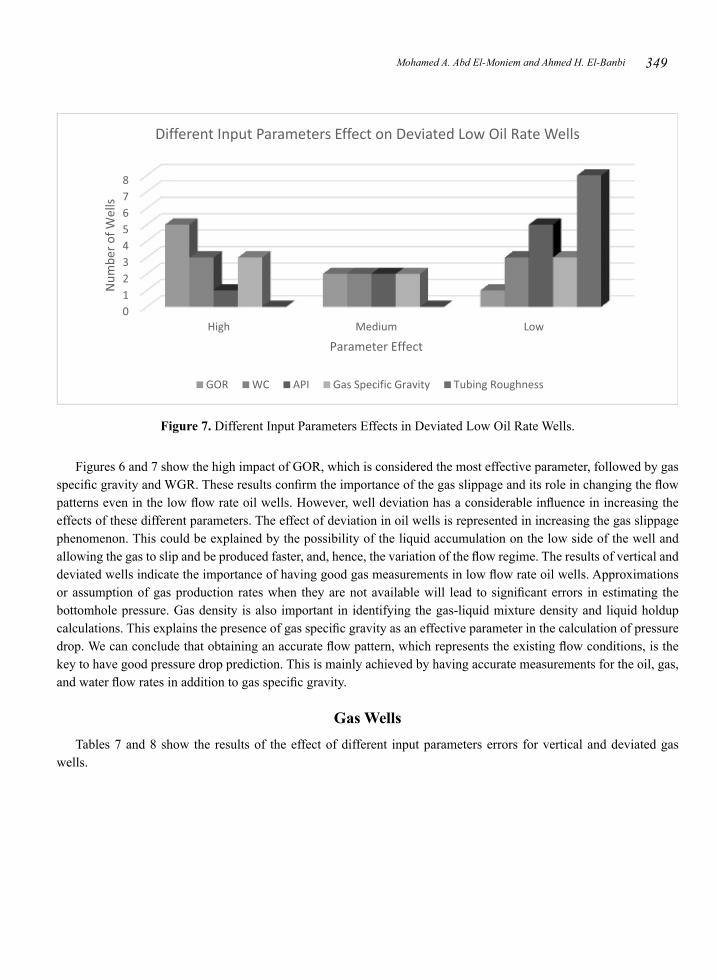
In this study, the low oil flow rate is considered to be less than 3000 STB/D. We showed examples for low oil flow rate specifically in vertical and deviated wells in Figures 6 and 7.
Figure 6. Different Input Parameters Effects in Vertical Low Oil Rate Wells.
349Mohamed A. Abd El-Moniem and Ahmed H. El-Banbi
Figure 7. Different Input Parameters Effects in Deviated Low Oil Rate Wells.
Figures 6 and 7 show the high impact of GOR, which is considered the most effective parameter, followed by gas specific gravity and WGR. These results confirm the importance of the gas slippage and its role in changing the flow patterns even in the low flow rate oil wells. However, well deviation has a considerable influence in increasing the effects of these different parameters. The effect of deviation in oil wells is represented in increasing the gas slippage phenomenon. This could be explained by the possibility of the liquid accumulation on the low side of the well and allowing the gas to slip and be produced faster, and, hence, the variation of the flow regime. The results of vertical and deviated wells indicate the importance of having good gas measurements in low flow rate oil wells. Approximations or assumption of gas production rates when they are not available will lead to significant errors in estimating the bottomhole pressure. Gas density is also important in identifying the gas-liquid mixture density and liquid holdup calculations. This explains the presence of gas specific gravity as an effective parameter in the calculation of pressure drop. We can conclude that obtaining an accurate flow pattern, which represents the existing flow conditions, is the key to have good pressure drop prediction. This is mainly achieved by having accurate measurements for the oil, gas, and water flow rates in addition to gas specific gravity.
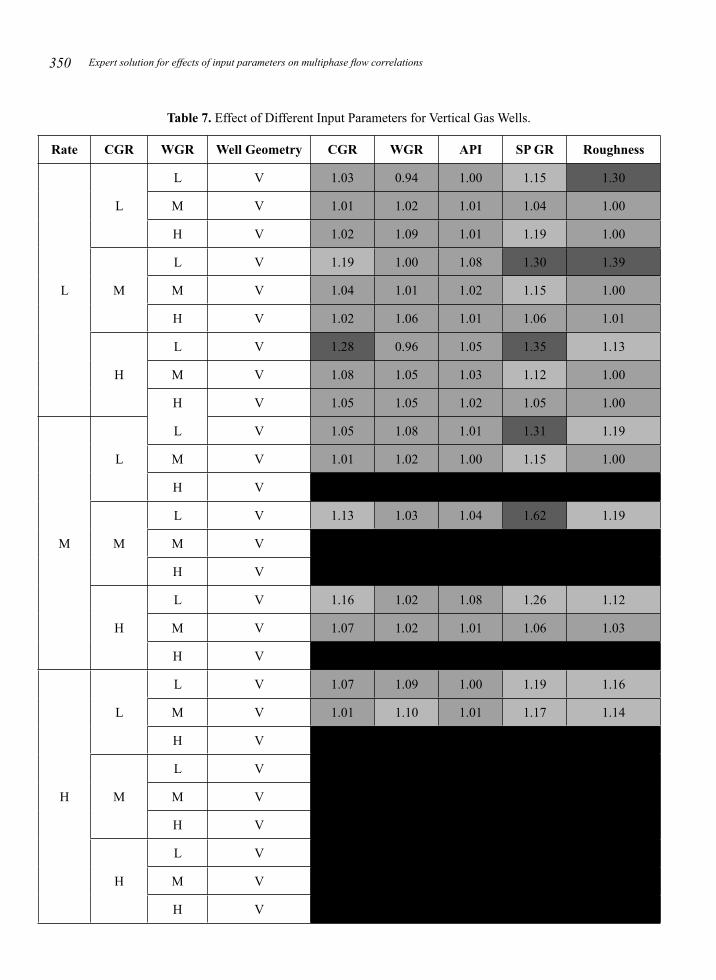
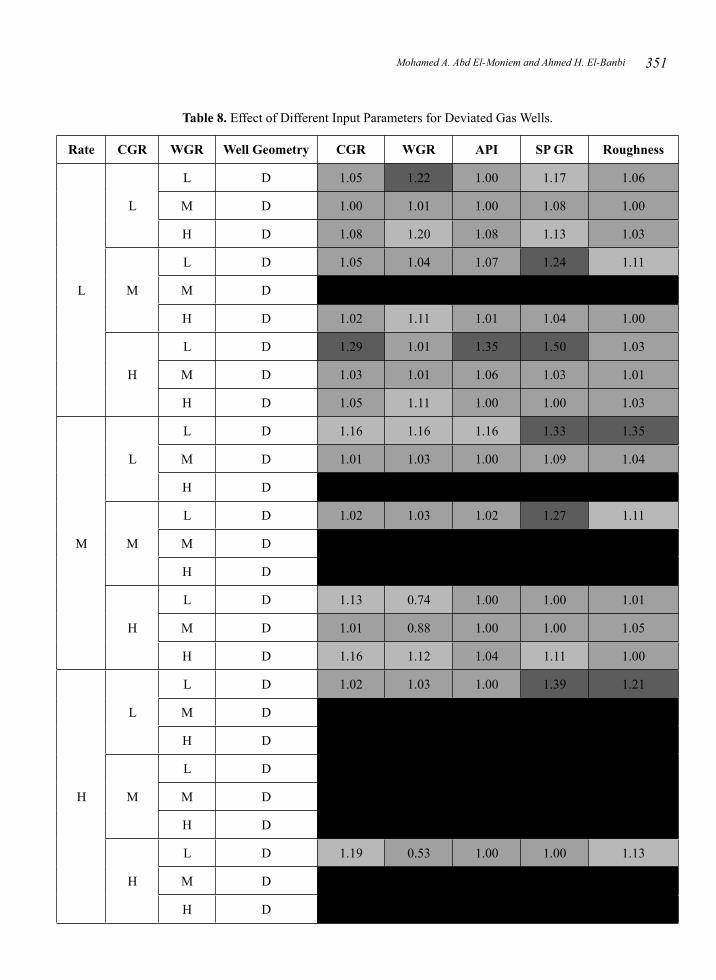
Gas WellsTables 7 and 8 show the results of the effect of different input parameters errors for vertical and deviated gas
wells.
Expert solution for effects of input parameters on multiphase flow correlations350
Table 7. Effect of Different Input Parameters for Vertical Gas Wells.
Rate CGR WGR Well Geometry CGR WGR API SP GR Roughness
L
L
L V 1.03 0.94 1.00 1.15 1.30
M V 1.01 1.02 1.01 1.04 1.00
H V 1.02 1.09 1.01 1.19 1.00
M
L V 1.19 1.00 1.08 1.30 1.39
M V 1.04 1.01 1.02 1.15 1.00
H V 1.02 1.06 1.01 1.06 1.01
H
L V 1.28 0.96 1.05 1.35 1.13
M V 1.08 1.05 1.03 1.12 1.00
H V 1.05 1.05 1.02 1.05 1.00
M
L
L V 1.05 1.08 1.01 1.31 1.19
M V 1.01 1.02 1.00 1.15 1.00
H V 0.00 0.00 0.00 0.00 0.00
M
L V 1.13 1.03 1.04 1.62 1.19
M V 0.00 0.00 0.00 0.00 0.00
H V 0.00 0.00 0.00 0.00 0.00
H
L V 1.16 1.02 1.08 1.26 1.12
M V 1.07 1.02 1.01 1.06 1.03
H V
H
L
L V 1.07 1.09 1.00 1.19 1.16
M V 1.01 1.10 1.01 1.17 1.14
H V
M
L V
M V
H V
H
L V
M V
H V
351Mohamed A. Abd El-Moniem and Ahmed H. El-Banbi
Table 8. Effect of Different Input Parameters for Deviated Gas Wells.
Rate CGR WGR Well Geometry CGR WGR API SP GR Roughness
L
L
L D 1.05 1.22 1.00 1.17 1.06
M D 1.00 1.01 1.00 1.08 1.00
H D 1.08 1.20 1.08 1.13 1.03
M
L D 1.05 1.04 1.07 1.24 1.11
M D 0.00 0.00 0.00 0.00 0.00
H D 1.02 1.11 1.01 1.04 1.00
H
L D 1.29 1.01 1.35 1.50 1.03
M D 1.03 1.01 1.06 1.03 1.01
H D 1.05 1.11 1.00 1.00 1.03
M
L
L D 1.16 1.16 1.16 1.33 1.35
M D 1.01 1.03 1.00 1.09 1.04
H D 0.00 0.00 0.00 0.00 0.00
M
L D 1.02 1.03 1.02 1.27 1.11
M D 0.00 0.00 0.00 0.00 0.00
H D 0.00 0.00 0.00 0.00 0.00
H
L D 1.13 0.74 1.00 1.00 1.01
M D 1.01 0.88 1.00 1.00 1.05
H D 1.16 1.12 1.04 1.11 1.00
H
L
L D 1.02 1.03 1.00 1.39 1.21
M D 0.00 0.00 0.00 0.00 0.00
H D 0.00 0.00 0.00 0.00 0.00
M
L D 0.00 0.00 0.00 0.00 0.00
M D 0.00 0.00 0.00 0.00 0.00
H D 0.00 0.00 0.00 0.00 0.00
H
L D 1.19 0.53 1.00 1.00 1.13
M D
H D
Expert solution for effects of input parameters on multiphase flow correlations352
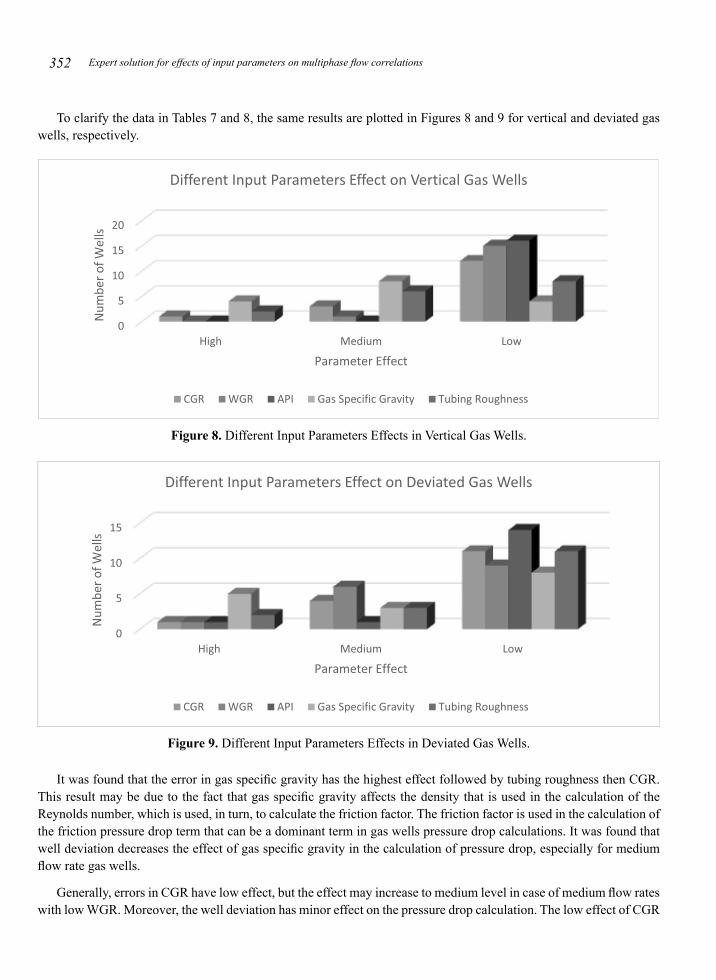
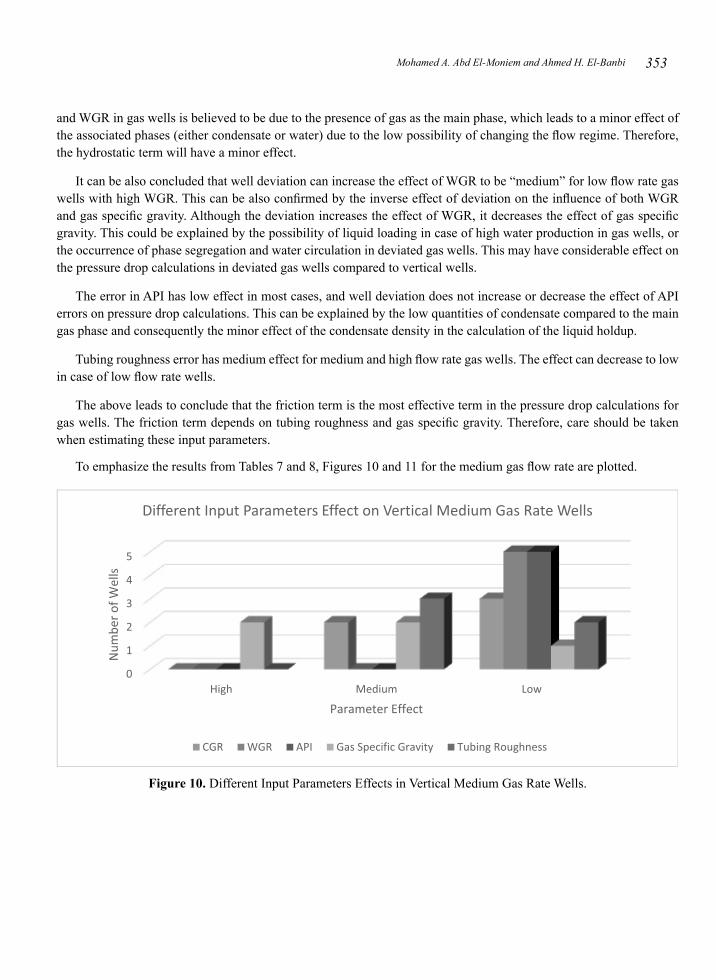
To clarify the data in Tables 7 and 8, the same results are plotted in Figures 8 and 9 for vertical and deviated gas wells, respectively.
Figure 8. Different Input Parameters Effects in Vertical Gas Wells.
Figure 9. Different Input Parameters Effects in Deviated Gas Wells.
It was found that the error in gas specific gravity has the highest effect followed by tubing roughness then CGR. This result may be due to the fact that gas specific gravity affects the density that is used in the calculation of the Reynolds number, which is used, in turn, to calculate the friction factor. The friction factor is used in the calculation of the friction pressure drop term that can be a dominant term in gas wells pressure drop calculations. It was found that well deviation decreases the effect of gas specific gravity in the calculation of pressure drop, especially for medium flow rate gas wells.
Generally, errors in CGR have low effect, but the effect may increase to medium level in case of medium flow rates with low WGR. Moreover, the well deviation has minor effect on the pressure drop calculation. The low effect of CGR
353Mohamed A. Abd El-Moniem and Ahmed H. El-Banbi
and WGR in gas wells is believed to be due to the presence of gas as the main phase, which leads to a minor effect of the associated phases (either condensate or water) due to the low possibility of changing the flow regime. Therefore, the hydrostatic term will have a minor effect.
It can be also concluded that well deviation can increase the effect of WGR to be “medium” for low flow rate gas wells with high WGR. This can be also confirmed by the inverse effect of deviation on the influence of both WGR and gas specific gravity. Although the deviation increases the effect of WGR, it decreases the effect of gas specific gravity. This could be explained by the possibility of liquid loading in case of high water production in gas wells, or the occurrence of phase segregation and water circulation in deviated gas wells. This may have considerable effect on the pressure drop calculations in deviated gas wells compared to vertical wells.
The error in API has low effect in most cases, and well deviation does not increase or decrease the effect of API errors on pressure drop calculations. This can be explained by the low quantities of condensate compared to the main gas phase and consequently the minor effect of the condensate density in the calculation of the liquid holdup.
Tubing roughness error has medium effect for medium and high flow rate gas wells. The effect can decrease to low in case of low flow rate wells.
The above leads to conclude that the friction term is the most effective term in the pressure drop calculations for gas wells. The friction term depends on tubing roughness and gas specific gravity. Therefore, care should be taken when estimating these input parameters.
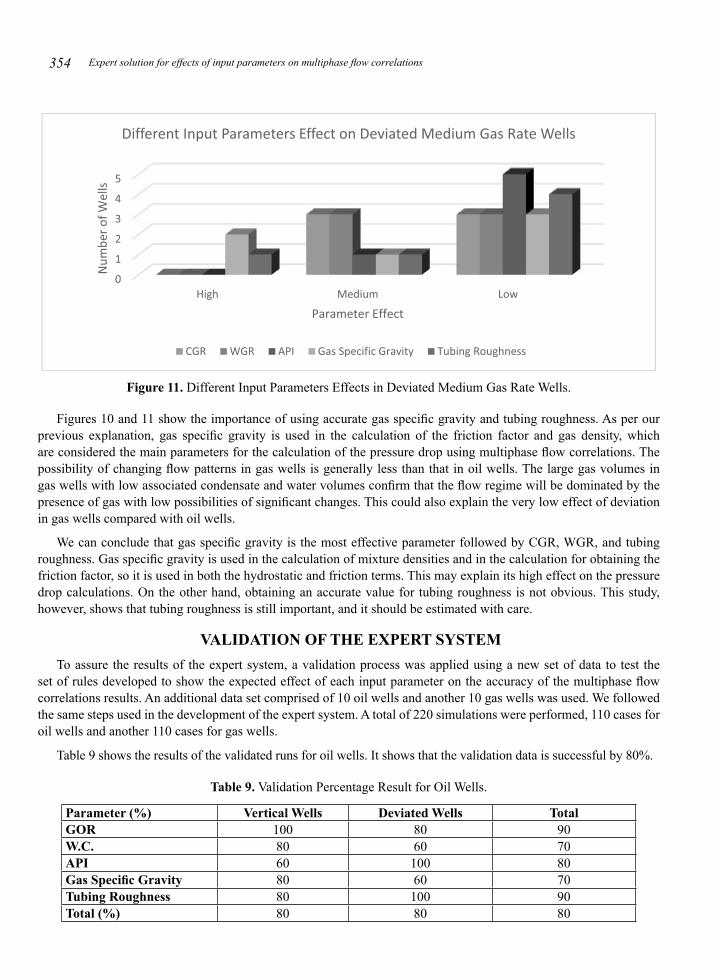
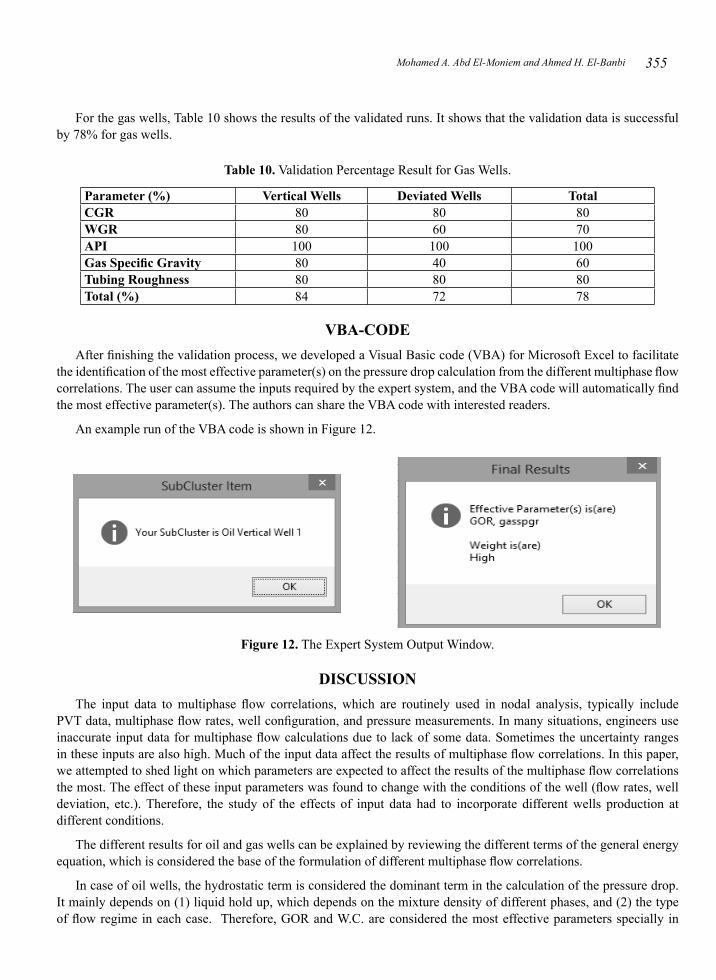
To emphasize the results from Tables 7 and 8, Figures 10 and 11 for the medium gas flow rate are plotted.
Figure 10. Different Input Parameters Effects in Vertical Medium Gas Rate Wells.
Expert solution for effects of input parameters on multiphase flow correlations354
Figure 11. Different Input Parameters Effects in Deviated Medium Gas Rate Wells.
Figures 10 and 11 show the importance of using accurate gas specific gravity and tubing roughness. As per our previous explanation, gas specific gravity is used in the calculation of the friction factor and gas density, which are considered the main parameters for the calculation of the pressure drop using multiphase flow correlations. The possibility of changing flow patterns in gas wells is generally less than that in oil wells. The large gas volumes in gas wells with low associated condensate and water volumes confirm that the flow regime will be dominated by the presence of gas with low possibilities of significant changes. This could also explain the very low effect of deviation in gas wells compared with oil wells.
We can conclude that gas specific gravity is the most effective parameter followed by CGR, WGR, and tubing roughness. Gas specific gravity is used in the calculation of mixture densities and in the calculation for obtaining the friction factor, so it is used in both the hydrostatic and friction terms. This may explain its high effect on the pressure drop calculations. On the other hand, obtaining an accurate value for tubing roughness is not obvious. This study, however, shows that tubing roughness is still important, and it should be estimated with care.
VALIDATION OF THE EXPERT SYSTEMTo assure the results of the expert system, a validation process was applied using a new set of data to test the
set of rules developed to show the expected effect of each input parameter on the accuracy of the multiphase flow correlations results. An additional data set comprised of 10 oil wells and another 10 gas wells was used. We followed the same steps used in the development of the expert system. A total of 220 simulations were performed, 110 cases for oil wells and another 110 cases for gas wells.
Table 9 shows the results of the validated runs for oil wells. It shows that the validation data is successful by 80%.
Table 9. Validation Percentage Result for Oil Wells.
Parameter (%) Vertical Wells Deviated Wells TotalGOR 100 80 90W.C. 80 60 70API 60 100 80Gas Specific Gravity 80 60 70Tubing Roughness 80 100 90Total (%) 80 80 80
355Mohamed A. Abd El-Moniem and Ahmed H. El-Banbi
For the gas wells, Table 10 shows the results of the validated runs. It shows that the validation data is successful by 78% for gas wells.
Table 10. Validation Percentage Result for Gas Wells.
Parameter (%) Vertical Wells Deviated Wells TotalCGR 80 80 80WGR 80 60 70API 100 100 100Gas Specific Gravity 80 40 60Tubing Roughness 80 80 80Total (%) 84 72 78
VBA-CODEAfter finishing the validation process, we developed a Visual Basic code (VBA) for Microsoft Excel to facilitate
the identification of the most effective parameter(s) on the pressure drop calculation from the different multiphase flow correlations. The user can assume the inputs required by the expert system, and the VBA code will automatically find the most effective parameter(s). The authors can share the VBA code with interested readers.
An example run of the VBA code is shown in Figure 12.
Figure 12. The Expert System Output Window.
DISCUSSIONThe input data to multiphase flow correlations, which are routinely used in nodal analysis, typically include
PVT data, multiphase flow rates, well configuration, and pressure measurements. In many situations, engineers use inaccurate input data for multiphase flow calculations due to lack of some data. Sometimes the uncertainty ranges in these inputs are also high. Much of the input data affect the results of multiphase flow correlations. In this paper, we attempted to shed light on which parameters are expected to affect the results of the multiphase flow correlations the most. The effect of these input parameters was found to change with the conditions of the well (flow rates, well deviation, etc.). Therefore, the study of the effects of input data had to incorporate different wells production at different conditions.
The different results for oil and gas wells can be explained by reviewing the different terms of the general energy equation, which is considered the base of the formulation of different multiphase flow correlations.
In case of oil wells, the hydrostatic term is considered the dominant term in the calculation of the pressure drop. It mainly depends on (1) liquid hold up, which depends on the mixture density of different phases, and (2) the type of flow regime in each case. Therefore, GOR and W.C. are considered the most effective parameters specially in
Expert solution for effects of input parameters on multiphase flow correlations356
identifying the different flow patterns due to the slippage phenomenon between gas and liquid. Gas specific gravity, which represents the density of gas, has significant effect compared to API, which represents the density of oil. This also proves the importance of gas phase in the calculation of the mixture density. Unlike oil wells, the tubing roughness has a direct relation in the calculation of the friction term, which is believed to be the most effective in gas wells.
If any input parameter has measurement uncertainty, it will not only affect the accuracy of the predicted pressure drop, but affect the production forecast from nodal analysis as well. This may affect production plans or strategies in the future. The results in this paper can help petroleum engineers improve their understanding of the most important input parameters at different flow conditions and well configurations.
The effect of errors in input data was quantified for many cases, and the results were presented in the tables. A rule-based expert system was also developed to show for certain conditions which input parameters are the most important in affecting the results of the correlations. The results of the correlations were always measured against real data. We see that it is important for practicing engineers that they use the tables of this paper (or the expert system) to identify which input parameters will affect the results of the multiphase flow correlations, and whether the effects will be high, medium, or low. Then, the engineer can both assess the uncertainty of input parameters and can also focus on trying to obtain accurate values for these input parameters with high effect on results. The authors welcome sharing the VBA-code with interested readers.
CONCLUSIONSThis work presents a comprehensive error analysis for the most important input parameters in multiphase flow
correlations for oil and gas wells. Based on the results of the study, the following conclusions can be drawn:
Some input parameters to multiphase flow correlations have high effect on pressure drop calculations and others 1- have low effect. The input parameters investigated in this study (CGR, WGR, API, gas specific gravity, and tubing roughness) usually carry some element of uncertainty and may have significant errors. The effects of these parameters are variable and depend on flow conditions and well configuration.
GOR has the highest effect on the pressure drop calculations for oil wells. Care should be taken when measuring 2- gas production rate for multiphase pressure drop calculations.
API has low effect on pressure drop calculations for oil wells; however, its effect increases at the high flow rate of 3- oil, but it has almost no effect on the pressure drop calculations for gas wells.
Gas specific gravity (Ɣ4- g) has medium to high effect on the pressure drop calculations for oil wells, but it has the highest effect on the pressure drop calculations for gas wells.
Tubing roughness has low effect on the pressure drop calculations for oil wells; however, the effect increases in 5- case of medium flow rate wells. On the other hand, tubing roughness has a significant effect on gas wells except for low flow rate wells.
CGR and WGR have low effect on pressure drop calculations for gas wells.6-
Well deviation increases the effect of different input parameters on the bottomhole pressure calculation error for 7- oil wells.
ABBREVIATIONSANFIS = Adaptive-Network-Based Fuzzy Inference System
API = American Petroleum Institute (Density Measurement)
BHT = Bottom Hole Temperature
CFD = Computational Fluid Dynamics
357Mohamed A. Abd El-Moniem and Ahmed H. El-Banbi
CGR = Condensate Gas Ratio
DT = Decision Tree
ESP = Electrical Submersible Pump
GOR = Gas Oil Ratio
GOSP = Gas Oil Separation Plant
ID = Inner diameter
MAPE1 = Mean Absolute Percent Error for Maximum Error
MAPE2 = Mean Absolute Percent Error for the Base Run
psi = Pound Force Per Square Inch
PVT = Pressure, Volume and Temperature Relationships
SVM = Support Vector Machine
RE = Relative Error
scf = Standard Cubic Foot
STB = Stock Tank Barrel
VBA = Visual Basic for Applications
W.C. = Water Cut
WHFP = Wellhead Flowing Pressure
WHFT = Wellhead Flowing Temperature
WGR = Water Gas Ratio.
NOMENCLATURED = Day
d = Difference
D = Deviated
°F = Degree Fahrenheit
FT = Foot
H = High
in = Inch
L = Length
L = Low
M = Medium
MM = Million
n = Number of Points
Pwf = Bottomhole Flowing Pressure
Expert solution for effects of input parameters on multiphase flow correlations358
P = Pressure
qg = Gas Flow Rate
qo = Oil Flow Rate
V = Vertical
° = Degree
% = Percentage.
GREEK LETTERSƔg = Gas Specific Gravity
ε = Tubing Roughness.
REFERENCESAbd El-Moniem, M.A. & El-Banbi, A.H. 2015. Proper Selection of Multiphase Flow Correlations. SPE North Africa Technical
Conference and Exhibition, SPE 175805-MS. https://doi.org/10.2118/175805-MS.
Abd El-Moniem, M.A. & El-Banbi, A.H. 2018. Development of an Expert System for Selection of Multiphase Flow Correlations. Journal of Petroleum Exploration and Production Technology, 8: 1473. https://doi.org/10.1007/s13202-018-0442-7.
Abd El-Moniem, M.A. & El-Banbi, A.H. 2018. Effect of Data Errors on Multiphase Flow Correlations. SPE Annual Technical Symposium and Exhibition, SPE 192171-MS. https://doi.org/10.2118/192171-MS.
Abd El-Moniem, M.A. & El-Banbi, A.H. 2020. Effects of Production, PVT and Pipe Roughness on Multiphase Flow Correlations in Gas Wells. Journal of Petroleum Exploration and Production Technology, https://doi.org/10.1007/s13202-020-00944-y.
Abdul-Majeed, G.H. & Al-Mashat, A.M. 2000. A Mechanistic Model for Vertical and Inclined Two-Phase Slug Flow. Journal of Petroleum Science and Engineering, 27: 59-67, https://doi.org/10.1016/S0920-4105(00)00047-4.
Alizadehdakhel, A.; Rahimi, M.; Sanjari, J. & Alsairafi, A.A. 2009. CFD and Artificial Neural Network Modeling of Two-Phase Flow Pressure Drop. International Communications in Heat and Mass Transfer, 8: 850-856, https://doi.org/10.1016/j.icheatmasstransfer.2009.05.005.
Al-Shammari, A. 2011. Accurate Prediction of Pressure Drop in Two-Phase Vertical Flow Systems using Artificial Intelligence. Society of Petroleum Engineers. doi:10.2118/149035-MS.
Ansari, A.M.; Sylvester, N.D.; Shoham, O. & Brill, J.P. 1990. A Comprehensive Mechanistic Model for Upward Two Phase Flow in Wellbores. SPE Annual Technical Conference and Exhibition, SPE 20630.
Ashiem, H. 1986. MONA, An Accurate Two Phase Well Flow Model Based on Phase Slippage. SPE Production Engineering: 221-230. SPE 12989-PA. https://doi.org/10.2118/12989-PA.
Attia, M.; Abdulraheem, A. & Mahmoud, M.A. 2015. Pressure Drop Due to Multiphase Flow Using Four Artificial Intelligence Methods. Society of Petroleum Engineers. doi:10.2118/175724-MS.
Awadalla, M.; Yousef, H.; Al-Shidani, A. & Al-Hinai, A. 2016. Artificial Intelligent techniques for Flow Bottom Hole Pressure Prediction. International Journal of Computers & Technology, 15(12): 7263-7283. https://doi.org/10.24297/ijct.v15i12.4354.
Aziz, K.; Govier, G.W. & Fogarasi, M. 1972. Pressure Drop in Wells Producing Oil and Gas, Journal of Canadian Petroleum Technology, 38-48.
Baxendell, P.B. & Thomas, R. 1961. The Calculation of Pressure Gradients in High Rate Flowing Wells. Journal of Petroleum Technology: 1023-1028. SPE-2-PA. https://doi.org/10.2118/2-PA.
Beggs, H.D. & Brill, J.P. 1973. A Study of Two Phase Flow in Inclined Pipes. Journal of Petroleum Technology: 607-617. SPE 4007-PA. https://doi.org/10.2118/4007-PA.
359Mohamed A. Abd El-Moniem and Ahmed H. El-Banbi
Chen W, et al. 2017. Flowing bottomhole pressure prediction for gas wells based on support vector machine and random samples selection, International Journal of Hydrogen Energy, http://dx.doi.org/10.1016/j.ijhydene.2017.04.134.
Chierici, G.L.; Ciucci, G.M. & Sclocchi, G. 1974. Two Phase Vertical Flow in Oil Wells Prediction of Pressure Drop. Journal of Petroleum Technology: 927-938. SPE-4316-PA. https://doi.org/10.2118/4316-PA.
Duns, H.Jr. & Ros, N.C.J. 1963. Vertical Flow of Gas and Liquid Mixtures in Wells. Sixth World Petroleum Congress, WPC-10132, 451-465.
El-Kadi, M.; Husien, M.; El-Behery, S. & Farouk, A. 2019. Prediction of Two-Phase Pressure Drop Using Artificial Neural Network. Engineering Research Journal, 42(2): 99-114. doi: 10.21608/erjm.2019.66275.
Fancher, G.H.Jr. & Brown, K.E. 1963. Prediction of Pressure Gradients for Multiphase Flow in Tubing. Society of Petroleum Engineers Journal: 59-69. SPE-440-PA. https://doi.org/10.2118/440-PA.
Hagedorn, A.R. & Brown, K.E. 1964. The Effect of Liquid Viscosity in Two Phase Vertical Flow. Journal of Petroleum Technology: 203-210. SPE-733-PA. https://doi.org/10.2118/733-PA.
Hagedorn, A.R. & Brown, K.E. 1965. Experimental Study of Pressure Gradients Occurring during Continuous Two Phase Flow in Small Diameter Vertical Conduits. Journal of Petroleum Technology: 475-484. SPE-940-PA. https://doi.org/10.2118/940-PA.
Hasan, A.R., & Kabir, C.S. 1986. A Study of Multiphase Flow Behavior in Vertical Oil Wells: Part I - Theoretical Treatment. Society of Petroleum Engineers. doi:10.2118/15138-MS
Hill, T.J. & Wood, D.G. 1994. Slug flow: occurrence, consequences, and prediction. SPE-27960.
Mohammadi, M. 2006. A Comprehensive Neural Network Model for Predicting Two-Phase Liquid Holdup Under Various Angles of Pipe Inclinations. Petroleum Society of Canada. doi:10.2118/2006-048.
McCain, W.D. 1991. Reservoir-Fluid Property Correlations State of the Art. SPERE, p. 266-272.
Mukherjee, H. & Brill, J.P. 1983. Liquid Holdup Correlations for Inclined Two Phase Flow. Journal of Petroleum Technology: 1003-1008. SPE-10923-PA. https://doi.org/10.2118/10923-PA.
Orkiszewski, J. 1967. Predicting Two Phase Pressure Drops in Vertical Pipe. Journal of Petroleum Technology: 829-838. SPE-1546-PA. https://doi.org/10.2118/1546-PA.
Osman, E.S.A. 2001. Artificial Neural Networks Models for Identifying Flow Regimes and Predicting Liquid Holdup in Horizontal Multiphase Flow. Society of Petroleum Engineers. doi:10.2118/68219-MS.
Peffer, J.W.; Miller, M.A. & Hill, A.D. 1988. An Improved Method for Calculating Bottomhole Pressures in Flowing Gas Wells with Liquid Present. SPE Production Engineering: 643-655. SPE-15655-PA. https://doi.org/10.2118/15655-PA.
Prosper Software Help Manual 2015. Petroleum Experts Ltd., Edinburgh, UK.
Reinicke, K.M.; Remer, R.J. & Hueni, G. 1987. Comparison of Measured and Predicted Pressure Drops in Tubing for High Water Cut Gas Wells. SPE Production Engineering: 165-177. SPE-13279-PA. https://doi.org/10.2118/13279-PA.
Shippen, M.E., & Scott, S.L. 2002. A Neural Network Model for Prediction of Liquid Holdup in Two-Phase Horizontal Flow. Society of Petroleum Engineers. doi:10.2118/77499-MS.