Embed Size (px)
Citation preview
WinTR-20 Sensitivity March 2009 1
WinTR-20 Sensitivity to Input Parameters
WinTR-20 Sensitivity March 2009 2
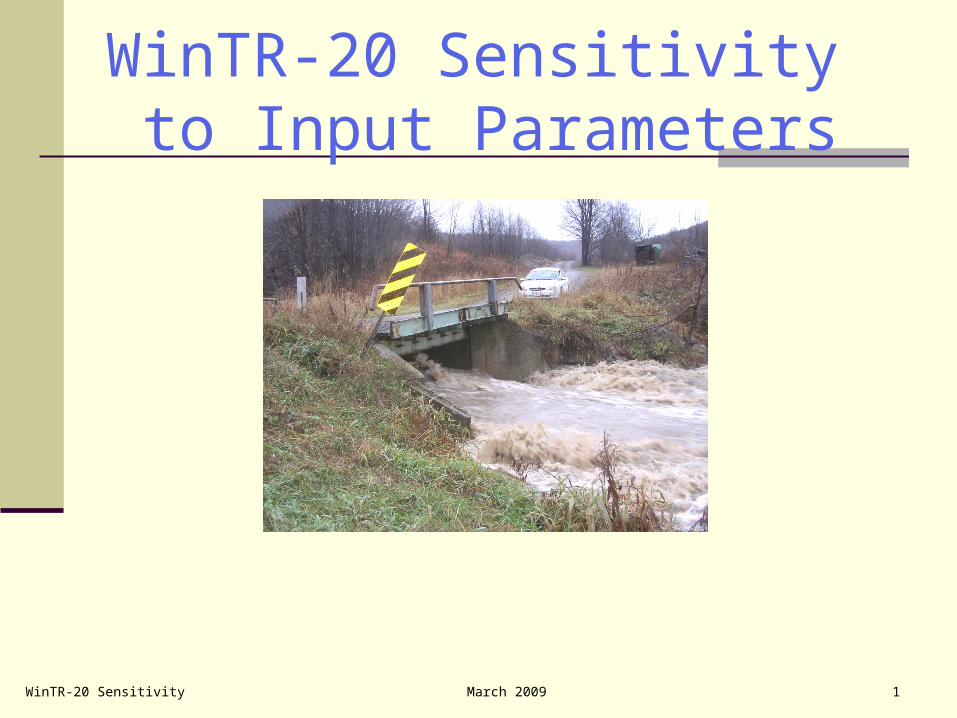
Lesson Objectives
1. Identify the various WinTR-20 Input Parameters that affect the volume of runoff and peak discharge predictions.
2. Identify the relative sensitivity of WinTR-20 to its input parameters in predicting the peak and/or volume of runoff.
3. Identify the relative sensitivity of WinTR-20 to its input parameters in relation to channel routing.
WinTR-20 Sensitivity March 2009 3
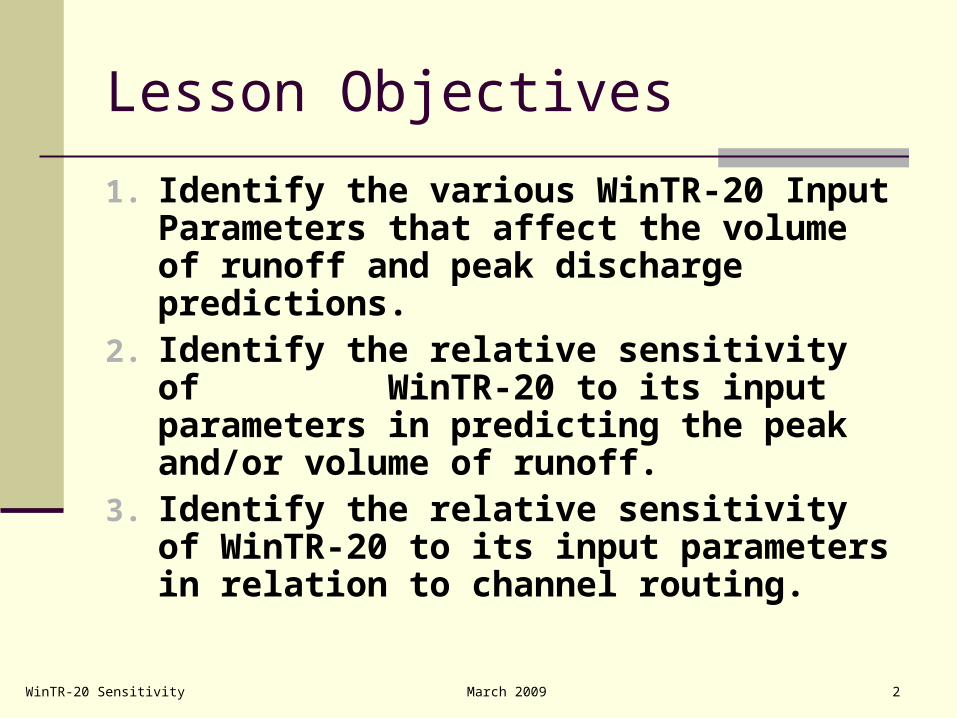
WinTR-20 Hydrology Model
Predicts Volume of Runoff Predicts Peak Rate of Runoff Predicts Entire Hydrograph of Runoff Based on Watershed and Rainfall
Characteristics Modeled as Input Parameters Changes to Input Parameters Will Change
the Volume and Rate of Runoff Predicted
WinTR-20 Sensitivity March 2009 4
WinTR-20 Watershed Input Variables
Drainage Area Runoff Curve Number (RCN) Time of Concentration (tc)
Unit Peak Factor (UPF) of Dimensionless Unit Hydrograph (DUH)
Antecedent Runoff Condition (ARC)
WinTR-20 Sensitivity March 2009 5
WinTR-20 Rainfall Input Variables Depth of Rainfall Rainfall Distribution (includes duration)
WinTR-20 Sensitivity March 2009 6
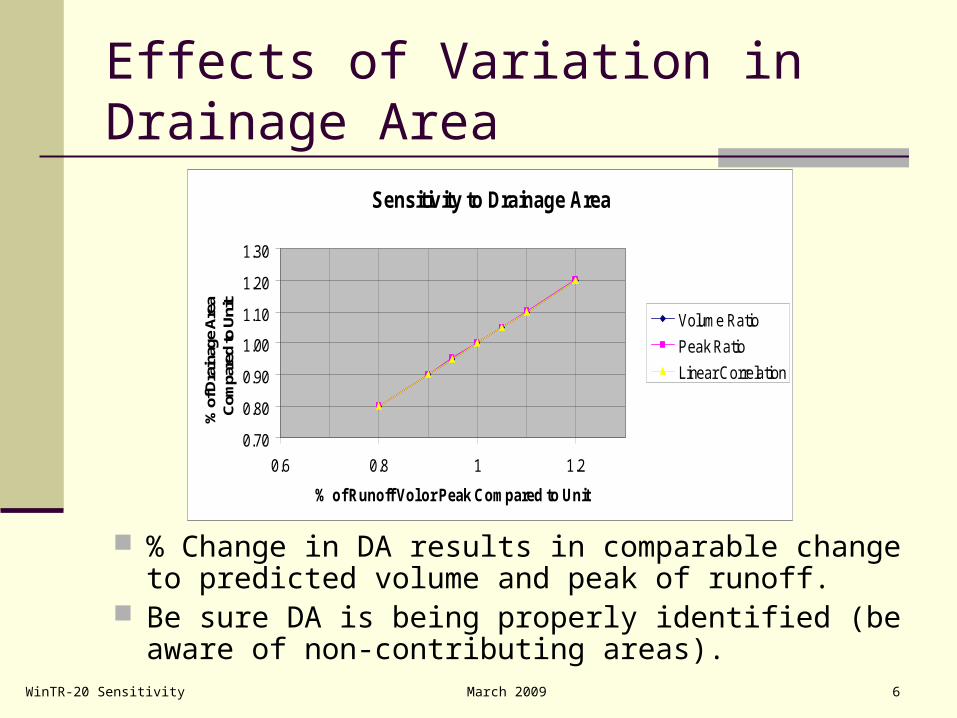
Effects of Variation in Drainage Area
Sensitivity to Drainage Area
0.70
0.80
0.90
1.00
1.10
1.20
1.30
0.6 0.8 1 1.2
% of Runoff Vol or Peak Compared to Unit
% o
f Dra
inag
e A
rea
Com
pare
d to
Uni
t
Volume Ratio
Peak Ratio
Linear Correlation
% Change in DA results in comparable change to predicted volume and peak of runoff.
Be sure DA is being properly identified (be aware of non-contributing areas).
WinTR-20 Sensitivity March 2009 7
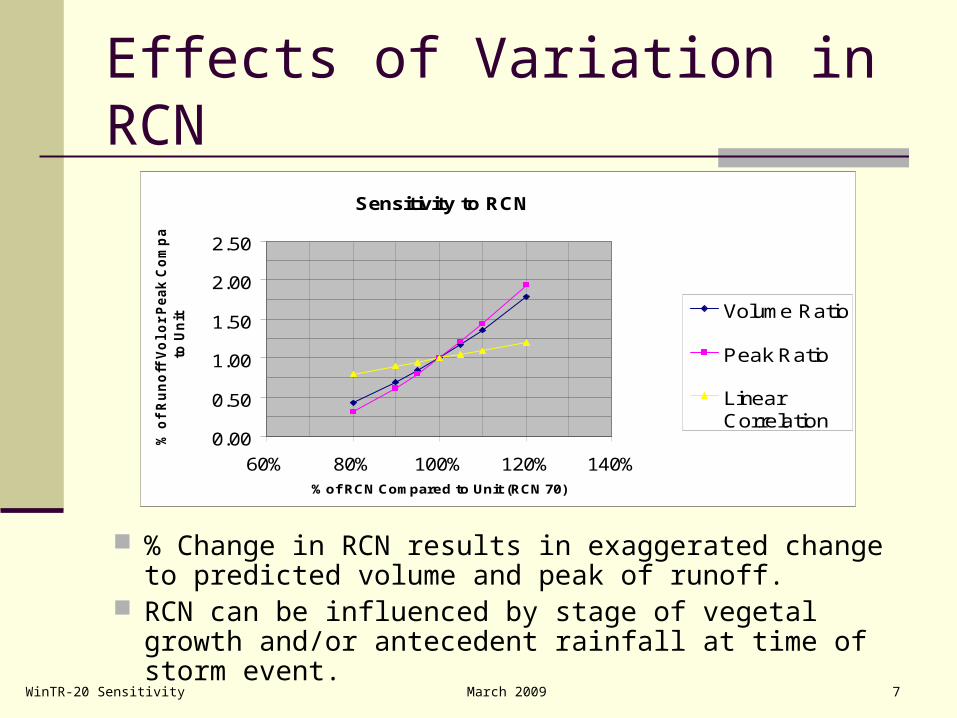
Effects of Variation in RCN
% Change in RCN results in exaggerated change to predicted volume and peak of runoff.
RCN can be influenced by stage of vegetal growth and/or antecedent rainfall at time of storm event.
Sensitivity to RCN
0.00
0.50
1.00
1.50
2.00
2.50
60% 80% 100% 120% 140%% of RCN Compared to Unit (RCN 70)
% o
f R
un
off
Vo
l o
r P
ea
k C
om
pa
red
to U
nit Volume Ratio
Peak Ratio
LinearCorrelation
WinTR-20 Sensitivity March 2009 8
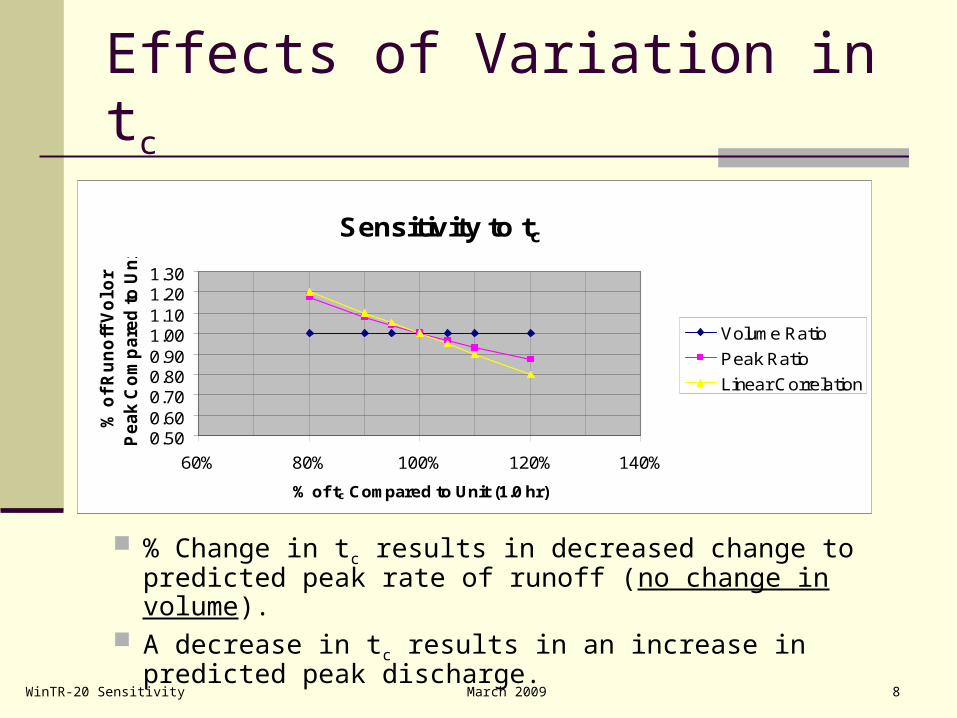
Effects of Variation in tc
% Change in tc results in decreased change to predicted peak rate of runoff (no change in volume).
A decrease in tc results in an increase in predicted peak discharge.
Sensitivity to tc
0.500.600.700.800.901.001.101.201.30
60% 80% 100% 120% 140%
% of tc Compared to Unit (1.0 hr)
% o
f R
un
off
Vo
l or
Pe
ak
Co
mp
are
d t
o U
nit
Volume Ratio
Peak Ratio
Linear Correlation
WinTR-20 Sensitivity March 2009 9
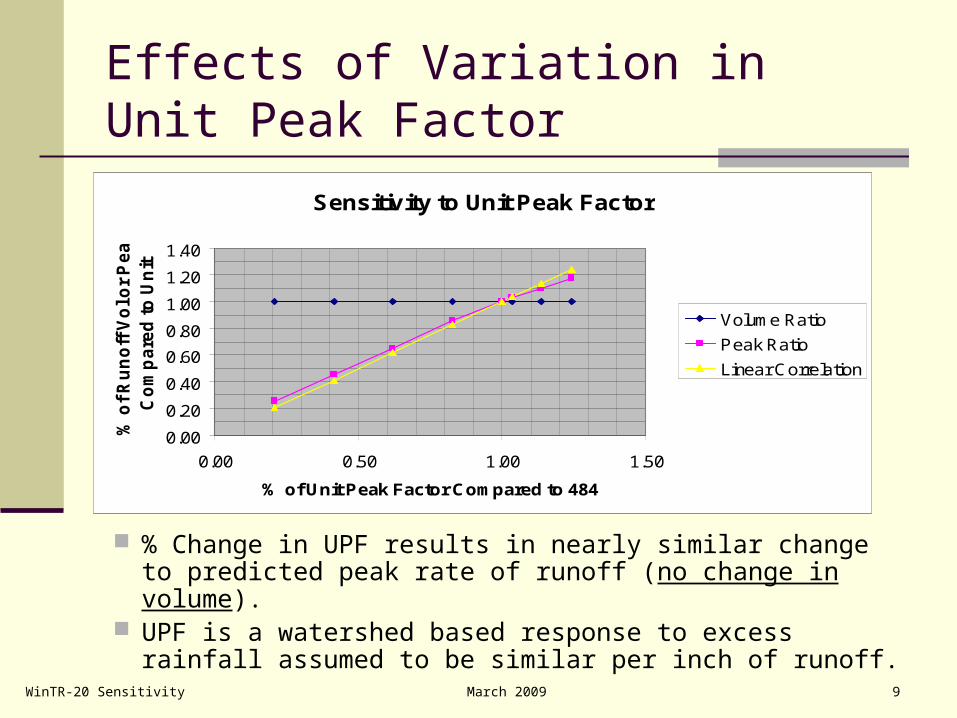
Effects of Variation in Unit Peak Factor
% Change in UPF results in nearly similar change to predicted peak rate of runoff (no change in volume).
UPF is a watershed based response to excess rainfall assumed to be similar per inch of runoff.
Sensitivity to Unit Peak Factor
0.00
0.20
0.40
0.60
0.80
1.00
1.20
1.40
0.00 0.50 1.00 1.50
% of Unit Peak Factor Compared to 484
% o
f R
un
off
Vo
l or
Pe
ak
Co
mp
are
d t
o U
nit
Volume Ratio
Peak Ratio
Linear Correlation
WinTR-20 Sensitivity March 2009 10
Effects of Variation inAntecedent Runoff Condition (ARC) ARC values of 1 or 3 alter the RCN selected
for assumed ARC 2 conditions. ARC 2 is normally assumed for design. ARC 1 can be used to help calibrate for a
known “drought” condition prior to the target storm event (not necessarily accurate).
ARC 3 can be used to help calibrate for a known “saturated soil” condition prior to the target storm event (not necessarily accurate).
WinTR-20 Sensitivity March 2009 11
ARC Adjustments (Continued)
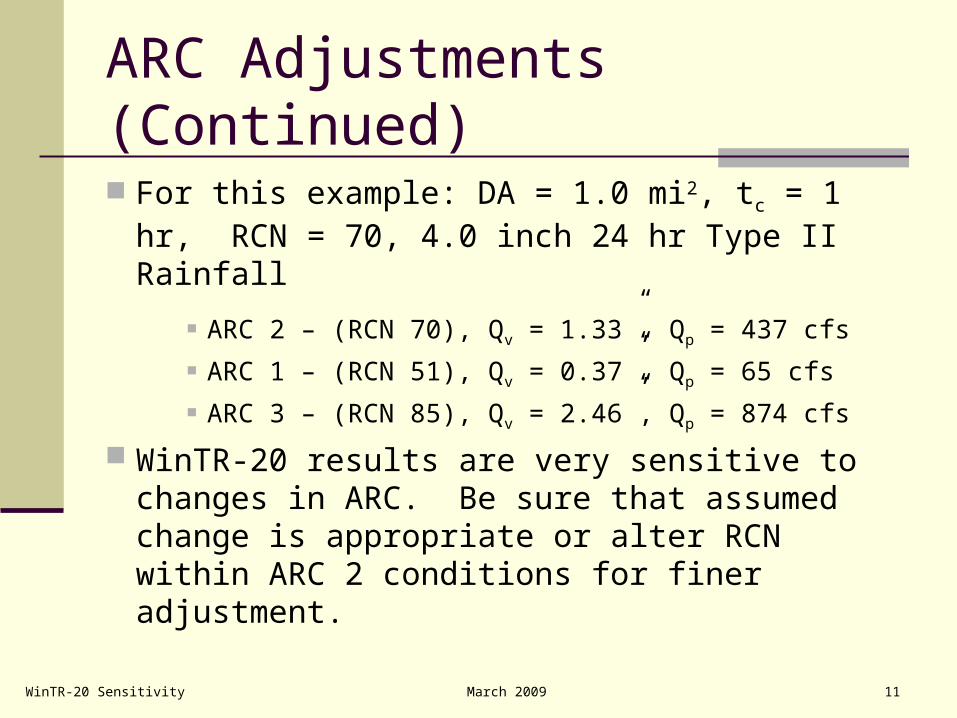
For this example: DA = 1.0 mi2, tc = 1 hr, RCN = 70, 4.0 inch 24 hr Type II Rainfall
ARC 2 – (RCN 70), Qv = 1.33”, Qp = 437 cfs
ARC 1 – (RCN 51), Qv = 0.37”, Qp = 65 cfs
ARC 3 – (RCN 85), Qv = 2.46”, Qp = 874 cfs
WinTR-20 results are very sensitive to changes in ARC. Be sure that assumed change is appropriate or alter RCN within ARC 2 conditions for finer adjustment.
WinTR-20 Sensitivity March 2009 12
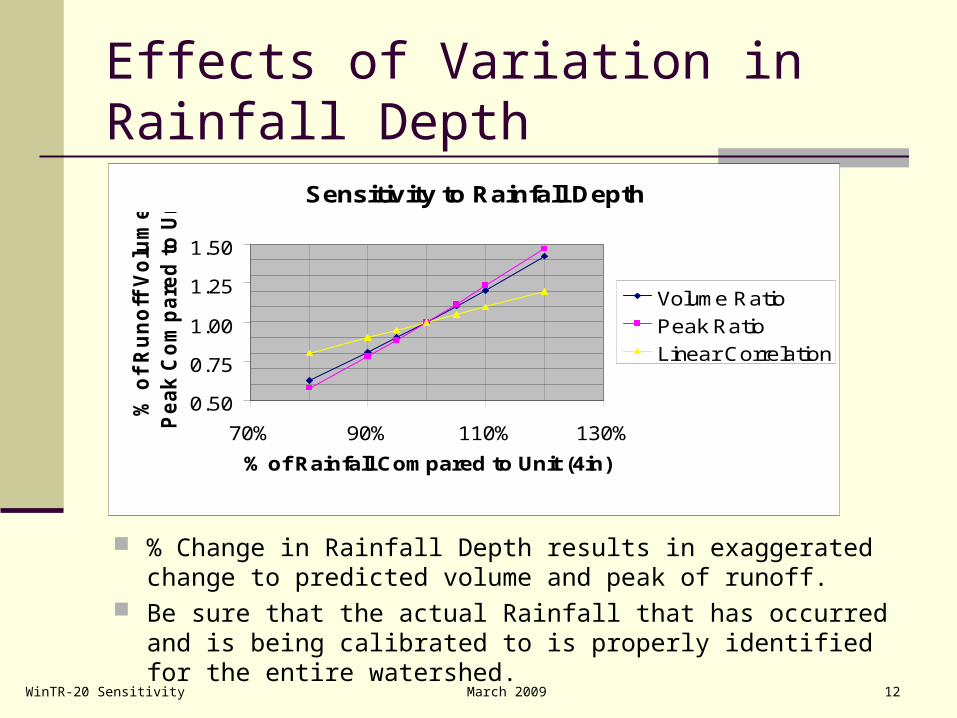
Effects of Variation in Rainfall Depth
% Change in Rainfall Depth results in exaggerated change to predicted volume and peak of runoff.
Be sure that the actual Rainfall that has occurred and is being calibrated to is properly identified for the entire watershed.
Sensitivity to Rainfall Depth
0.50
0.75
1.00
1.25
1.50
70% 90% 110% 130%
% of Rainfall Compared to Unit (4in)
% o
f R
un
off
Vo
lum
e,
Pe
ak
Co
mp
are
d t
o U
nit
Volume Ratio
Peak Ratio
Linear Correlation
WinTR-20 Sensitivity March 2009 13
Effects of Variation in Rainfall Distribution
Design rainfall distributions normally set by criteria (e.g. Type I, IA, II, or III).
Can attempt to calibrate to a historical rainfall event of known varying intensity (recording rain gage).
Rainfall distribution alone (not depth) only effects the rate of runoff, not the volume.
WinTR-20 Sensitivity March 2009 14
Effects of Variation in Rainfall Distribution(Continued)
For this example: DA = 1.0 mi2, tc = 1 hr, RCN = 70, 4.0 inch 24 hr Type II Rainfall
Type II - Qp = 437 cfs
Type I - Qp = 221 cfs
Type IA - Qp = 106 cfs
Type III - Qp = 383 cfs
WinTR-20 peaks are very sensitive to selection of rainfall distribution. Calibrate with the best known rainfall distribution.
WinTR-20 Sensitivity March 2009 15
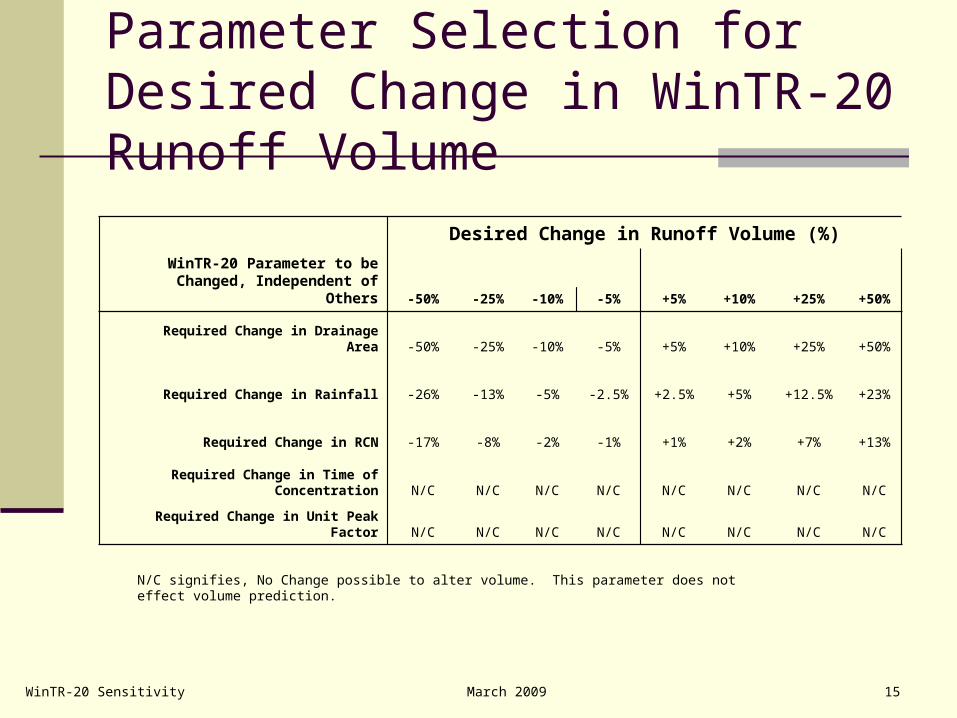
Parameter Selection for Desired Change in WinTR-20 Runoff Volume
WinTR-20 Parameter to be Changed, Independent of Others
Desired Change in Runoff Volume (%)
-50% -25% -10% -5% +5% +10% +25% +50%
Required Change in Drainage Area -50% -25% -10% -5% +5% +10% +25% +50%
Required Change in Rainfall -26% -13% -5% -2.5% +2.5% +5% +12.5% +23%
Required Change in RCN -17% -8% -2% -1% +1% +2% +7% +13%
Required Change in Time of
Concentration N/C N/C N/C N/C N/C N/C N/C N/C
Required Change in Unit Peak
Factor N/C N/C N/C N/C N/C N/C N/C N/C
N/C signifies, No Change possible to alter volume. This parameter does not effect volume prediction.
WinTR-20 Sensitivity March 2009 16
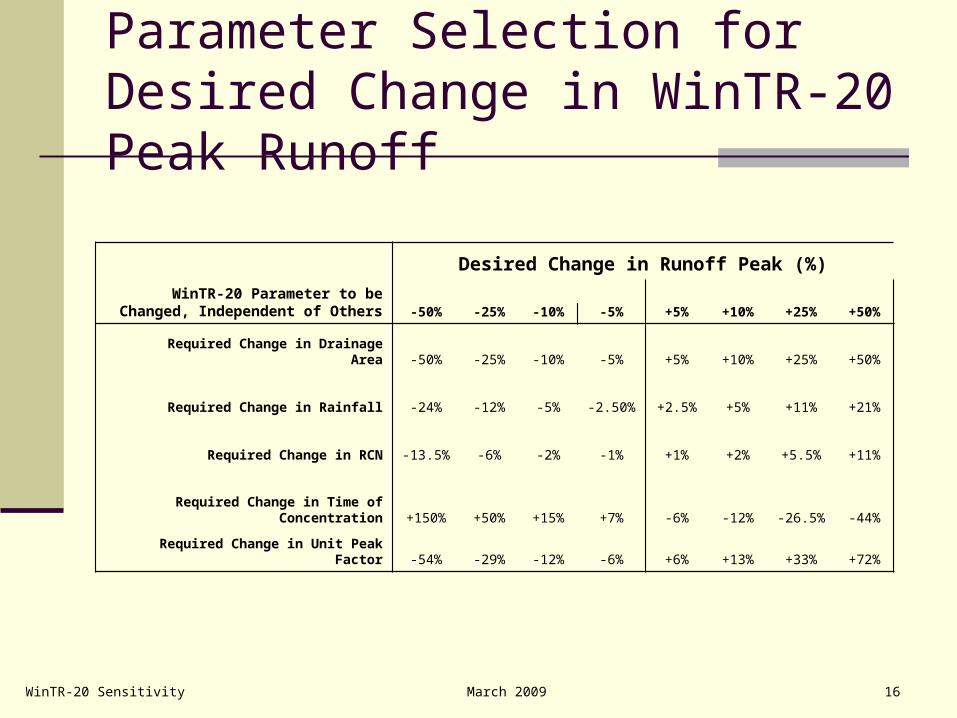
Parameter Selection for Desired Change in WinTR-20 Peak Runoff
WinTR-20 Parameter to be Changed, Independent of Others
Desired Change in Runoff Peak (%)
-50% -25% -10% -5% +5% +10% +25% +50%
Required Change in Drainage Area -50% -25% -10% -5% +5% +10% +25% +50%
Required Change in Rainfall -24% -12% -5% -2.50% +2.5% +5% +11% +21%
Required Change in RCN -13.5% -6% -2% -1% +1% +2% +5.5% +11%
Required Change in Time of
Concentration +150% +50% +15% +7% -6% -12% -26.5% -44%
Required Change in Unit Peak
Factor -54% -29% -12% -6% +6% +13% +33% +72%
WinTR-20 Sensitivity March 2009 17
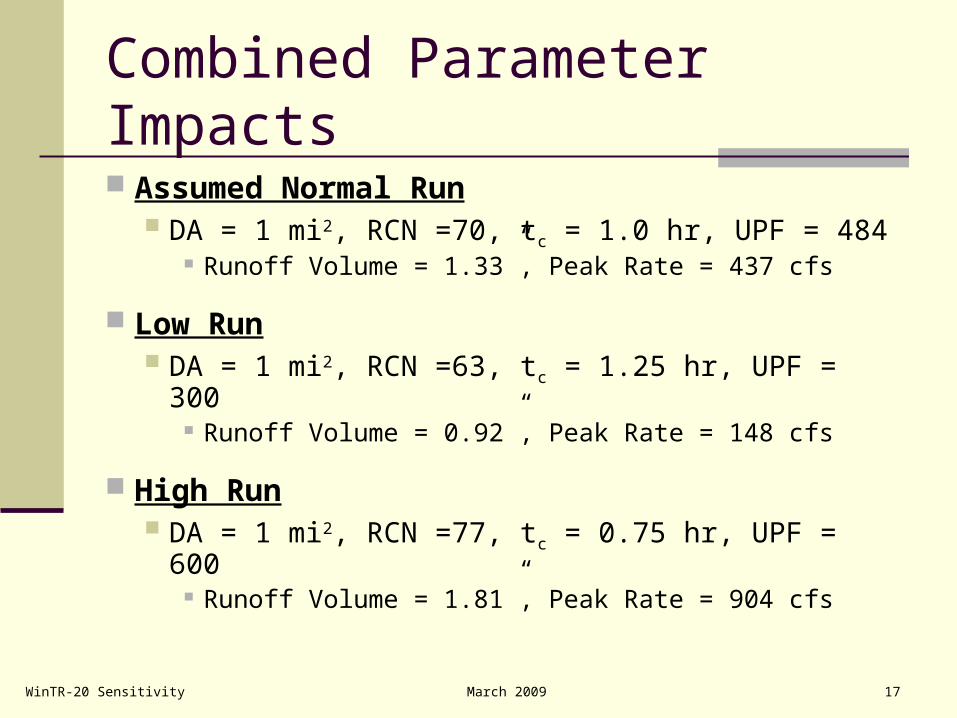
Combined Parameter Impacts
Assumed Normal Run DA = 1 mi2, RCN =70, tc = 1.0 hr, UPF = 484
Runoff Volume = 1.33”, Peak Rate = 437 cfs
Low Run DA = 1 mi2, RCN =63, tc = 1.25 hr, UPF = 300
Runoff Volume = 0.92”, Peak Rate = 148 cfs
High Run DA = 1 mi2, RCN =77, tc = 0.75 hr, UPF = 600
Runoff Volume = 1.81”, Peak Rate = 904 cfs
WinTR-20 Sensitivity March 2009 18
WinTR-20 Channel Routing Model Predicts hydrograph (including peak) at
downstream end of reach. Based on cross section and reach
characteristics modeled as input parameters. Changes to input parameters will change the
peak discharge and hydrograph shape predicted at the end of the reach.
WinTR-20 Sensitivity March 2009 19
WinTR-20 Channel and Reach Input Variables Selection of representative cross section Cross section rating table (slope and “n”) Channel length Flood plain length Shape of inflow hydrograph Base flow (if significant)
WinTR-20 Sensitivity March 2009 20
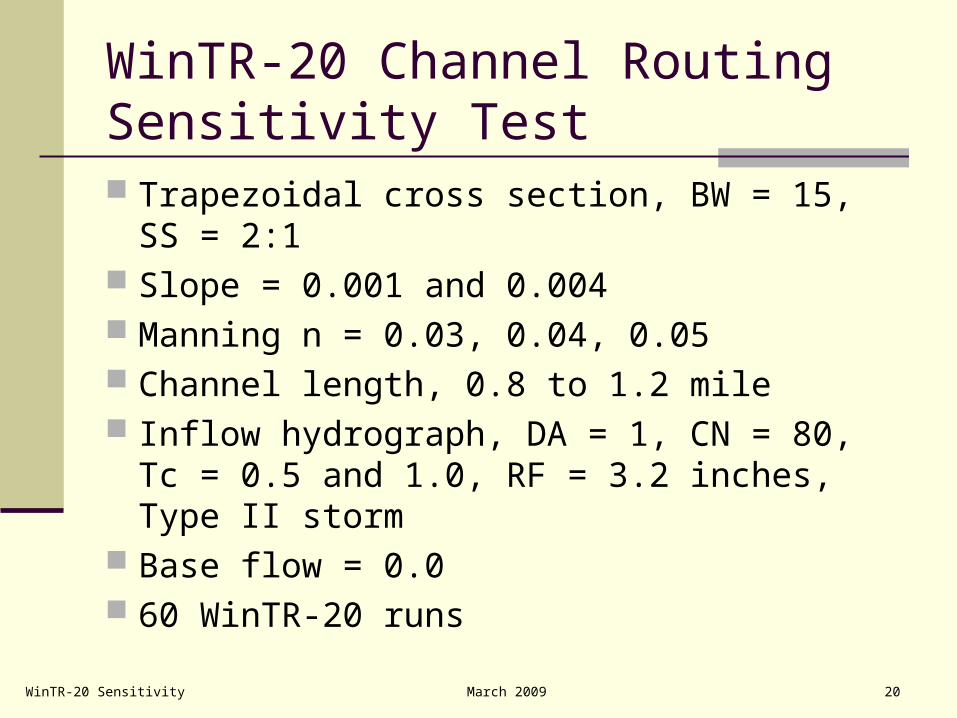
WinTR-20 Channel Routing Sensitivity Test Trapezoidal cross section, BW = 15, SS = 2:1 Slope = 0.001 and 0.004 Manning n = 0.03, 0.04, 0.05 Channel length, 0.8 to 1.2 mile Inflow hydrograph, DA = 1, CN = 80, Tc = 0.5
and 1.0, RF = 3.2 inches, Type II storm Base flow = 0.0 60 WinTR-20 runs
WinTR-20 Sensitivity March 2009 21
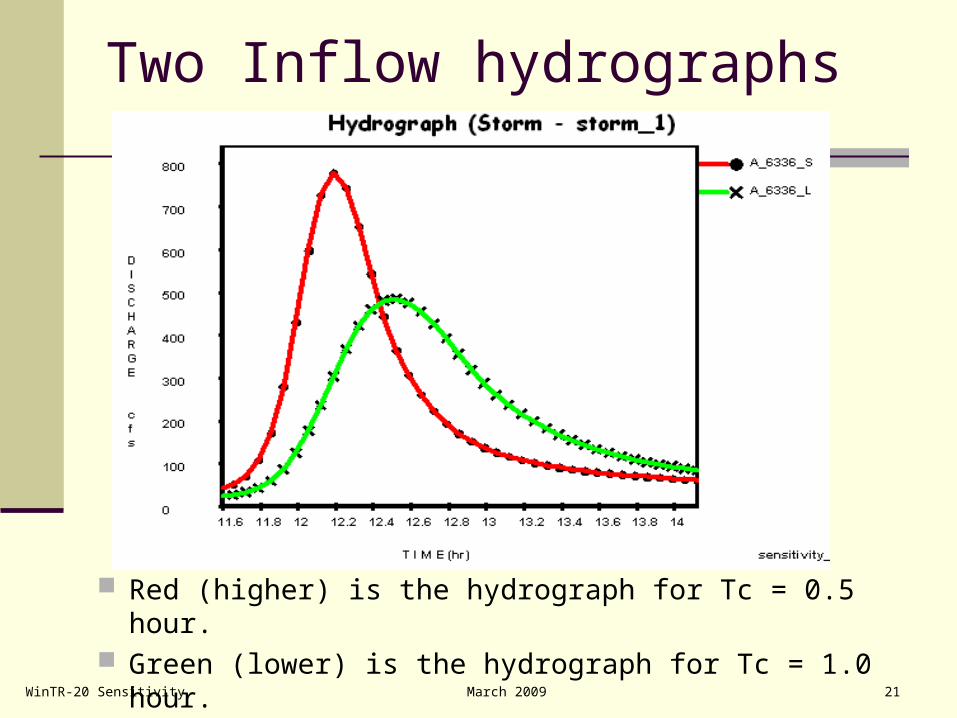
Two Inflow hydrographs
Red (higher) is the hydrograph for Tc = 0.5 hour. Green (lower) is the hydrograph for Tc = 1.0 hour.
WinTR-20 Sensitivity March 2009 22
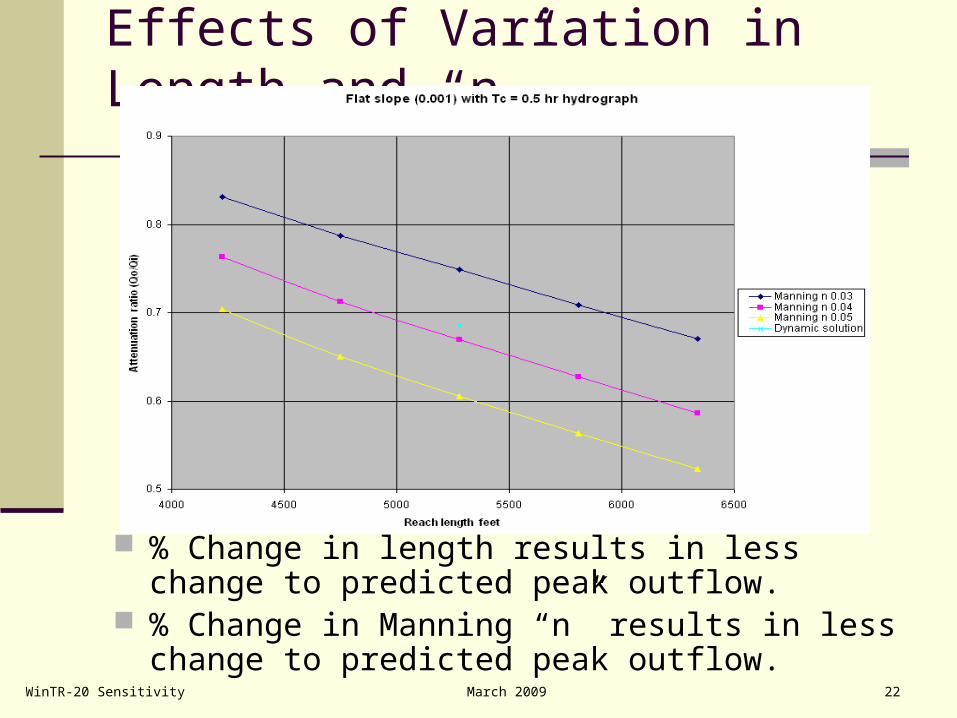
Effects of Variation in Length and “n”
% Change in length results in less change to predicted peak outflow.
% Change in Manning “n” results in less change to predicted peak outflow.
WinTR-20 Sensitivity March 2009 23
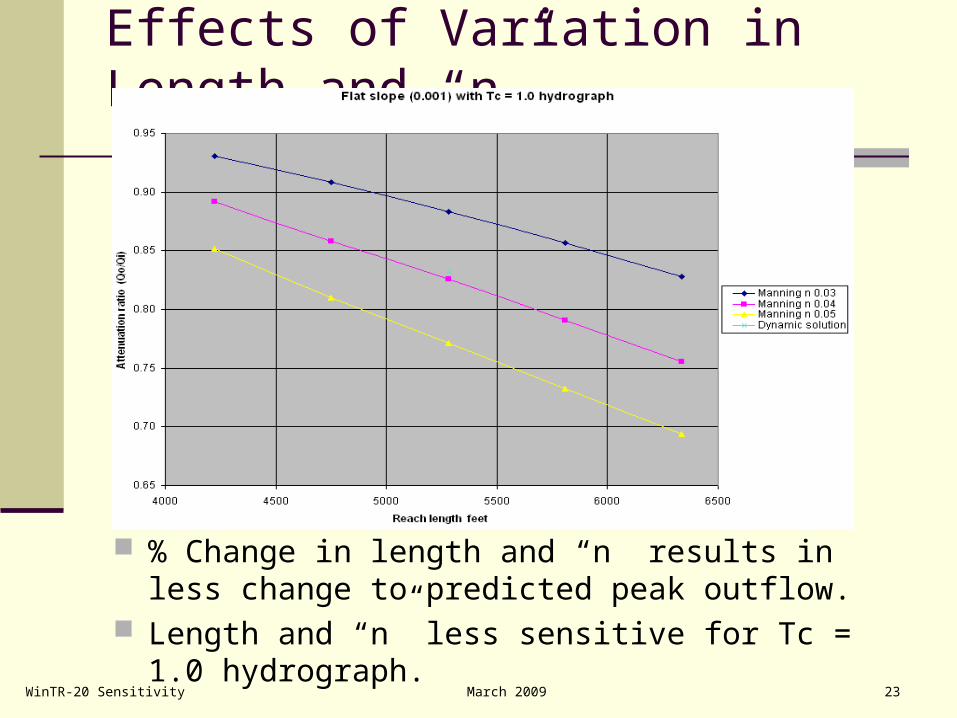
Effects of Variation in Length and “n”
% Change in length and “n” results in less change to predicted peak outflow.
Length and “n” less sensitive for Tc = 1.0 hydrograph.
WinTR-20 Sensitivity March 2009 24
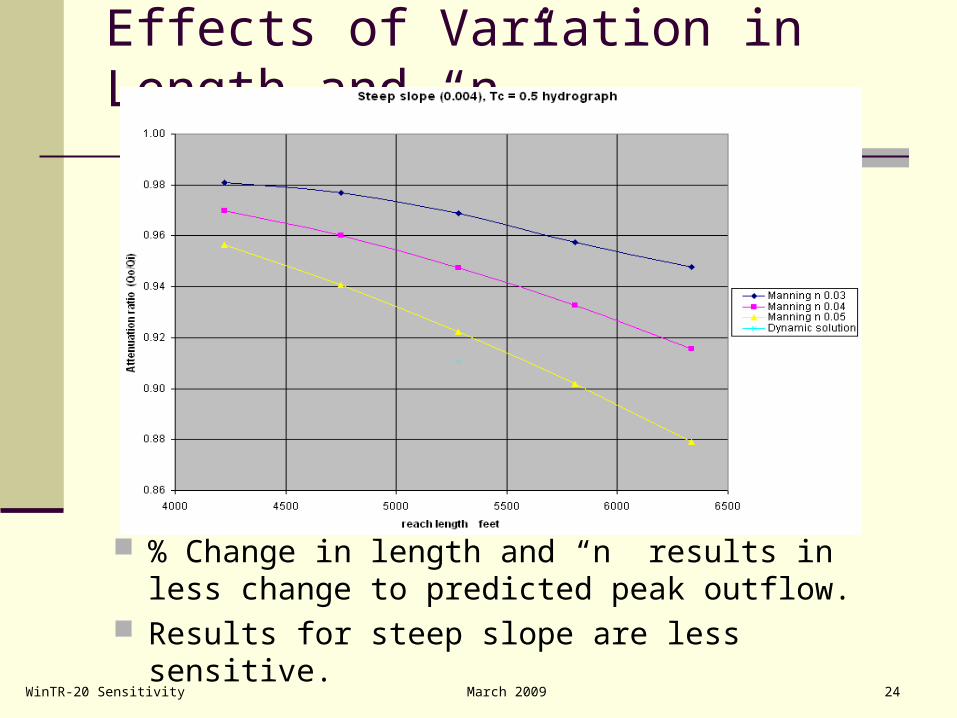
Effects of Variation in Length and “n”
% Change in length and “n” results in less change to predicted peak outflow.
Results for steep slope are less sensitive.
WinTR-20 Sensitivity March 2009 25
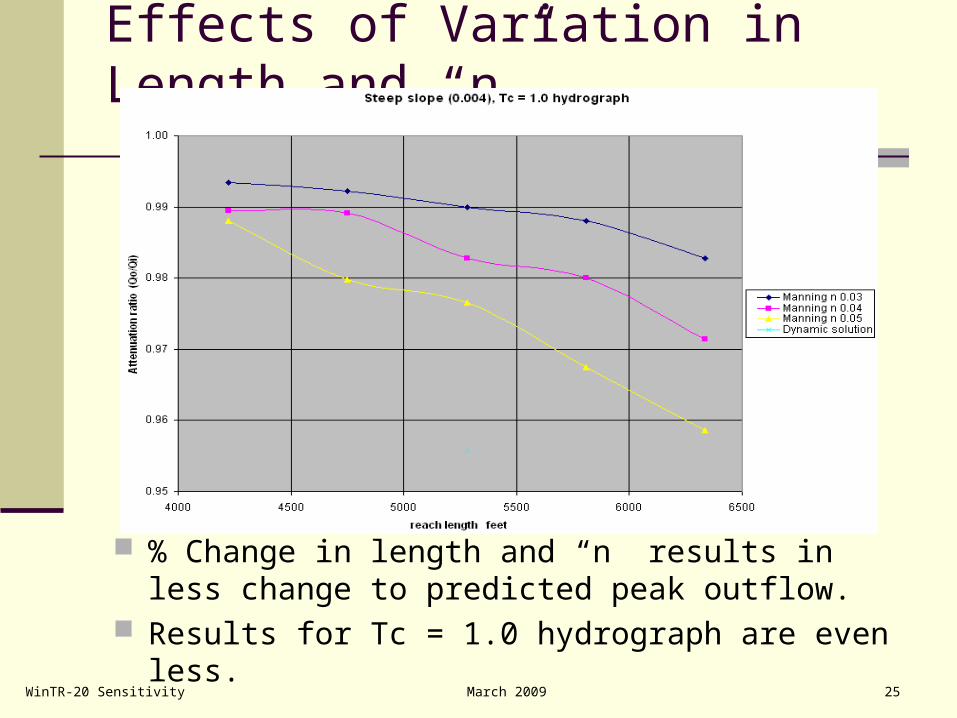
Effects of Variation in Length and “n”
% Change in length and “n” results in less change to predicted peak outflow.
Results for Tc = 1.0 hydrograph are even less.
WinTR-20 Sensitivity March 2009 26
Porcupine Mountains State Park, Michigan

WinTR-20 Sensitivity March 2009 27
Questions???

WinTR-20 Sensitivity March 2009 28
The End