Embed Size (px)
Citation preview

INPUT PARAMETERS FOR THE PROBABILISTIC SEISMIC
HAZARD ASSESSMENT IN THE EASTERN PART
OF ROMANIA AND BLACK SEA AREA
I.A. MOLDOVAN1, M. DIACONESCU1, E. POPESCU1, M. RADULIAN1, D. TOMA-DANILA1,
A.P. CONSTANTIN1, A.O. PLACINTA1
1National Institute for earth Physics, P.O. Box MG-2, RO-077125 Bucharest-Magurele, Romania,
E-mail: [email protected]
Received August 31, 2015
In this study we have used the most reliable and homogeneous seismic datasets at
the European scale, covering historical and modern instrumental seismicity until
present days for the Eastern part of Romania and the Black Sea Area for computing
the statistical parameters of seimogenic sources and assessing the probabilistic hazard
in the South Eastern part of Romania.
Key words: Probabilistic seismic hazard assessment, Seismogenic sources.
1. INTRODUCTION
The seismic hazard assessment in populated geographical regions and
subsequently the design of the strategic objectives (dams, nuclear power plants,
harbors, etc.) are based on the knowledge of the seismicity parameters of the
seismogenic sources which can generate ground motion amplitudes above the
minimum level considered risky at the specific site and the way the seismic waves
propagate between the focus and the site.
On the Black Sea Shore there are vulnerable objectives, like large cities,
hydro-energetic dams or nuclear power plants that can be affected both by large
ground amplitudes due to earthquakes from inland seismic sources and offshore
ones and also by tsunamis that follow a large offshore earthquake. The study will
focus on the seismic zones from the South Eastern part of Romania and on the
Black Sea offshore seismogenic sources as well.
The purpose of this study is to provide a complete set of information
required for a probabilistic assessment of the seismic hazard on an area from the
south Eastern part of Romania including the Black Sea shore relative to the marine
and terrestrial crustal and subcrustal seismogenic sources. The analysis that we
propose implies: (1) geometrical definition of all seismic sources affecting the area,
(2) estimation of the maximum possible magnitude and (3) estimation of the
frequency magnitude relationship.
Rom. Journ. Phys., Vol. 61, No. 7–8, P. 1412–1425, 2016

2 Input parameters for PSHA in East Romania and Black Sea area 1413
The present study is accomplished using a seismic database that is obtained
as a result of merging multiple national and international catalogues, each offshore
source location being obtained by means of teleseismic information. The actual
database is not the most reliable one for hazard assessment studies, but is the only
existing one. On-going projects focusing on the Black Sea area (ASTARTE and
SciNetNatHaz) will try to improve the present knowledge of the seismogenic Black
Sea sources and their possible effects on the important sites situated all around the
Sea Coast.
2. EARTHQUAKE SOURCES
For probabilistic hazard assessment purposes we used the seismic zonation
represented in the Fig. 1 that includes both normal and intermediate-depth
earthquakes from the Black Sea and the South Eastern part of Romania.
In order to have the most reliable and homogeneous seismic dataset, we
compiled the catalogues available at the European scale covering historical and
modern instrumental seismicity until present days (ANSS-Advanced National
Seismic System-USA, NEIC – National Earthquake Information Centre, World
Data for Seismology Denver-USA, ISC-International Seismological Centre-UK)
and the catalog of the National Institute for Earth Physics [1].
The seismic zonation of the Eastern part of Romania and the Black Sea Area
was obtained using the distribution map of earthquakes and the map of the zones
with active tectonics [2, 3, 4]. We took into consideration various past seismic
zonation studies carried out in the framework of different projects (SHARE project
– www.share-eu.org, MARINEGEOHAZARD project – www.geohazard-
blacksea.eu, DARING project – http://daring.infp.ro/ and BIGSEES project –
infp.infp.ro/bigsees/default.htm). The seismic source configuration in the Fig. 1 is a
synthesis of all the previous approaches.
The present configuration of the potential seismic sources contains fifteen
crustal and one intermediate-depth seismic sources: Vrancea intermediate-depth
(VRI), Vrancea normal (VN), Barlad Depression (BD), North Dobrogea inland
source, Intramoesian Fault (IMF), North Dobrogea (BS1), Central Dobrogea
(BS2), Shabla (BS3), Istanbul (BS4), North Anatolian Fault (BS5), Georgia (BS6),
Novorossjsk (BS7), Crimeea (BS8), West Black Sea (BS9) and Mid Black Sea
(BS10).
The input parameters describing the seismic sources requested for a
probabilistic evaluation of seismic hazard are given in Table 1. The attenuation
relations of ground motion parameters, macroseismic intensities [5] and PGA
obtained by [6] were adopted for our investigation.

1414 I.A. Moldovan et al. 3
Fig. 1 – The seismic zonation of the Eastern part of Romania and the Black Sea Area.
Table 1
Parameters needed for a probabilistic hazard assessment: geographical distribution, average depth,
minimum and maximum magnitude, activity rate and Gutenberg Richter [7] parameters
Seismic
Sources Coordinates
Average
depth
(km)
M
min
(Mw)
M max
(Mw) b
I
min
I
max bi
i=
=bln10
Seismic
rate
VRI
45.65 26.15
130 5.0
7.9
0.85 4.0
10
0.48 1.12183 1.762380 45.4 26.5
45.85 27.05 7.7 10
46.05 26.6
VN
45.44 25.65
30 3.0
5.9
0.95 2.5
7.0
0.6 1.38155 0.514526 46.22 26.70
45.75 27.90 5.5 6.0
44.90 27.00
BD
46.22 26.70
10 2.5 5.5 0.75 2.0 6.5 0.49 1.12826 1.534712 46.7 26.8
46.6 27.8
45.79 27.66
PD
45.23 27.60
10 3.0 5.5 0.81 3.0 6.5 0.53 1.22405 0.360254 45.75 27.90
45.2 29.3
44.67 28.74
IMF
44.76 26.06
15 3.0 5.4 0.46 3.0 6.5 0.3 0.69077 0.034600 44 27.36
45.14 26.39
44.8 27.33
DUL
44.24 28.22
15 3.0 7.2 0.46 3.0 9.0 0.3 0.69077 0.028000 43.42 28.05
44.00 26.00
43.75 26.20

4 Input parameters for PSHA in East Romania and Black Sea area 1415
Table 1
(continued)
Seismic
Sources Coordinates
Average
depth
(km)
M
min
(Mw)
M max
(Mw) b
I
min
I
max bi
i=
=bln10
Seismic
rate
BS1
45.11 30.55
33 3.0 3.5
Mb=4.7 0.81 2.5 3.5 0.53 1.22405 0.386363
44.56 30.36
44.9 29
45.55 29.6
BS2
44.24 28.22
11 3.0 5.0 0.65 2.5 5.5 0.43 0.99011 0.118644
44.9 29
44.48 30.69
43.77 30.57
43.32 29.56
BS3
44.24 28.22
16.4 3.0 7.2 0.32 2.5 9.0 0.21 0.48354 0.165137 43.32 29.56
43.03 29.39
43.42 28.05
BS4
41.19 28.07
22.1 3.0 6.7 0.53 2.5 8.0 0.35 0.8059 0.47761 42.28 28.72
41.89 31.52
40.94 31.82
BS5
40.93 31.82
14.8 3.0 6.1 0.61 2.5 7.5 0.40 0.92103 0.740741 41.89 31.52
42.77 34.17
40.97 40.92
BS6
41.22 39.99
13.5 3.0 5.5 0.59 2.5 6.5 0.39 0.89800 1.039215 43.17 40.01
42.92 41.83
40.93 41.69
BS7
44.89 35.83
20.8 3.0 5.2 0.75 2.5 6.0 0.50 1.15129 0.59091 45.40 36.70
43.46 40.24
42.96 39.52
BS8
44.09 32.86
22.8 3.0 6.5 0.38 2.5 8.0 0.25 0.57564 0.25301 45.32 32.63
44.83 35.65
43.72 35.06
BS9
45.05 30.77
14.8 3.0 4.9 0.61 2.5 5.5 0.40 0.9163 0.19512 45.69 30.94
45.62 31.71
44.98 31.47
BS10
42.51 30.48
26.9 3.0 3.9 0.72 2.5 4.0 0.48 1.10524 0.25581 44.54 31.26
44.30 32.48
42.40 31.84
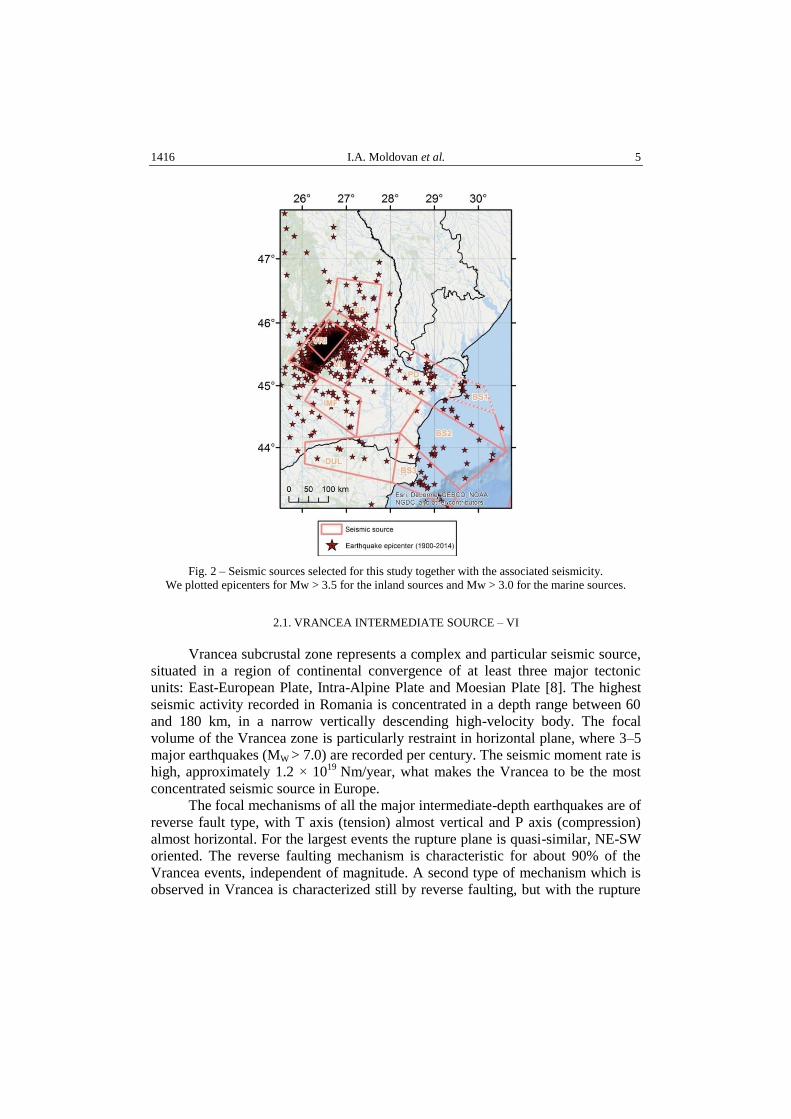
From the total number of seismic sources we selected for hazard estimations nine sources (marked with bold in Table 1 and presented in Fig. 2) since the effects produced by the other seven sources in our study area are negligible.
The parameters of the Gutenberg-Richter distribution (a, b) are compiled for each source. Also we mapped the b values to emphasize the zones with low and high stress, for different time intervals.
1416 I.A. Moldovan et al. 5
Fig. 2 – Seismic sources selected for this study together with the associated seismicity.
We plotted epicenters for Mw > 3.5 for the inland sources and Mw > 3.0 for the marine sources.
2.1. VRANCEA INTERMEDIATE SOURCE – VI
Vrancea subcrustal zone represents a complex and particular seismic source,
situated in a region of continental convergence of at least three major tectonic
units: East-European Plate, Intra-Alpine Plate and Moesian Plate [8]. The highest
seismic activity recorded in Romania is concentrated in a depth range between 60
and 180 km, in a narrow vertically descending high-velocity body. The focal
volume of the Vrancea zone is particularly restraint in horizontal plane, where 3–5
major earthquakes (MW > 7.0) are recorded per century. The seismic moment rate is
high, approximately 1.2 × 10¹⁹
Nm/year, what makes the Vrancea to be the most
concentrated seismic source in Europe.
The focal mechanisms of all the major intermediate-depth earthquakes are of
reverse fault type, with T axis (tension) almost vertical and P axis (compression)
almost horizontal. For the largest events the rupture plane is quasi-similar, NE-SW
oriented. The reverse faulting mechanism is characteristic for about 90% of the
Vrancea events, independent of magnitude. A second type of mechanism which is
observed in Vrancea is characterized still by reverse faulting, but with the rupture

6 Input parameters for PSHA in East Romania and Black Sea area 1417
plane oriented perpendicularly relative to the previous case, NW-SE respectively
[9–12].
The maximum instrumental magnitude is Mw = 7.7 (MGR = 7.5) for the
event of 10.11.1940. The maximum estimated magnitude is attributed to the
historical earthquake of 14.101802: Mw = 7.9 (MGR=7.7). The computation in the
present study are performed for the catalogue starting in 1900. Therefore, we prefer
to consider as maximum magnitude (Table 1) the instrumental magnitude Mw = 7.7
recorded in 1940. The seismic activity rate for earthquakes with 5.0 < Mw < 7.7
is 0 = 1.762380 events/year. The frequency-magnitude distribution for VI,
determined from the 1900–2014 earthquake catalogue, for different magnitude
intervals, is plotted in the Figure 3.
0.0 1.0 2.0 3.0 4.0 5.0 6.0 7.0 8.0
M
0
1
2
3
4
log
(n
um
ar
cu
mu
lati
v d
e c
utr
em
ure
)
Zona subcrustala Vrancea
0.0 1.0 2.0 3.0 4.0 5.0 6.0 7.0 8.0
M
0
100
200
300
400
500
600
700
nu
mar
de c
utr
em
ure
M =2.8c
catalogul dupa 1900
W
W
0.0 1.0 2.0 3.0 4.0 5.0 6.0 7.0 8.0
M
0
1
2
3
4lo
g (
nu
mar
cu
mu
lati
v d
e c
utr
em
ure
)
Zona subcrustala Vrancea
0.0 1.0 2.0 3.0 4.0 5.0 6.0 7.0 8.0
M
0
100
200
300
400
500
600
700
nu
mar
de c
utr
em
ure
M =2.8c
catalogul dupa 1900
W
W
Fig. 3 – The frequency-magnitude distribution for VI zone:
a) non-cumulative; b) cumulative; MW ≥ 2.8 – blue line, MW ≥ 5.0 – red line.
Two regression lines are computed for the decay of the cumulative
distribution, for two threshold magnitudes, MW = 2.8 and MW = 5.0:
VRI-1900, Mc = 2.8, log Nc = –(0.76 ± 0.01)MW + (5.90 ± 0.08), blue line (1)
R = 0.997, σ = 0.09
VRI-1900, Mc = 5.0, log Nc = –(0.85 ± 0.02)MW + (6.49 ± 0.14), red line (2)
R = 0.997, σ = 0.06
The frequency-epicentral intensity distribution (needed in the hazard
assessment program) was obtained from equation (2) and Mw = 0.58I0 + 2.08,
lgNcum = –0.493*Io + 4.722. The used intensity interval is [5.0, 10.0] and
a = 4.722, b = 0.4872. The i value was computed from the intensity – frequency
distribution, using the relation: β ln10i b . We obtained: = 0.4872*2.3026 =
= 1.12183.
Log
(cu
mm
ula
tive
nu
mber
of
ear
thq
uak
es)
Nu
mber
of
ear
thqu
akes

1418 I.A. Moldovan et al. 7
2.2. VRANCEA CRUSTAL EARTHQUAKES – VN
The seismic activity in the Vrancea in the crustal domain (VN) is located in
front of the South-Eastern Carpathians arc, spread over a stripe area delimited to
the north by the Peceneaga-Camena fault and to the south by the Intramoesian
fault. The seismicity is more diffuse than for the subcrustal source and consists
only of moderate-magnitude earthquakes (Mw < 6.0) generated frequently in
clusters, localized in the eastern part (seismic sequences of Râmnicu Sarat area)
and in the northern part (seismic swarms in the Vrincioaia area and seismic
sequences north of Focşani). The catalogue contains only two earthquakes with
magnitude above 5.0: one occurred on March 1, 1894 of Mw = 5.9, with magnitude
estimated from historical information (possibly overestimated), and the most recent
one, of November 22, 2014, with Mw = 5.7.
The rate of the seismic moment release, Mo = 5.3 × 10¹⁵
Nm/year, is four
orders of magnitude less than the moment rate characteristic for the Vrancea
intermediate-depth domain. The analysis of the fault plane solutions shows a
complex stress field in the Vrancea crust, like a transition zone from the
compressional regime at subcrustal depths to extensional regime characteristic for
the entire Moesian Platform. The largest earthquakes, for which the fault plane
solutions could be relatively well constrained, are the main shocks of the sequences
occurred between 1983 and 2014.
The frequency-magnitude distribution for VN, determined from the 1900-
2014 earthquake catalogue, for different magnitude intervals, is plotted in the
Fig. 4 and the equations for the regression lines are given below (equations 5, 6).
0.0 0.5 1.0 1.5 2.0 2.5 3.0 3.5 4.0 4.5 5.0 5.5 6.0
M
0
100
200
300
400
500
600
Nu
mb
er
of
ea
rth
qu
ak
es
0.0 0.5 1.0 1.5 2.0 2.5 3.0 3.5 4.0 4.5 5.0 5.5 6.0
M
0
1
2
3
4
log
(c
um
ula
tiv
e n
um
be
r o
f e
art
hq
ua
ke
s)
Fig. 4 – The frequency-magnitude distribution for VN zone: a) non-cumulative; b) cumulative.
EV–1900, Mc = 2.2–5.5, log Nc=–(1.02 ± 0.04)MW + (5.45 ± 0.23), green line (5)
R = 0.99, σ = 0.16
EV–1900, Mc = 3.0–5.5, log Nc = –(0.95 ±0.05)MW + (5.10 ±0.21), blue line (6)
R = 0.98, σ = 0.14

8 Input parameters for PSHA in East Romania and Black Sea area 1419
The frequency-epicentral intensity distribution obtained from Eq. 6 and
Mw = 0.66 Io+1.23 [12] is: lg Ncum = –0.6*Io+3.98. From the above equations we
obtain: ai = 3.98 and bi = 0.6 and = 1.38155.
2.3. BARLAD DEPPRESSION – BD
Barlad Deppression (BD), situated NE of the Vrancea zone, is
characterized only by moderate size events (only four shocks with Mw > 5.0, but
not exceeding Mw = 5.5). Having in mind that from seismotectonic point of view
the Barlad Depression belongs to the Scythian platform as well as the
Predobrogean Depression (Mutihac and Ionesi, 1974), we considered for both
zones the same maximum magnitude, respectively the maximum observed one,
MW = 5.5.
The frequency-magnitude distribution for BD, determined from the 1900–
2014 earthquake catalogue, for different magnitude intervals, is plotted in Fig. 5,
and equations of the regression lines are given below (relations 7 and 8).
0.0 0.5 1.0 1.5 2.0 2.5 3.0 3.5 4.0 4.5 5.0 5.5 6.0
M
0
50
100
150
Ea
rth
qu
ak
e n
um
be
r
0.0 0.5 1.0 1.5 2.0 2.5 3.0 3.5 4.0 4.5 5.0 5.5 6.0
M
0
1
2
3
4
log
(e
art
hq
ua
ke
cu
mm
ula
tiv
e n
um
be
r)
Fig. 5 – The frequency-magnitude distribution for BD zone: (a) non-cumulative; (b) cumulative.
BD–1900 Mc = 2.2–5.8, log Nc = –(0.84 ± 0.05)MW + (4.49 ± 0.19) (black line)(7)
R = 0.98, σ = 0.18
BD–1900 Mc = 3.1–5.8, log Nc = –(0.75 ± 0.07)MW + (4.08 ± 0.30) (red line) (8)
R = 0.97, σ = 0.18
The frequency-epicentral intensity distribution obtained from Eq. 8 and
Mw = 0.66 Io + 1.23 [12] is: lg Ncum = –0.495*Io + 3.227. From the above
equations we obtain: a = 3.227 and b = 0.495 and = 1.12826.
2.4. PREDOBROGEAN DEPPRESSION – PD
North Dobrogea (PD) zone belongs to the Alpine tectonic unit. The Sfantul
Gheorghe fault represents the Northen limit of the PD seismogenic source. Only

1420 I.A. Moldovan et al. 9
moderate-size events are observed (Mw < 5.3) clustered especially along Sfantul
Gheorghe fault. The fault plane solutions reflect the existence of the extensional
regime of the deformation field. In our opinion this consistently reflects similarities
of the North Dobrogea with the Scythian platform tectonic unit.
The rate of the seismic moment release is Mo = 1.8 * 1015 Nm/year. The
maximum observed magnitude for the North Dobrogea inland crustal zone is
Mw = 5.3, assigned to the event occurred on February 11, 1871. The seismic
activity for events with Mw > 3.0 is ν0 = no. of seismic events/T(years) = 0.36
seismic events/year. Considering that from seismotectonic point of view the North
Dobrogea crustal source presents the same seismological characteristics with
Barlad Depression we considered the observed maximum magnitude for both
zones, Mw = 5.5. For Northern Dobrogea zone the frequency-magnitude
distributions, was estimated for different magnitude intervals and in relation 9 is
presented only the one for Mc=3.0, computed from the cataloque from 1900 to
2014:
PD–1900 Mc = 3.0, log Nc = –(0.81 ±0.05)MW + (4.23 ±0.25) blue line (9)
R = 0.97, σ = 0.16
The frequency-epicentral intensity distribution obtained from equation
(9) and Mw = 0.66 Io+1.23 [12] is: lg Ncum = –0.5346*Io+3.234. The resulted
Gutenberg-Richter parameters are: a = 3.234 and b = 0.5346 and = 1.22405.
2.5. THE INTRAMOESIAN FAULT AND DULOVO ZONE – IMF-DUL
The Intramoesian fault (IMF) crosses the Moesian platform in a SE-NW
direction, separating two distinct sectors with different constitution and structure of
the basement. Although it is a well-defined deep fault, reaching the base of the
lithosphere [13], and extends southeast to the Anatolian fault region [14], the
associated seismic activity is scarce and weak. Geological and geotectonic data
indicate only a relatively small active sector in the Romanian Plain, situated to the
NE from Bucharest.
The geometry of the Intramoesian fault source and the distribution of the
earthquakes with MW 3.0 occurred between 1892 and 2001 (30 events) are
presented in Fig. 1. The magnitude domain of earthquakes is Mw[3.0, 5.4]. The
maximum magnitude was recorded in January 4, 1960 (Mw = 5.4) in the central
part of the Romanian Plain. The seismic activity for events with Mw>3.0 is ν0 = no.
of seismic events/T(years) = 0.034600 seismic events/year.
A significant increase of seismicity is observed in the Dulovo (DU) zone and
Shabla zone (BS3, NE Bulgaria), where an earthquake with an estimated

10 Input parameters for PSHA in East Romania and Black Sea area 1421
magnitude of Mw = 7.2 occurred in 1901. The focal depth, whenever it can be
constrained, has relatively large values (h ~ 35 km), suggesting active processes in
the lower crust or in the upper lithosphere.
Fig. 1 presents the geometry of these two sources located in Bulgaria and the
distribution of the earthquakes with MW 3.0 occurred between 1892 and 2001 (20
events). The magnitude domain of earthquakes is Mw[3.0, 7.2]. We assumed the
same maximum magnitude (Mw = 7.2) for both sources. The greatest magnitudes
are attributed to the historical earthquakes of October, 14, 1892 (Mw = 6.5) and
March, 31, 1901 (Mw = 7.2), while no event with magnitude greater than 5 was
reported after 1950 since the instrumental earthquake monitoring has become
operational.
The seismic activity for events with Mw > 3.0 is ν0 = no. of seismic
events/T(years) = 0.028000 seismic events/year for Dulovo. The frequency-
magnitude distribution for Intramoesian fault – Dulovo crustal sources,
determined for the magnitude interval [4.5, 7.2], is presented in relation (10).
DUIM 1900 Mc = 4.5, log Nc = –(0.46 ± 0.02)MW + (3.21 ± 0.10), R = 0.98,
σ = 0.07 (10)
The frequency-epicentral intensity distribution obtained from Eq. 10 and
Mw = 0.66 Io+1.23 [12] is: lg Ncum = –0.3*Io + 2.6442. From the above equations
we obtain: ai = 2.6442 and bi = 0.3 and = 0.69078 (Table 1).
2.6. BLACK SEA SEISMIC SOURCE NO.1. NORTH DOBROGEA – BS1
The earthquakes in the North Dobrogea are associated to the prolongation of
Peceneaga-Camena, Sf. Gheorghe and Sulina Faults. Some of the earthquakes
belong to the Lacu Rosu fault as well. The maximum observed magnitude for
1967–2007 period in North Dobrogea was mb = 4.7 (7 July 2005). Applying the
practice of increment on the maximum observed magnitude we obtain the expected
value of the maximum possible magnitude to be mb = 5.2/Mw = 4.0 with an error
value of ±0.1. The average depth is 33 km. For seismic hazard purposes the
minimum magnitude was considered m0 = 3.0 (Mw). The seismic activity ν0 = no.
of seismic events/T(years) = 0.425 seismic events/year. The Gutenberg-Richter
values are assumed to be the same as the values of PD zone, because BS1 is
included in PD.
2.7. BLACK SEA SEISMIC SOURCE NO.2. CENTRAL DOBROGEA – BS2
Seismic source cover all the seismic events occurred within 543–2014 time
interval. The earthquakes in this area are associated to the prolongations of
Capidava – Ovidiu fault and Horia – Pantelimonul de Sus fault in the Black sea
shelf. The 118 years catalogue (1892–2010), contains 336 earthquakes with

1422 I.A. Moldovan et al. 11
Mw > 0.5, but only 14 events with Mw ≥ 3. In this area there are numerous active
quarries which disturb in a way the local seismicity caused by tectonic events in the
low magnitude range (Mw be1low 2). The maximum observed magnitude in
Central Dobrogea was Mw = 5 (12.12.1986). Applying the practice of increment on
the maximum observed magnitude, the expected value of the maximum possible
magnitude is considered to be Mw.max= 5.2 with an error value of ± 0.1. For Central
Dobrogea, the minimum magnitude was considered m0 = 3.0 (Mw). The seismic
activity ν0 = no. of seismic events/T(years) = 14 seismic events/118
years = 0.118644 seismic events/year. The average depth is 11 km.
The Gutenberg-Richter frequency-magnitude distribution for S2,
determined for magnitudes Mw between 3.0 and 5.0 intervals, is presented in
relation 11 and plotted in Figures 6.
log Nc = –(0.65 ± 0.06)M + (3.15 ± 0.25), 3.0 < M < 5.0 (11)
R = 0.98, σ = 0.10
0 1 2 3 4 5
M
0
10
20
30
40
50
60
70
Ea
rth
qu
ake
nu
mb
er
N
M =2.2c
0 1 2 3 4 5
M
0
1
2
3
log
Nc (
cu
mu
lativ n
um
be
r o
f e
art
hq
ua
ke
s)
Fig. 6 – The frequency-magnitude relations for BS2 with MW ≥ 3.0; a) non-cumulative;
b) cumulative.
The frequency-epicentral intensity distribution obtained from Eq. 11 and
Mw = 0.66 Io+1.23 [12] is: lg Ncum = –0.5346*Io + 3.234. From the above
equations we obtain: ai = 2.3505 and bi = 0.429 and = 0.99011 (Table 1).
2.8. BLACK SEA SEISMIC SOURCE NO. 3. SHABLA – BS3
The Shabla seismic area, located in Bulgaria, belongs from tectonic point of
view to the south edge of Moesian Platform. The earthquakes recorded in the
Shabla – Cap Kaliakra area have the foci located along a NE-SW alignment. This
active tectonic area is the north-east border of major crustal foci which is
developed collateral by Black Sea, with NE-SW direction and which sinks in
Burgas area. The foci of Shabla source have limited development, the active sector
having 20–25 km length with 15 earthquakes of Mw ≥ 4. The distribution of

12 Input parameters for PSHA in East Romania and Black Sea area 1423
epicenters marks the coupling between existent structural lines in the Shabla area,
where the powerful earthquake of magnitude 7.2 occurred on 31.03.1901. For
seismic hazard assessment we used from a 113-year catalogue (1901–2014),
containing 37 earthquakes with Mw > 1.1, only 19 events with Mw > 3.0 (Table 4).
The average depth is 16.4 km. The minimum magnitude was considered m0 = 3.0
(Mw). Seismic activity ν0 = no. of seismic events/T (years) = 0.165137 seismic
events/year.
The Gutenberg-Richter frequency-magnitude distribution for S3,
determined for magnitudes Mw between 3.0 and 7.2, is presented in relation 12 and
plotted in Figures 7.
M =2.2c
0.0 0.5 1.0 1.5 2.0 2.5 3.0 3.5 4.0 4.5 5.0 5.5 6.0 6.5 7.0 7.5
M
1
2
3
Ea
rth
qu
ake
nu
mb
er
N
0.0 0.5 1.0 1.5 2.0 2.5 3.0 3.5 4.0 4.5 5.0 5.5 6.0 6.5 7.0 7.5
M
0
1
2lo
g N
c (
cu
mu
lativ n
um
be
r o
f e
art
hq
ua
ke
s)
Fig. 7 – The frequency-magnitude distribution for BS3 zone The frequency-magnitude relations
for with MW ≥ 3.0; a) non-cumulative; b) cumulative.
BS3 3.0 < M < 7.2, log Nc = –(0.32±0.02)M + (2.13 ± 0.11), R = 0.97, σ = 0.11
(12)
The frequency-epicentral intensity distribution obtained from Eq. 12 and
Mw = 0.66 Io+1.23 (Radu, 1979) is: lg Ncum = –0.2112*Io + 1.7364. From the
above equations we obtain: ai =1.7364 and bi = 0.2112 and = 0.48631 (Table 1).
3. THE ASSESSMENT OF SEISMIC HAZARD USING THE PROBABILISTIC APPROACH
APPLIED ONLY FOR CRUSTAL SOURCES
With the input parameters as defined in Table 1 for the nine selected sources
which likely affect the chosen area we computed seismic hazard values for two
return periods (100 and 475 years) and in terms of Modified Mercalli Intensity
(IMM). The computations were performed on a grid of 0.25o × 0.25
o cell, covering
the whole area. The hazard maps obtained when considering only the seismic
sources in the crust, in terms of PGA/IMM are presented in the Fig. 8 for 100 years
return period and Fig. 9 for 475 years return period.

1424 I.A. Moldovan et al. 13
26 26.5 27 27.5 28 28.5 29 29.5 30 30.5
43
43.5
44
44.5
45
45.5
46
46.5
47
47.5
26 26.5 27 27.5 28 28.5 29 29.5 30 30.5
43
43.5
44
44.5
45
45.5
46
46.5
47
47.5
26 26.5 27 27.5 28 28.5 29 29.5 30 30.5
43
43.5
44
44.5
45
45.5
46
46.5
47
47.5
26 26.5 27 27.5 28 28.5 29 29.5 30 30.5
43
43.5
44
44.5
45
45.5
46
46.5
47
47.5
Seismic Hazard for Crustal Sources for Tr=100 years (I=VI and 0.026g....0.050g)
0
0.1
0.2
0.3
0.4
0.5
0.6
0.7
0.8
0.85
0.9
0.95
1
Seismic Hazard for Crustal Sources for Tr=100 years (I=V and 0.012g....0.025g)
Fig. 8 – Seismic hazard for Tr = 100 years for I = V and I = VI (using only crustal sources).
26 26.5 27 27.5 28 28.5 29 29.5 30 30.5
43
43.5
44
44.5
45
45.5
46
46.5
47
47.5
26 26.5 27 27.5 28 28.5 29 29.5 30 30.5
43
43.5
44
44.5
45
45.5
46
46.5
47
47.5
26 26.5 27 27.5 28 28.5 29 29.5 30 30.5
43
43.5
44
44.5
45
45.5
46
46.5
47
47.5
26 26.5 27 27.5 28 28.5 29 29.5 30 30.5
43
43.5
44
44.5
45
45.5
46
46.5
47
47.5
Seismic Hazard for Crustal Sources for Tr=475 years (I=VI)
0
0.025
0.05
0.1
0.2
0.3
0.4
0.5
0.6
0.7
0.8
0.9
0.95
Seismic Hazard for Crustal Sources for Tr=475 years (I=V)
Fig. 9 – Seismic hazard for Tr = 475 years for I = V/ a = 0.012g....0.025g
and I = VI/ a = 0.026g....0.050g (using only crustal sources).
In Figs. 8 and 9 are also highlighted the hazard values in the nodes of the
grid covering the studied area. The conversion between macroseismic intensities
and peak ground motion was taken from STAS 3684-71.
4. CONCLUSIONS
This work is a useful tool for the assessment of the seismic risk and
implementation of antiseismic protection measures in the case of special

14 Input parameters for PSHA in East Romania and Black Sea area 1425
constructions and strategic objectives, such as, nuclear power plants, large cities
situated in the cross-border area, harbors and hydro-energetic large constructions.
Acknowledgements. This work was partially supported by the Partnership in Priority Areas
Program – PNII, under MEN-UEFISCDI, DARING Project no. 69/2014, and FP7 FP7-ENV2013 6.4-
3 Project number: 603839/2013, ASTARTE/PNII, Capacity Module III Project 268/2014 and FP7
SciNetNatHaz 2012–2015.
REFERENCES
1. M.C. Oncescu et al., Romplus catalog-updated until 2010 by the department of Data
Acquisition of the NIEP-Bucharest (1989).
2. M. Radulian, N. Mândrescu, G. Panza, E. Popescu, A. Utale, Characterization of seismogenic
zones of Romania, Pure Appl. Geophys., 157, 57-77 (2000).
3. I.A. Moldovan, E. Popescu, A. Constantin. Probabilistic seismic hazard assessment in
Romania: Application for crustal seismic active zones, Rom. Journ. Phys., 53 (3-4), 575-591
(2008).
4. I.A. Moldovan, A.P. Constantin, E. Popescu, A.O. Placinta, Earthquake risk classes for dams
situated in the South-Western part of Romania (Danube, Olt, Jiu and Lotru Rivers), Rom.
Journ. Phys., 64, 591-608 (2012).
5. M. Rogozea, Gh. Marmureanu, M. Radulian, D. Toma, Reevaluation of the macroseismic
effects of the 23 January 1838 Vrancea earthquake, Rom. Rep. Phys., 66, 2, 520-538 (2014).
6. I.A. Moldovan. Statistical methods and models in seismology with applications in the complex
study of earthquakes from different zones of Romania, Morosan Publishing House, pp. 236,
Bucharest, (in Romanian) (2007).
7. B. Gutenberg, C.F. Richter, Magnitude and energy of earthquakes, Ann. Geophys., 9, 1-15
(1956).
8. Bala, V. Raileanu, C. Dinu, M. Diaconescu, Crustal seismicity and active fault systems in
Romania, Rom. Rep. Phys., 67, 1176-1191 (2015).
9. D., Enescu, Contributions to the knowledge of the focal mechanism of the Vrancea strong
earthquake of March 4, 1977, Rev. Roum. de Géoph., 24, 1, 3-18 (1980).
10. D., Enescu, D., Zugrăvescu, Geodynamic considerations regarding the Eastern Carpathians
Arc Bend, based on studies on Vrancea earthquakes, Rev. Roum. Geophysique 34, 17-34
(1990).
11. Oncescu M.C., Trifu C.I., Depth variation of moment tensor principal axes in Vrancea
(Romania) seismic region, Ann. Geophys. 5B, 149-154 (1987).
12. C. Radu, Catalogue of strong earthquakes occurred on the Romanian territory. Part I – before
1901; Part II – 1901-1979, in I. Cornea and C. Radu (eds), Seismological Studies on the March
4, 1977 Earthquake, Bucharest, pp. 723-752 (1979).
13. D., Enescu, B.D., Enescu, Contributions to the Knowledge of the Genesis of the Vrancea
(Romania) Earthquakes, Rom. Rep. Phys. 45, 777-796 (1993).
14. M. Sandulescu, Geotectonics of Romania. Ed. Tehnica, Bucuresti, p. 334 (in Romanian) (1984).