Embed Size (px)
Citation preview
EXPERIMENTAL AND NUMERICAL INVESTIGATION ON FOULING
PARAMETERS IN A SMALL-SCALE ROTATING UNIT
A Thesis
by
MATTHEW RYAN LANE
Submitted to the Office of Graduate Studies of
Texas A&M University
in partial fulfillment of the requirements for the degree of
MASTER OF SCIENCE
Chair of Committee, J.C. Han
Committee Members, LiDong Huang
Eric Petersen
Marvin Adams
Head of Department, Andreas Polycarpou
August 2013
Major Subject: Mechanical Engineering
Copyright 2013 Matthew Ryan Lane
brought to you by COREView metadata, citation and similar papers at core.ac.uk
provided by Texas A&M University
ii
ABSTRACT
Fouling, a problem since the first heat exchanger was created, has been the focus of
various studies since the 1970s. In particular, crude oil fouling is a costly and
problematic type of heat exchanger fouling that occurs in the preheat train to the
atmospheric distillation column in petroleum refineries. Previous experiments have been
designed to determine the causes of fouling using less than one gallon of crude oil and
accumulating test results within a day. These experiments will be the basis of the
Rotating Fouling Unit (RFU) at Heat Transfer Research Inc. (HTRI). The RFU focuses
on better controlling the shear stress and heat transfer distribution along the surface of
the heated test section by analyzing Taylor-Couette flow experiments and using them as
a basis to better predict the flow across the heated surface of the test section in the RFU.
Additionally, the equations for Taylor-Couette flow are used to verify the 2D flow
simulations of the RFU to ensure the accuracy of the results. The design of the RFU
incorporates data acquisition with a variety of measurements that will facilitate
automatic and accurate data collection, so the results can be easily compared to previous
fouling experiments. The RFU will act as a supplement to the High Temperature Fouling
Unit (HTFU) at HTRI, and provide data comparable to that of the HTFU in order to
better understand crude oil fouling. Computer simulations can accurately predict the
shear stress and heat transfer coefficient along the surface of the test probe and help
verify the improvements made to the original batch stirred cell designs.

iii
ACKNOWLEDGMENTS
I would like to thank the people at HTRI for providing me with the unique opportunity
of working part-time and performing my research at their facilities while attending
classes at Texas A&M University. I will forever be grateful for the once in a lifetime
experience.
Specifically, I would like to thank Dr. LiDong Huang for overseeing my work at HTRI.
His support and guidance and constructive criticism allowed me to enhance my skills as
an engineer and to achieve the goals set forth.
I would also like to thank James Schaefer for his extensive help in designing the unit
from the start to the finish. Without his input, I never would have been able to finish in a
timely manner. I would like to thank Salem Bouhairie for all of his help in CFD studies.
Thanks also goes out to the technicians and other staff at the HTRI Research and
Technology Center (RTC) that helped construct the unit and get it up and running. A big
thanks goes to Kevin Farrell for seeing potential in me and always encouraging me
throughout the process.
Also, I would like to thank the members of my committee: Dr. Petersen, Dr. Adams, and
my chair, Dr. Han, for their guidance and support.
Lastly, I would like to thank my parents, who have pushed me to give my all in
everything I set forth to accomplish. Without their unending support, none of this would
have been possible.
iv
NOMENCLATURE
As Surface area m2
c2 Shear stress coefficient —
Cw Axial flowrate coefficient —
Dh Hydraulic diameter m
d Gap size m
h Heat transfer coefficient W/m2 K
k Thermal conductivity of fluid W/m K
Ls Shared length between inner and outer cylinders m
l Length of stirring shaft m
Nu Nusselt number —
P Pressure Pa
Pr Prandtl number —
Q Heat duty W
q Heat flux W/m2
Re Reynolds number —
Recrit Critical Reynolds number
Rf Fouling resistance m2
K/W
Ri Inner radius of gap m
Ro Outer radius of gap m
v
rpm Rotations per minute rpm
Rshaft Radius of shaft
T Torque N/m
Ta Taylor number —
Tb Bulk temperature K
Tinlet Inlet bulk temperature K
Ts Surface temperature K
Twin Inlet wall temperature K
t Time s
ui Velocity of inner radius m/s
uo Velocity of outer radius m/s
*u Friction velocity m/s
y Distance to the nearest well m
y+ Non-dimensional length scale —
Ratio of radii —
μ Viscosity of fluid N s/m2
ν Kinematic viscosity of fluid m2/s
ρ Density kg/m3
τω Shear stress on wall Pa
ω Rotational velocity rad/s

vi
ωi Rotational velocity of inner cylinder rad/s
ωo Rotational velocity of outer cylinder rad/s
vii
TABLE OF CONTENTS
Page
ABSTRACT .......................................................................................................................ii
ACKNOWLEDGMENTS ................................................................................................ iii
NOMENCLATURE .......................................................................................................... iv
TABLE OF CONTENTS .................................................................................................vii
LIST OF FIGURES ........................................................................................................... ix
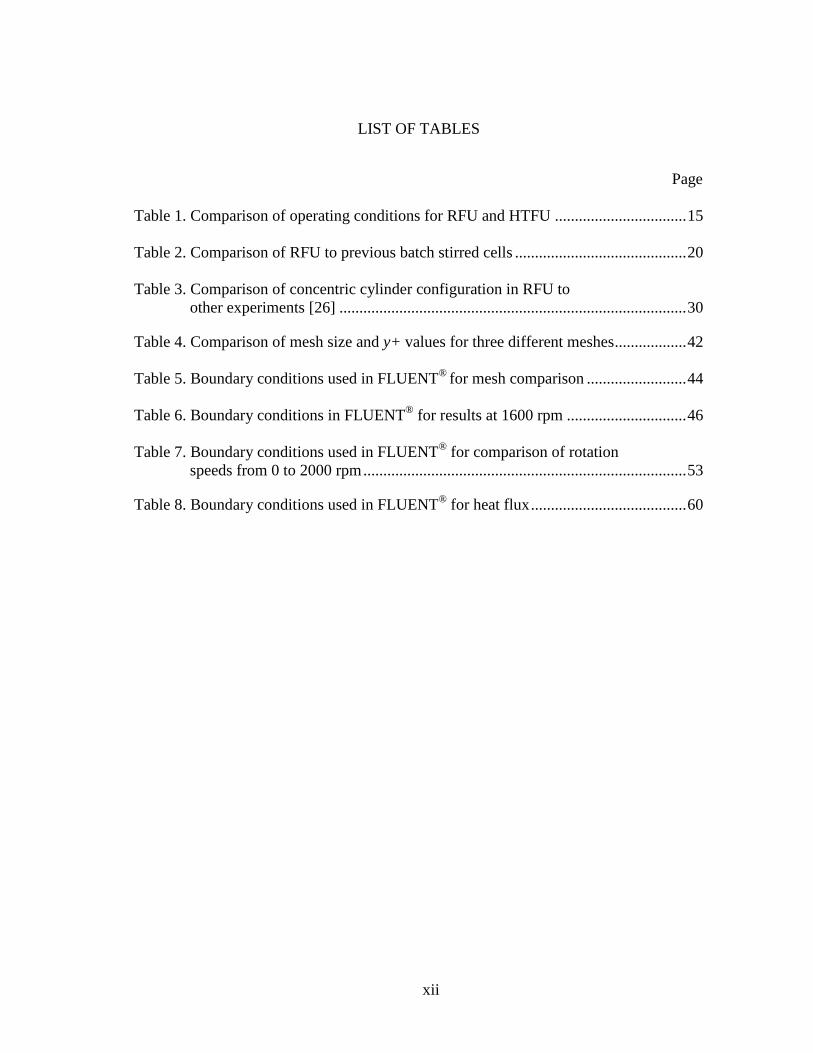
LIST OF TABLES ...........................................................................................................xii
1. INTRODUCTION .......................................................................................................... 1
2. RELEVANT PREVIOUS UNITS ................................................................................. 5
2.1. HTFU ................................................................................................................. 5
2.2. Smaller scale fouling apparatuses ...................................................................... 8
3. DESIGN OF ROTATING FOULING UNIT (RFU) ................................................... 15
3.1. Heated probe .................................................................................................... 16
3.2. Rotating hollow cylinder ................................................................................. 19
3.3. Remaining parts of the RFU ............................................................................ 20
4. VALIDATION OF DESIGN: SHEAR STRESS ......................................................... 24
5. VALIDATION OF DESIGN: HEAT TRANSFER COEFFICIENT .......................... 32
6. USE OF CFD FOR MODELING THE RFU ............................................................... 39
6.1. Geometry of the RFU using DesignModeler ................................................... 39
6.2. Mesh of the RFU using ANSYS Mesh®
.......................................................... 41
6.3. Results from the CFD at 1600 rpm .................................................................. 46
6.4. Comparison of results at varying rpm ............................................................. 52
6.5. Comparison of the results at varying heat flux from the cartridge heater ....... 59
7. CONCLUSIONS .......................................................................................................... 66

viii
REFERENCES ................................................................................................................. 68
ix
LIST OF FIGURES
Page
Figure 1. Diagram of flow through annular test section [9] ............................................... 6
Figure 2. Cross section of heated portion with four thermocouples [9] ............................. 7
Figure 3. Side view of tubular test section of HTFU [8] .................................................... 8
Figure 4. Test section of Alcor® unit with annular flow through a gap of 0.5 mm [7] ...... 9
Figure 5. High temperature organic fluid fouling unit [17] ............................................. 10
Figure 6. Simplified drawing of batch stirred cell ........................................................... 11
Figure 7. Heated probe used in Crittenden’s batch stirred cell [16]................................. 14
Figure 8. Dimensioned drawing of new heated probe for RFU (cm)............................... 17
Figure 9. Cross section view of heated section of probe .................................................. 18
Figure 10. Dimensioned drawing of rotating hollow cylinder (mm) ............................... 19
Figure 11. Final design of RFU from Parr Instruments ................................................... 21
Figure 12. P&ID of RFU and cooling loop ...................................................................... 23
Figure 13. Standard setup of Taylor-Couette Flow .......................................................... 24
Figure 14. Critical speeds for transition from laminar to turbulent in
Taylor-Couette flow ....................................................................................... 26
Figure 15. Onset of turbulence in Taylor Couette flow ................................................... 27
Figure 16. Original setup of Taylor-Couette flow [21] .................................................... 28
Figure 17. Experimental setup used by Bagnold [26] ...................................................... 29
Figure 18. Comparison of laminar and turbulent CFD simulations to
laminar and turbulent formulas of Taylor-Couette flow with
rotating outer cylinder and stationary inner cylinder ..................................... 31
x
Figure 19. Flow through a pipe ........................................................................................ 33
Figure 20. Taylor-Couette flow setup for Lee’s experiment ............................................ 34
Figure 21. Taylor-Couette-Poiseuille flow for Poncet’s experiment ............................... 35
Figure 22. Annular flow used in Donne’s experiment ..................................................... 35
Figure 23. Comparison of Nusselt Number from CFD and multiple
reference equations ......................................................................................... 36
Figure 24. Geometry of RFU used in CFD simulations ................................................... 40
Figure 25. Side-by-side view of the three meshes zoomed in at the gap
between cylinders ........................................................................................... 42
Figure 26. Comparison of the shear stress along the heated section of the
probe for three meshes ................................................................................... 45
Figure 27. Comparison of the heat transfer coefficient along the heated
section of the probe for three meshes ............................................................. 45
Figure 28. Axial velocity contour plot of the RFU at 1600 rpm (m/s)............................. 47
Figure 29. Tangential velocity contour plot of the RFU at 1600 rpm (m/s) .................... 48
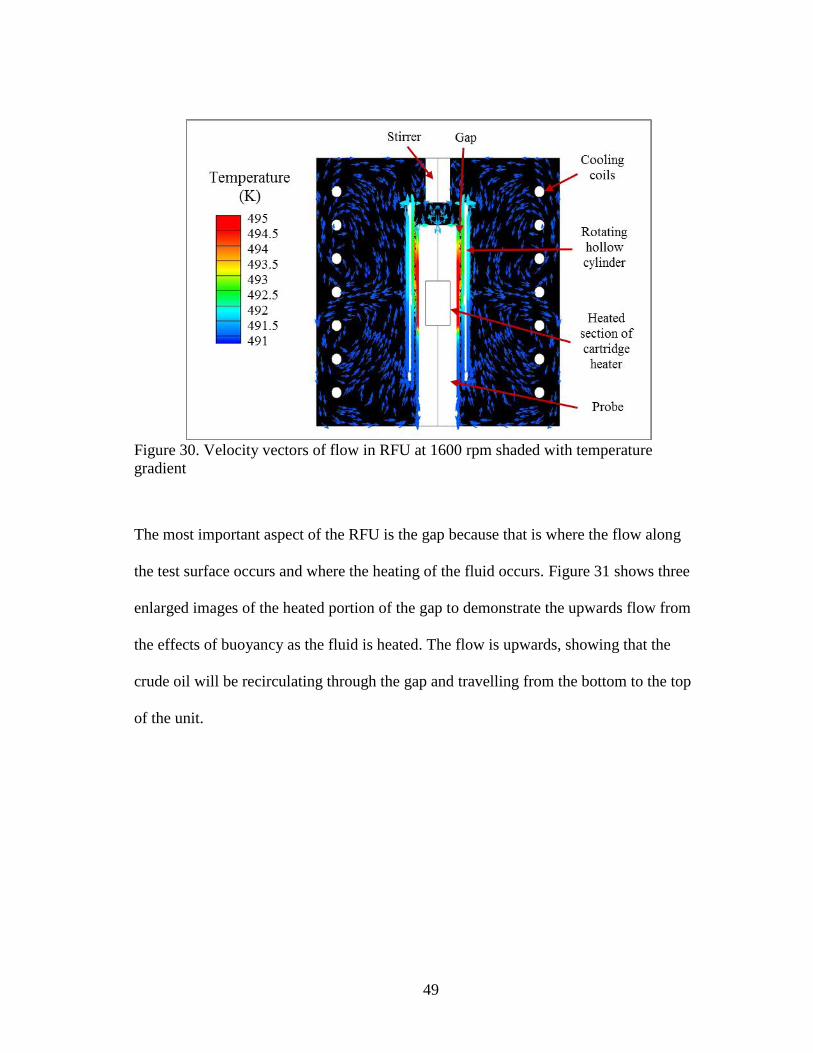
Figure 30. Velocity vectors of flow in RFU at 1600 rpm shaded with
temperature gradient (K) ................................................................................ 49
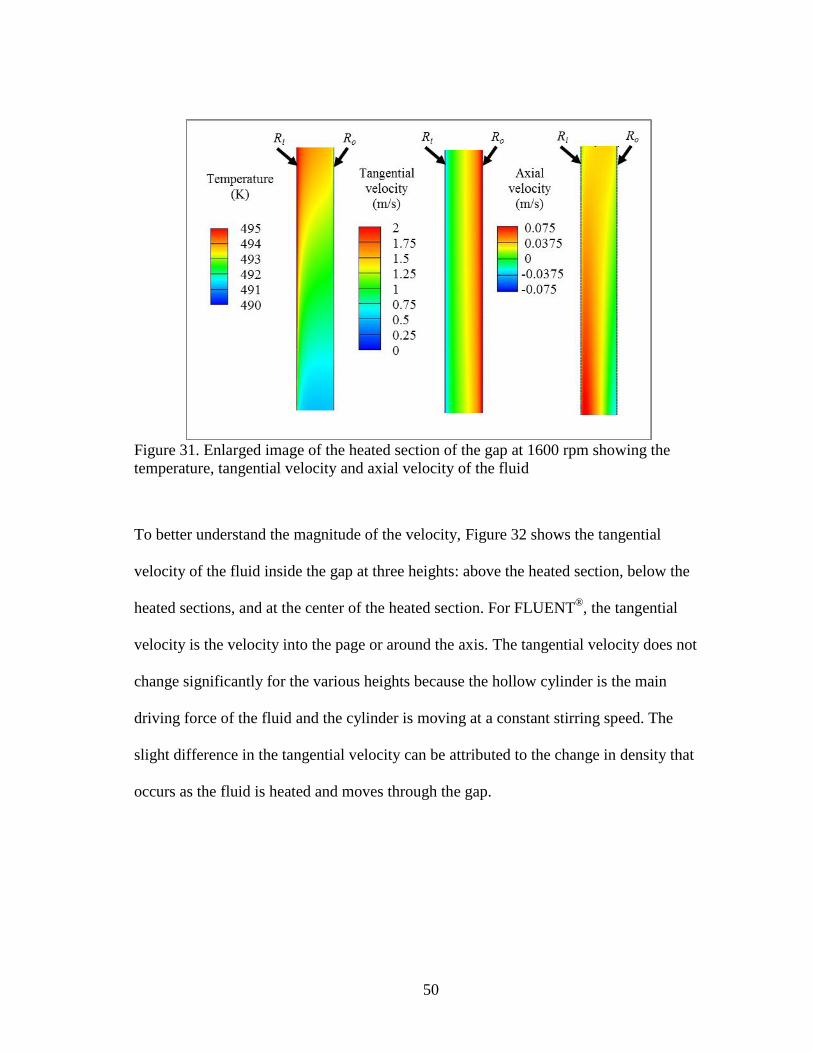
Figure 31. Zoomed in image of the heated section of the gap at 1600 rpm
showing the temperature, tangential velocity and axial velocity
of the fluid ...................................................................................................... 50
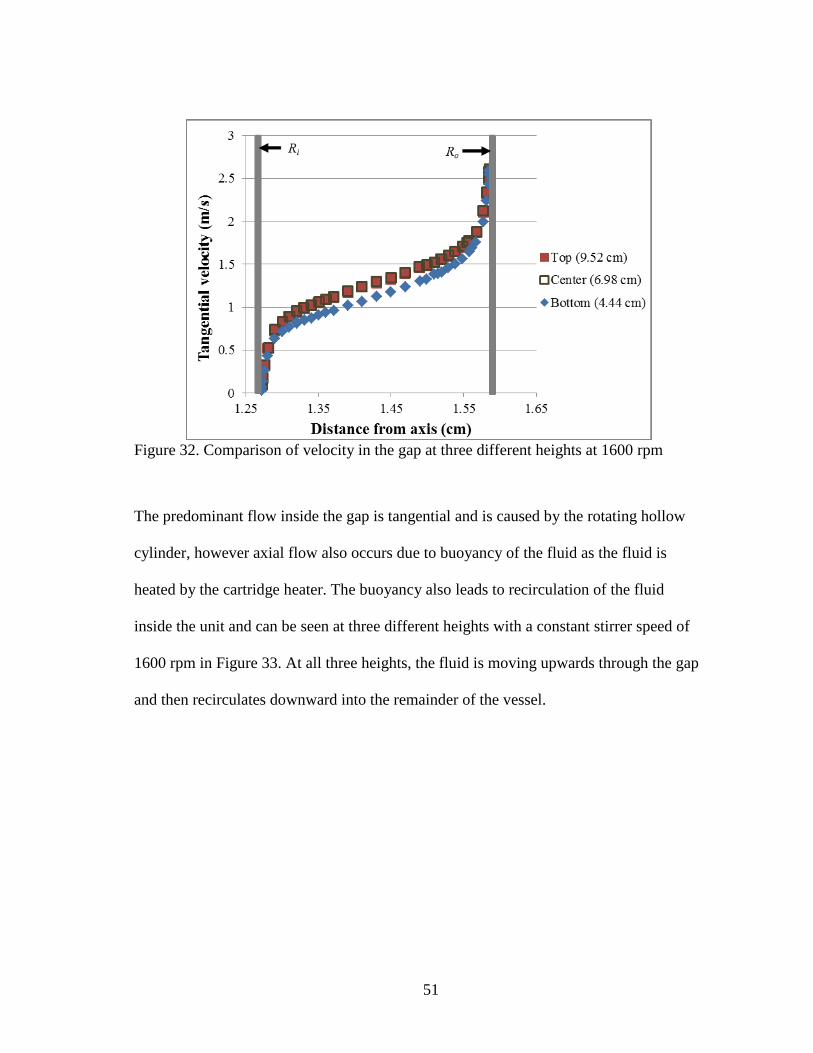
Figure 32. Comparison of velocity in the gap at three different heights at 1600 rpm ..... 51
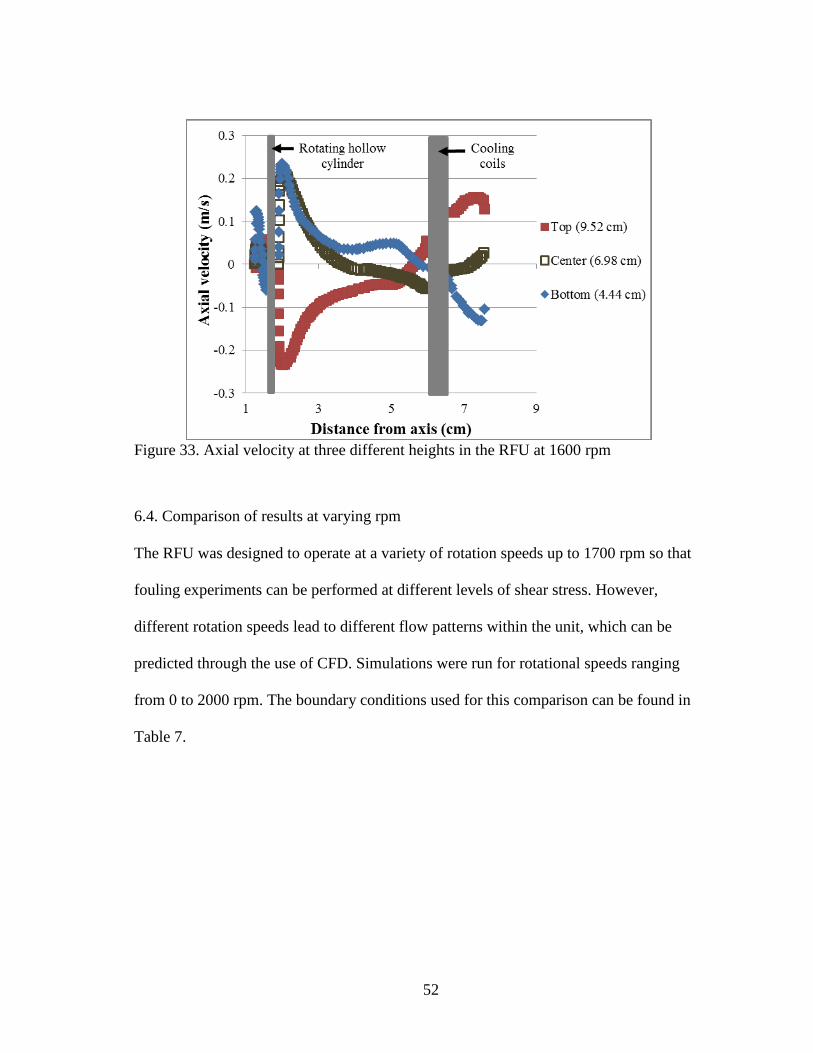
Figure 33. Axial velocity at three different heights in the RFU at 1600 rpm .................. 52
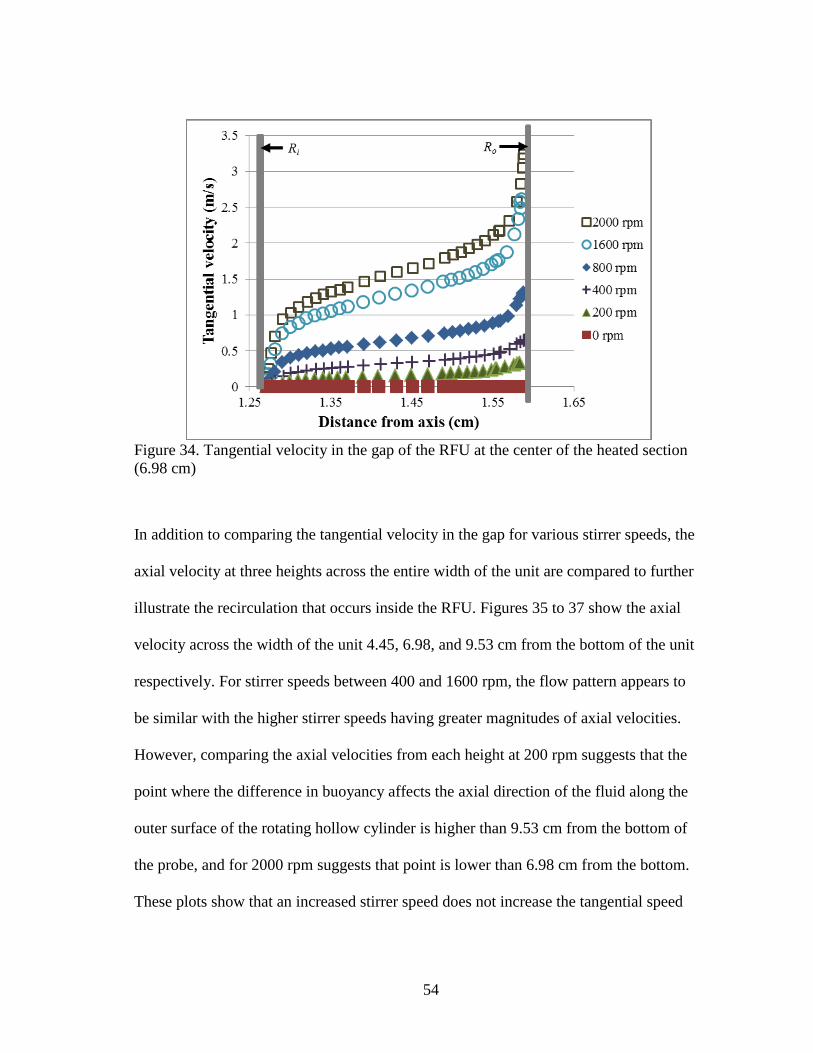
Figure 34. Tangential velocity in the gap of the RFU at the center of the
heated section (6.98 cm) ................................................................................. 54
Figure 35. Axial velocity along entire width of unit at a height of 4.44 cm .................... 55
Figure 36. Axial velocity along entire width of unit at a height of 6.98 cm .................... 56
Figure 37. Axial velocity along entire width of unit at a height of 9.53 cm .................... 56
xi
Figure 38. Temperature distribution in the gap below the heated section
(4.44 cm from bottom of vessel) from 0 to 2000 rpm .................................... 57
Figure 39. Temperature distribution in the gap at the center of the heated
section (6.98 cm from bottom of vessel) from 0 to 2000 rpm ....................... 58
Figure 40. Temperature distribution in the gap above the heated section
(9.53 cm from bottom of vessel) from 0 to 2000 rpm .................................... 58
Figure 41. Temperature distribution on heated surface of probe for various rpm ........... 59
Figure 42. Tangential velocity in the gap of the RFU at the center of the heated
section at two different heat fluxes (6.98 cm) ................................................ 60
Figure 43. Axial velocity along entire width of unit at a height of 6.98 cm
at two different heat fluxes ............................................................................. 61
Figure 44. Temperature distribution in the gap below the heated section
(4.44 cm from bottom) at two different heat fluxes ....................................... 62
Figure 45. Temperature distribution in the gap at the center of the heated
section (6.98 cm from bottom) at two different heat fluxes ........................... 62
Figure 46. Temperature distribution in the gap above the heated section
(9.53 cm from bottom) at two different heat fluxes ....................................... 63
Figure 47. Temperature distribution on heated surface of probe at two different
heat fluxes ...................................................................................................... 64
Figure 48. Heat transfer coefficient along the surface of the probe at two
different heat fluxes ........................................................................................ 65
xii
LIST OF TABLES
Page
Table 1. Comparison of operating conditions for RFU and HTFU ................................. 15
Table 2. Comparison of RFU to previous batch stirred cells ........................................... 20
Table 3. Comparison of concentric cylinder configuration in RFU to
other experiments [26] ....................................................................................... 30
Table 4. Comparison of mesh size and y+ values for three different meshes .................. 42
Table 5. Boundary conditions used in FLUENT®
for mesh comparison ......................... 44
Table 6. Boundary conditions in FLUENT® for results at 1600 rpm .............................. 46
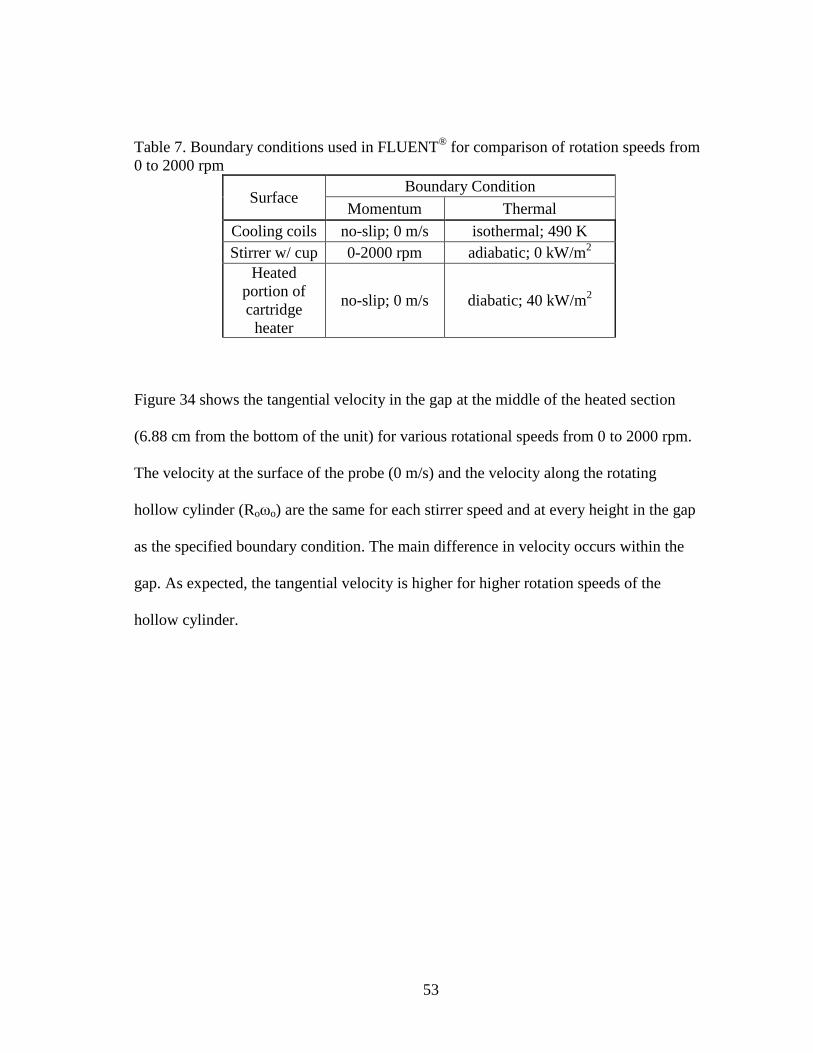
Table 7. Boundary conditions used in FLUENT® for comparison of rotation
speeds from 0 to 2000 rpm ................................................................................. 53
Table 8. Boundary conditions used in FLUENT® for heat flux ....................................... 60
1
1. INTRODUCTION
Fouling is defined as the “accumulation of unwanted materials on the surface of heat
exchangers” [1], reducing their heat transfer effectiveness. Crude oil fouling is a
particularly costly and problematic type of heat exchanger fouling that occurs in the
preheat train to the atmospheric distillation column in petroleum refineries. Fouling is a
broad term and refers to any unwanted material, but can be classified into different type
of fouling. Bott suggests that fouling can be classified into the following seven groups
[2]:
1. Crystallization and scaling
2. Particle deposition
3. Accumulation of biological material
4. Chemical reaction
5. Corrosion of the heat transfer surface
6. Solidification of process fluid on the surface
7. Mixed systems and the interaction of mechanisms listed in 1 – 6 above.
The primary type of fouling in crude oil is chemical reaction fouling, which occurs when
the composition of the oil undergoes chemical changes and deposits accumulate on the
heat exchanger surface [3]. There are multiple classifications of chemical fouling, i.e.
asphaltene adhesion, coking, corrosion, polymerization, and insoluble gum formation.
Each mode of fouling can be detrimental to the production of crude oil, causing a loss of
2
efficiency in the heat exchanger and an increase in operating costs. Therefore, there has
been great interest in studying fouling to help mitigate its costly repercussions.
Over the years, various experiments have been designed and performed to better
understand the nature of crude oil fouling with the intention of creating sufficient data to
accurately predict fouling at various conditions. Previous experiments have been
performed in a variety of different experimental apparatuses, and typically do not use the
same procedures and methods when testing. However, each provides valuable
information toward the behavior of crude oil fouling and aids in determining the
proclivity of fouling in addition to the amount of fouling at various operating conditions.
Most experiments study fouling with turbulent flow conditions because that is the
common flow pattern in heat exchangers. In order to compare the experiments, each
experiment measures key elements that determine the proclivity of fouling, which
include bulk temperature (Tb), wall temperature (Tw), pressure (P), and flow rate or
surface shear stress (τw). These apparatuses include but are not limited to, a tubular test
section, an annular test section, an Alcor® test unit, and a batch stirred cell and will be
mentioned in more detail later on [4–9].
Fouling does not occur instantly, but is considered to be a gradual process with various
phases. Bott mentions three basic stages of fouling deposition with a moving fluid,
which are [1]:
1. The diffusional transport of the foulant or its precursors across the boundary
layers adjacent to the solid surface within the flowing fluid.
3
2. The adhesion of the deposit to the surface itself.
3. The transport of material away from the surface.
Before fouling on the surface occurs, there is an induction period with no accumulation
of deposits on the heated surface. Various papers have discussed the initiation period and
the point where fouling begins [10–12].
According to Bott, “the accumulation of deposits on the surfaces of a heat exchanger
increases the overall resistance to heat flow” [1]. Despite having various types of units,
the method for quantifying the fouling deposit during an experiment remains unchanged:
find the fouling resistance, commonly referred to as the fouling factor, as it changes over
a period time. The fouling resistance is found by using thermocouples to measure the
surface temperature of the test section throughout the experiment and recording the
change in surface temperature as the fouling deposit accumulates. The measured wall
temperature, the temperature between the metal wall and the deposit, will increase as the
fouling deposit increases because the deposit acts as insulation around the probe. The
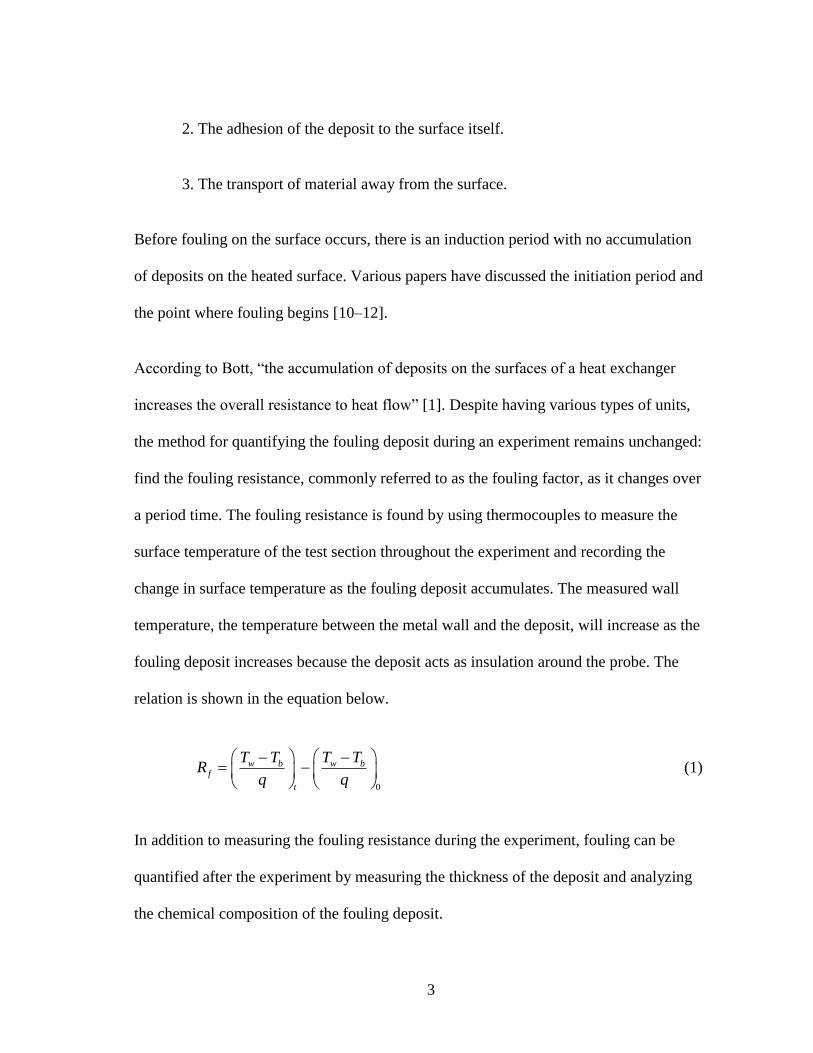
relation is shown in the equation below.
0
w b w bf
t
T T T TR
q q
(1)
In addition to measuring the fouling resistance during the experiment, fouling can be
quantified after the experiment by measuring the thickness of the deposit and analyzing
the chemical composition of the fouling deposit.

4
The goal of studying crude oil fouling is to formulate an accurate method for predicting
the proclivity of fouling in specific conditions and the amount of fouling that will occur
under the same conditions for various types of crude oils. Heat Transfer Research Inc.
(HTRI) has a fouling program that has been in place for over 30 years devoted to better
understanding fouling. Over the years, HTRI has performed various tests to understand
crude oil fouling under various conditions. The testing at HTRI is continuous, but
collecting two sets of data takes four to six weeks on the High Temperature Fouling Unit
(HTFU), limiting the amount of testing performed. The main objective of my thesis is to
create a batch sized unit to study crude oil fouling to aid HTRI’s fouling program and
increase the amount of testing that will occur.
5
2. RELEVANT PREVIOUS UNITS
Multiple experiments have been conducted around the world to better understand crude
oil fouling. Experiments vary in volumetric capacity and duration, but all provide
relevant data that can be applied to the field.
HTRI is bolstering its research efforts by building a batch-sized unit to screen test runs
for the HTFU and enhance the fouling program at HTRI. The following sections
describe the existing fouling experiments in more detail. HTRI’s HTFU uses pipe flow,
not rotational flow, but experiments using rotational flow have been performed outside
of HTRI. The benefits of operating a rotating fouling unit include a small charge and
quick turnaround.
2.1. HTFU
Since the1990s, HTRI has conducted fouling experimentation in the HTFU to
understand the key factors that cause crude oil fouling at high temperatures of the
preheat train. Experimental setups of the HTFU include an annular test section (1994-
2002) and a tubular test section (2002-present), which is currently the only experimental
setup for testing crude oil fouling at HTRI [8].
The HTFU consists of two heated test sections where fouling deposit can accumulate.
Current tests in the HTFU require eight gallons of crude oil per run (two data sets) with
one run lasting from four to six weeks [8]. Thus a complete parametric set of
6
experiments necessary to fully characterize the fouling tendencies of a specific crude oil
can span over many months or years.
2.1.1. Annular test section
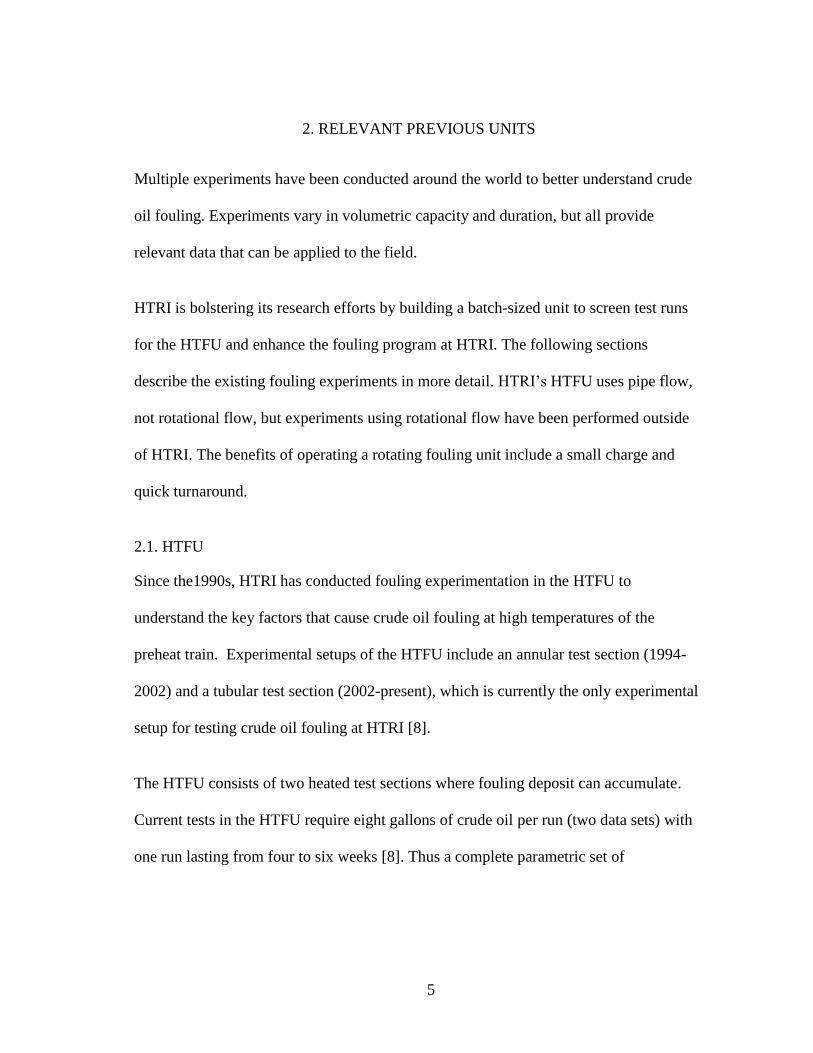
The original fouling tests in the HTFU used two annular test sections where crude oil
flowed through a small gap between the cartridge heater (HTRI probe) and the outer
pipe, and deposit collected on the surface of the heated section of the cartridge heater [9]
as seen in Figure 1. The long no-heat sections at the ends of the probe allow for fully
developed turbulent flow to occur across the heated section of the probe.
Flow
Outer Pipe
Cartridge heater
Heated section
Figure 1. Diagram of flow through annular test section [9]
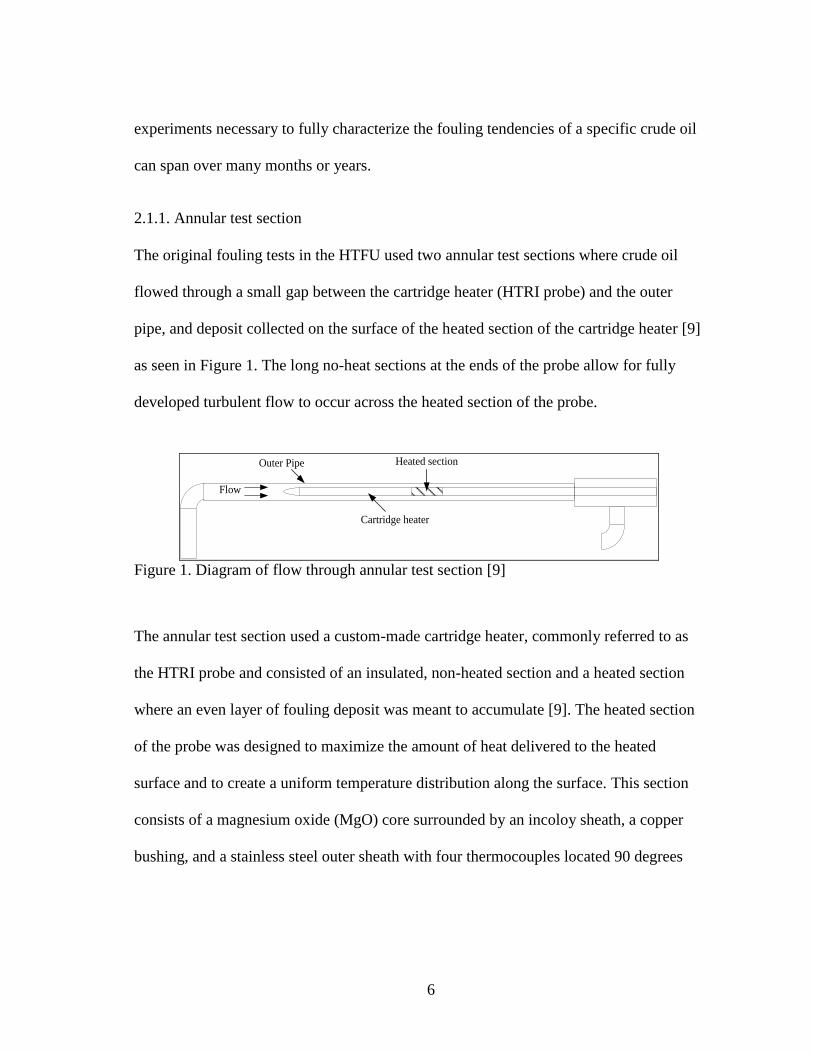
The annular test section used a custom-made cartridge heater, commonly referred to as
the HTRI probe and consisted of an insulated, non-heated section and a heated section
where an even layer of fouling deposit was meant to accumulate [9]. The heated section
of the probe was designed to maximize the amount of heat delivered to the heated
surface and to create a uniform temperature distribution along the surface. This section
consists of a magnesium oxide (MgO) core surrounded by an incoloy sheath, a copper
bushing, and a stainless steel outer sheath with four thermocouples located 90 degrees
7
apart from one another in between the copper bushing and the outer sheath as shown in
Figure 2 [9].
Outer sheath
Copper bushing
Incoloy sheath Power pins
MgO core
MgO fill material
4 thermocouples
Figure 2. Cross section of heated portion with four thermocouples [9]
One of the benefits of the HTRI probe is that the deposit collects on the surface of the
cartridge heater and can be easily quantified because the probe can be removed from the
rest of the test section, and an analysis of the deposit thickness can be performed directly
on the probe.
2.1.2. Tubular test section
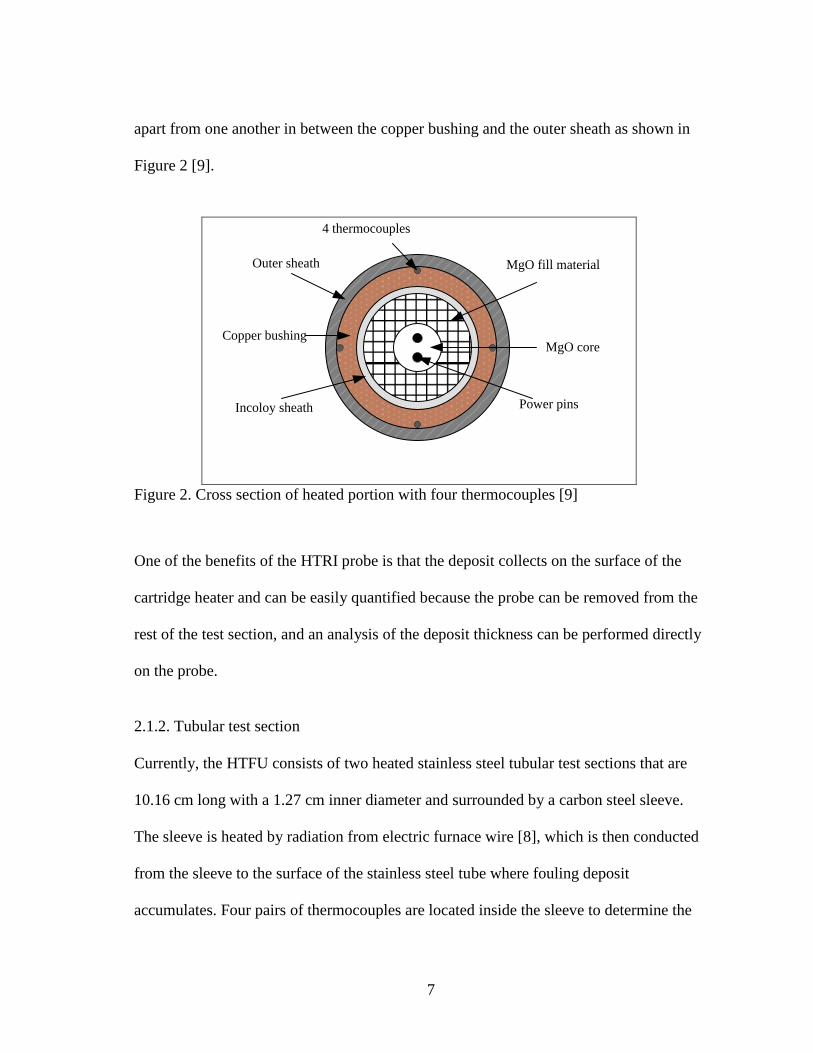
Currently, the HTFU consists of two heated stainless steel tubular test sections that are
10.16 cm long with a 1.27 cm inner diameter and surrounded by a carbon steel sleeve.
The sleeve is heated by radiation from electric furnace wire [8], which is then conducted
from the sleeve to the surface of the stainless steel tube where fouling deposit
accumulates. Four pairs of thermocouples are located inside the sleeve to determine the
8
heat flux through the sleeve and the wall temperature of the stainless steel tube [11]. The
setup of the tubular test section can be seen in Figure 3.
Furnace wire
Crude oil outCrude oil in
Carbon steel sleeveStainless
steel tube
Thermocouples
Figure 3. Side view of tubular test section of HTFU [8]
2.2. Smaller scale fouling apparatuses
Due to the extended amount of time spent testing crude oil fouling during a single test
run, smaller scale experiments with faster turnaround times have been developed to help
bolster the effort towards better understanding crude oil fouling. These experiments
include, but are not limited to, the Alcor® test unit [4], the High Temperature Organic
Fouling Unit [5], and the batch stirred cell [13–16].
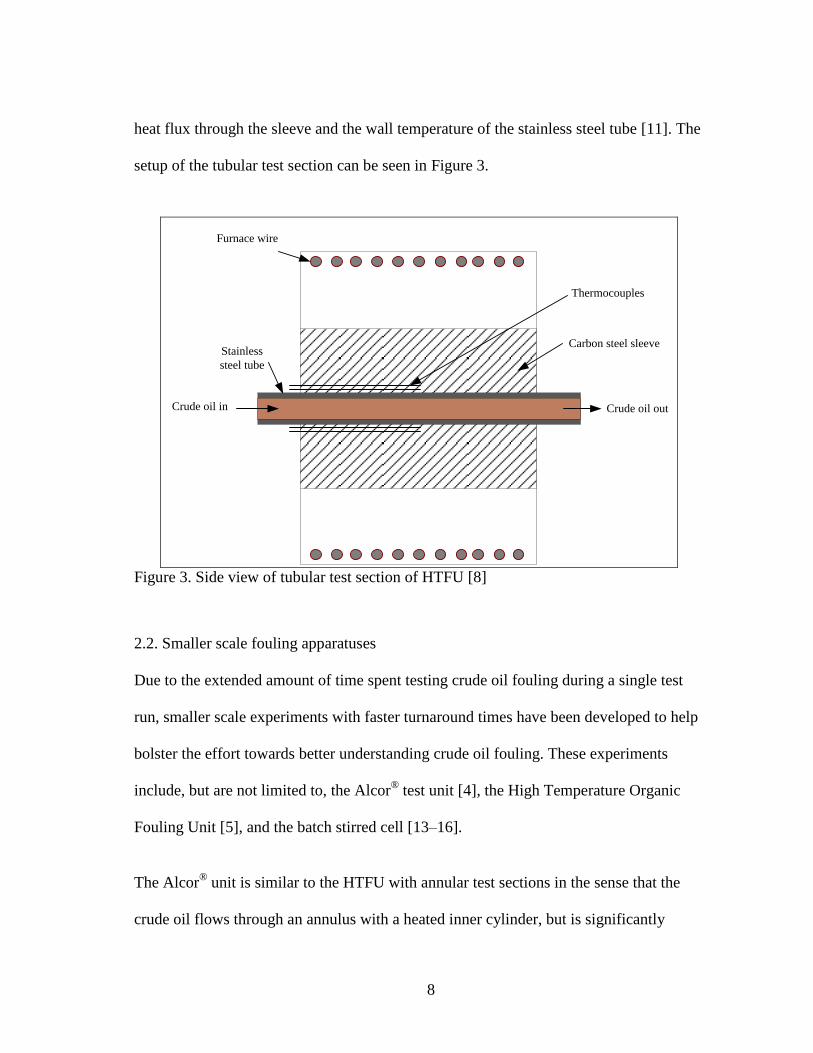
The Alcor® unit is similar to the HTFU with annular test sections in the sense that the
crude oil flows through an annulus with a heated inner cylinder, but is significantly
9
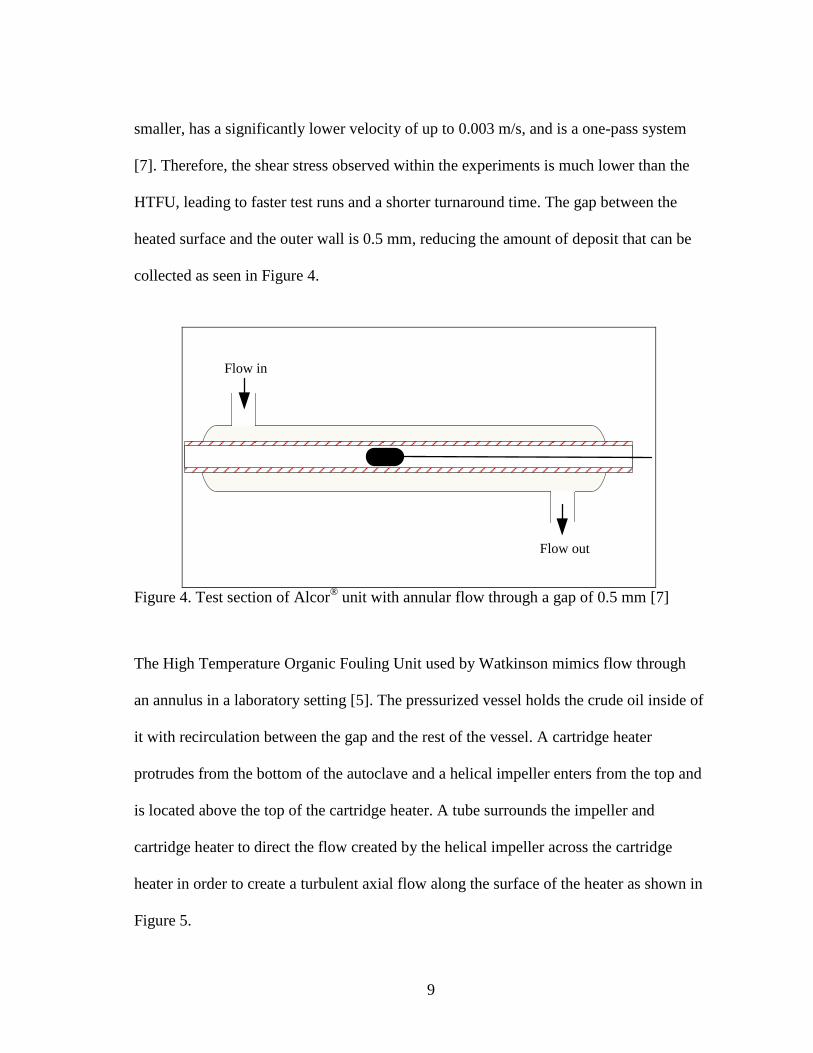
smaller, has a significantly lower velocity of up to 0.003 m/s, and is a one-pass system
[7]. Therefore, the shear stress observed within the experiments is much lower than the
HTFU, leading to faster test runs and a shorter turnaround time. The gap between the
heated surface and the outer wall is 0.5 mm, reducing the amount of deposit that can be
collected as seen in Figure 4.
Flow in
Flow out
Figure 4. Test section of Alcor
® unit with annular flow through a gap of 0.5 mm [7]
The High Temperature Organic Fouling Unit used by Watkinson mimics flow through
an annulus in a laboratory setting [5]. The pressurized vessel holds the crude oil inside of
it with recirculation between the gap and the rest of the vessel. A cartridge heater
protrudes from the bottom of the autoclave and a helical impeller enters from the top and
is located above the top of the cartridge heater. A tube surrounds the impeller and
cartridge heater to direct the flow created by the helical impeller across the cartridge
heater in order to create a turbulent axial flow along the surface of the heater as shown in
Figure 5.

10
Helical
impeller
Heated
section
Figure 5. High temperature organic fluid fouling unit [17]
Batch test cells, rather than through-flow tubular test rigs, have the advantage of shorter
run times—on the order of hours rather than days or weeks [16] because of the lower
levels of shear stress introduced to the test surface. However, the conditions in existing
batch stirred cells differ substantially from those present in refinery preheat trains—
namely, the level of shear stress at the tube wall and the use of rotational flow.
The batch stirred cell is similar to other fouling apparatuses in the sense that the major
variables that affect fouling can be controlled (i.e. bulk temperature, surface temperature,
and pressure). However, batch cells experience different flow patterns as will be
discussed more in Section 4. Rotating fouling units vary the shear stress by changing the
11
stirrer speed for various test runs and try to maintain a constant shear stress during each
test run to maximize the repeatability and accuracy of results.
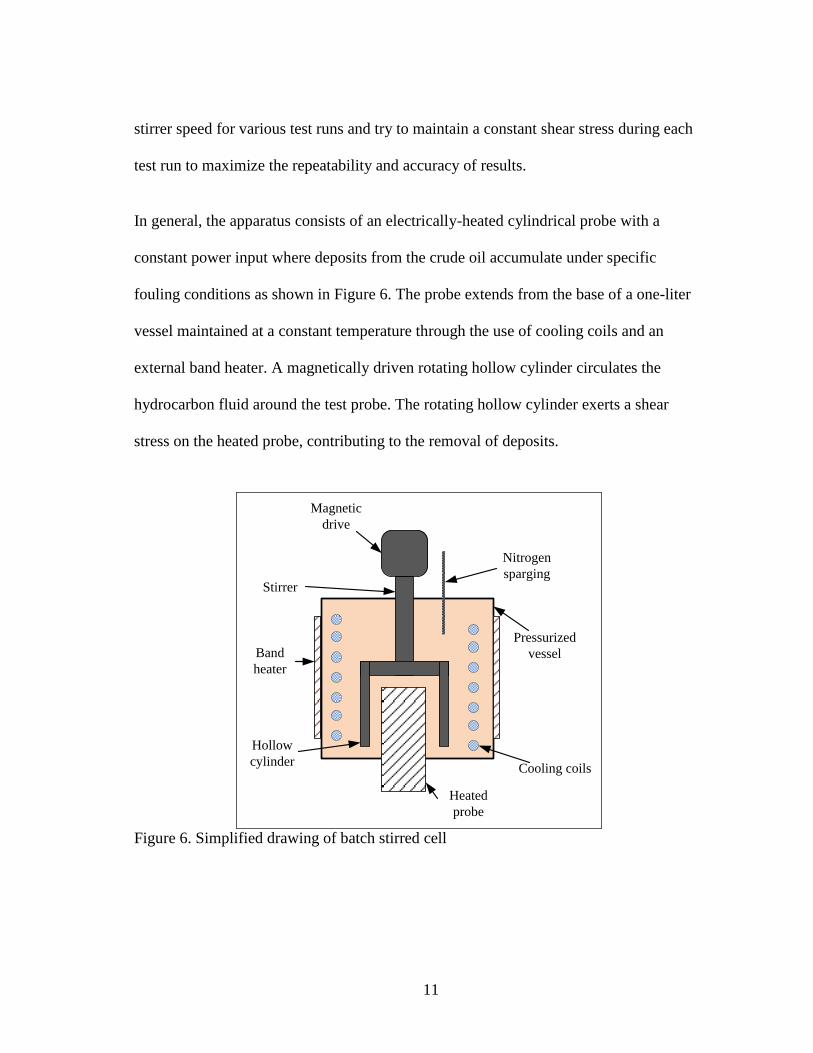
In general, the apparatus consists of an electrically-heated cylindrical probe with a
constant power input where deposits from the crude oil accumulate under specific
fouling conditions as shown in Figure 6. The probe extends from the base of a one-liter
vessel maintained at a constant temperature through the use of cooling coils and an
external band heater. A magnetically driven rotating hollow cylinder circulates the
hydrocarbon fluid around the test probe. The rotating hollow cylinder exerts a shear
stress on the heated probe, contributing to the removal of deposits.
Band
heater
Stirrer
Magnetic
drive
Hollow
cylinder
Heated
probe
Cooling coils
Nitrogen
sparging
Pressurized
vessel
Figure 6. Simplified drawing of batch stirred cell
12
In addition to stirred batch cells, previous experiments have been performed for the
fouling of milk, but have used a spinning disc, which allows for the fouling deposit to
collect with varying shear stress [18,19]. The idea of spinning discs can be applied to
crude oil fouling with a rotating disc spinning parallel to a heated stationary disc where
fouling deposit could accumulate. Theoretically, the stationary disc should have a
deposit with varying thickness along the radius of the stationary disc corresponding to
the magnitude of shear stress at each point.
2.2.1. Eaton’s batch stirred cell
In 1983 Eaton patented a fouling test apparatus comprising of a cylindrical pressure
vessel, a heated cylindrical probe, and a rotating hollow cylinder concentric with the
probe [13,14]. This design was the first of its kind because it allowed for the fouling
proclivity of a crude oil to be tested within a couple of days and without using more than
a liter of crude oil per run. However, the unit uses rotational flow, which is not
experienced within heat exchangers and cannot be directly related to real world
applications.
After building the first rotational fouling apparatus, Eaton performed preliminary fouling
tests with the unit to determine the rate of fouling and amount of fouling in a given time
under specific conditions. After each test run, the accumulated deposits are removed
from the probe and weighed.
13
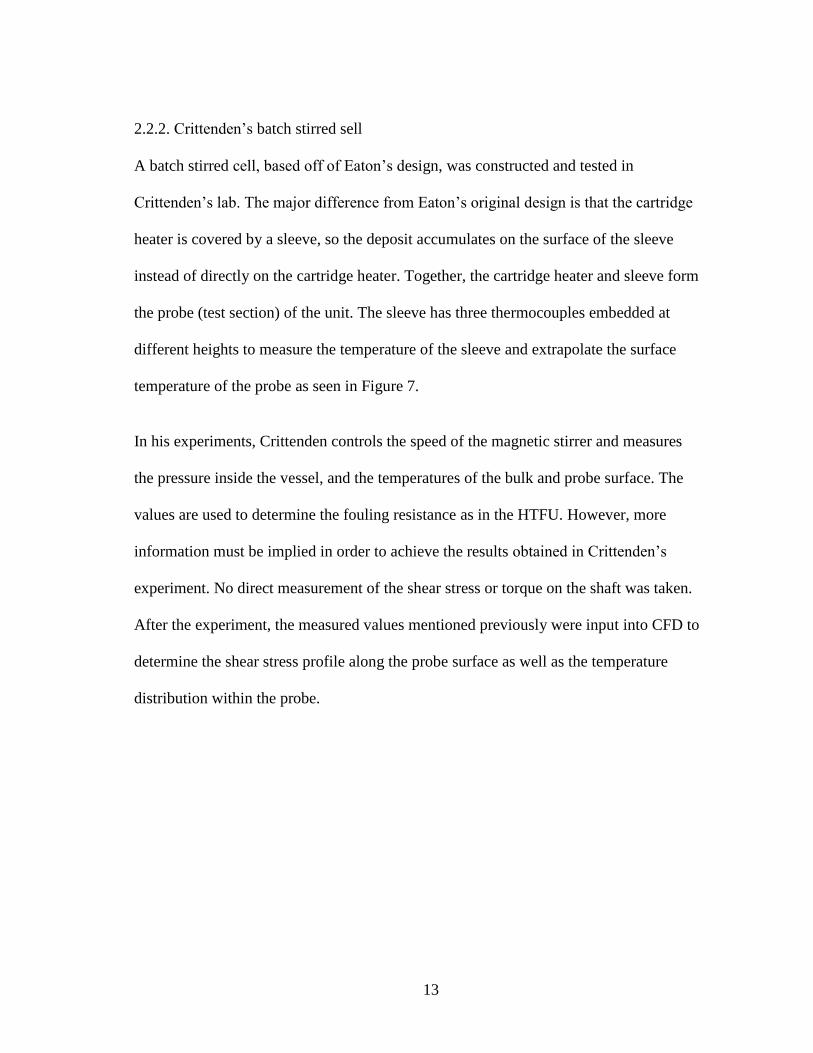
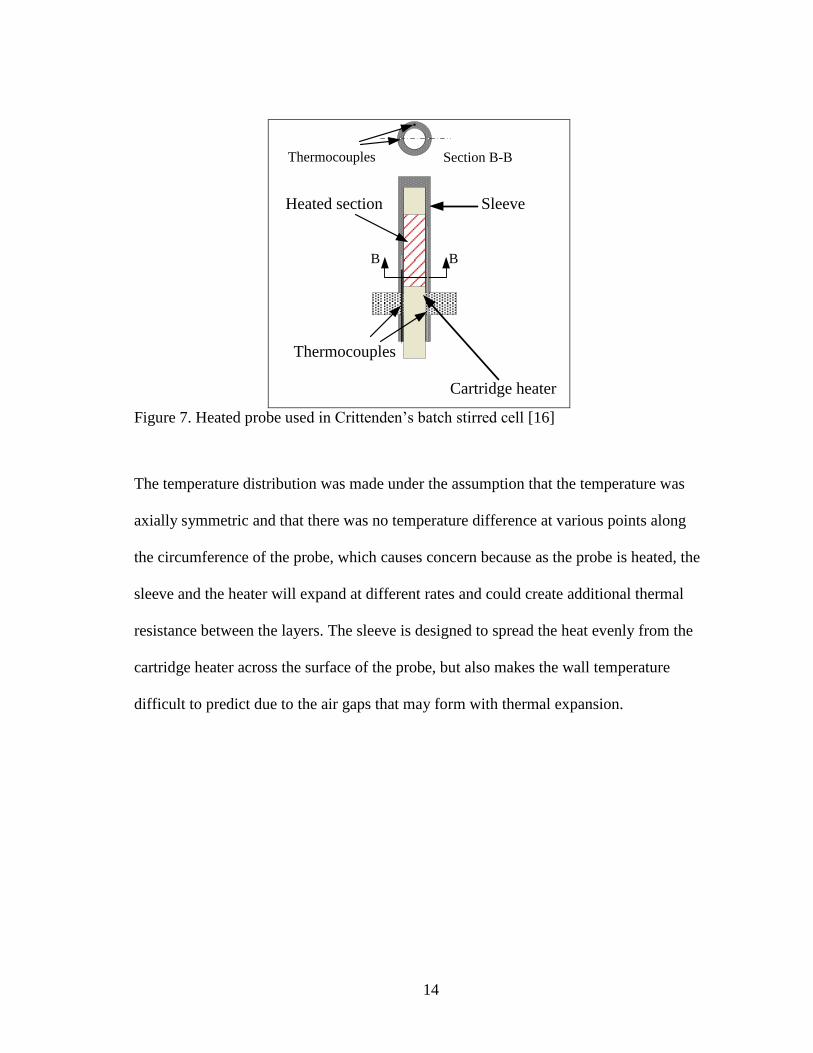
2.2.2. Crittenden’s batch stirred sell
A batch stirred cell, based off of Eaton’s design, was constructed and tested in
Crittenden’s lab. The major difference from Eaton’s original design is that the cartridge
heater is covered by a sleeve, so the deposit accumulates on the surface of the sleeve
instead of directly on the cartridge heater. Together, the cartridge heater and sleeve form
the probe (test section) of the unit. The sleeve has three thermocouples embedded at
different heights to measure the temperature of the sleeve and extrapolate the surface
temperature of the probe as seen in Figure 7.
In his experiments, Crittenden controls the speed of the magnetic stirrer and measures
the pressure inside the vessel, and the temperatures of the bulk and probe surface. The
values are used to determine the fouling resistance as in the HTFU. However, more
information must be implied in order to achieve the results obtained in Crittenden’s
experiment. No direct measurement of the shear stress or torque on the shaft was taken.
After the experiment, the measured values mentioned previously were input into CFD to
determine the shear stress profile along the probe surface as well as the temperature
distribution within the probe.
14
B B
Section B-B
Sleeve
Cartridge heater
Heated section
Thermocouples
Thermocouples
Figure 7. Heated probe used in Crittenden’s batch stirred cell [16]
The temperature distribution was made under the assumption that the temperature was
axially symmetric and that there was no temperature difference at various points along
the circumference of the probe, which causes concern because as the probe is heated, the
sleeve and the heater will expand at different rates and could create additional thermal
resistance between the layers. The sleeve is designed to spread the heat evenly from the
cartridge heater across the surface of the probe, but also makes the wall temperature
difficult to predict due to the air gaps that may form with thermal expansion.
15
3. DESIGN OF ROTATING FOULING UNIT (RFU)
Compared to the HTFU, the RFU is designed to be a much smaller unit (< 1 gal) with a
quicker turnaround time (on the magnitude of days) for a single test. Before a specific
set of conditions is tested in the HTFU, similar conditions can be used in the RFU to
determine whether the conditions seem appropriate for testing in the HTFU. Ideally, the
RFU, in conjunction with the HTFU, will facilitiate a fouling correlation using
temperature, shear stress, and time as independent variables like the Ebert-Panchal
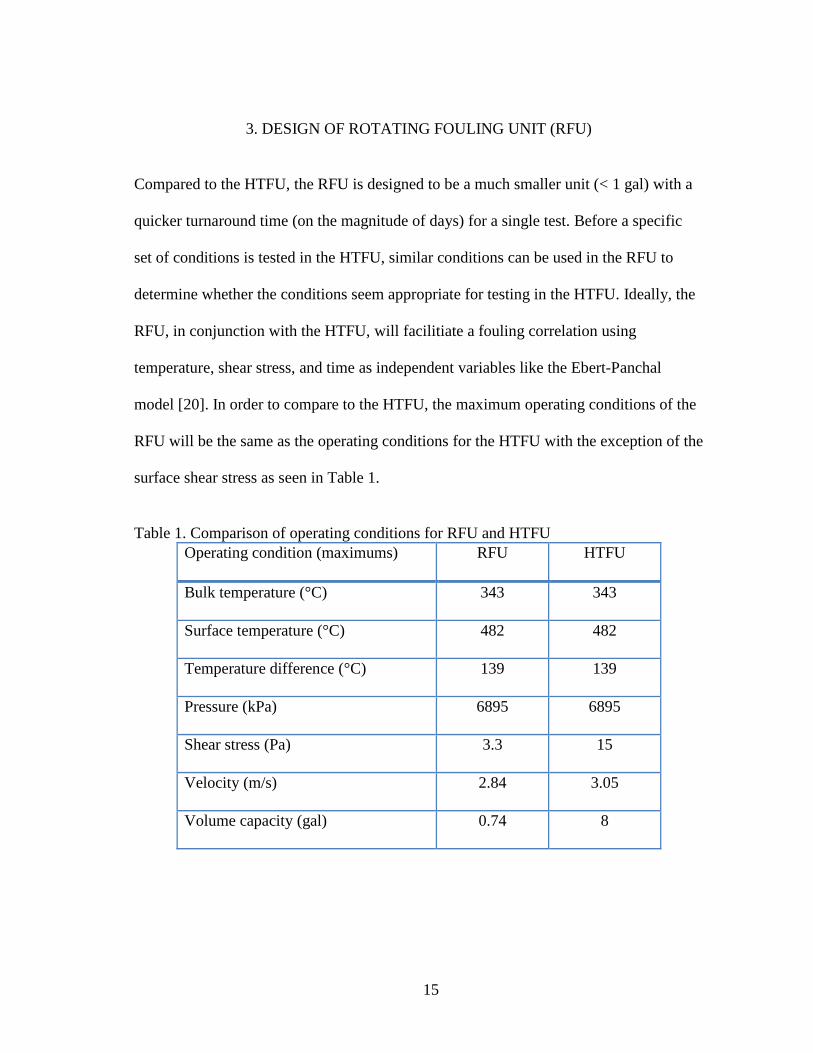
model [20]. In order to compare to the HTFU, the maximum operating conditions of the
RFU will be the same as the operating conditions for the HTFU with the exception of the
surface shear stress as seen in Table 1.
Table 1. Comparison of operating conditions for RFU and HTFU
Operating condition (maximums) RFU HTFU
Bulk temperature (°C) 343 343
Surface temperature (°C) 482 482
Temperature difference (°C) 139 139
Pressure (kPa) 6895 6895
Shear stress (Pa) 3.3 15
Velocity (m/s) 2.84 3.05
Volume capacity (gal) 0.74 8
16
The RFU follows the basic design of the batch stirred cell illustrated in Figure 6. Most
importantly, the design will focus on the gap between the probe and the rotating
cylinder, specifically the temperature distribution and shear stress distribution along the
surface of the probe.
The pressure vessel is made of stainless steel with a maximum capacity of 2.8 liters of
crude oil. Once the crude oil is heated, the pressure of the unit can be set up to 1000 psia
by adding nitrogen from the top of the system. Testing begins once the desired pressure
is reached.
3.1. Heated probe
Like other fouling experiments, the RFU must have a heated test section made of a
material commonly found in heat exchangers, i.e. carbon steel or stainless steel, where
the fouling deposit can collect and be quantified. In the case of the RFU, the heated test
section is a probe similar to other batch stirred cells, but is designed to enhance heat
transfer to the surface and concentrate the heat to a 2.54 cm long section on the surface.
The maximum temperature difference between the surface temperature of the probe and
the bulk temperature of the crude oil is 139°C. The maximum heat input required to
obtain the required temperature difference, assuming the heat transfer coefficient is no
greater than 2100 W∕m2 K, is 600 W, as calculated using equation (2).
s s bQ hA T T (2)
17
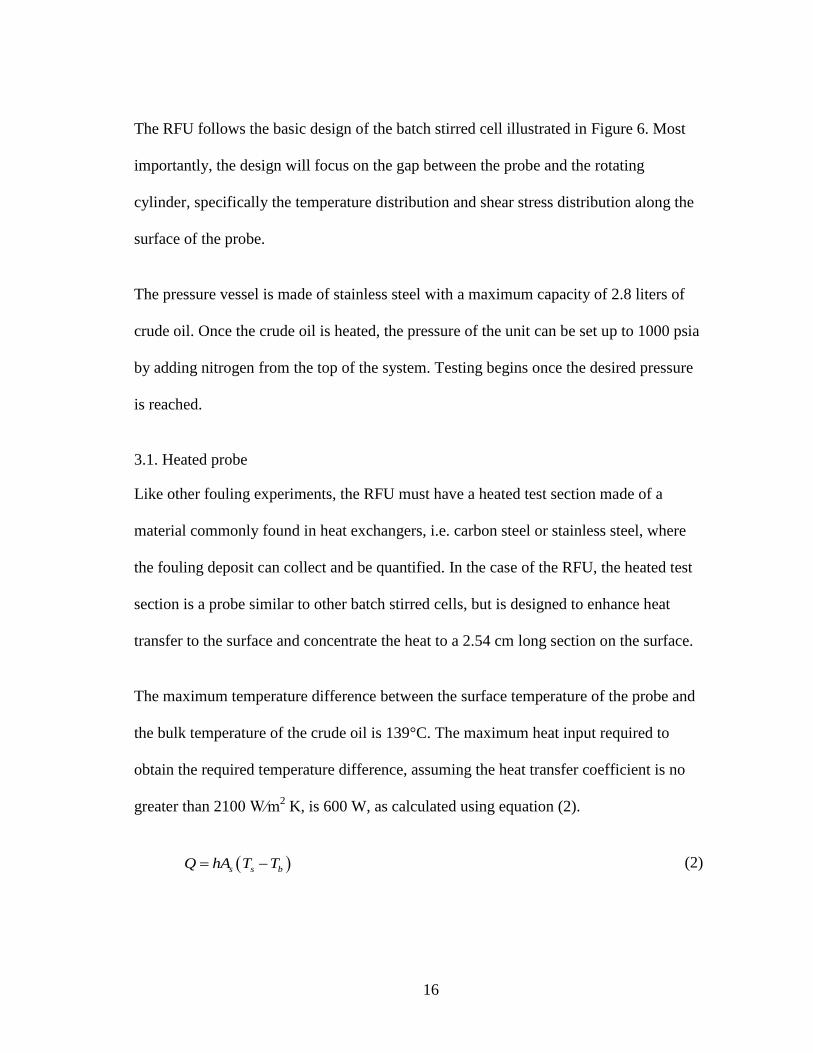
The cartridge heater for the RFU is similar to those used for the annular test sections of
the HTFU, but the layers of the heated section will be shrink-fit together to ensure that
the surfaces are always connected even after thermal expansion of the materials. The
layers, from outside to inside, are a 316 stainless steel sleeve, a bronze ring, and a
cartridge heater. The outside of the 2.54 cm long bronze ring has 4 grooves located 90
degrees apart to hold 0.5 mm thermocouples to measure the interface temperature
between the stainless steel and the bronze as shown in Figure 8. The cartridge heater is
6.35 cm long and consists of two no-heat sections along the ends and a 2.54 cm heated
section where the fouling deposit will collect. The probe will have a 2.54 cm outer
diameter and a threaded bottom to screw into the bottom of the pressure vessel as shown.
2.54 1.272.54
25.4
316
stainless
steel
BronzeCartridge
heaterThermocouple
Leads1.27
Welded
stainless
steel cap
0.64 0.64
Insulation
Swagelok
fitting
All dimensions
in cm
Figure 8. Dimensioned drawing of new heated probe for RFU
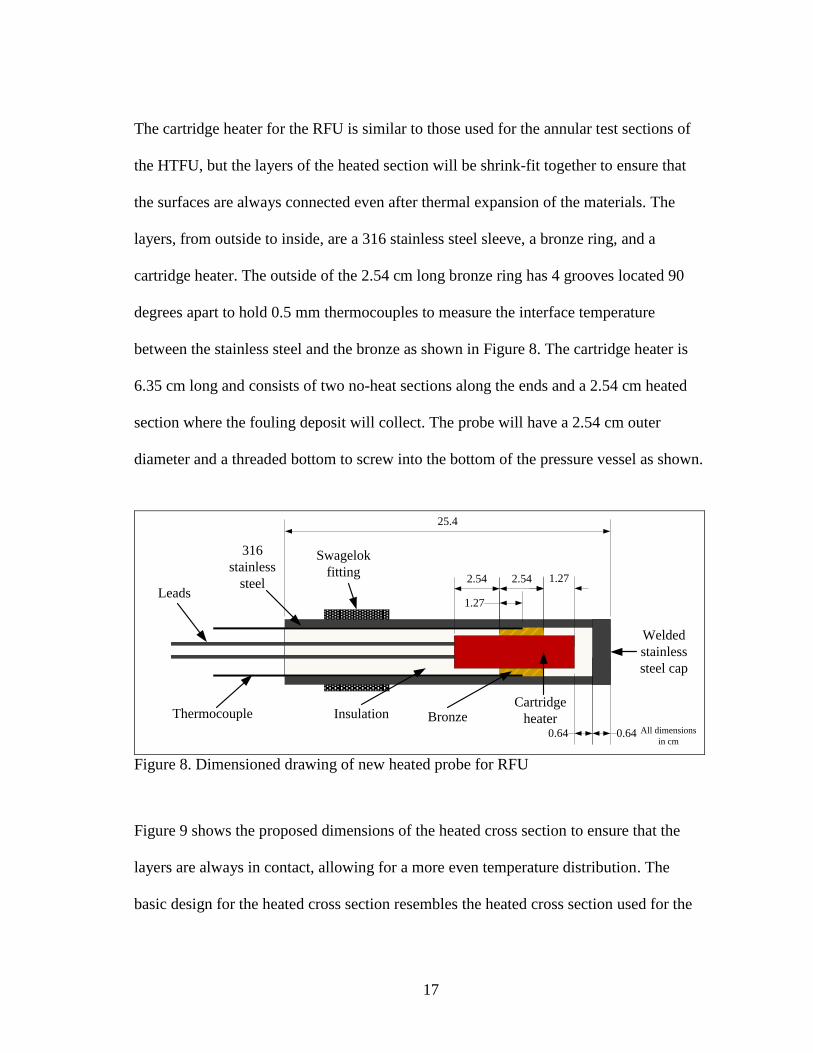
Figure 9 shows the proposed dimensions of the heated cross section to ensure that the
layers are always in contact, allowing for a more even temperature distribution. The
basic design for the heated cross section resembles the heated cross section used for the

18
annular test section of the HTFU with the main differences being smaller thermocouples
and use of bronze instead of copper and the use of shrink-fitting to assemble the pieces
together. The bronze will be used in an attempt to attain a more uniform temperature
reading so that the thermocouple will always be in contact with the interface. Eaton’s
fouling apparatus had only one thermocouple to determine the surface temperature, and
Crittenden’s batch stirred cell had three thermocouples to determine the surface
temperature, while the design for the new RFU has four thermocouples located at the
same height to help accurately measure the surface temperature along the outer surface
of the probe.
Ø2.54±0.013
Ø2.117±0.0025
Ø1.547±0.0025
Ø0.06±0.01Thermocouple
316 stainless steel
Bronze
Cartridge heater
All dimensions in cm
Figure 9. Cross section view of heated section of probe
19
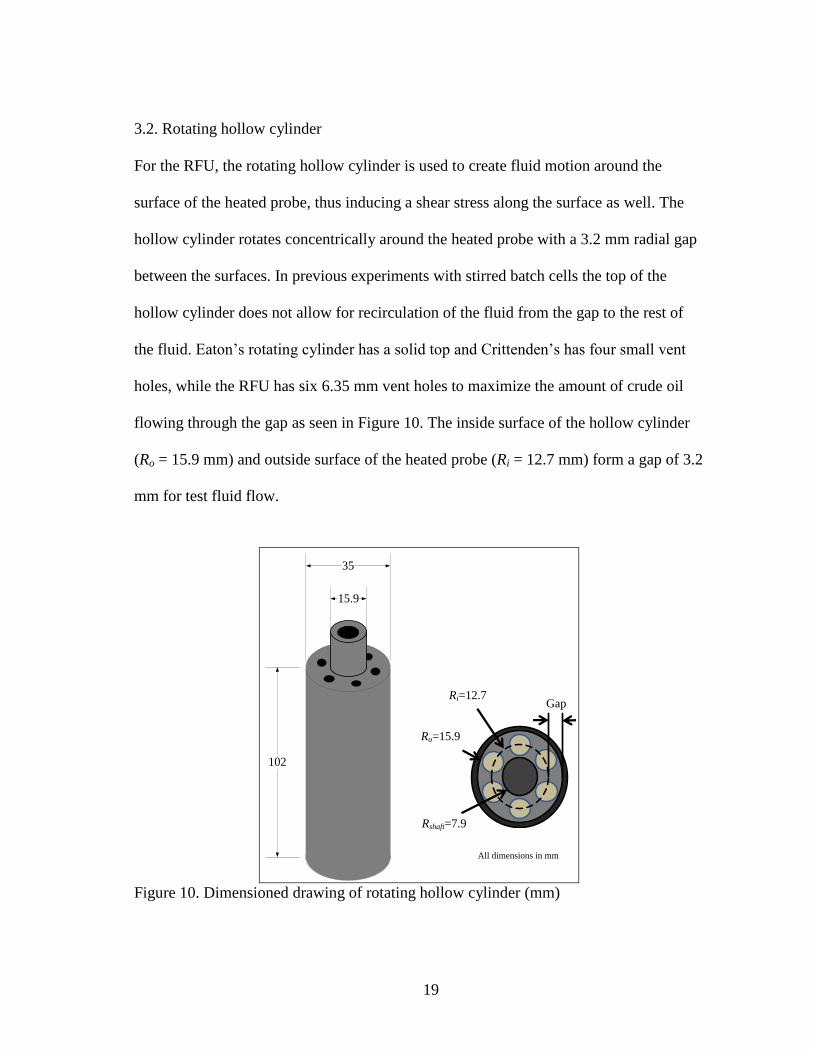
3.2. Rotating hollow cylinder
For the RFU, the rotating hollow cylinder is used to create fluid motion around the
surface of the heated probe, thus inducing a shear stress along the surface as well. The
hollow cylinder rotates concentrically around the heated probe with a 3.2 mm radial gap
between the surfaces. In previous experiments with stirred batch cells the top of the
hollow cylinder does not allow for recirculation of the fluid from the gap to the rest of
the fluid. Eaton’s rotating cylinder has a solid top and Crittenden’s has four small vent
holes, while the RFU has six 6.35 mm vent holes to maximize the amount of crude oil
flowing through the gap as seen in Figure 10. The inside surface of the hollow cylinder
(Ro = 15.9 mm) and outside surface of the heated probe (Ri = 12.7 mm) form a gap of 3.2
mm for test fluid flow.
102
35
15.9
Ri=12.7
Ro=15.9
Gap
Rshaft=7.9
All dimensions in mm
Figure 10. Dimensioned drawing of rotating hollow cylinder (mm)
20
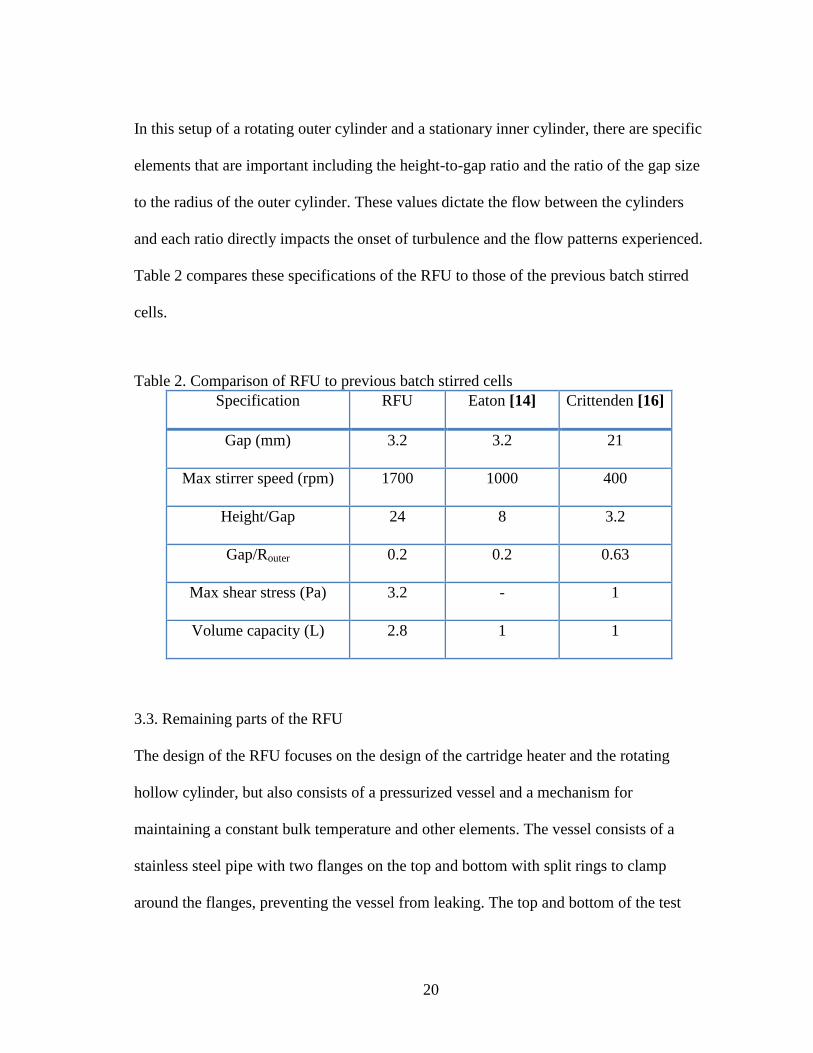
In this setup of a rotating outer cylinder and a stationary inner cylinder, there are specific
elements that are important including the height-to-gap ratio and the ratio of the gap size
to the radius of the outer cylinder. These values dictate the flow between the cylinders
and each ratio directly impacts the onset of turbulence and the flow patterns experienced.
Table 2 compares these specifications of the RFU to those of the previous batch stirred
cells.
Table 2. Comparison of RFU to previous batch stirred cells
Specification RFU Eaton [14] Crittenden [16]
Gap (mm) 3.2 3.2 21
Max stirrer speed (rpm) 1700 1000 400
Height/Gap 24 8 3.2
Gap/Router 0.2 0.2 0.63
Max shear stress (Pa) 3.2 - 1
Volume capacity (L) 2.8 1 1
3.3. Remaining parts of the RFU
The design of the RFU focuses on the design of the cartridge heater and the rotating
hollow cylinder, but also consists of a pressurized vessel and a mechanism for
maintaining a constant bulk temperature and other elements. The vessel consists of a
stainless steel pipe with two flanges on the top and bottom with split rings to clamp
around the flanges, preventing the vessel from leaking. The top and bottom of the test
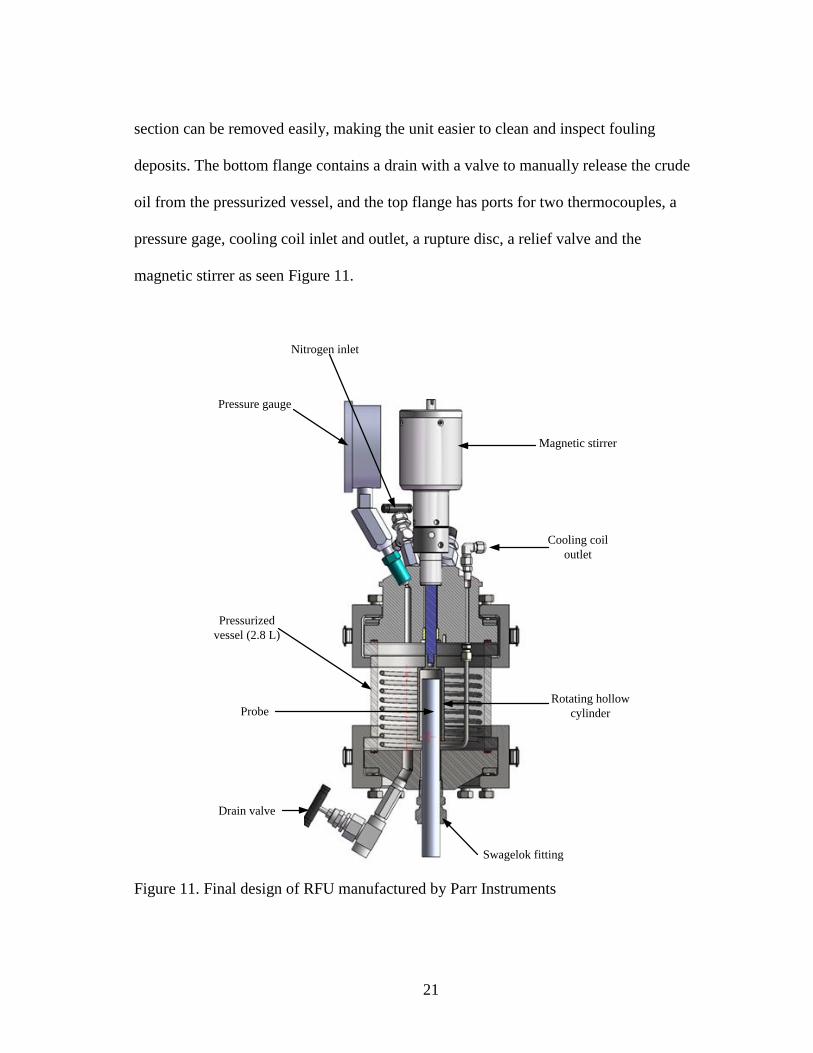
21
section can be removed easily, making the unit easier to clean and inspect fouling
deposits. The bottom flange contains a drain with a valve to manually release the crude
oil from the pressurized vessel, and the top flange has ports for two thermocouples, a
pressure gage, cooling coil inlet and outlet, a rupture disc, a relief valve and the
magnetic stirrer as seen Figure 11.
Pressure gauge
Nitrogen inlet
Pressurized
vessel (2.8 L)
Drain valve
Probe
Swagelok fitting
Rotating hollow
cylinder
Cooling coil
outlet
Magnetic stirrer
Figure 11. Final design of RFU manufactured by Parr Instruments
22
The entire unit rests on a stand with a pneumatic lift used to remove the bottom section
from the top section in order to analyze the fouling deposit on the probe and to allow for
easy cleaning of the unit, providing a quick turnaround time. The stand allows for the
removal of the bottom flange or the bottom flange with the middle portion. Having the
unit in three pieces gives the RFU more versatility than its predecessors and allows for
more flexibility in the future when setting up fouling experiments
To maintain a constant bulk temperature, the RFU is equipped with a 2000 W external
band heater surrounding the vessel to heat the crude oil, and stainless steel spiral cooling
coils with dynalene flowing through them to cool down the unit. The cooling coils are
part of a cooling loop consisting of an expansion tank, a pump, and an air-blown cooler
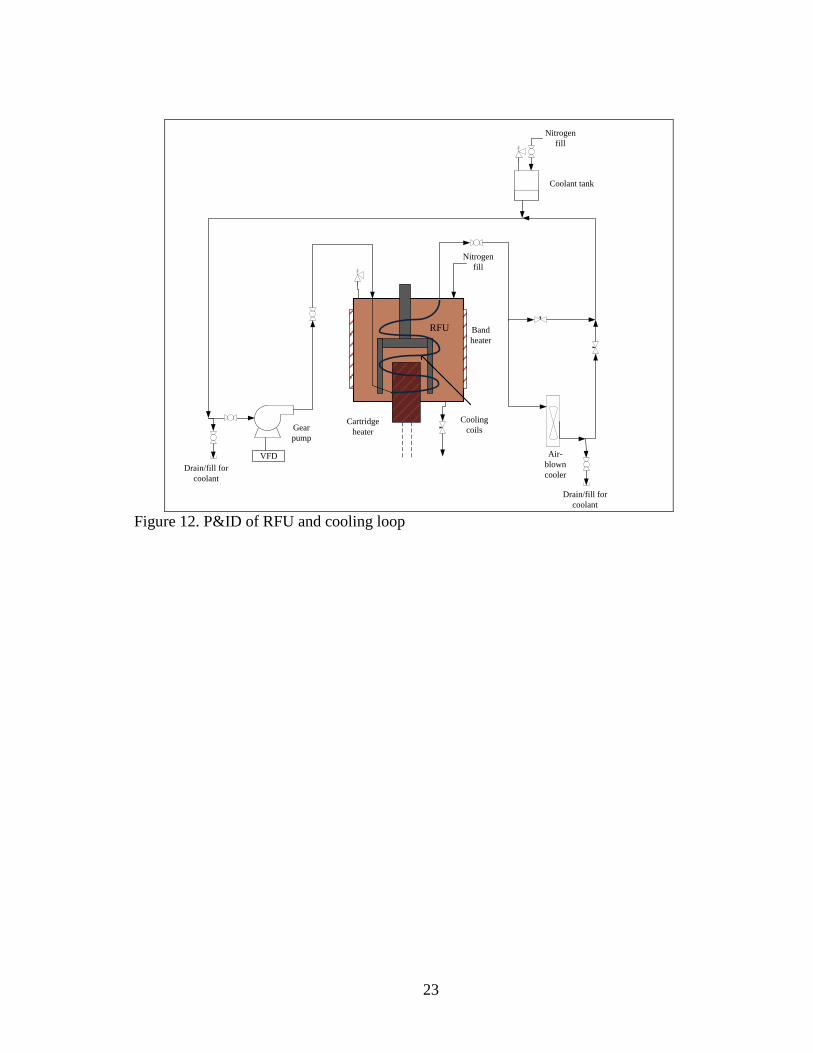
to cool the crude oil in the RFU as illustrated in Figure 12. The cooling coils also allow
for the crude oil to be cooled faster after a test run is complete, thus shortening the
turnaround time.
23
RFU
Gear
pump
Coolant tank
Air-
blown
cooler
Cooling
coils
Band
heater
Cartridge
heater
VFD
Nitrogen
fill
Nitrogen
fill
Drain/fill for
coolant
Drain/fill for
coolant Figure 12. P&ID of RFU and cooling loop
24
4. VALIDATION OF DESIGN: SHEAR STRESS
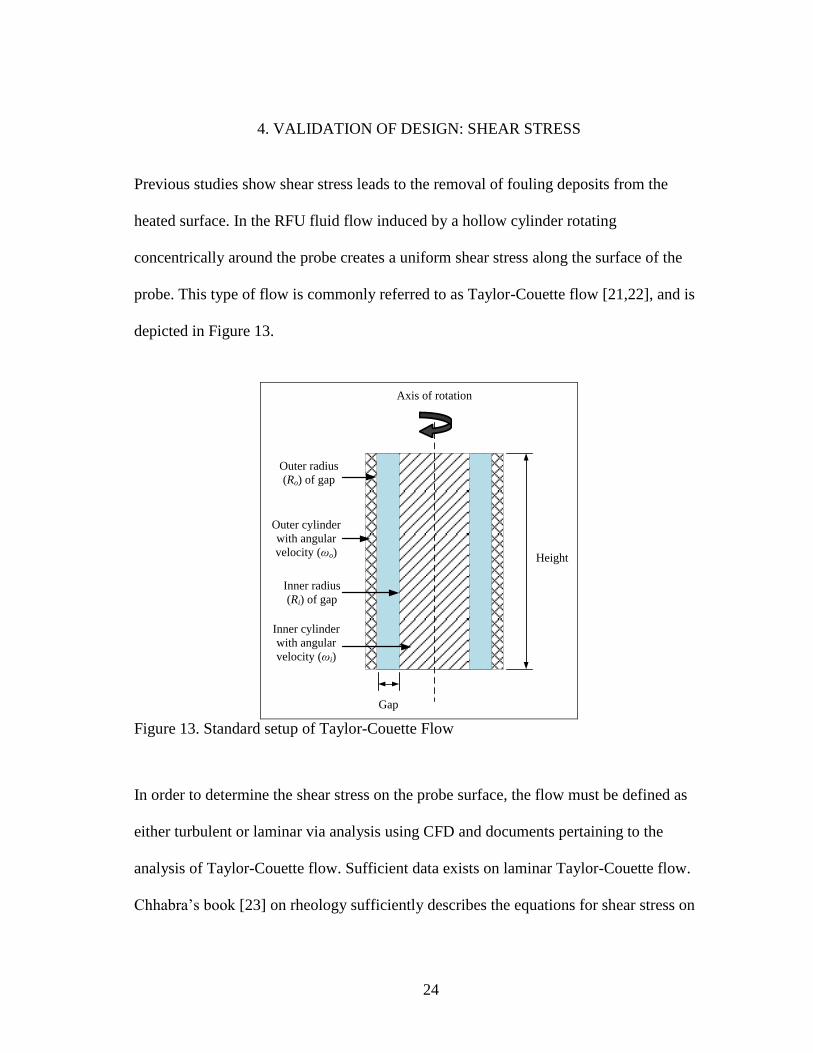
Previous studies show shear stress leads to the removal of fouling deposits from the
heated surface. In the RFU fluid flow induced by a hollow cylinder rotating
concentrically around the probe creates a uniform shear stress along the surface of the
probe. This type of flow is commonly referred to as Taylor-Couette flow [21,22], and is
depicted in Figure 13.
Outer radius
(Ro) of gap
Outer cylinder
with angular
velocity (ωo)
Inner radius
(Ri) of gap
Inner cylinder
with angular
velocity (ωi)
Gap
Height
Axis of rotation
Figure 13. Standard setup of Taylor-Couette Flow
In order to determine the shear stress on the probe surface, the flow must be defined as
either turbulent or laminar via analysis using CFD and documents pertaining to the
analysis of Taylor-Couette flow. Sufficient data exists on laminar Taylor-Couette flow.
Chhabra’s book [23] on rheology sufficiently describes the equations for shear stress on
25
the surface of a stationary inner cylinder with a rotating outer cylinder as seen in
equation (3)
2 2
2 2 22 o
i o
i i o
R RR R R
(3)
For laminar flow, the torque of the cylinder is related to the surface shear stress by
equation (4).
22w oT R l (4)
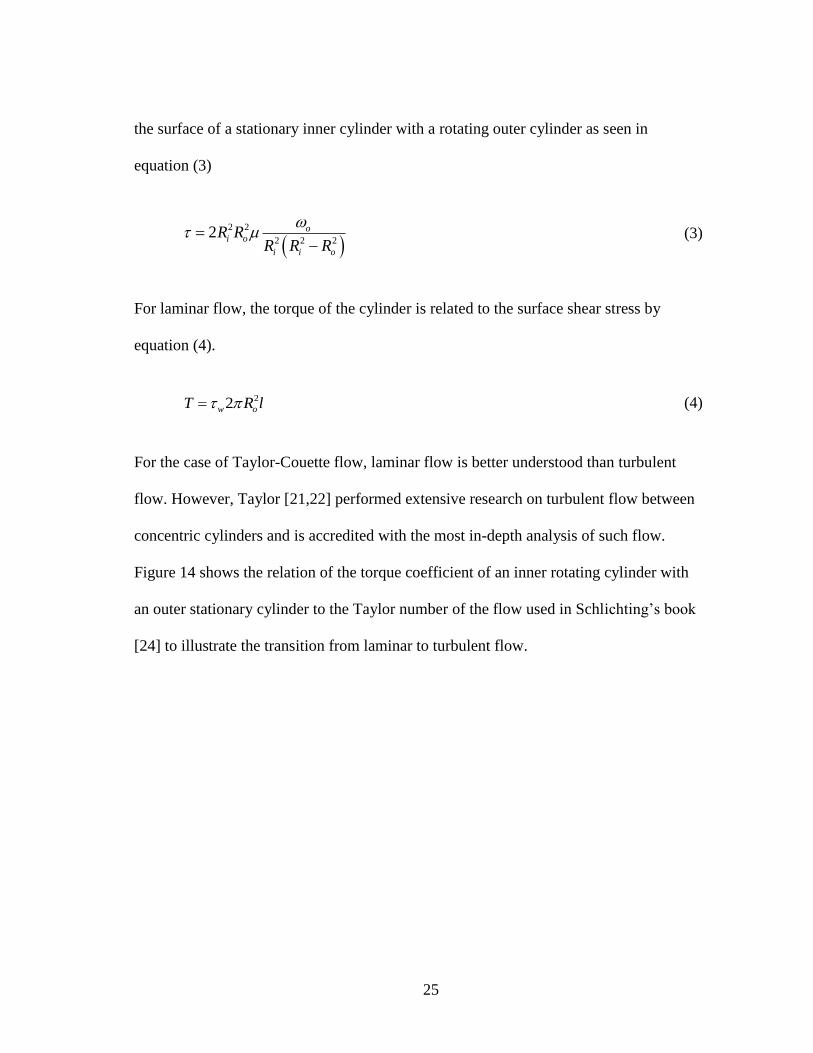
For the case of Taylor-Couette flow, laminar flow is better understood than turbulent
flow. However, Taylor [21,22] performed extensive research on turbulent flow between
concentric cylinders and is accredited with the most in-depth analysis of such flow.
Figure 14 shows the relation of the torque coefficient of an inner rotating cylinder with
an outer stationary cylinder to the Taylor number of the flow used in Schlichting’s book
[24] to illustrate the transition from laminar to turbulent flow.
26
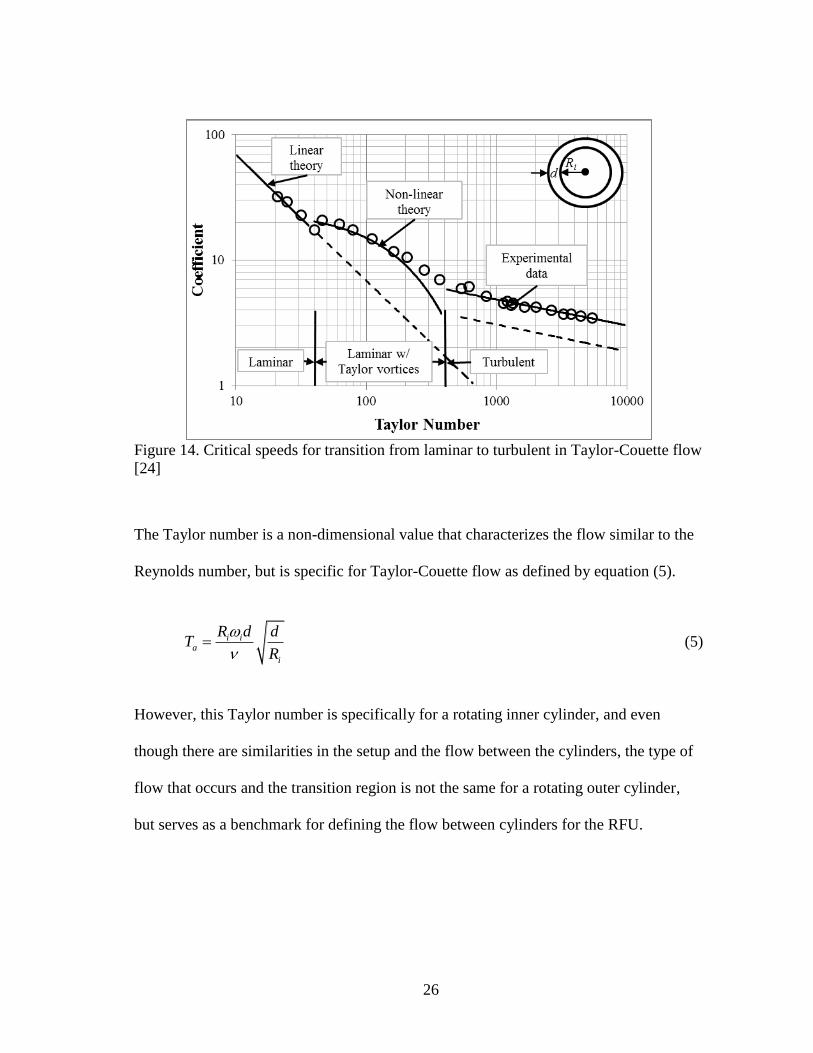
Figure 14. Critical speeds for transition from laminar to turbulent in Taylor-Couette flow
[24]
The Taylor number is a non-dimensional value that characterizes the flow similar to the
Reynolds number, but is specific for Taylor-Couette flow as defined by equation (5).
i ia
i
R d dT
R
(5)
However, this Taylor number is specifically for a rotating inner cylinder, and even
though there are similarities in the setup and the flow between the cylinders, the type of
flow that occurs and the transition region is not the same for a rotating outer cylinder,
but serves as a benchmark for defining the flow between cylinders for the RFU.
27
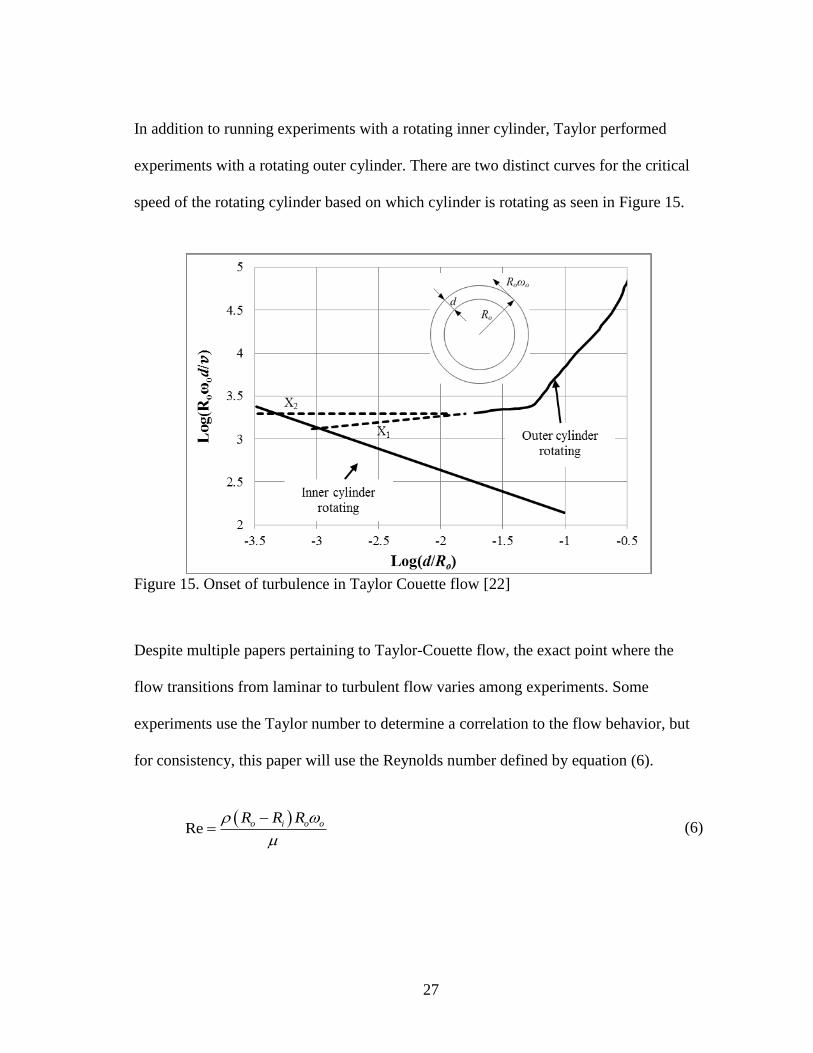
In addition to running experiments with a rotating inner cylinder, Taylor performed
experiments with a rotating outer cylinder. There are two distinct curves for the critical
speed of the rotating cylinder based on which cylinder is rotating as seen in Figure 15.
Figure 15. Onset of turbulence in Taylor Couette flow [22]
Despite multiple papers pertaining to Taylor-Couette flow, the exact point where the
flow transitions from laminar to turbulent flow varies among experiments. Some
experiments use the Taylor number to determine a correlation to the flow behavior, but
for consistency, this paper will use the Reynolds number defined by equation (6).
Re o i o oR R R
(6)
28
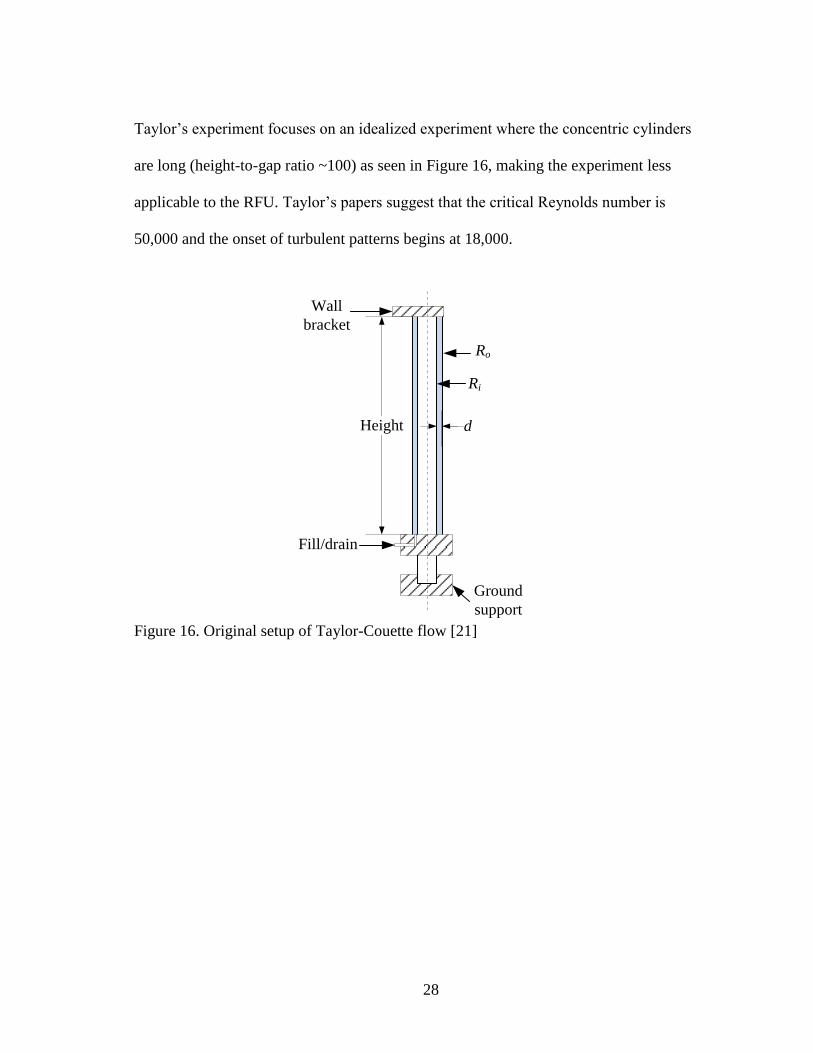
Taylor’s experiment focuses on an idealized experiment where the concentric cylinders
are long (height-to-gap ratio ~100) as seen in Figure 16, making the experiment less
applicable to the RFU. Taylor’s papers suggest that the critical Reynolds number is
50,000 and the onset of turbulent patterns begins at 18,000.
d
Ground
support
Height
Fill/drain
Wall
bracket
Ro
Ri
Figure 16. Original setup of Taylor-Couette flow [21]
29
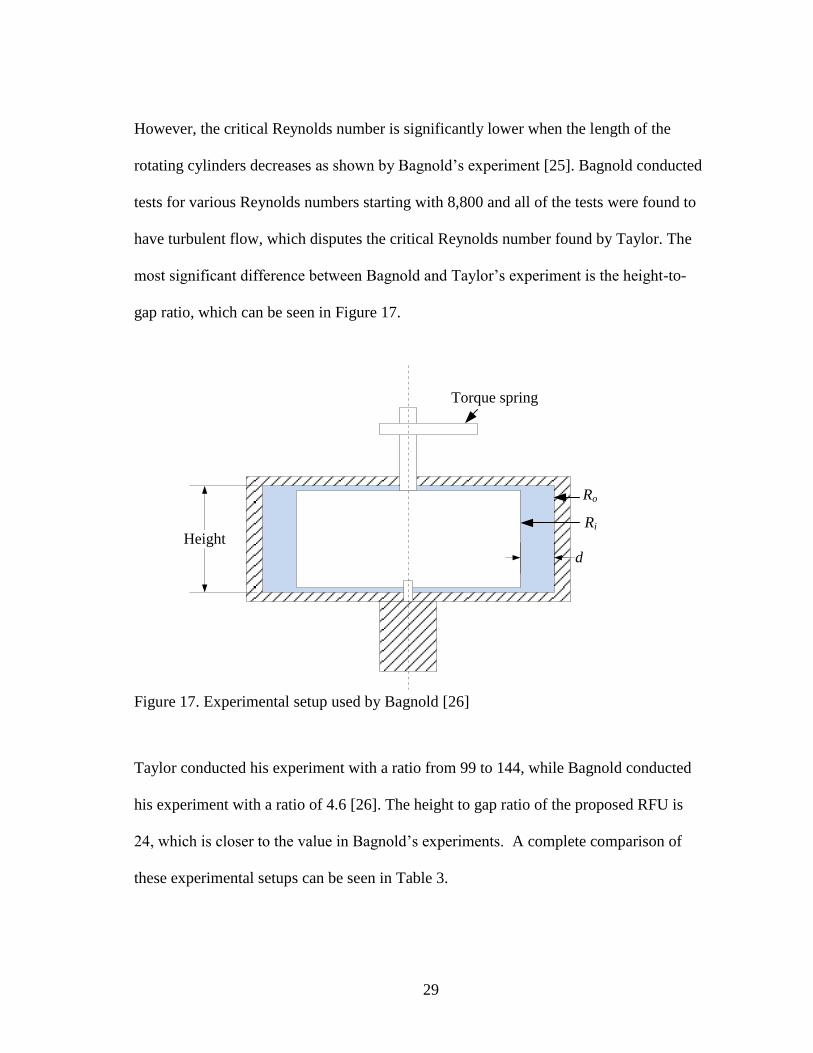
However, the critical Reynolds number is significantly lower when the length of the
rotating cylinders decreases as shown by Bagnold’s experiment [25]. Bagnold conducted
tests for various Reynolds numbers starting with 8,800 and all of the tests were found to
have turbulent flow, which disputes the critical Reynolds number found by Taylor. The
most significant difference between Bagnold and Taylor’s experiment is the height-to-
gap ratio, which can be seen in Figure 17.
d
Height
Ro
Ri
Torque spring
Figure 17. Experimental setup used by Bagnold [26]
Taylor conducted his experiment with a ratio from 99 to 144, while Bagnold conducted
his experiment with a ratio of 4.6 [26]. The height to gap ratio of the proposed RFU is
24, which is closer to the value in Bagnold’s experiments. A complete comparison of
these experimental setups can be seen in Table 3.
30
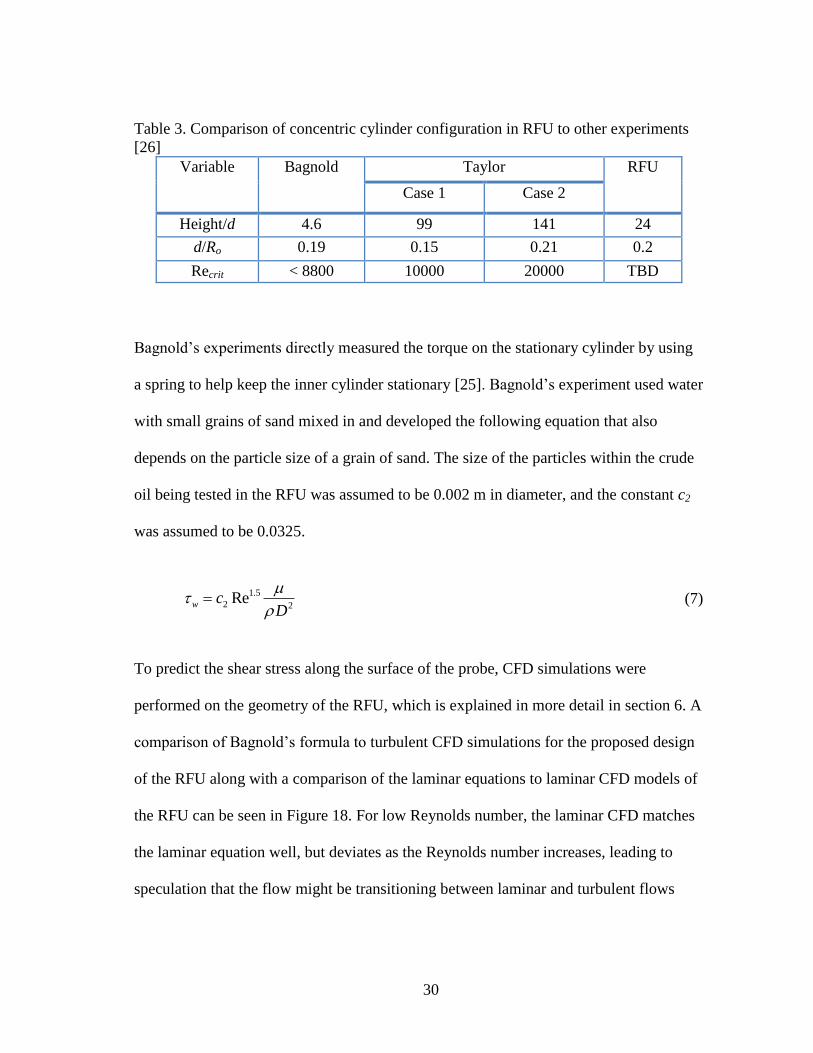
Table 3. Comparison of concentric cylinder configuration in RFU to other experiments
[26]
Variable Bagnold Taylor RFU
Case 1 Case 2
Height/d 4.6 99 141 24
d/Ro 0.19 0.15 0.21 0.2
Recrit < 8800 10000 20000 TBD
Bagnold’s experiments directly measured the torque on the stationary cylinder by using
a spring to help keep the inner cylinder stationary [25]. Bagnold’s experiment used water
with small grains of sand mixed in and developed the following equation that also
depends on the particle size of a grain of sand. The size of the particles within the crude
oil being tested in the RFU was assumed to be 0.002 m in diameter, and the constant c2
was assumed to be 0.0325.
1.5
2 2Rew c
D
(7)
To predict the shear stress along the surface of the probe, CFD simulations were
performed on the geometry of the RFU, which is explained in more detail in section 6. A
comparison of Bagnold’s formula to turbulent CFD simulations for the proposed design
of the RFU along with a comparison of the laminar equations to laminar CFD models of
the RFU can be seen in Figure 18. For low Reynolds number, the laminar CFD matches
the laminar equation well, but deviates as the Reynolds number increases, leading to
speculation that the flow might be transitioning between laminar and turbulent flows
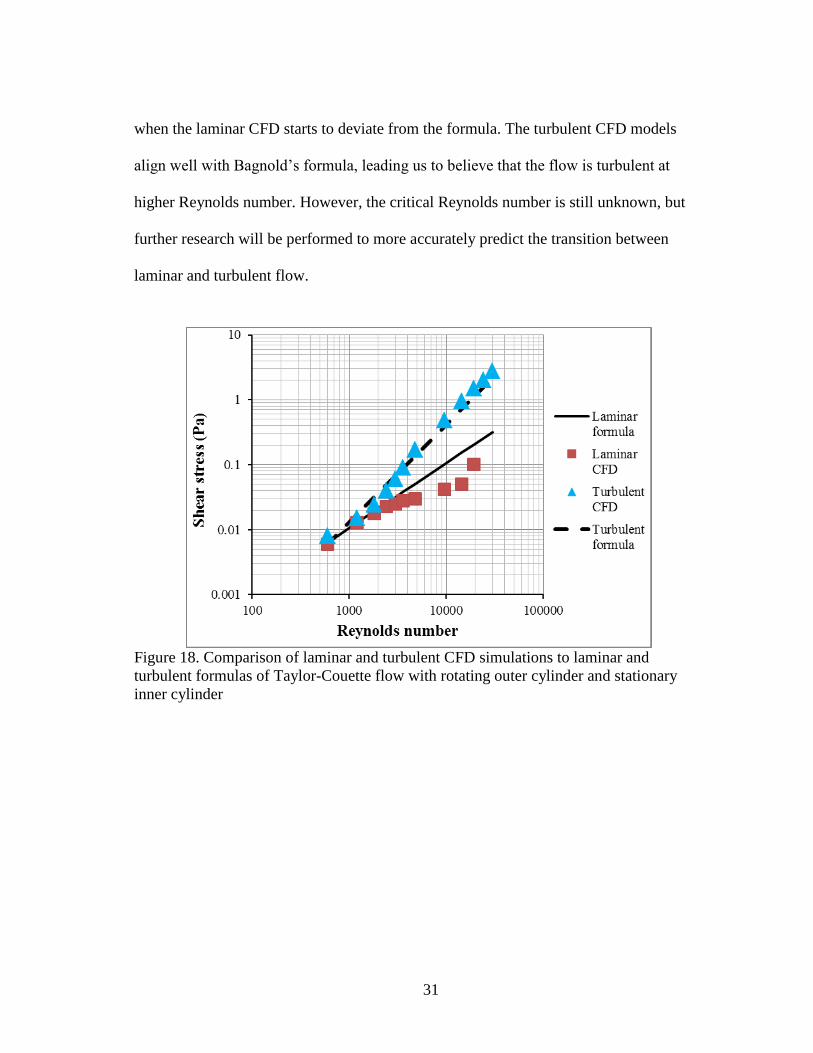
31
when the laminar CFD starts to deviate from the formula. The turbulent CFD models
align well with Bagnold’s formula, leading us to believe that the flow is turbulent at
higher Reynolds number. However, the critical Reynolds number is still unknown, but
further research will be performed to more accurately predict the transition between
laminar and turbulent flow.
Figure 18. Comparison of laminar and turbulent CFD simulations to laminar and
turbulent formulas of Taylor-Couette flow with rotating outer cylinder and stationary
inner cylinder
32
5. VALIDATION OF DESIGN: HEAT TRANSFER COEFFICIENT
In order to decipher the data acquired during a test run in the RFU as it pertains to
fouling, the heat transfer along the surface of the heated stationary inner cylinder must
be well understood. Crittenden’s experiment [15] relies heavily on the results from CFD
to determine the temperature distribution, but we strive to find a correlation that exists in
literature to help us understand the heat transfer along the surface of the inner cylinder in
addition to the use of CFD.
As mentioned previously, the experiments will be conducted predominantly in turbulent
flow to effectively mimic the conditions of the HTFU. The previous section explored
experimental setups of Taylor-Couette flow that studied the flow between the gap and
the shear stress along the surface of the stationary cylinder but did not discuss the heat
transfer within the gap. Similar to the studies of Taylor-Couette flow, the configuration
with an inner cylinder rotating is more common than with an outer cylinder rotating. To
better understand the heat transfer in the RFU, the Nusselt number obtained from CFD
simulations is compared to existing equations of the Nusselt number for various types of
flow described below.
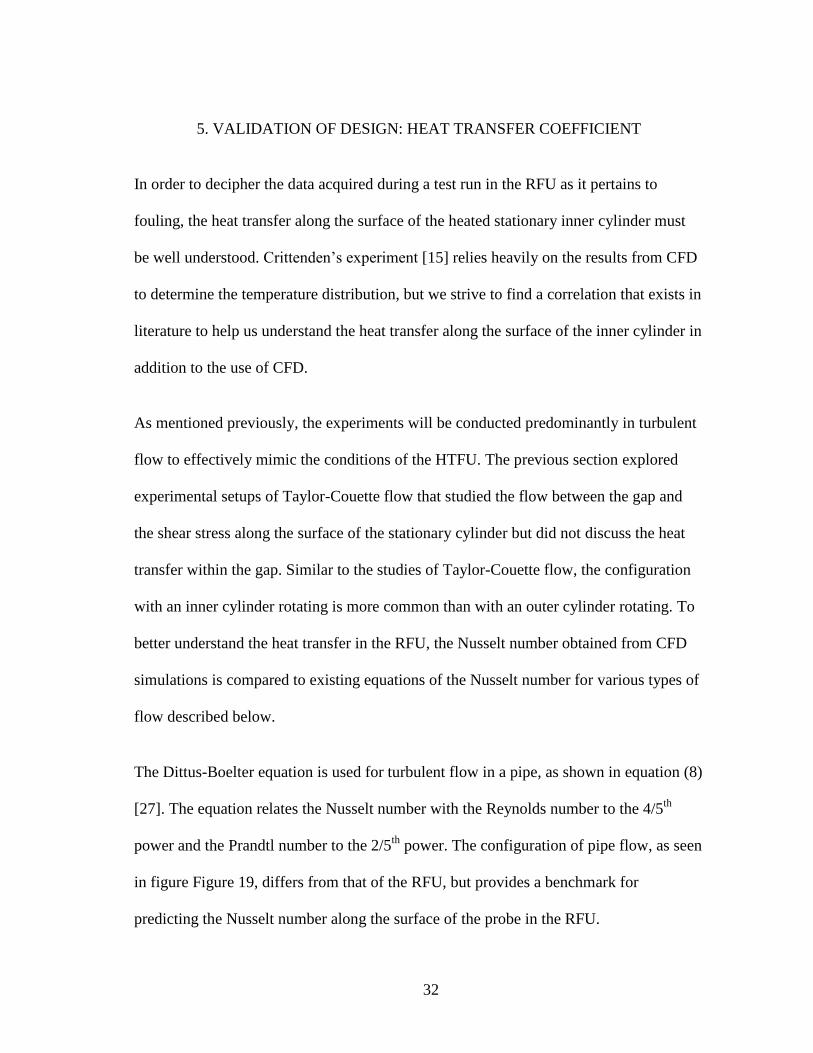
The Dittus-Boelter equation is used for turbulent flow in a pipe, as shown in equation (8)
[27]. The equation relates the Nusselt number with the Reynolds number to the 4/5th
power and the Prandtl number to the 2/5th
power. The configuration of pipe flow, as seen
in figure Figure 19, differs from that of the RFU, but provides a benchmark for
predicting the Nusselt number along the surface of the probe in the RFU.
33
0.8 0.4Nu 0.23Re Pr (8)
Figure 19. Flow through a pipe
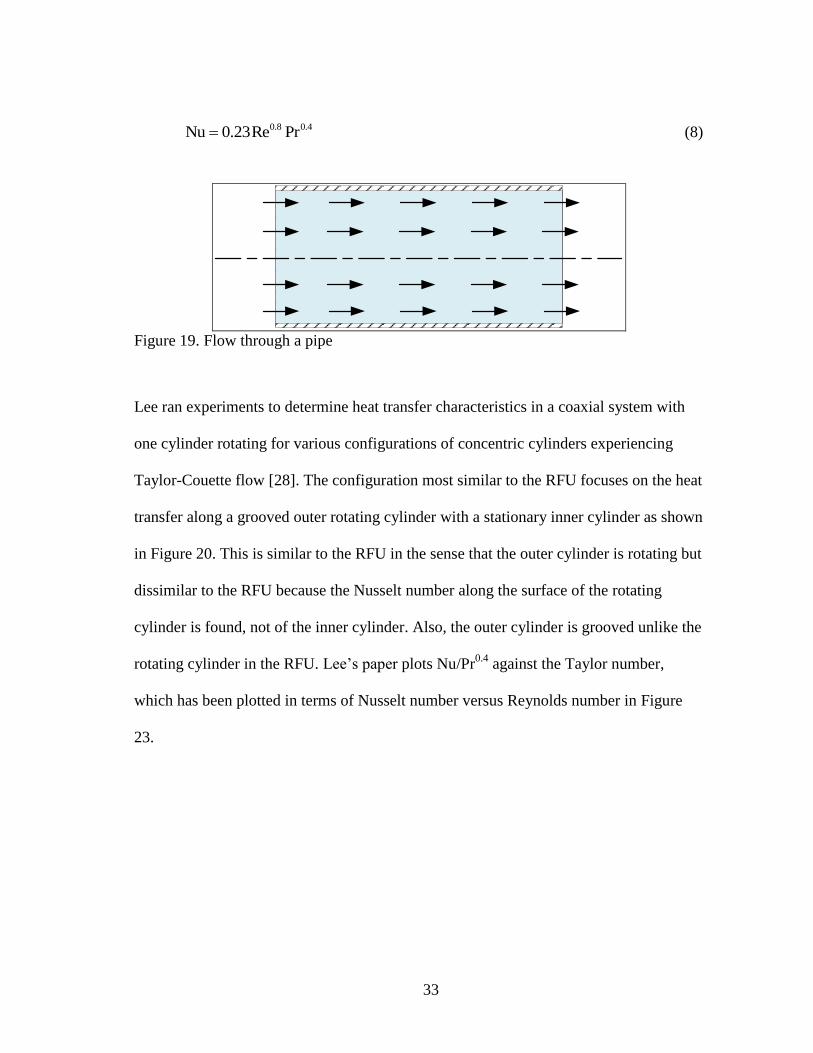
Lee ran experiments to determine heat transfer characteristics in a coaxial system with
one cylinder rotating for various configurations of concentric cylinders experiencing
Taylor-Couette flow [28]. The configuration most similar to the RFU focuses on the heat
transfer along a grooved outer rotating cylinder with a stationary inner cylinder as shown
in Figure 20. This is similar to the RFU in the sense that the outer cylinder is rotating but
dissimilar to the RFU because the Nusselt number along the surface of the rotating
cylinder is found, not of the inner cylinder. Also, the outer cylinder is grooved unlike the
rotating cylinder in the RFU. Lee’s paper plots Nu/Pr0.4
against the Taylor number,
which has been plotted in terms of Nusselt number versus Reynolds number in Figure
23.
34
Grooved
rotating outer
cylinder
Stationary
inner cylinder
Figure 20. Taylor-Couette flow setup for Lee’s experiment
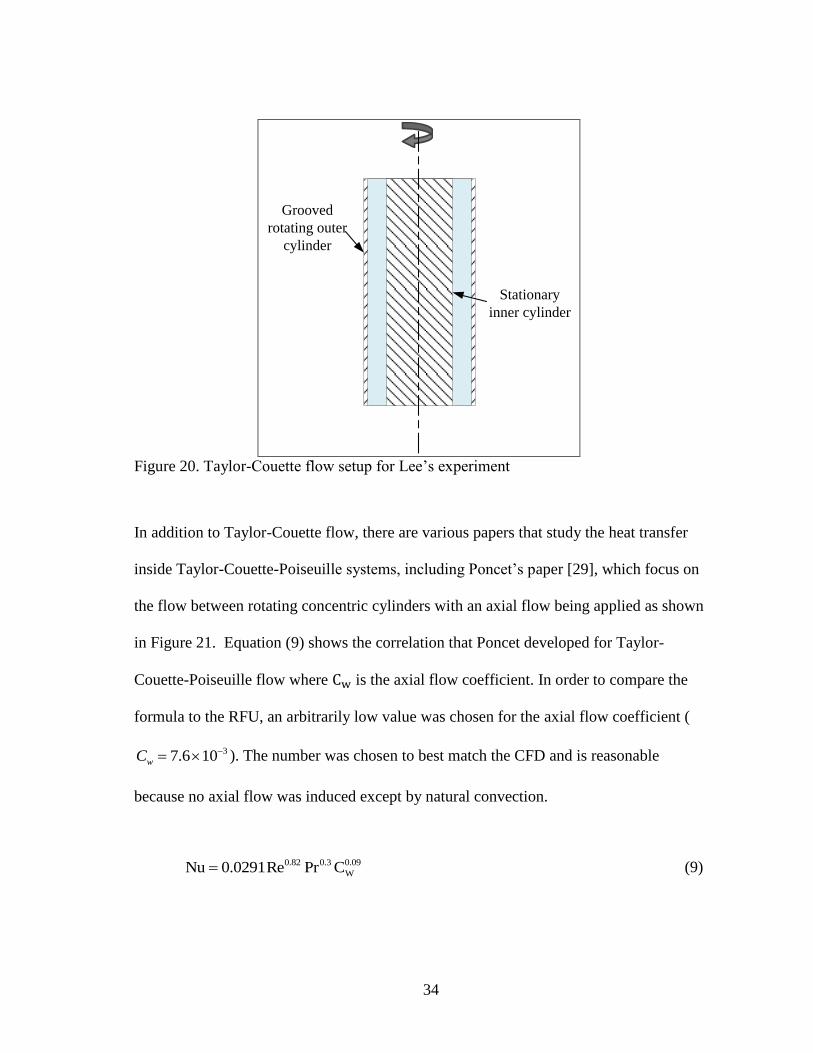
In addition to Taylor-Couette flow, there are various papers that study the heat transfer
inside Taylor-Couette-Poiseuille systems, including Poncet’s paper [29], which focus on
the flow between rotating concentric cylinders with an axial flow being applied as shown
in Figure 21. Equation (9) shows the correlation that Poncet developed for Taylor-
Couette-Poiseuille flow where is the axial flow coefficient. In order to compare the
formula to the RFU, an arbitrarily low value was chosen for the axial flow coefficient (
37.6 10wC ). The number was chosen to best match the CFD and is reasonable
because no axial flow was induced except by natural convection.
0.82 0.3 0.09
WNu 0.0291Re Pr C (9)
35
Rotating inner
cylinder
Stationary
outer cylinder
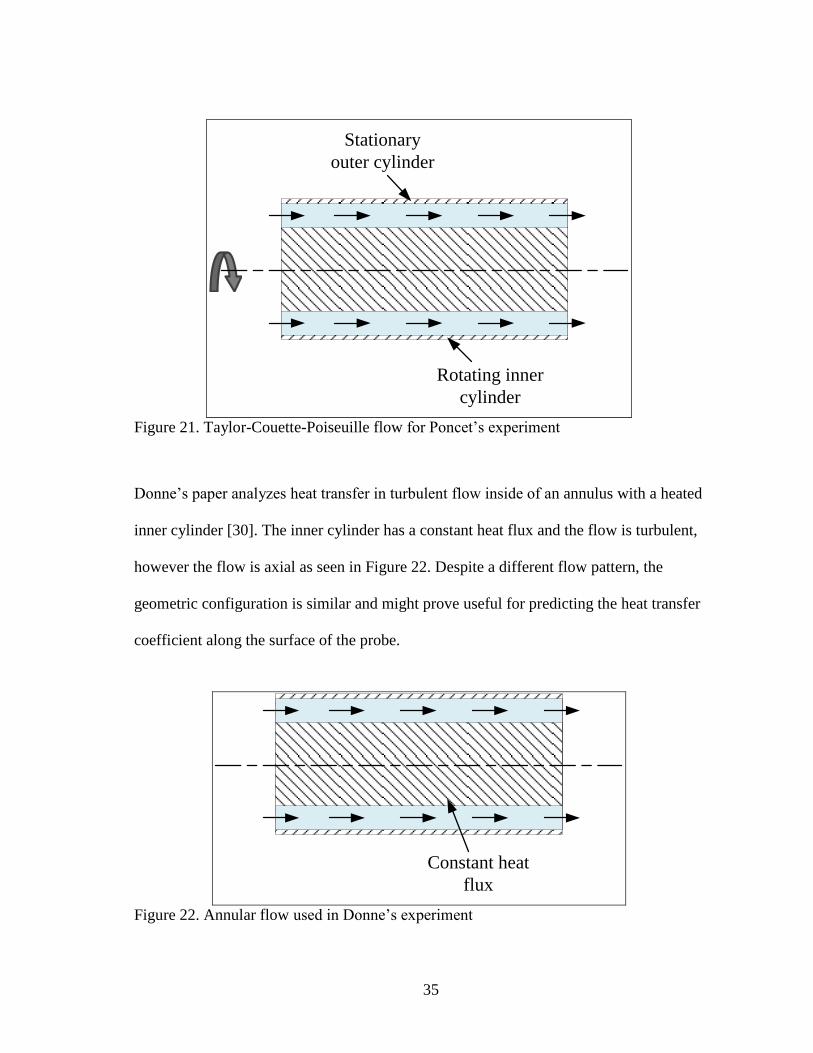
Figure 21. Taylor-Couette-Poiseuille flow for Poncet’s experiment
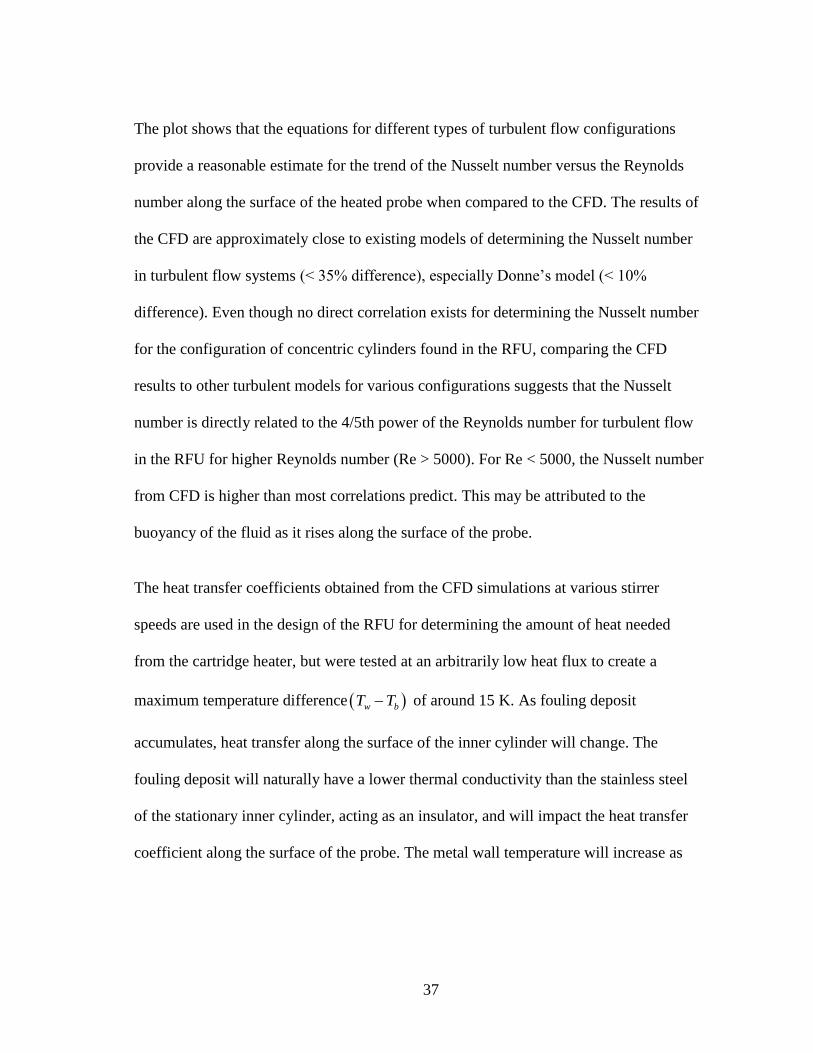
Donne’s paper analyzes heat transfer in turbulent flow inside of an annulus with a heated
inner cylinder [30]. The inner cylinder has a constant heat flux and the flow is turbulent,
however the flow is axial as seen in Figure 22. Despite a different flow pattern, the
geometric configuration is similar and might prove useful for predicting the heat transfer
coefficient along the surface of the probe.
Constant heat
flux
Figure 22. Annular flow used in Donne’s experiment

36
Equation (10) [30] shows a relation between the Nusselt, Reynolds, and Prandtl numbers
like other correlations, but also shows a dependence on the radius ratio of the concentric
cylinders.
0.2 0.18
0.8 0.4Nu 0.0181 Re Pro win
i inlet
R T
R T
(10)
The heat transfer coefficient on the surface of the stationary cylinder was determined in
the CFD simulation and compared to various correlations from various sources
pertaining to the calculation of the Nusselt number in turbulent flow conditions. The
comparison of the CFD to the previously mentioned equations and experiments can be
seen in Figure 23.
Figure 23. Comparison of Nusselt number from CFD with literature correlations
37
The plot shows that the equations for different types of turbulent flow configurations
provide a reasonable estimate for the trend of the Nusselt number versus the Reynolds
number along the surface of the heated probe when compared to the CFD. The results of
the CFD are approximately close to existing models of determining the Nusselt number
in turbulent flow systems (< 35% difference), especially Donne’s model (< 10%
difference). Even though no direct correlation exists for determining the Nusselt number
for the configuration of concentric cylinders found in the RFU, comparing the CFD
results to other turbulent models for various configurations suggests that the Nusselt
number is directly related to the 4/5th power of the Reynolds number for turbulent flow
in the RFU for higher Reynolds number (Re > 5000). For Re < 5000, the Nusselt number
from CFD is higher than most correlations predict. This may be attributed to the
buoyancy of the fluid as it rises along the surface of the probe.
The heat transfer coefficients obtained from the CFD simulations at various stirrer
speeds are used in the design of the RFU for determining the amount of heat needed
from the cartridge heater, but were tested at an arbitrarily low heat flux to create a
maximum temperature difference w bT T of around 15 K. As fouling deposit
accumulates, heat transfer along the surface of the inner cylinder will change. The
fouling deposit will naturally have a lower thermal conductivity than the stainless steel
of the stationary inner cylinder, acting as an insulator, and will impact the heat transfer
coefficient along the surface of the probe. The metal wall temperature will increase as

38
the fouling deposit increases. Future CFD simulations can be created to simulate fouling
and the effects of fouling on the surface heat transfer.
39
6. USE OF CFD FOR MODELING THE RFU
In order to predict the shear stress and heat transfer coefficient in the RFU using CFD
mentioned in sections 4 and 5, the mesh must be well-made to ensure that the CFD
provides a nearly grid-independent solution. For this experiment ANSYS
DesignModeler® was used to create the 2D geometry of the RFU, and was then meshed
using ANSYS Mesh®. The mesh was imported into FLUENT
® where the boundary and
initial conditions were set and simulations were run for 10,000 iterations.
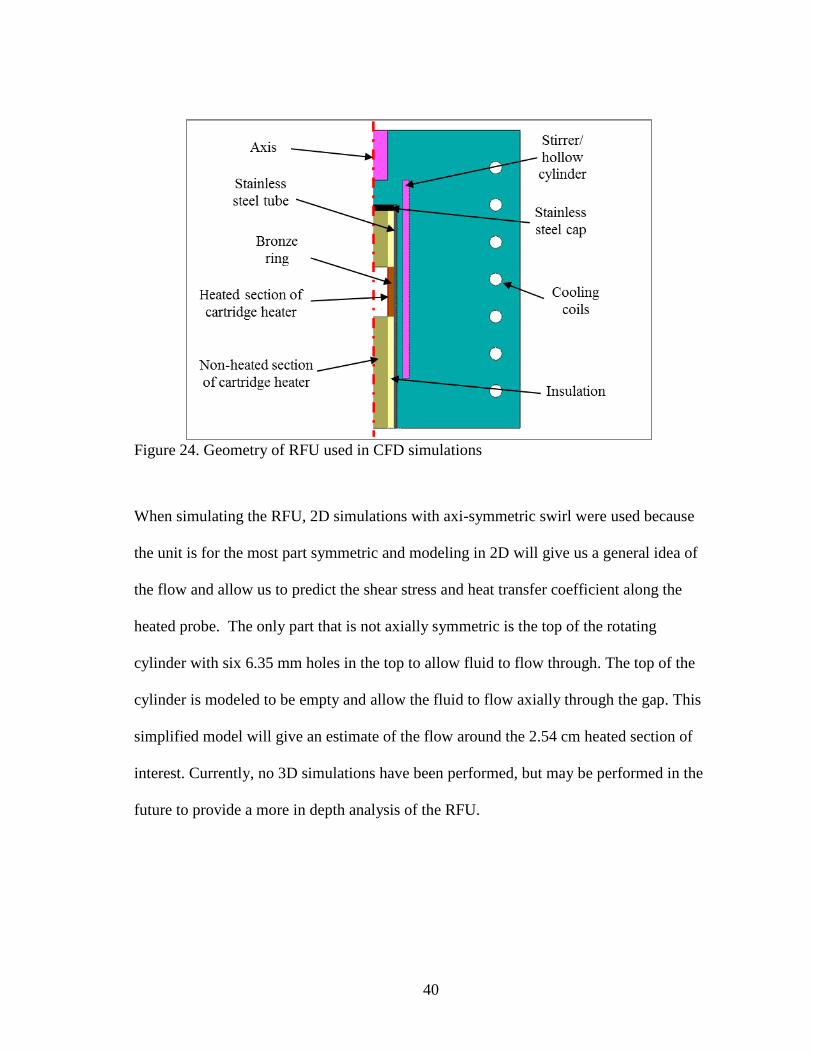
6.1. Geometry of the RFU using DesignModeler
The geometry used for the mesh is created with the same dimensions as the actual unit.
The most critical section of the unit is the gap between the heated section of the probe
and the rotating hollow cylinder. We would like to accurately predict the temperature
distribution throughout the probe and accurately represent each part of the probe,
including the cartridge heater, the bronze ring, and the outer stainless steel tube as seen
in Figure 24. The cooling coils are represented by circles cut out from the geometry and
the heated portion of the cartridge heater is represented by a rectangle cut out from the
cartridge heater. Because the unit is symmetrical, the axis is on the left hand side of the
sketch of the geometry. All rotation occurs about this axis.
40
Figure 24. Geometry of RFU used in CFD simulations
When simulating the RFU, 2D simulations with axi-symmetric swirl were used because
the unit is for the most part symmetric and modeling in 2D will give us a general idea of
the flow and allow us to predict the shear stress and heat transfer coefficient along the
heated probe. The only part that is not axially symmetric is the top of the rotating
cylinder with six 6.35 mm holes in the top to allow fluid to flow through. The top of the
cylinder is modeled to be empty and allow the fluid to flow axially through the gap. This
simplified model will give an estimate of the flow around the 2.54 cm heated section of
interest. Currently, no 3D simulations have been performed, but may be performed in the
future to provide a more in depth analysis of the RFU.
41
6.2. Mesh of the RFU using ANSYS Mesh®
CFD depends heavily on the quality of the mesh, and the results obtained from one mesh
can differ from another even if the geometry for each simulation is the same. The
objective is to refine the mesh until the solution results between two successive meshes
to less than 5 percent for the shear stress, heat transfer coefficient, and temperature. By
limiting the difference between two meshes, the results from the finest mesh can be
assumed to be a sufficiently accurate prediction of the flow and heat transfer within the
actual system. Even though predictions may not always be exact, they provide a good
benchmark for effectively gauging the capabilities of the RFU.
CFD simulations for three different meshes of the RFU were compared. Initially, one
mesh was created and was refined twice along the surface of the probe and the rotating
hollow cylinder to create better resolution along those surfaces. The y+ value is a non-
dimensional distance based on the friction velocity along the wall, the size of the mesh,
and the kinematic viscosity of the fluid and is defined by Equation (11). A lower y+
value (< 1) is desirable because a finer mesh resolves boundary layer gradients to more
accuracy. Table 4 shows the comparison of y+ values for each mesh size used in this
study using a rotational speed of 2000 rpm.
*u yy
(11)
42
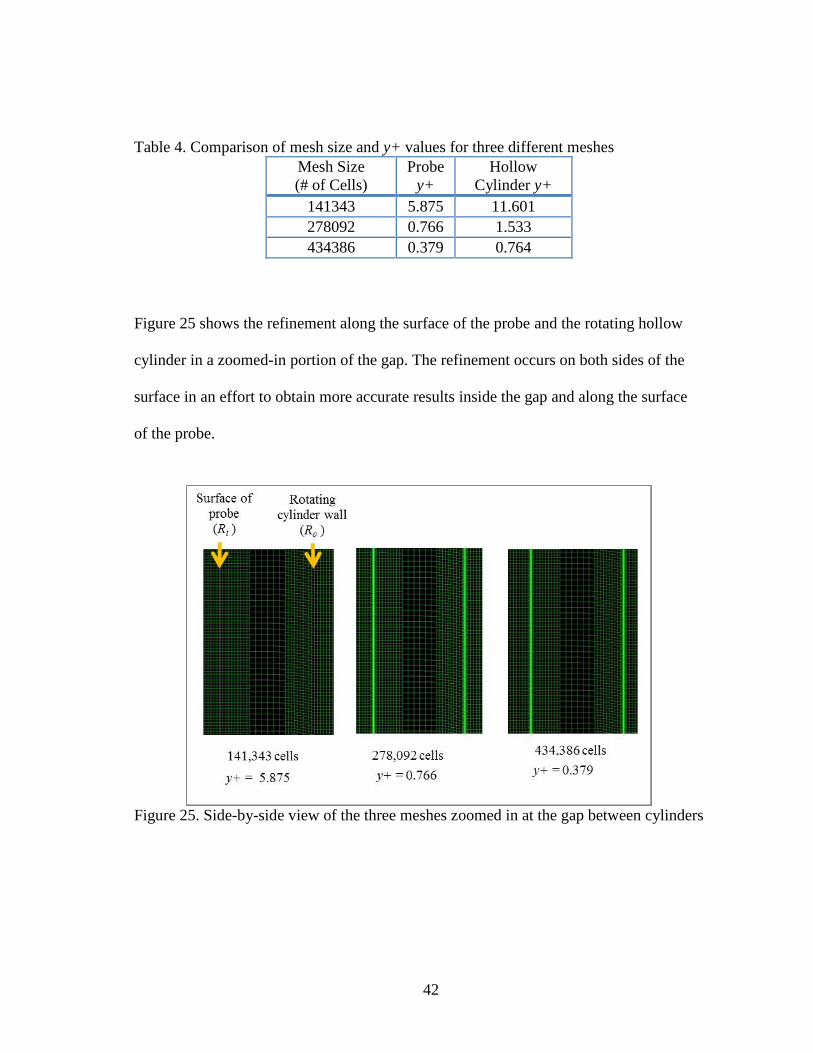
Table 4. Comparison of mesh size and y+ values for three different meshes
Mesh Size
(# of Cells)
Probe
y+
Hollow
Cylinder y+
141343 5.875 11.601
278092 0.766 1.533
434386 0.379 0.764
Figure 25 shows the refinement along the surface of the probe and the rotating hollow
cylinder in a zoomed-in portion of the gap. The refinement occurs on both sides of the
surface in an effort to obtain more accurate results inside the gap and along the surface
of the probe.
Figure 25. Side-by-side view of the three meshes zoomed in at the gap between cylinders
43
6.2.1. Setup of the mesh using FLUENT®
In order to select the proper mesh to use for all future simulations, each mesh was run
for 10,000 iterations at 2000 rpm using the fluid properties for a specific crude oil with
identical initial and boundary conditions using the k-omega turbulence model, as shown
in Table 5. The laminar model was used for the laminar comparison previously shown in
Figure 18. All other simulations have used the turbulent model. Within FLUENT® the
two most important boundary conditions set are momentum and temperature boundary
conditions. The momentum boundary conditions only apply at surfaces where there is a
solid-fluid interface. When modeling the RFU, three types of thermal boundary
conditions can be set: a constant temperature, a constant heat flux, or a convection
coefficient. For the case of these experiments, an arbitrarily low constant heat flux was
chosen for the cartridge heater and a constant temperature was chosen for the cooling
coils.
The mesh results can be compared at various initial conditions and boundary conditions
to help further validate the use of the finest mesh for the expected results, i.e. the shear
stress and heat transfer coefficient mentioned in the previous two sections. To determine
a mesh to use for all future simulations, this set of simulations was performed at a stirrer
speed (2000 rpm) higher than the maximum stirrer speed (1700 rpm) of the RFU to
ensure that the same mesh could be used for lower stirrer speeds because y+ values
decrease as the stirrer speed decreases, and low y+ values are more desirable.
44
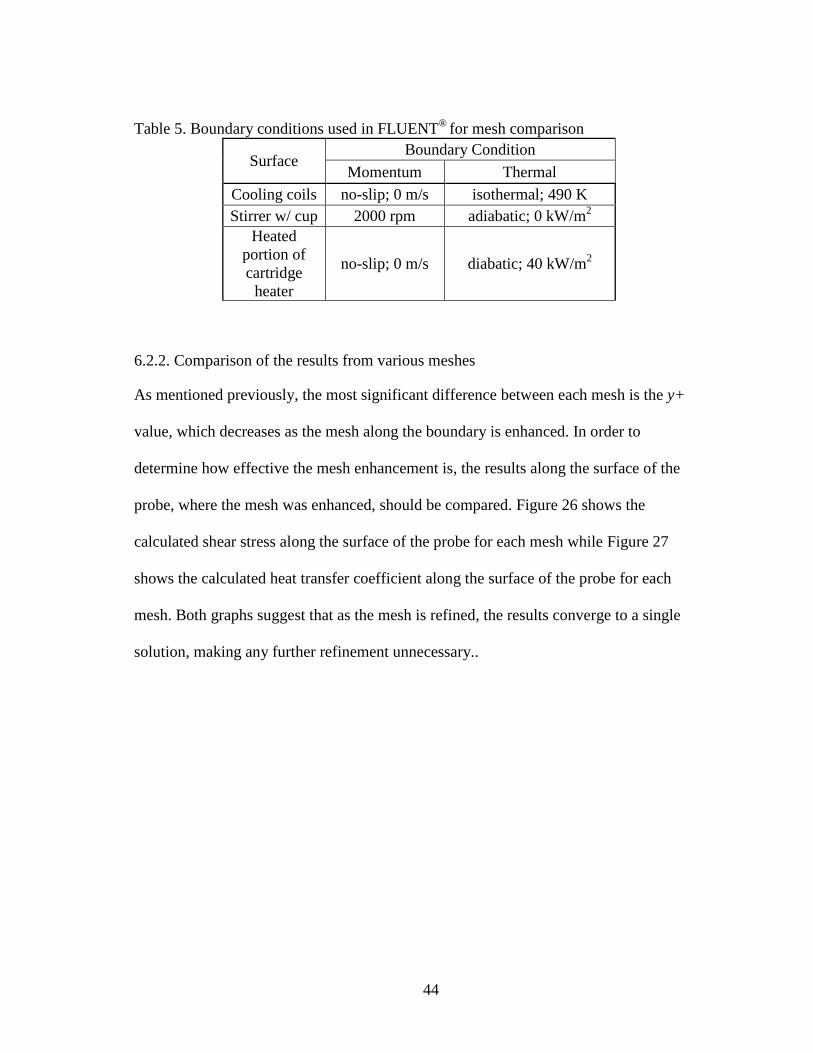
Table 5. Boundary conditions used in FLUENT®
for mesh comparison
Surface Boundary Condition
Momentum Thermal
Cooling coils no-slip; 0 m/s isothermal; 490 K
Stirrer w/ cup 2000 rpm adiabatic; 0 kW/m2
Heated
portion of
cartridge
heater
no-slip; 0 m/s diabatic; 40 kW/m2
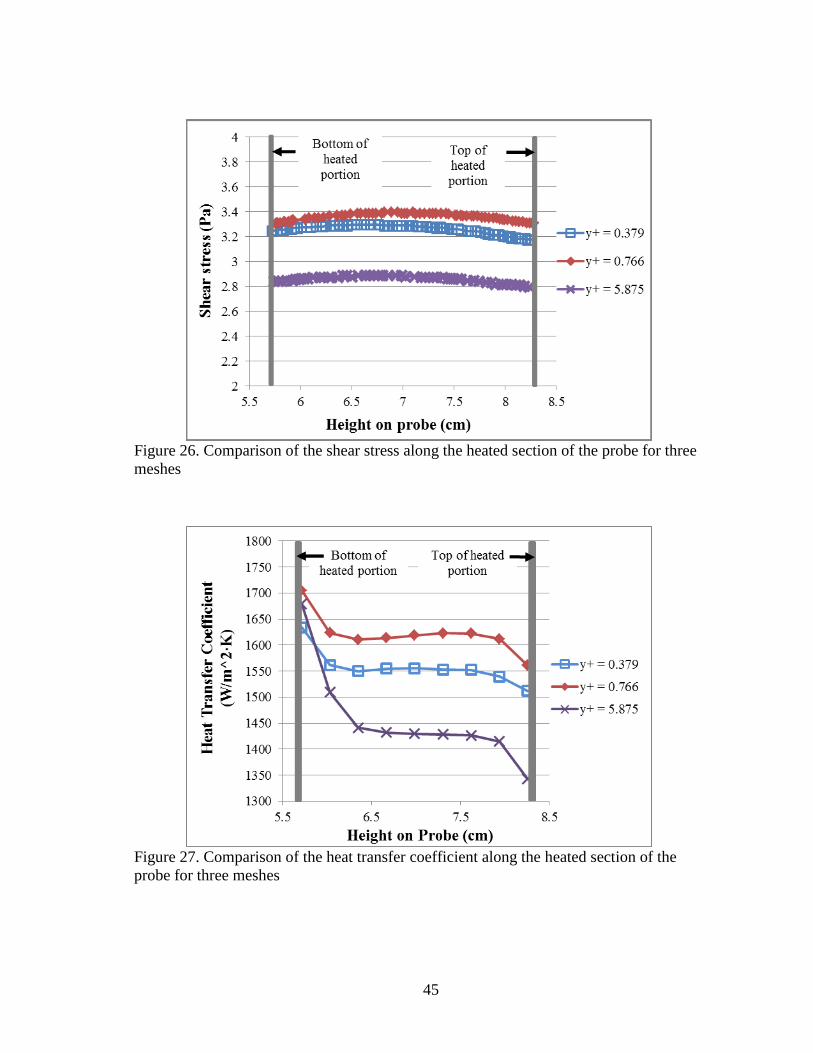
6.2.2. Comparison of the results from various meshes
As mentioned previously, the most significant difference between each mesh is the y+
value, which decreases as the mesh along the boundary is enhanced. In order to
determine how effective the mesh enhancement is, the results along the surface of the
probe, where the mesh was enhanced, should be compared. Figure 26 shows the
calculated shear stress along the surface of the probe for each mesh while Figure 27
shows the calculated heat transfer coefficient along the surface of the probe for each
mesh. Both graphs suggest that as the mesh is refined, the results converge to a single
solution, making any further refinement unnecessary..
45
Figure 26. Comparison of the shear stress along the heated section of the probe for three
meshes
Figure 27. Comparison of the heat transfer coefficient along the heated section of the
probe for three meshes
46
Therefore the mesh with 434,386 cells was used for all future comparisons and
simulations of the RFU.
6.3. Results from the CFD at 1600 rpm
In addition to predicting the shear stress and heat transfer coefficient along the heated
surface of the probe, CFD is used to predict flow patterns that occur in the RFU. At
lower stirring speeds, the dominant flow occurs from the buoyancy of the crude oil as it
is heated by the heated probe. This causes the crude oil to flow upward through the gap
and allows for recirculation of the fluid, preventing the crude oil from remaining
stagnant and cooking along the surface of the probe. As the stirrer speed increases, the
tangential velocity becomes more dominant and heavily impacts the shear stress along
the surface of the probe. Knowing the flow pattern of the crude oil inside of the RFU is
important when trying to relate the results from the RFU to the HTFU. All initial
simulations to obtain results with a stirrer speed of 1600 rpm were performed with the
boundary conditions found in Table 6.
Table 6. Boundary conditions in FLUENT® for results at 1600 rpm
Surface Boundary Condition
Momentum Thermal
Cooling coils no-slip; 0 m/s isothermal; 490 K
Stirrer w/ cup 1600 rpm adiabatic; 0 kW/m2
Heated
portion of
cartridge
heater
no-slip; 0 m/s diabatic; 40 kW/m2
47
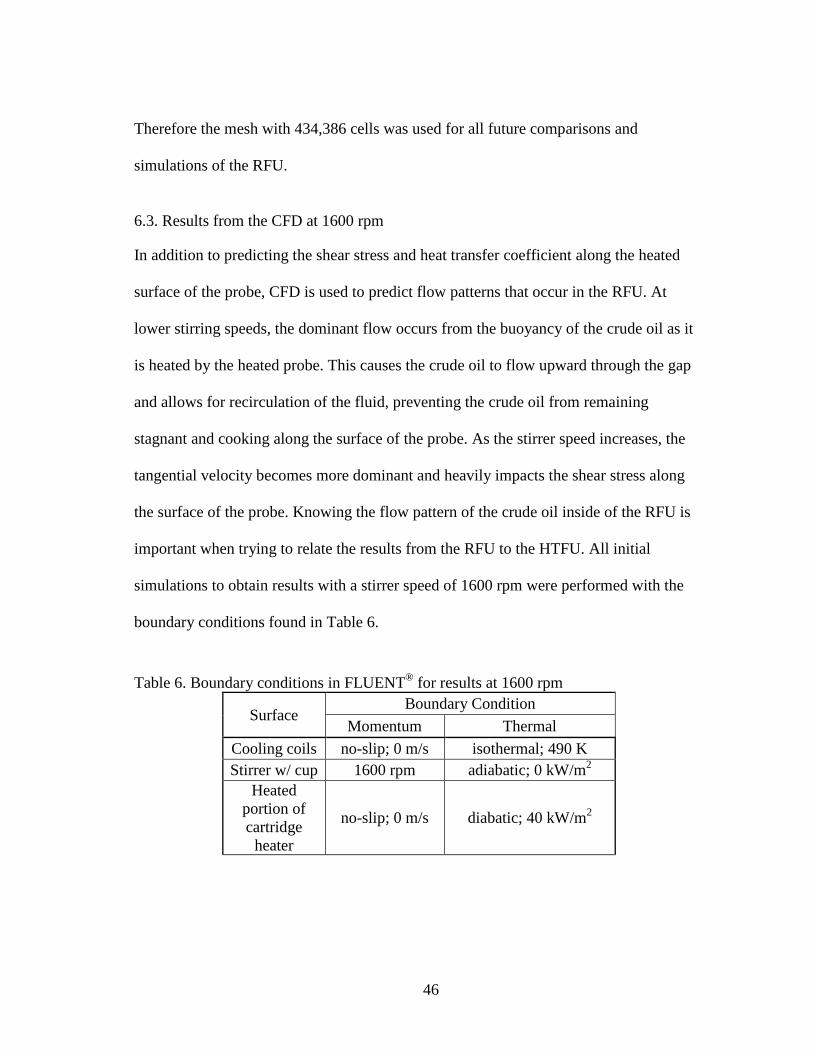
The flow pattern comparisons were made at a stirrer speed of 1600 rpm because it is a
more accurate representation of the capability of the RFU than the 2000 rpm that was
used for comparison purposes. Figure 28 shows the contour plot of the axial velocity in
the RFU with a stirrer speed of 1600 rpm.
Figure 28. Axial velocity contour plot of the RFU at 1600 rpm
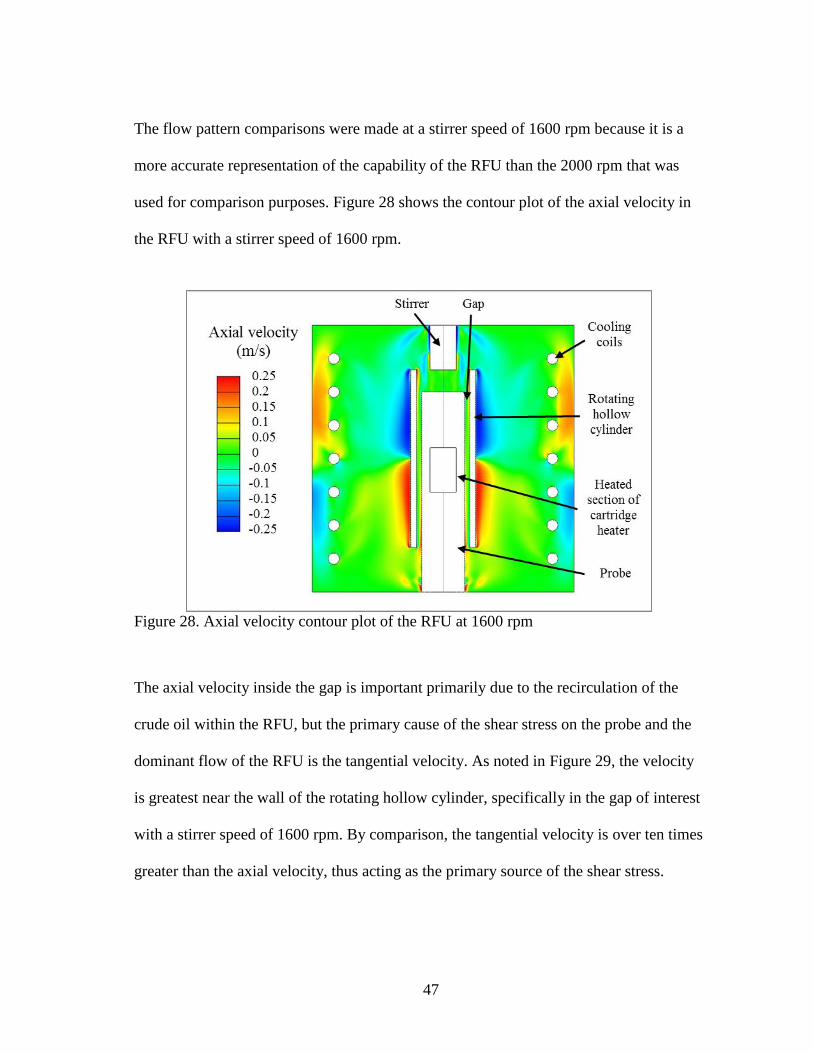
The axial velocity inside the gap is important primarily due to the recirculation of the
crude oil within the RFU, but the primary cause of the shear stress on the probe and the
dominant flow of the RFU is the tangential velocity. As noted in Figure 29, the velocity
is greatest near the wall of the rotating hollow cylinder, specifically in the gap of interest
with a stirrer speed of 1600 rpm. By comparison, the tangential velocity is over ten times
greater than the axial velocity, thus acting as the primary source of the shear stress.
48
Figure 29. Tangential velocity contour plot of the RFU at 1600 rpm
As mentioned previously, the probe heats the crude oil, leading to recirculation from
buoyancy. This continually refreshes the crude exposed to the heated surface, reducing
the chance of eliminating fouling precursors. The flow pattern of the fluid at 1600 rpm is
shown below in Figure 30.
49
Figure 30. Velocity vectors of flow in RFU at 1600 rpm shaded with temperature
gradient
The most important aspect of the RFU is the gap because that is where the flow along
the test surface occurs and where the heating of the fluid occurs. Figure 31 shows three
enlarged images of the heated portion of the gap to demonstrate the upwards flow from
the effects of buoyancy as the fluid is heated. The flow is upwards, showing that the
crude oil will be recirculating through the gap and travelling from the bottom to the top
of the unit.
50
Figure 31. Enlarged image of the heated section of the gap at 1600 rpm showing the
temperature, tangential velocity and axial velocity of the fluid
To better understand the magnitude of the velocity, Figure 32 shows the tangential
velocity of the fluid inside the gap at three heights: above the heated section, below the
heated sections, and at the center of the heated section. For FLUENT®, the tangential
velocity is the velocity into the page or around the axis. The tangential velocity does not
change significantly for the various heights because the hollow cylinder is the main
driving force of the fluid and the cylinder is moving at a constant stirring speed. The
slight difference in the tangential velocity can be attributed to the change in density that
occurs as the fluid is heated and moves through the gap.
51
Figure 32. Comparison of velocity in the gap at three different heights at 1600 rpm
The predominant flow inside the gap is tangential and is caused by the rotating hollow
cylinder, however axial flow also occurs due to buoyancy of the fluid as the fluid is
heated by the cartridge heater. The buoyancy also leads to recirculation of the fluid
inside the unit and can be seen at three different heights with a constant stirrer speed of
1600 rpm in Figure 33. At all three heights, the fluid is moving upwards through the gap
and then recirculates downward into the remainder of the vessel.
52
Figure 33. Axial velocity at three different heights in the RFU at 1600 rpm
6.4. Comparison of results at varying rpm
The RFU was designed to operate at a variety of rotation speeds up to 1700 rpm so that
fouling experiments can be performed at different levels of shear stress. However,
different rotation speeds lead to different flow patterns within the unit, which can be
predicted through the use of CFD. Simulations were run for rotational speeds ranging
from 0 to 2000 rpm. The boundary conditions used for this comparison can be found in
Table 7.
53
Table 7. Boundary conditions used in FLUENT® for comparison of rotation speeds from
0 to 2000 rpm
Surface Boundary Condition
Momentum Thermal
Cooling coils no-slip; 0 m/s isothermal; 490 K
Stirrer w/ cup 0-2000 rpm adiabatic; 0 kW/m2
Heated
portion of
cartridge
heater
no-slip; 0 m/s diabatic; 40 kW/m2
Figure 34 shows the tangential velocity in the gap at the middle of the heated section
(6.88 cm from the bottom of the unit) for various rotational speeds from 0 to 2000 rpm.
The velocity at the surface of the probe (0 m/s) and the velocity along the rotating
hollow cylinder (Roωo) are the same for each stirrer speed and at every height in the gap
as the specified boundary condition. The main difference in velocity occurs within the
gap. As expected, the tangential velocity is higher for higher rotation speeds of the
hollow cylinder.
54
Figure 34. Tangential velocity in the gap of the RFU at the center of the heated section
(6.98 cm)
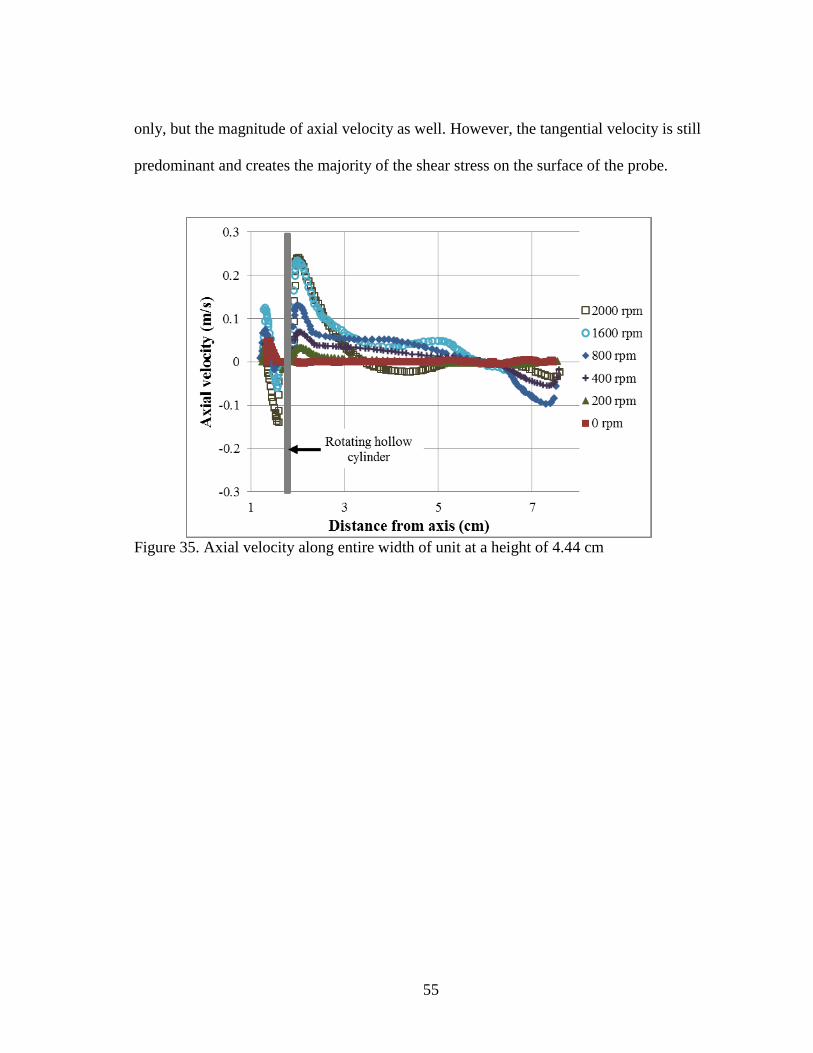
In addition to comparing the tangential velocity in the gap for various stirrer speeds, the
axial velocity at three heights across the entire width of the unit are compared to further
illustrate the recirculation that occurs inside the RFU. Figures 35 to 37 show the axial
velocity across the width of the unit 4.45, 6.98, and 9.53 cm from the bottom of the unit
respectively. For stirrer speeds between 400 and 1600 rpm, the flow pattern appears to
be similar with the higher stirrer speeds having greater magnitudes of axial velocities.
However, comparing the axial velocities from each height at 200 rpm suggests that the
point where the difference in buoyancy affects the axial direction of the fluid along the
outer surface of the rotating hollow cylinder is higher than 9.53 cm from the bottom of
the probe, and for 2000 rpm suggests that point is lower than 6.98 cm from the bottom.
These plots show that an increased stirrer speed does not increase the tangential speed
55
only, but the magnitude of axial velocity as well. However, the tangential velocity is still
predominant and creates the majority of the shear stress on the surface of the probe.
Figure 35. Axial velocity along entire width of unit at a height of 4.44 cm
56
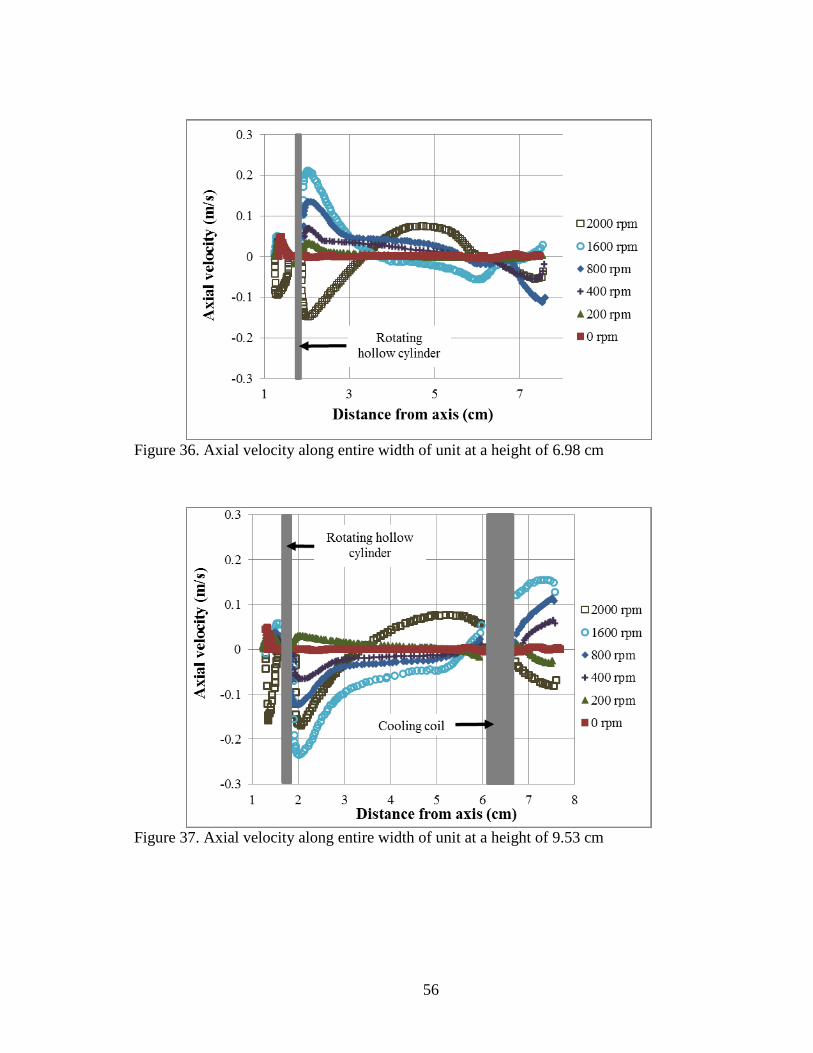
Figure 36. Axial velocity along entire width of unit at a height of 6.98 cm
Figure 37. Axial velocity along entire width of unit at a height of 9.53 cm
57
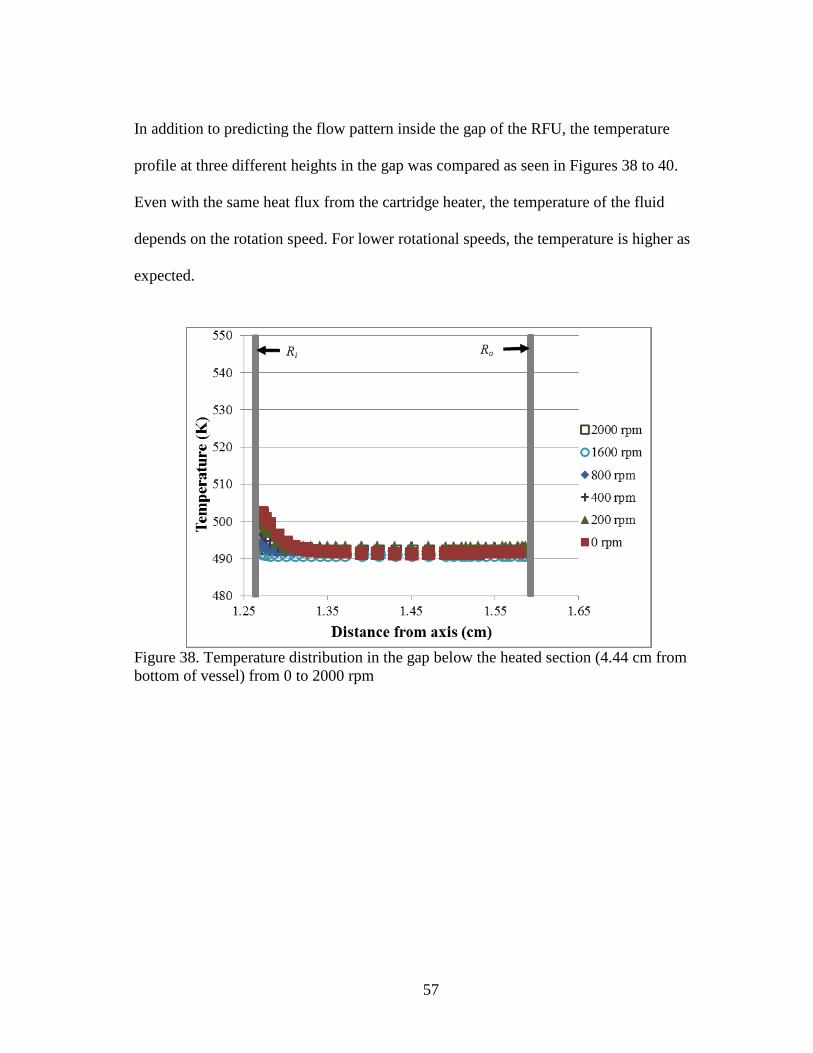
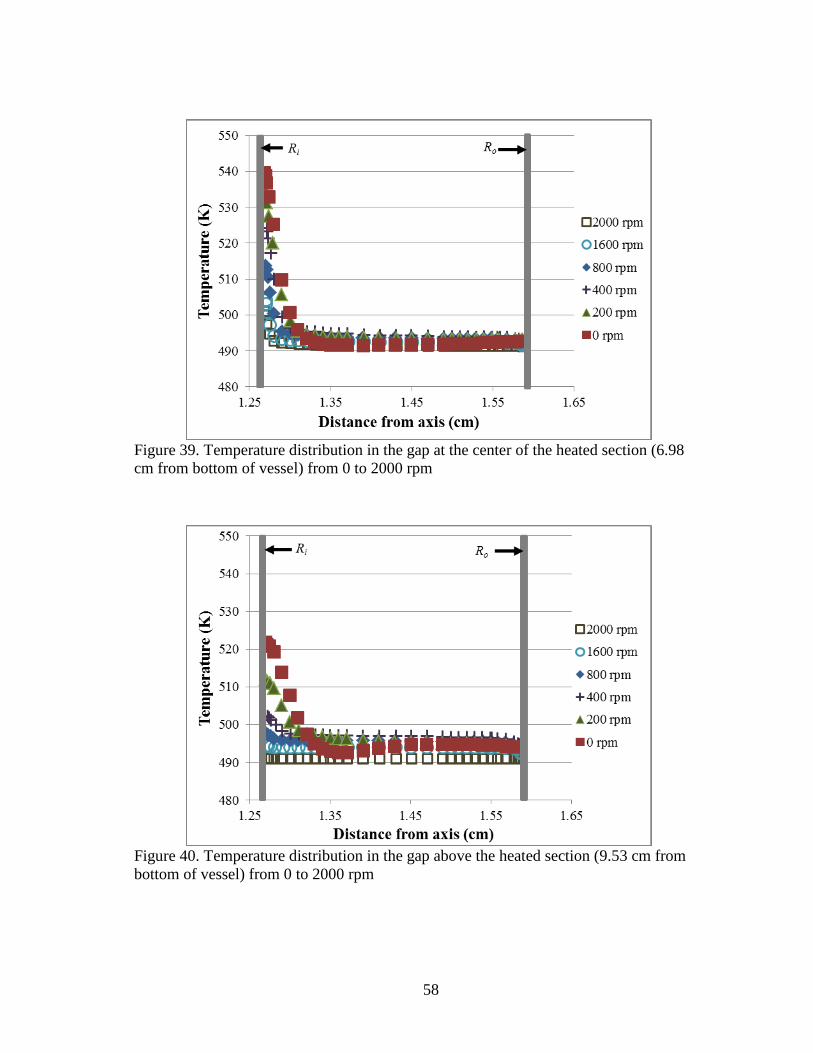
In addition to predicting the flow pattern inside the gap of the RFU, the temperature
profile at three different heights in the gap was compared as seen in Figures 38 to 40.
Even with the same heat flux from the cartridge heater, the temperature of the fluid
depends on the rotation speed. For lower rotational speeds, the temperature is higher as
expected.
Figure 38. Temperature distribution in the gap below the heated section (4.44 cm from
bottom of vessel) from 0 to 2000 rpm
58
Figure 39. Temperature distribution in the gap at the center of the heated section (6.98
cm from bottom of vessel) from 0 to 2000 rpm
Figure 40. Temperature distribution in the gap above the heated section (9.53 cm from
bottom of vessel) from 0 to 2000 rpm
59
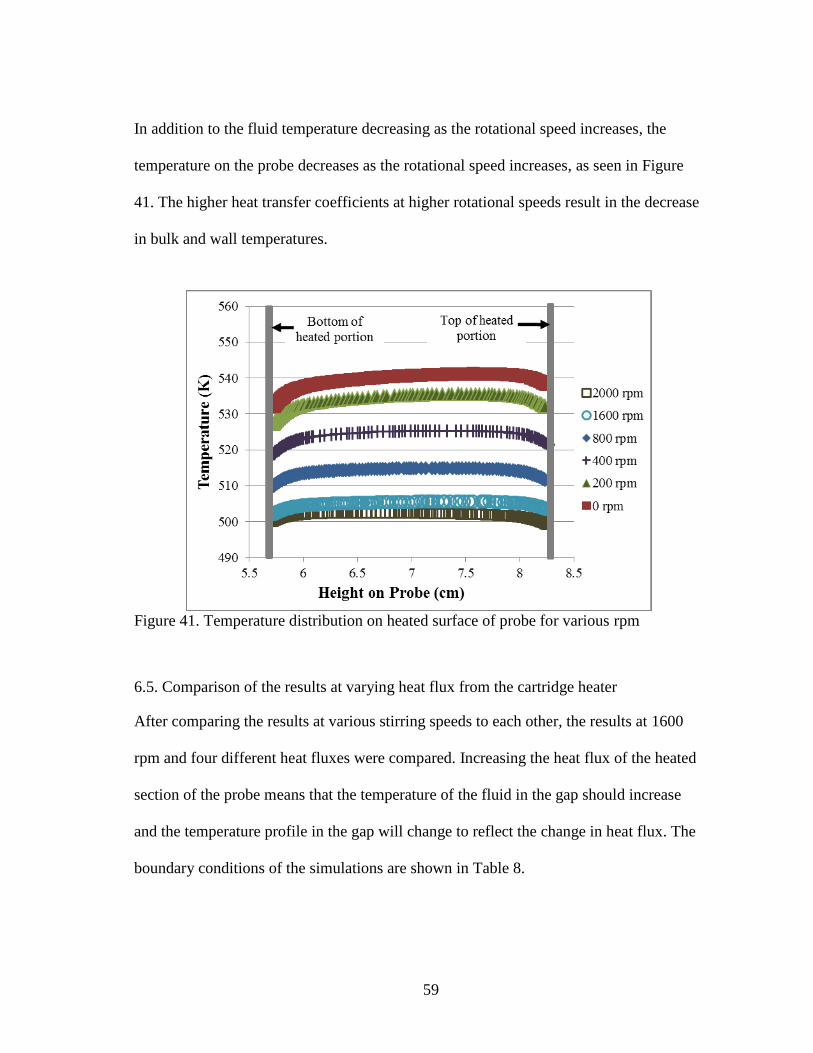
In addition to the fluid temperature decreasing as the rotational speed increases, the
temperature on the probe decreases as the rotational speed increases, as seen in Figure
41. The higher heat transfer coefficients at higher rotational speeds result in the decrease
in bulk and wall temperatures.
Figure 41. Temperature distribution on heated surface of probe for various rpm
6.5. Comparison of the results at varying heat flux from the cartridge heater
After comparing the results at various stirring speeds to each other, the results at 1600
rpm and four different heat fluxes were compared. Increasing the heat flux of the heated
section of the probe means that the temperature of the fluid in the gap should increase
and the temperature profile in the gap will change to reflect the change in heat flux. The
boundary conditions of the simulations are shown in Table 8.
60
Table 8. Boundary conditions used in FLUENT® for heat flux
Surface Boundary Condition
Momentum Thermal
Cooling coils no-slip; 0 m/s isothermal; 490 K
Stirrer w/ cup 1600 rpm adiabatic; 0 kW/m2
Heated
portion of
cartridge
heater
no-slip; 0 m/s diabatic; 0-40 kW/m2
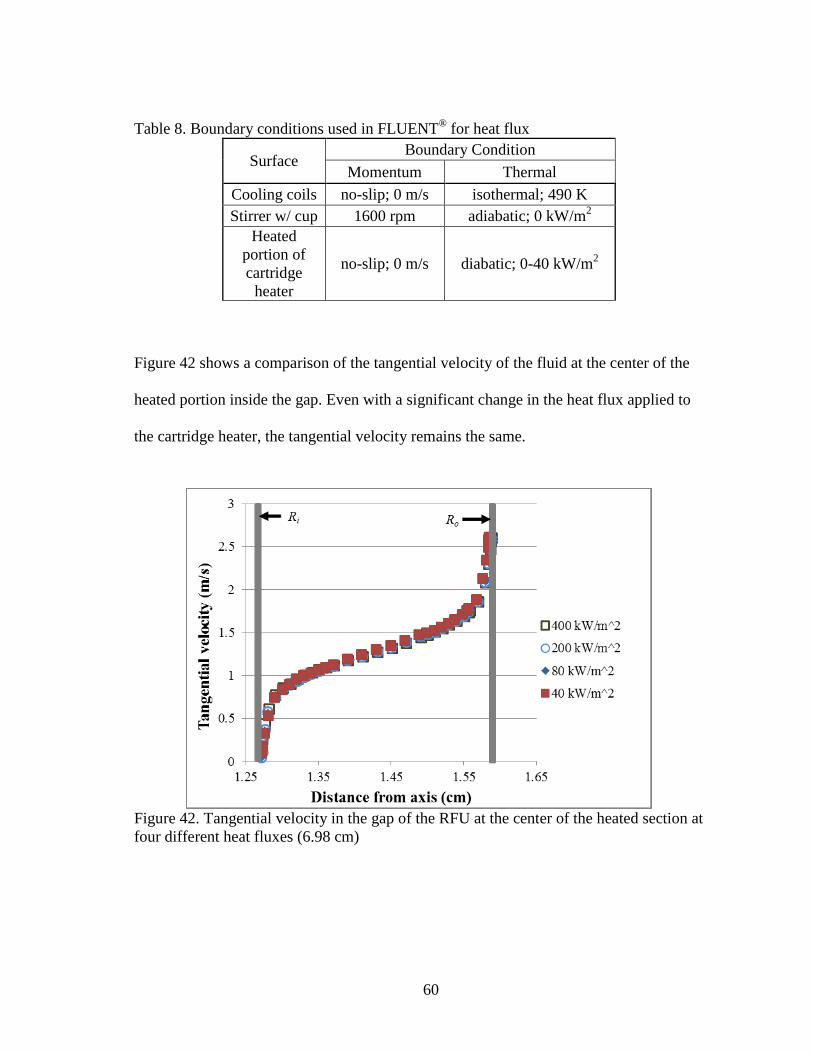
Figure 42 shows a comparison of the tangential velocity of the fluid at the center of the
heated portion inside the gap. Even with a significant change in the heat flux applied to
the cartridge heater, the tangential velocity remains the same.
Figure 42. Tangential velocity in the gap of the RFU at the center of the heated section at
four different heat fluxes (6.98 cm)

61
The axial velocity is similar despite a significant increase in heat flux, but the most
noticeable difference occurs inside the gap where the fluids moves upwards twice as fast
as seen in Figure 43. This can be attributed to the buoyancy of the fluid and the increase
in the temperature of the fluid.
Figure 43. Axial velocity along entire width of unit at a height of 6.98 cm at four
different heat fluxes
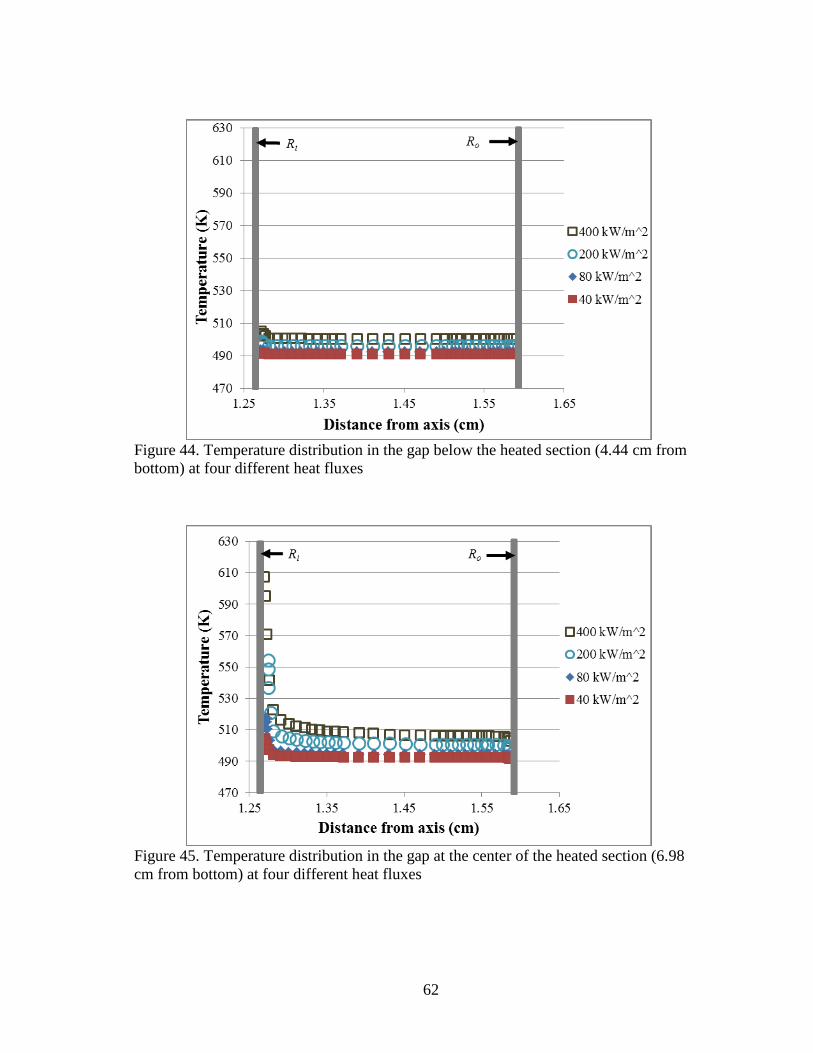
The temperature distribution in the gap is shown at three different heights in Figures 44
to 46. As the heat flux applied to the cartridge heater is increased from 40 kW/m2K to
400 kW/m2K, the mean bulk temperature increases by nearly 30 K. Figure 45 shows that
the difference between the wall temperature and the bulk temperature increases as heat
flux increases, up to a value close to 100 K, which is near the maximum temperature
difference that the RFU was designed for.
62
Figure 44. Temperature distribution in the gap below the heated section (4.44 cm from
bottom) at four different heat fluxes
Figure 45. Temperature distribution in the gap at the center of the heated section (6.98
cm from bottom) at four different heat fluxes
63
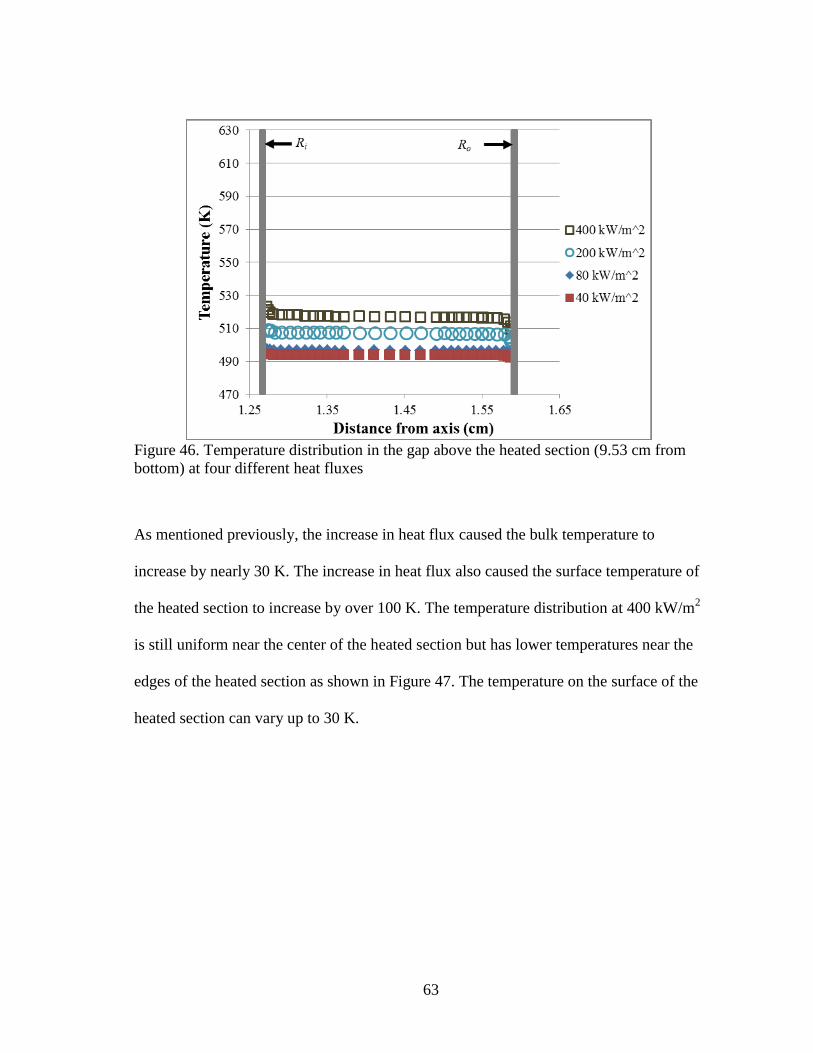
Figure 46. Temperature distribution in the gap above the heated section (9.53 cm from
bottom) at four different heat fluxes
As mentioned previously, the increase in heat flux caused the bulk temperature to
increase by nearly 30 K. The increase in heat flux also caused the surface temperature of
the heated section to increase by over 100 K. The temperature distribution at 400 kW/m2
is still uniform near the center of the heated section but has lower temperatures near the
edges of the heated section as shown in Figure 47. The temperature on the surface of the
heated section can vary up to 30 K.

64
Figure 47. Temperature distribution on heated surface of probe at four different heat
fluxes
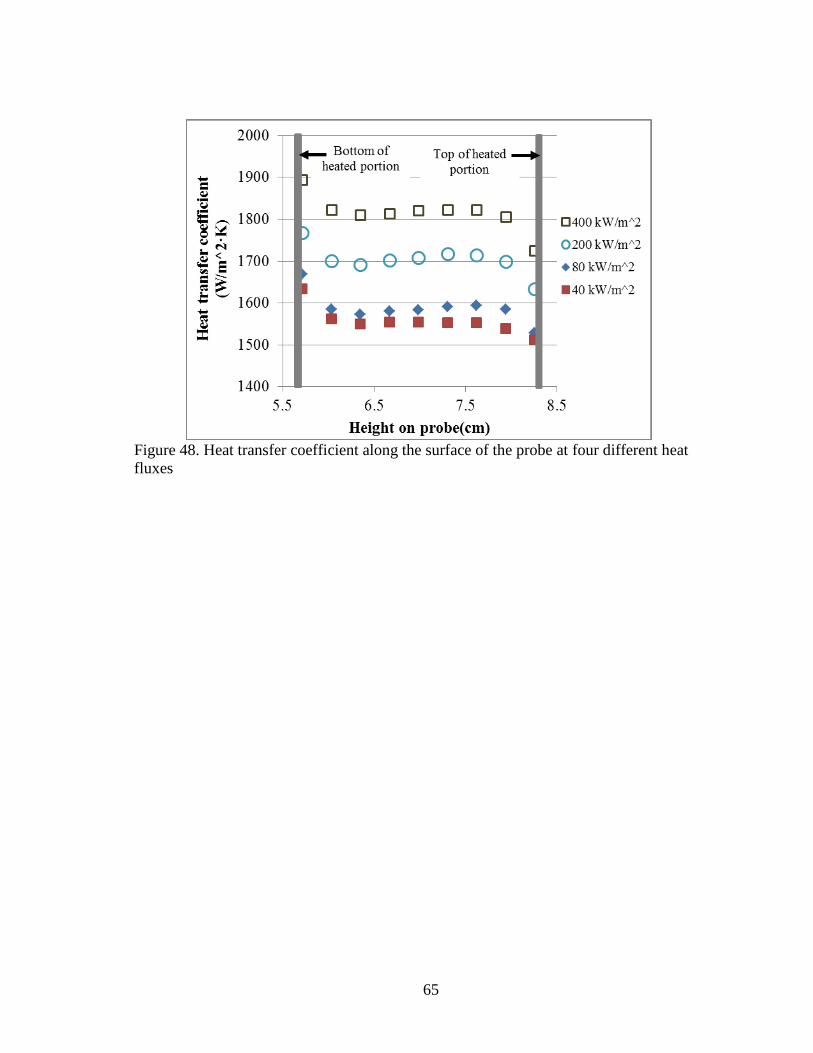
Lastly, the heat transfer coefficient along the surface of the heated section was compared
for each of the heat fluxes tested. Ideally, the heat transfer coefficients should be similar
but will vary because of the change in density exhibited by the fluid with a change in
temperature. The higher heat flux cause the bulk temperature to increase and the density
of the fluid to decrease which will impact the Nusselt number and in turn impact the heat
transfer coefficient as seen in Figure 48.
65
Figure 48. Heat transfer coefficient along the surface of the probe at four different heat
fluxes
66
7. CONCLUSIONS
The RFU has the capabilities of reaching the same pressures, surface temperatures, and
bulk temperatures as the HTFU. Unlike the HTFU, the RFU will hold 2.8 L, will run
within one day, and will be a self-contained unit. The RFU extends the previous batch
stirred cell units of Eaton and Crittenden, but is intended to:
improve the uniformity of temperature distribution along the surface of the
probe
increase the number of measurements taken, especially the temperature
improve the distribution of shear stress along the heated surface of the probe
augment the recirculation of crude oil within the pressurized vessel
reduce the dependency on CFD simulations for data interpretation.
The RFU has a broader spectrum of measurements than previous experiments to more
accurately predict the shear stress and temperature distribution on the surface of the
probe. The CFD simulations will not be relied on as heavily to determine the results
from the experiment, but will be used for validating the results obtained in the RFU.
Future CFD simulations can study the shear stress, heat transfer coefficient, and flow
patterns with various boundary conditions, i.e. outer wall temperature, cooling coil
temperature, cartridge heater heat flux, etc. Additionally, the properties of multiple crude
oils can be used for other simulations. Ideally, the CFD will be used more in the future to
predict fouling inside of the RFU and 3D models could be used to better understand the
flow in the gap and to visualize the Taylor vortices that may occur.
67
CFD simulations have been performed to better understand the flow and heat transfer in
the RFU, especially in the gap where fouling data will be collected. The simulations
include different flow and heat transfer conditions, covering the ranges of fouling
experiments. The CFD simulations performed in this thesis are comparable to the
predictions of shear stress and heat transfer coefficient using correlations from the
literature and can be applied for future experimental test runs. Preliminary heat transfer
tests will be conducted to evaluate the CFD simulations and the correlation predictions
and develop correlations for analyzing fouling data.
The design described herein has led to the construction of the RFU which has been
tested to the specified pressures and stirring speeds. Further tests will be run to validate
the shear stress and heat transfer calculations and other results from the CFD
simulations. The results from the RFU can then be integrated into the HTRI fouling
program.
68
REFERENCES
[1] Bott, T. R., 1995, Fouling of Heat Exchangers, Elsevier Science Publishers, The
Netherlands.
[2] Bott, T. R., 1990, Fouling Notebook, Institution of Chemical Engineers, Rugby.
[3] Deshannavar, U. B., Rafeen, M. S., Ramasamy, M., and Subbarao, D., 2010,
“Crude Oil Fouling: A Review,” J. Appl. Sci., 10(24), pp. 3167–3174.
[4] Fan, Z., Rahimi, P., McGee, R., Wen, Q., and Alem, T., 2010, “Investigation of
Fouling Mechanisms of a Light Crude Oil Using an Alcor Hot Liquid Process
Simulator,” Energy Fuels, 24(11), pp. 6110–6118.
[5] Kuru, W. C., and Panchal, C. B., 1997, “High-Temperature Organic-Fluid Fouling
Unit,” Baltimore.
[6] Srinivasan, M., and Watkinson, A. P., 2005, “Fouling of Some Canadian Crude
Oils,” Heat Transf. Eng., 26(1), pp. 7–14.
[7] Watkinson, A. P., 2004, “Comparison of Crude Oil Fouling Using Two Different
Probes,” 32, pp. 1–7.
[8] Lestina, T., and Zettler, H., 2014, “Crude Oil Fouling Research: HTRI’s
Perspective,” Heat Transf. Eng. J., 35, pp. 52-73.
[9] Bennett, C. A., Kistler, R. S., Nangia, K., Al-Ghawas, W., Al-Hajji, N., and Al-
Jemaz, A., 2009, “Observations of an Isokinetic Temperature and Compensation
Effect for High-Temperature Crude Oil Fouling,” Heat Transf. Eng., 30(10-11), pp.
799–804.
[10] Yang, M., Young, A., and Crittenden, B., 2012, “Modelling fouling induction
periods,” Int. J. Therm. Sci., 51, pp. 175–183.
[11] Watkinson, A. P., and Wilson, D. I., 1997, “Chemical Reaction Fouling: A
Review,” Exp. Therm. Fluid Sci., 14, pp. 361–374.
[12] Epstein, N., 1997, “Fouling in Heat Exchangers,” Salt Lake City, pp. 235–253.
[13] Eaton, P., and Lux, R., 1984, “Laboratory fouling test apparatus for hydrocarbon
feedstocks,” Niagra Falls, NY.
[14] Eaton, P., 1983, “Fouling test apparatus.” U.S., 4,383,438.
[15] Yang, M., Young, A., and Crittenden, B., 2009, “Use of CFD to correlate crude oil
fouling against surface temperature and surface shear stress in a stirred fouling
apparatus,” pp. 272–280.
69
[16] Young, A., Venditti, S., Berrueco, C., Yang, M., Waters, A., Davies, H., Hill, S.,
Millan, M., and Crittenden, B., 2011, “Characterization of crude oils and their
fouling deposits using a batch stirred cell system,” Heat Transf. Eng., 32(3-4), pp.
216–227.
[17] Watkinson, A. P., 1992, “Chemical Reaction Fouling of Organic Fluids,” Chem.
Eng. Technol., 15, pp. 82–90.
[18] Nigo, R. Y., Chew, Y. M. J., Houghton, N. E., Paterson, W. R., and Wilson, D. I.,
2009, “Experimental Studies of Freezing Fouling of Model Food Fat Solution
Using a Novel Spinning Disc Apparatus,” Energy Fuels, 23, pp. 6131–6145.
[19] Nigo, R. Y., Chew, Y. M. J., Houghton, N. E., Paterson, W. R., and Wilson, D. I.,
2009, “Experimental and CFD Studies of Fat Fouling in a Novel Spinning Disc
System,” Schladming, pp. 263–271.
[20] Ebert, W., and Panchal, C. B., 1995, “Analysis of Exxon crude oil slip stream
coking data,” New York, pp. 451–460.
[21] Taylor, G. I., 1936, “Fluid friction between rotating cylinders - I. Torque
measurements,” Proc R. Soc. Lond. Ser. Math. Phys. Sci., 157(892), pp. 546–564.
[22] Taylor, G. I., 1936, “Fluid friction between rotating cylinders - II. Distribution of
velocity between concentric cylinders when outer one is rotating and inner one is at
rest,” Proc R. Soc. Lond. Ser. Math. Phys. Sci., 157(892), pp. 565–578.
[23] Chhabra, R. P., and Richardson, J. F., 1999, Non-Newtonian Flow and Applied
Rheology, Elsevier, Amsterdam.
[24] Schlichting, H., 1979, Boundary-Layer Theory, McGraw-Hill, New York.
[25] Bagnold, R.A., 1954, “Experiments on a gravity-free dispersion of large solid
spheres in a Newtonian fluid under shear,” Proc R. Soc. Lond. Ser. Math. Phys.
Sci., 225(1160), pp. 49–63.
[26] Hunt, M. L., Zenit, R., Campbell, C. S., and Brennen, C. E., 2002, “Revisiting the
1954 suspension experiments of R. A. Bagnold,” J Fluids Mech., 452, pp. 1–24.
[27] McAdams, W. H., 1942, Heat Transmissions, McGraw-Hill, New York.
[28] Lee, Y. N., and Minkowycz, W. J., 1989, “Heat Transfer Characteristics of the
Annulus of Two Coaxial Cylinders with One Cylinder Rotating,” Int. J. Heat Mass
Transf., 32(4), pp. 711–722.
[29] Poncet, S., Haddadi, S., and Viazo, S., 2010, “Numerical Modeling of Fluid Flow
and Heat Transfer in a Narrow Taylor-Couette-Poiseuille System,” Int. J. Heat
Fluid Flow, 32, pp. 128–144.

70
[30] Donne, M. D., and Meerwald, E., 1966, “Experimental Local Heat-Transfer and
Average Friction Coefficients for Subsonic Turbulent Flow of Air in an Annulus at
High Temperatures,” Int. J. Heat Mass Transf., 9, pp. 1361–1376.