Embed Size (px)
Citation preview
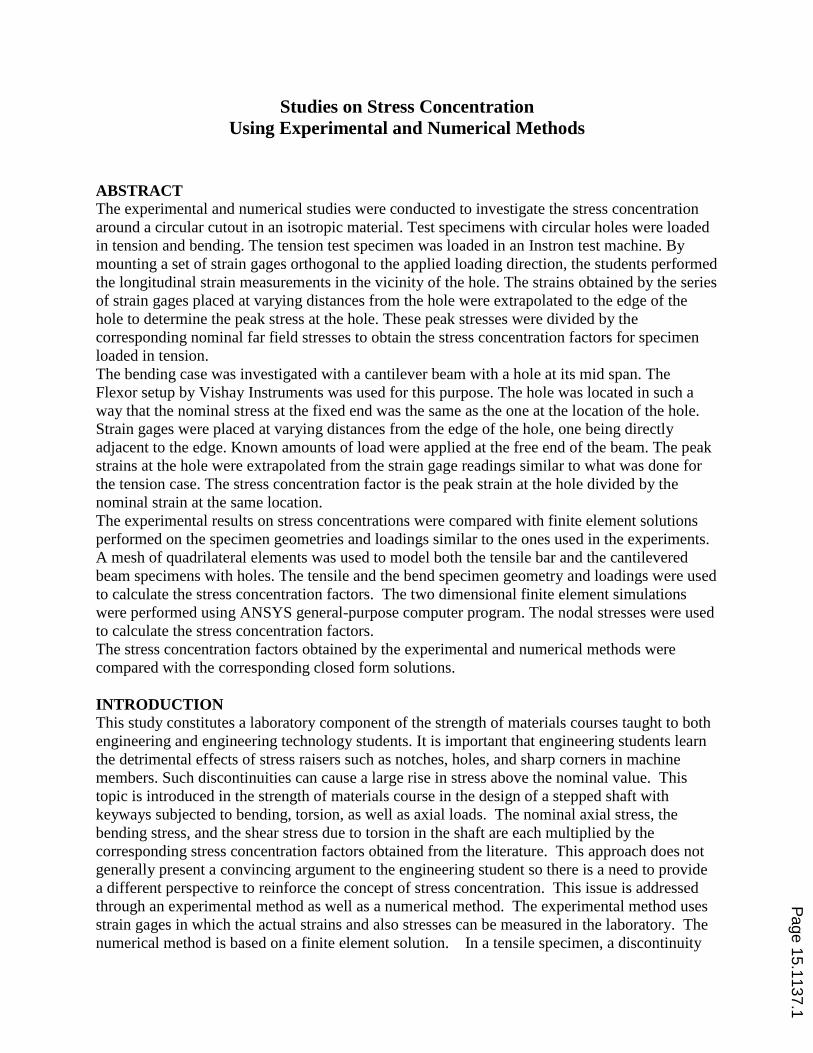
Studies on Stress Concentration
Using Experimental and Numerical Methods
ABSTRACT
The experimental and numerical studies were conducted to investigate the stress concentration
around a circular cutout in an isotropic material. Test specimens with circular holes were loaded
in tension and bending. The tension test specimen was loaded in an Instron test machine. By
mounting a set of strain gages orthogonal to the applied loading direction, the students performed
the longitudinal strain measurements in the vicinity of the hole. The strains obtained by the series
of strain gages placed at varying distances from the hole were extrapolated to the edge of the
hole to determine the peak stress at the hole. These peak stresses were divided by the
corresponding nominal far field stresses to obtain the stress concentration factors for specimen
loaded in tension.
The bending case was investigated with a cantilever beam with a hole at its mid span. The
Flexor setup by Vishay Instruments was used for this purpose. The hole was located in such a
way that the nominal stress at the fixed end was the same as the one at the location of the hole.
Strain gages were placed at varying distances from the edge of the hole, one being directly
adjacent to the edge. Known amounts of load were applied at the free end of the beam. The peak
strains at the hole were extrapolated from the strain gage readings similar to what was done for
the tension case. The stress concentration factor is the peak strain at the hole divided by the
nominal strain at the same location.
The experimental results on stress concentrations were compared with finite element solutions
performed on the specimen geometries and loadings similar to the ones used in the experiments.
A mesh of quadrilateral elements was used to model both the tensile bar and the cantilevered
beam specimens with holes. The tensile and the bend specimen geometry and loadings were used
to calculate the stress concentration factors. The two dimensional finite element simulations
were performed using ANSYS general-purpose computer program. The nodal stresses were used
to calculate the stress concentration factors.
The stress concentration factors obtained by the experimental and numerical methods were
compared with the corresponding closed form solutions.
INTRODUCTION
This study constitutes a laboratory component of the strength of materials courses taught to both
engineering and engineering technology students. It is important that engineering students learn
the detrimental effects of stress raisers such as notches, holes, and sharp corners in machine
members. Such discontinuities can cause a large rise in stress above the nominal value. This
topic is introduced in the strength of materials course in the design of a stepped shaft with
keyways subjected to bending, torsion, as well as axial loads. The nominal axial stress, the
bending stress, and the shear stress due to torsion in the shaft are each multiplied by the
corresponding stress concentration factors obtained from the literature. This approach does not
generally present a convincing argument to the engineering student so there is a need to provide
a different perspective to reinforce the concept of stress concentration. This issue is addressed
through an experimental method as well as a numerical method. The experimental method uses
strain gages in which the actual strains and also stresses can be measured in the laboratory. The
numerical method is based on a finite element solution. In a tensile specimen, a discontinuity
Page 15.1137.1
such as a through-the-thickness circular hole is a stress raiser, and its effect on the stress is
through a stress concentration factor. Similarly, a circular hole drilled through a beam loaded in
bending is also a stress raiser with its own stress concentration factor. In this study the analytical
solutions to the stress concentration factors for both the tensile and cantilever specimens due to a
circular hole have been compared with experimental and numerical methods.
First, the students are introduced to the concept of stress concentration factor and the analytical
results of stress concentration factors for various test specimen geometries are outlined.
Experimental studies on stress concentration factors are conducted for (a) bar with a hole in
tension and (b) cantilever beam with hole in bending. Then the numerical solutions for the stress
concentration factors for the test specimen geometries are conducted using finite element
analyses.
STRESS CONCENTRATION FACTORS Any physical discontinuity in a structural member or a sudden change in the geometric form of a
part leads to a region of stress concentration. The abrupt change in cross sections cause the
stress “flow lines” to crowd causing high stress concentration. To mitigate this phenomenon,
smoother changes such as fillet radii are introduced in structural members that make the “flow
lines” less crowded causing lower stress concentrations. The theoretical stress concentration
factor, Kt is defined in terms of maximum (or peak) stress, σmax and nominal (or average or far-
field) stress, σnom as:
)1(max
nom
tK
The theoretical stress concentration factor is a function of component geometry and loading.
Analytical expressions for stress concentration factors may be found in Mott (2008), and Pilkey
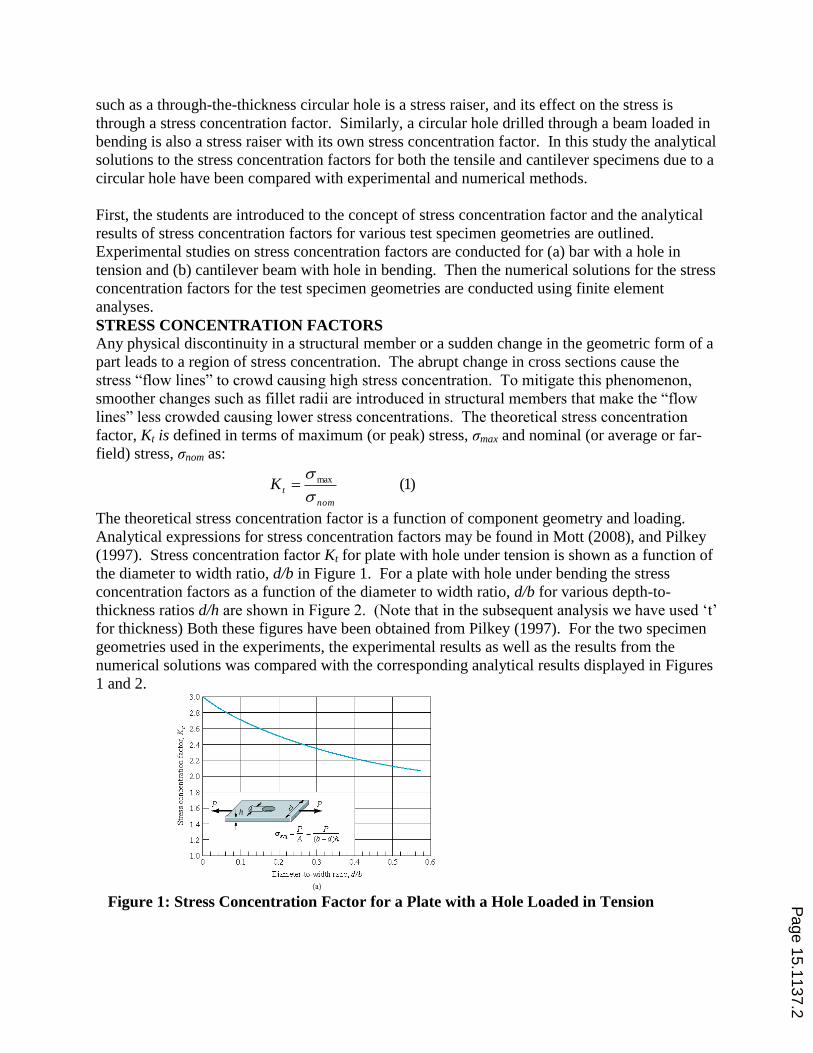
(1997). Stress concentration factor Kt for plate with hole under tension is shown as a function of
the diameter to width ratio, d/b in Figure 1. For a plate with hole under bending the stress
concentration factors as a function of the diameter to width ratio, d/b for various depth-to-
thickness ratios d/h are shown in Figure 2. (Note that in the subsequent analysis we have used „t‟
for thickness) Both these figures have been obtained from Pilkey (1997). For the two specimen
geometries used in the experiments, the experimental results as well as the results from the
numerical solutions was compared with the corresponding analytical results displayed in Figures
1 and 2.
Figure 1: Stress Concentration Factor for a Plate with a Hole Loaded in Tension
Page 15.1137.2
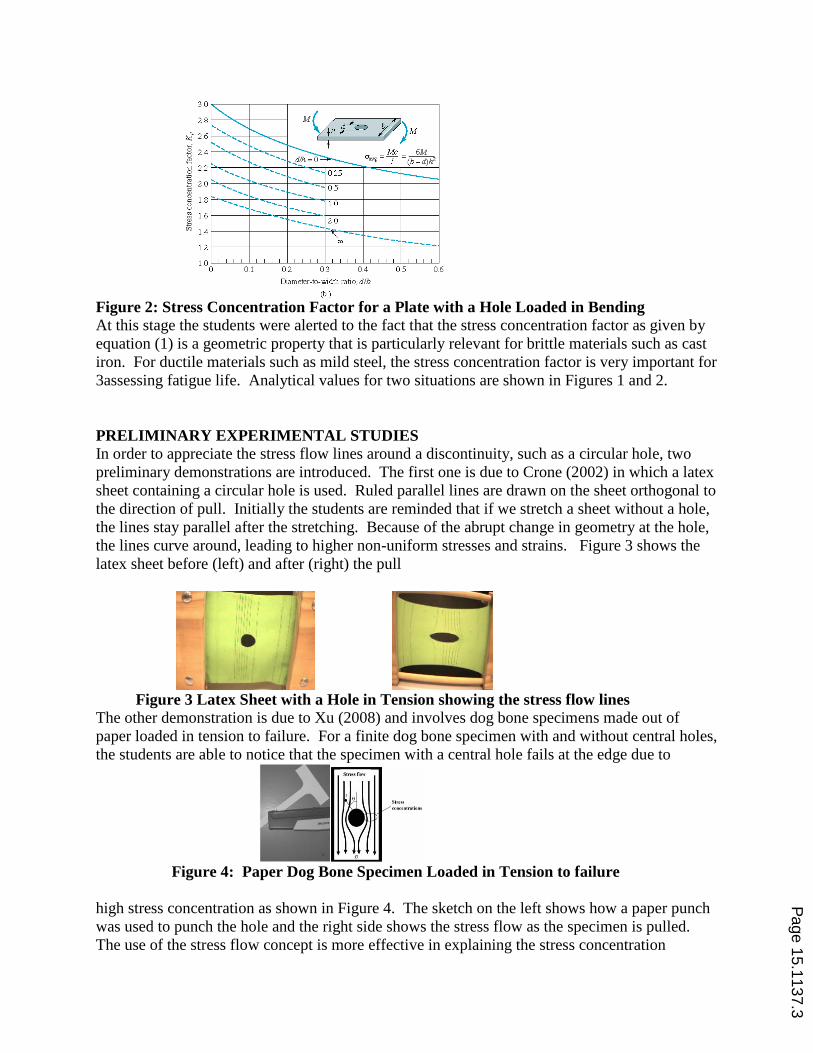
Figure 2: Stress Concentration Factor for a Plate with a Hole Loaded in Bending
At this stage the students were alerted to the fact that the stress concentration factor as given by
equation (1) is a geometric property that is particularly relevant for brittle materials such as cast
iron. For ductile materials such as mild steel, the stress concentration factor is very important for
3assessing fatigue life. Analytical values for two situations are shown in Figures 1 and 2.
PRELIMINARY EXPERIMENTAL STUDIES
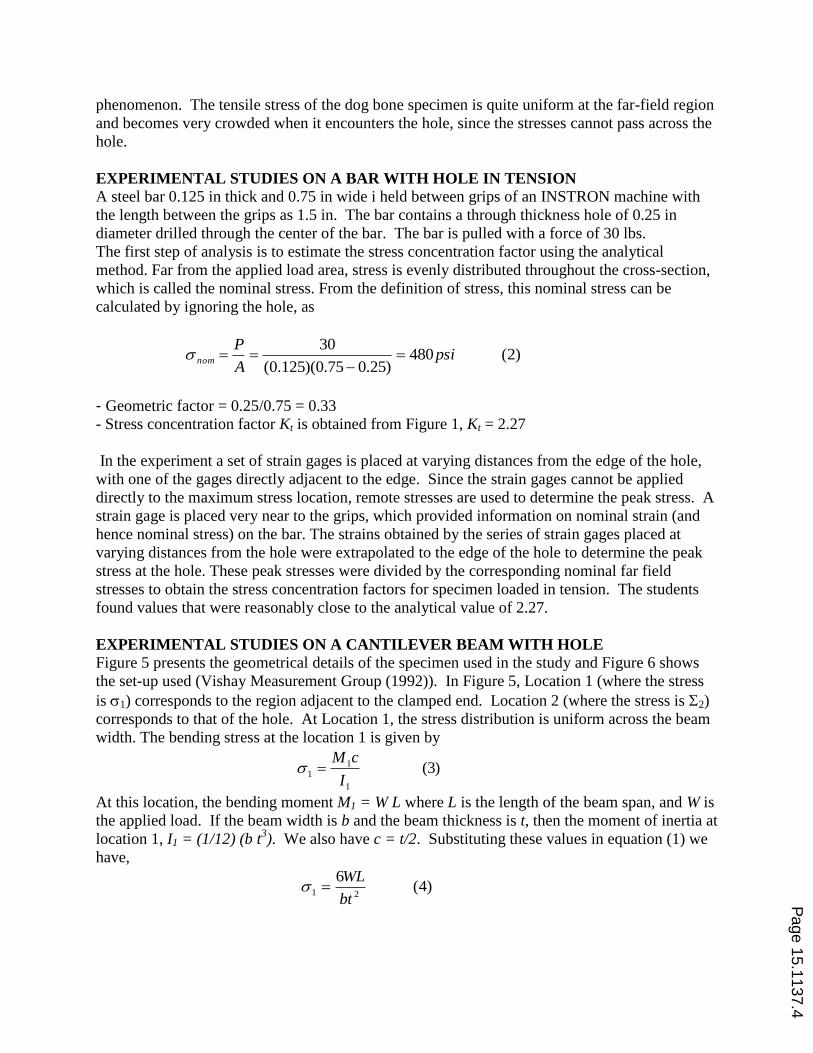
In order to appreciate the stress flow lines around a discontinuity, such as a circular hole, two
preliminary demonstrations are introduced. The first one is due to Crone (2002) in which a latex
sheet containing a circular hole is used. Ruled parallel lines are drawn on the sheet orthogonal to
the direction of pull. Initially the students are reminded that if we stretch a sheet without a hole,
the lines stay parallel after the stretching. Because of the abrupt change in geometry at the hole,
the lines curve around, leading to higher non-uniform stresses and strains. Figure 3 shows the
latex sheet before (left) and after (right) the pull
Figure 3 Latex Sheet with a Hole in Tension showing the stress flow lines
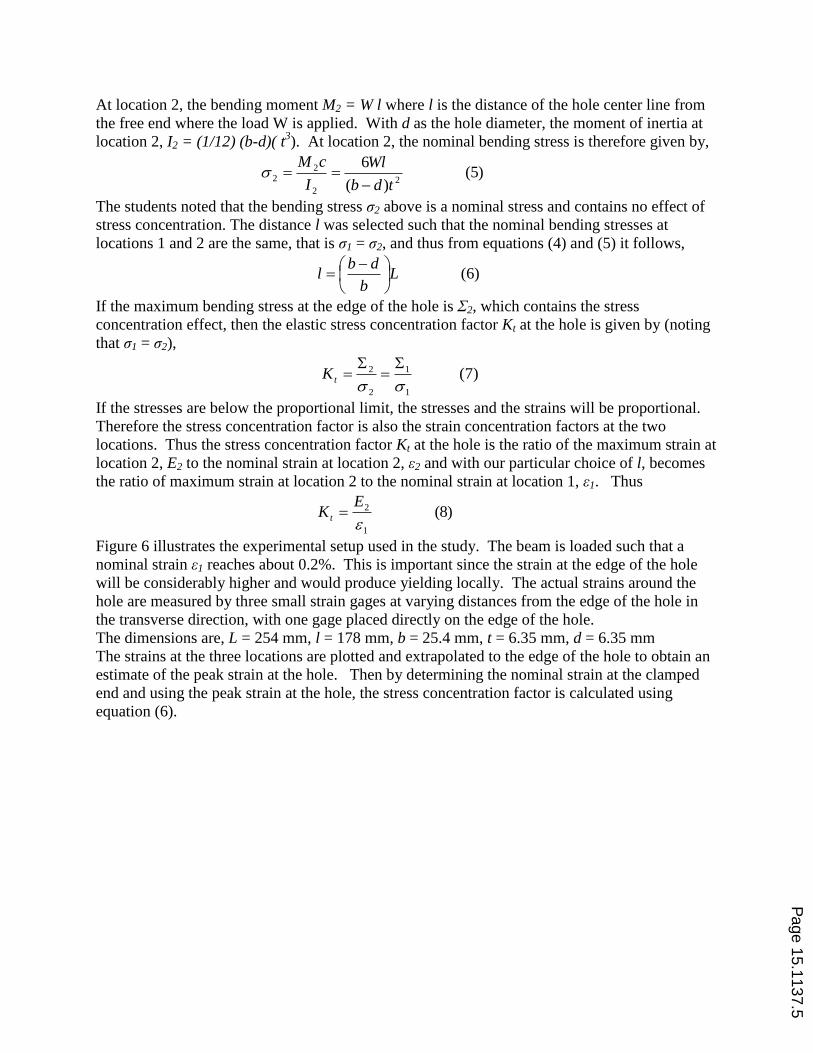
The other demonstration is due to Xu (2008) and involves dog bone specimens made out of
paper loaded in tension to failure. For a finite dog bone specimen with and without central holes,
the students are able to notice that the specimen with a central hole fails at the edge due to
Figure 4: Paper Dog Bone Specimen Loaded in Tension to failure
high stress concentration as shown in Figure 4. The sketch on the left shows how a paper punch
was used to punch the hole and the right side shows the stress flow as the specimen is pulled.
The use of the stress flow concept is more effective in explaining the stress concentration
Page 15.1137.3
phenomenon. The tensile stress of the dog bone specimen is quite uniform at the far-field region
and becomes very crowded when it encounters the hole, since the stresses cannot pass across the
hole.
EXPERIMENTAL STUDIES ON A BAR WITH HOLE IN TENSION
A steel bar 0.125 in thick and 0.75 in wide i held between grips of an INSTRON machine with
the length between the grips as 1.5 in. The bar contains a through thickness hole of 0.25 in
diameter drilled through the center of the bar. The bar is pulled with a force of 30 lbs.
The first step of analysis is to estimate the stress concentration factor using the analytical
method. Far from the applied load area, stress is evenly distributed throughout the cross-section,
which is called the nominal stress. From the definition of stress, this nominal stress can be
calculated by ignoring the hole, as
)2(480)25.075.0)(125.0(
30psi
A
Pnom
- Geometric factor = 0.25/0.75 = 0.33
- Stress concentration factor Kt is obtained from Figure 1, Kt = 2.27
In the experiment a set of strain gages is placed at varying distances from the edge of the hole,
with one of the gages directly adjacent to the edge. Since the strain gages cannot be applied
directly to the maximum stress location, remote stresses are used to determine the peak stress. A
strain gage is placed very near to the grips, which provided information on nominal strain (and
hence nominal stress) on the bar. The strains obtained by the series of strain gages placed at
varying distances from the hole were extrapolated to the edge of the hole to determine the peak
stress at the hole. These peak stresses were divided by the corresponding nominal far field
stresses to obtain the stress concentration factors for specimen loaded in tension. The students
found values that were reasonably close to the analytical value of 2.27.
EXPERIMENTAL STUDIES ON A CANTILEVER BEAM WITH HOLE
Figure 5 presents the geometrical details of the specimen used in the study and Figure 6 shows
the set-up used (Vishay Measurement Group (1992)). In Figure 5, Location 1 (where the stress
is 1) corresponds to the region adjacent to the clamped end. Location 2 (where the stress is 2)
corresponds to that of the hole. At Location 1, the stress distribution is uniform across the beam
width. The bending stress at the location 1 is given by
)3(1
11
I
cM
At this location, the bending moment M1 = W L where L is the length of the beam span, and W is
the applied load. If the beam width is b and the beam thickness is t, then the moment of inertia at
location 1, I1 = (1/12) (b t3). We also have c = t/2. Substituting these values in equation (1) we
have,
)4(6
21bt
WL
Page 15.1137.4
At location 2, the bending moment M2 = W l where l is the distance of the hole center line from
the free end where the load W is applied. With d as the hole diameter, the moment of inertia at
location 2, I2 = (1/12) (b-d)( t3). At location 2, the nominal bending stress is therefore given by,
)5()(
62
2
22
tdb
Wl
I
cM
The students noted that the bending stress σ2 above is a nominal stress and contains no effect of
stress concentration. The distance l was selected such that the nominal bending stresses at
locations 1 and 2 are the same, that is σ1 = σ2, and thus from equations (4) and (5) it follows,
)6(Lb
dbl
If the maximum bending stress at the edge of the hole is Σ2, which contains the stress
concentration effect, then the elastic stress concentration factor Kt at the hole is given by (noting
that σ1 = σ2),
)7(1
1
2
2
tK
If the stresses are below the proportional limit, the stresses and the strains will be proportional.
Therefore the stress concentration factor is also the strain concentration factors at the two
locations. Thus the stress concentration factor Kt at the hole is the ratio of the maximum strain at
location 2, E2 to the nominal strain at location 2, ε2 and with our particular choice of l, becomes
the ratio of maximum strain at location 2 to the nominal strain at location 1, ε1. Thus
)8(1
2
EK t
Figure 6 illustrates the experimental setup used in the study. The beam is loaded such that a
nominal strain ε1 reaches about 0.2%. This is important since the strain at the edge of the hole
will be considerably higher and would produce yielding locally. The actual strains around the
hole are measured by three small strain gages at varying distances from the edge of the hole in
the transverse direction, with one gage placed directly on the edge of the hole.
The dimensions are, L = 254 mm, l = 178 mm, b = 25.4 mm, t = 6.35 mm, d = 6.35 mm
The strains at the three locations are plotted and extrapolated to the edge of the hole to obtain an
estimate of the peak strain at the hole. Then by determining the nominal strain at the clamped
end and using the peak strain at the hole, the stress concentration factor is calculated using
equation (6).
Page 15.1137.5
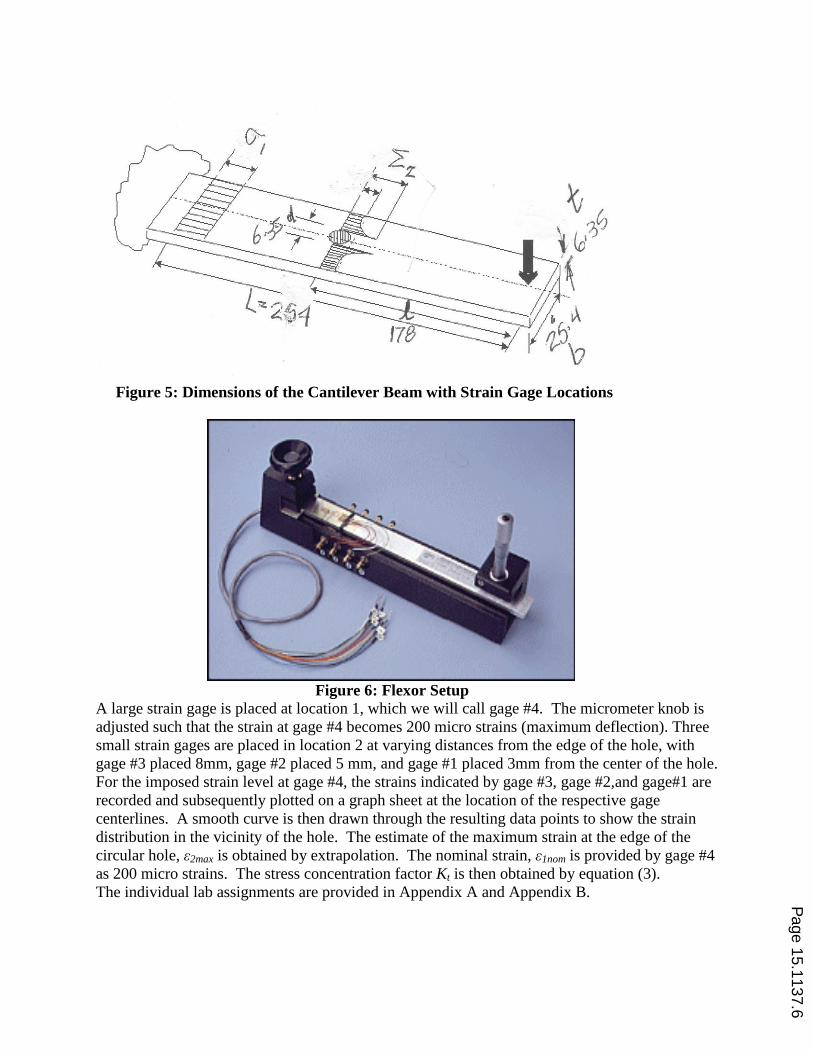
Figure 5: Dimensions of the Cantilever Beam with Strain Gage Locations
Figure 6: Flexor Setup
A large strain gage is placed at location 1, which we will call gage #4. The micrometer knob is
adjusted such that the strain at gage #4 becomes 200 micro strains (maximum deflection). Three
small strain gages are placed in location 2 at varying distances from the edge of the hole, with
gage #3 placed 8mm, gage #2 placed 5 mm, and gage #1 placed 3mm from the center of the hole.
For the imposed strain level at gage #4, the strains indicated by gage #3, gage #2,and gage#1 are
recorded and subsequently plotted on a graph sheet at the location of the respective gage
centerlines. A smooth curve is then drawn through the resulting data points to show the strain
distribution in the vicinity of the hole. The estimate of the maximum strain at the edge of the
circular hole, ε2max is obtained by extrapolation. The nominal strain, ε1nom is provided by gage #4
as 200 micro strains. The stress concentration factor Kt is then obtained by equation (3).
The individual lab assignments are provided in Appendix A and Appendix B.
Page 15.1137.6
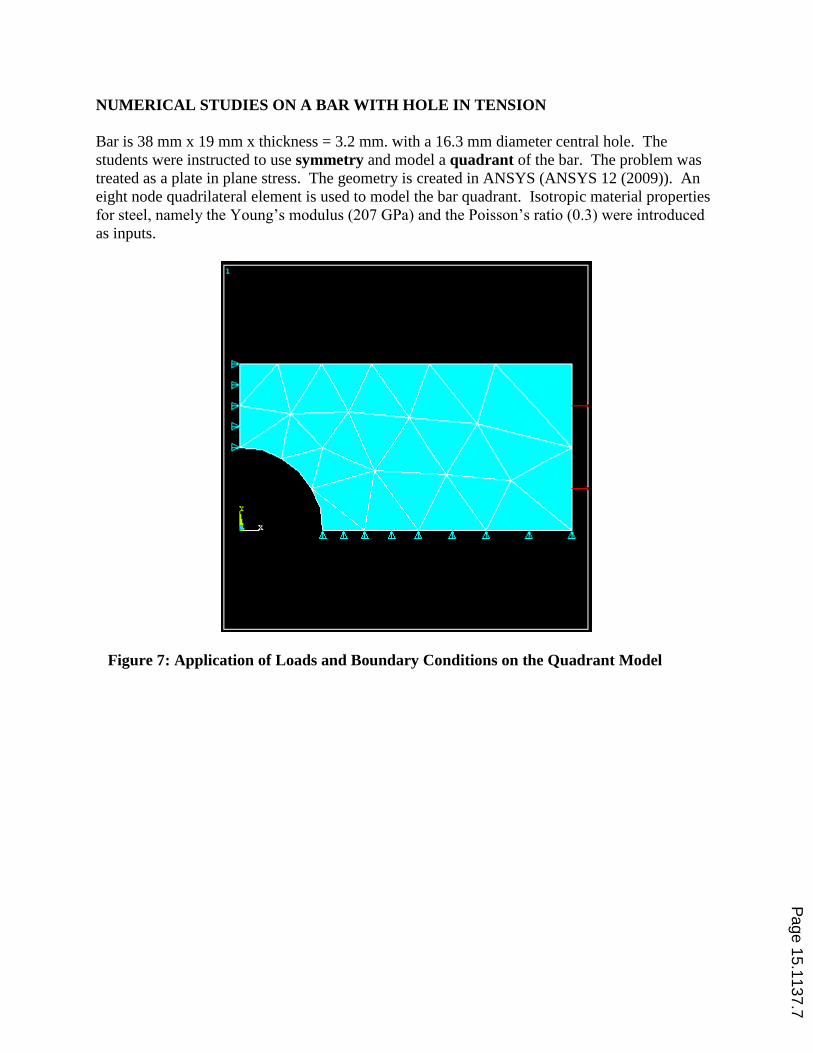
NUMERICAL STUDIES ON A BAR WITH HOLE IN TENSION
Bar is 38 mm x 19 mm x thickness = 3.2 mm. with a 16.3 mm diameter central hole. The
students were instructed to use symmetry and model a quadrant of the bar. The problem was
treated as a plate in plane stress. The geometry is created in ANSYS (ANSYS 12 (2009)). An
eight node quadrilateral element is used to model the bar quadrant. Isotropic material properties
for steel, namely the Young‟s modulus (207 GPa) and the Poisson‟s ratio (0.3) were introduced
as inputs.
Figure 7: Application of Loads and Boundary Conditions on the Quadrant Model
Page 15.1137.7
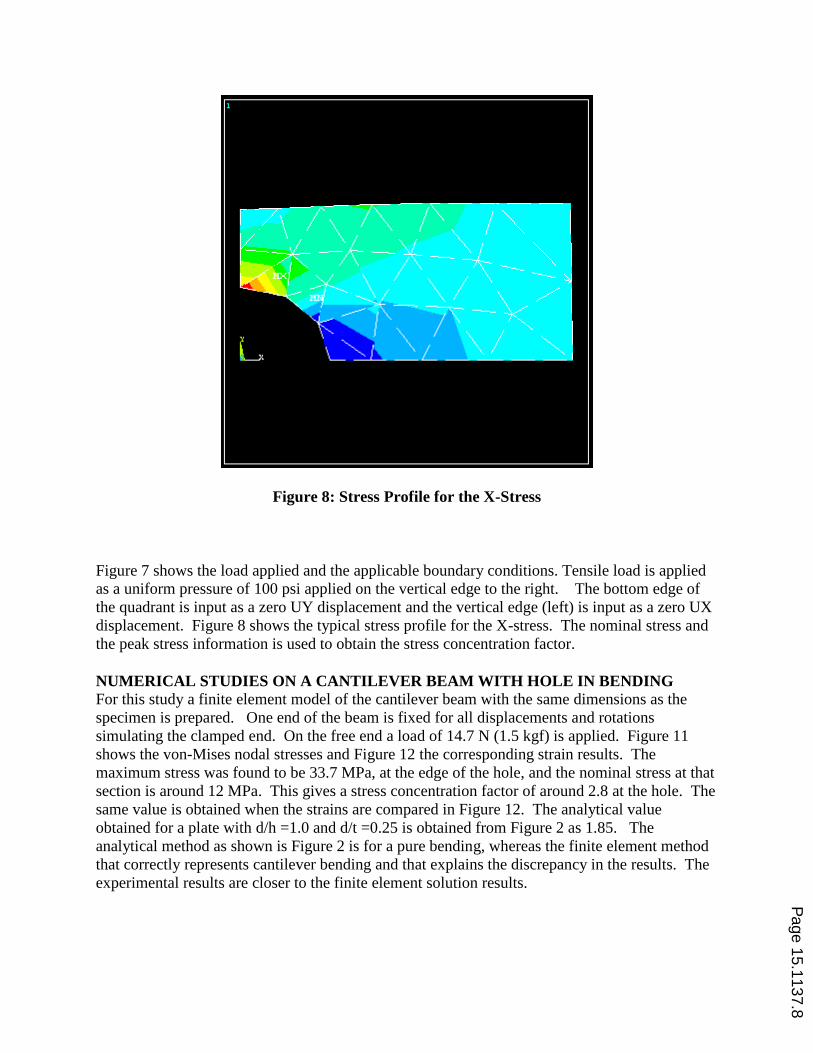
Figure 8: Stress Profile for the X-Stress
Figure 7 shows the load applied and the applicable boundary conditions. Tensile load is applied
as a uniform pressure of 100 psi applied on the vertical edge to the right. The bottom edge of
the quadrant is input as a zero UY displacement and the vertical edge (left) is input as a zero UX
displacement. Figure 8 shows the typical stress profile for the X-stress. The nominal stress and
the peak stress information is used to obtain the stress concentration factor.
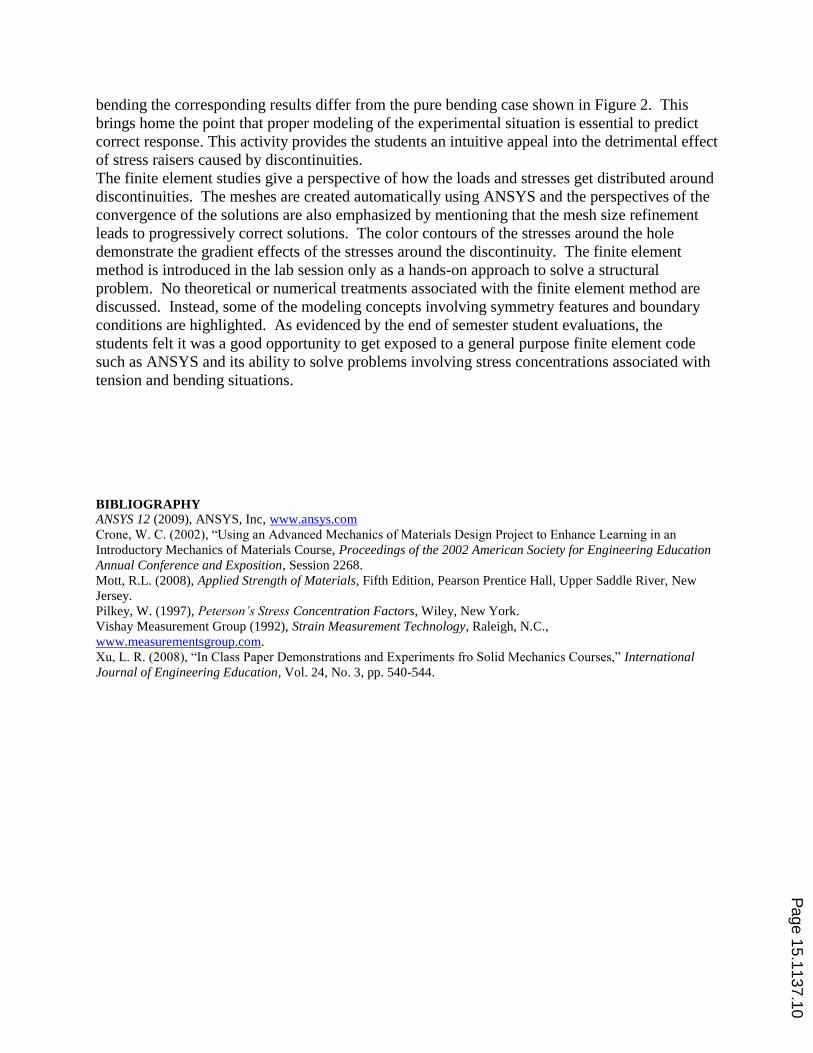
NUMERICAL STUDIES ON A CANTILEVER BEAM WITH HOLE IN BENDING
For this study a finite element model of the cantilever beam with the same dimensions as the
specimen is prepared. One end of the beam is fixed for all displacements and rotations
simulating the clamped end. On the free end a load of 14.7 N (1.5 kgf) is applied. Figure 11
shows the von-Mises nodal stresses and Figure 12 the corresponding strain results. The
maximum stress was found to be 33.7 MPa, at the edge of the hole, and the nominal stress at that
section is around 12 MPa. This gives a stress concentration factor of around 2.8 at the hole. The
same value is obtained when the strains are compared in Figure 12. The analytical value
obtained for a plate with d/h =1.0 and d/t =0.25 is obtained from Figure 2 as 1.85. The
analytical method as shown is Figure 2 is for a pure bending, whereas the finite element method
that correctly represents cantilever bending and that explains the discrepancy in the results. The
experimental results are closer to the finite element solution results.
Page 15.1137.8
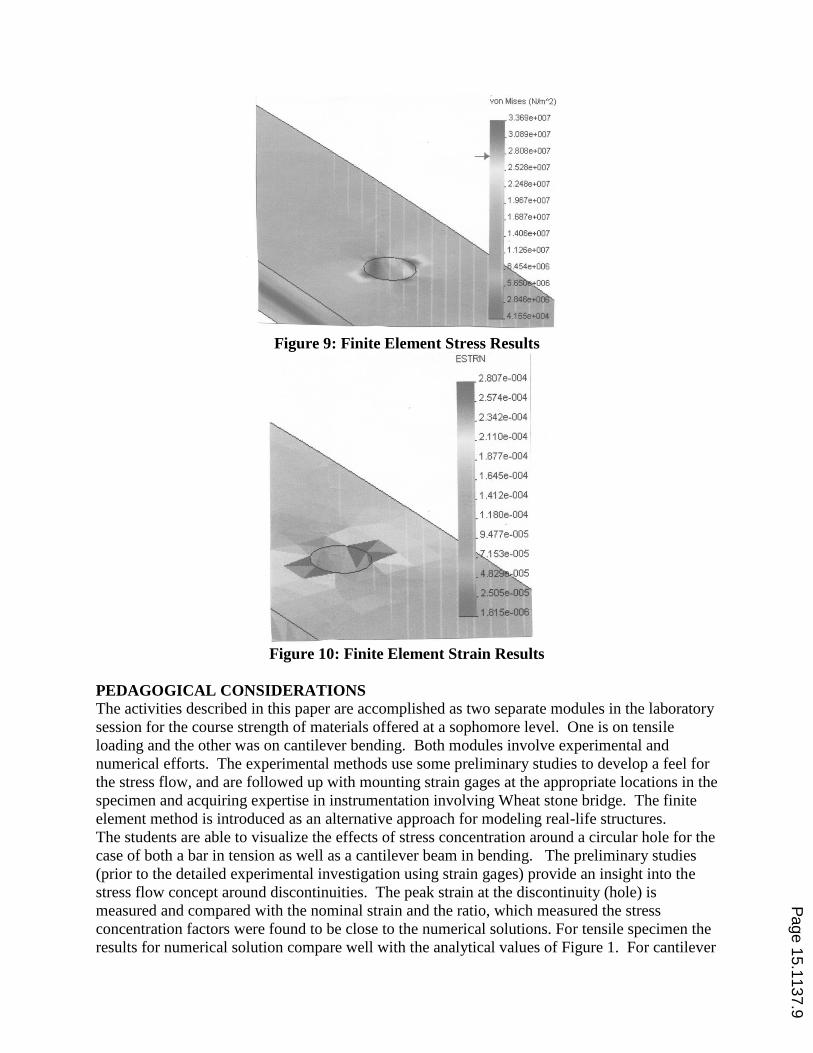
Figure 9: Finite Element Stress Results
Figure 10: Finite Element Strain Results
PEDAGOGICAL CONSIDERATIONS
The activities described in this paper are accomplished as two separate modules in the laboratory
session for the course strength of materials offered at a sophomore level. One is on tensile
loading and the other was on cantilever bending. Both modules involve experimental and
numerical efforts. The experimental methods use some preliminary studies to develop a feel for
the stress flow, and are followed up with mounting strain gages at the appropriate locations in the
specimen and acquiring expertise in instrumentation involving Wheat stone bridge. The finite
element method is introduced as an alternative approach for modeling real-life structures.
The students are able to visualize the effects of stress concentration around a circular hole for the
case of both a bar in tension as well as a cantilever beam in bending. The preliminary studies
(prior to the detailed experimental investigation using strain gages) provide an insight into the
stress flow concept around discontinuities. The peak strain at the discontinuity (hole) is
measured and compared with the nominal strain and the ratio, which measured the stress
concentration factors were found to be close to the numerical solutions. For tensile specimen the
results for numerical solution compare well with the analytical values of Figure 1. For cantilever
Page 15.1137.9
bending the corresponding results differ from the pure bending case shown in Figure 2. This
brings home the point that proper modeling of the experimental situation is essential to predict
correct response. This activity provides the students an intuitive appeal into the detrimental effect
of stress raisers caused by discontinuities.
The finite element studies give a perspective of how the loads and stresses get distributed around
discontinuities. The meshes are created automatically using ANSYS and the perspectives of the
convergence of the solutions are also emphasized by mentioning that the mesh size refinement
leads to progressively correct solutions. The color contours of the stresses around the hole
demonstrate the gradient effects of the stresses around the discontinuity. The finite element
method is introduced in the lab session only as a hands-on approach to solve a structural
problem. No theoretical or numerical treatments associated with the finite element method are
discussed. Instead, some of the modeling concepts involving symmetry features and boundary
conditions are highlighted. As evidenced by the end of semester student evaluations, the
students felt it was a good opportunity to get exposed to a general purpose finite element code
such as ANSYS and its ability to solve problems involving stress concentrations associated with
tension and bending situations.
BIBLIOGRAPHY
ANSYS 12 (2009), ANSYS, Inc, www.ansys.com
Crone, W. C. (2002), “Using an Advanced Mechanics of Materials Design Project to Enhance Learning in an
Introductory Mechanics of Materials Course, Proceedings of the 2002 American Society for Engineering Education
Annual Conference and Exposition, Session 2268.
Mott, R.L. (2008), Applied Strength of Materials, Fifth Edition, Pearson Prentice Hall, Upper Saddle River, New
Jersey.
Pilkey, W. (1997), Peterson’s Stress Concentration Factors, Wiley, New York.
Vishay Measurement Group (1992), Strain Measurement Technology, Raleigh, N.C.,
www.measurementsgroup.com.
Xu, L. R. (2008), “In Class Paper Demonstrations and Experiments fro Solid Mechanics Courses,” International
Journal of Engineering Education, Vol. 24, No. 3, pp. 540-544.
Page 15.1137.10
APPENDIX A
Stress Concentration in a Tensile Specimen
OBJECTIVE:
In this experiment the stress concentration due to a center hole in a tensile specimen is
investigated. If a discontinuity exists in a structural or machine element that interrupts the stress
path, then the stress at the discontinuity may be significantly higher then the nominal stress on
the section, thus leading to a stress concentration.
EQUIPMENT TO BE USED:
Instron Machine
Vishay strain indicator
Vishay switch and balance unit
TESTING PROCEDURE An aluminum plate with a central circular hole will be subjected to a tensile load. Strain
distributions are measured using strain gages attached to different positions on the plate. Local
tangent strains are measured at five positions along the ligament. An additional, remotely
located strain gauge, oriented parallel to the loading direction is used to obtain measurements of
axial far field strain. An experimental measure of the strain concentration factor, can then be
computed from the ratio of the maximum local strain at the notch root, to the remote axial strain,
Note that for this geometry, with purely elastic behavior and uniaxial tensile stress states, the
stress concentration factor equals the strain concentration factor.
1.) Install specimen between grips
2.) Zero strain indicator at the no load condition
3.) Load the plate in tension to a pressure of 500 psi
4.) Record data
DATA REQUIREMENTS:
The cross-sectional dimensions of the specimens must be measured. Care must be taken to avoid
damage to strain gages.
Page 15.1137.11
APPENDIX B
Stress Concentration in a Cantilever Specimen
OBJECTIVE:
The purpose of this experiment is to demonstrate the existence of stress and strain concentration
in the vicinity of a geometric discontinuity in a cantilever beam, and to obtain an approximate
measure of the stress concentration factor. In this case, the discontinuity is simply a circular
hole, drilled through the beam on its centerline.
EQUIPMENT TO BE USED:
Vishay Flexor cantilever flexure frame
Vishay P3 Strain Indicator
TESTING PROCEDURE High-strength aluminum alloy beam, 1/4 x 1 x 12 ½ (3.2 x 25 x 318 mm), outfitted with
preinstalled strain gages and a ¼” diameter stress concentration hole is used in the flexure frame.
Three very small strain gages are placed at varying distances from the hole, with one directly
adjacent to the edge. An additional, remotely located strain gauge, oriented parallel to the
loading direction is used to obtain measurements of axial far field strain. An experimental
measure of the strain concentration factor, can then be computed from the ratio of the maximum
local strain at the notch root, to the remote axial strain, Note that for this geometry, with purely
elastic behavior and uniaxial tensile stress states, the stress concentration factor equals the strain
concentration factor.
1.) Install specimen in the flexure frame
2.) Load the beam till the nominal far-field strain is 200 micro strains
3.) Plot strains on a graph sheet at the locations of the gage centerlines, and draw a smooth curve.
4.) Extrapolate the data to the edge to obtain the peak strain
DATA ACQUISITION:
The gages are connected (via the flexor cable) to the strain indicator one at a time, first with the
beam free, and then the beam deflected. An initial reference reading of the strain indicator
readout is obtained for each gage with the beam free, and a final reading with the beam
deflected. The differences in these two sets of readings gives the strains at the respective gage
locations.
Page 15.1137.12