Embed Size (px)
Citation preview
Abstract—The performance of fouling prediction devices (i.e.
modified fouling index and crossflow sampler-modified fouling
index) operating under constant flux mode for reverse osmosis
(RO)/nanofiltration (NF) filtration system was investigated
experimentally. The effect of crossflow hydrodynamic, foulant
concentration, foulant particle sizes, and membrane resistance
were investigated correspond to MFIconst.flux. Three types of
foulants (i.e. 70-100 nm colloidal silica, 22 nm colloidal silica,
Aldrich humic acid) were adopted. The results showed that the
MFIconst.flux values were higher than CFS-MFIconst.flux,
particularly for high polydispersed foulants (i.e. 70-100 nm
colloidal silica and Aldrich humic acid). The MFIconst.flux values
were consistently increased with increasing foulant
concentration and membrane resistance. Higher values of
MFIconst.flux were observed for polydispersed foulant (i.e. 70-100
nm colloidal silica) than monodispersed foulant (i.e. 22 nm
colloidal silica). This study yielded useful insights in
understanding the crossflow effect, foulant concentration,
foulant particle sizes, and membrane resistance on the RO/NF
fouling potential.
Index Terms—Colloidal silica, constant flux, crossflow,
humic acid, ultrafiltration.
I. INTRODUCTION
Conventional membrane fouling prediction tools are Silt
density index (SDI) and Modified Fouling Index (MFI). SDI
is particularly common in the industry for predicting the
colloidal fouling potential of feed in RO/NF membranes
following its simplicity in operation [1]. However, derivation
of SDI was not founded on any fouling mechanisms and this
factor appears to be the main drawback of the SDI to perform
as an appropriate indicator for RO membrane fouling [2], [3].
On the other hand, the MFI has relatively good correlation
with the feed concentration and thus, it can be used to
represent the actual fouling behaviour of feed [4], [5].
Although the MFI is found greatly linear with the
concentration of feed, the conventional MFI test is designed
to perform in dead-end filtration mode while most RO
systems are operated under crossflow filtration mode [6].
Consequently, the operation of MFI test is completely
Manscript received May 29, 2014; revised September 28, 2014. This
work was supported by Ministry of Higher Education Malaysia under the
grant of Top-Down Long Term Research Grant Scheme through project no. 4L804.
C. H. Koo is with Faculty of Engineering and Science, Universiti Tunku
Abdul Rahman, Jalan Genting Kelang, 53300 Setapak, Kuala Lumpur, Malaysia (e-mail: [email protected]).
A. W. Mohammad and F. Suja’ are with Faculty of Engineering and Built
Environment, Universiti Kebangsaan Malaysia, 43600 UKM Bangi,
Selangor, Malaysia (e-mail: [email protected], [email protected]).
different from the filtration process of RO [7]-[9]. To create
similarity between the MFI test and the RO filtration process,
a crossflow sampler-modified fouling index (CFS-MFI) that
operates under crossflow conditions was developed by
Javeed et al. [7], [9]. In the CFS-MFI device, a CFS cell is
placed at upstream while the standard MFI device is installed
at downstream. A macrofilter is installed in the CFS cell to
create the crossflow hydrodynamic effect as demonstrated in
the RO filtration process. The macrofilter in CFS usually
allows finer particles to pass through so that they can possibly
deposit on the 0.45 µm membrane placed in the dead-end
standard MFI (MFI0.45). It was found that the standard MFI
values were overestimated compared to the CFS-MFI due to
lack of CFS cell [6], [10]. Types of membranes adopted in the
dead-end standard MFI could also greatly affect the value of
MFI. Boerlage et al. [11] adopted ultrafiltration (UF)
membranes with different molecular weight cut-off (MWCO)
to measure the MFI under constant pressure mode. They
revealed that higher value of MFIUF was obtained when UF
membranes with lesser MWCO were adopted. Despite the
fact that the MFI device has been widely used for predicting
RO/NF fouling, there are not many studies associated with
the effect of crossflow hydrodynamic, foulant concentration,
foulant particle sizes, and membrane resistance on the values
of MFI.
In this study, the effect of crossflow hydrodynamic,
foulant concentration, foulant particle sizes, and membrane
resistance were investigated using the MFI devices. The
devices are instrumented to monitor transmembrane pressure
(TMP), crossflow velocity, and flux at a desired time interval.
II. SET-UP OF FOULING PREDICTION DEVICES
The schematic diagram of the equipments used for the
MFIconst.flux and CFS-MFIconst.flux tests is shown in Fig. 1. The
fouling index (FI) measuring device comprises of feed and
collection tanks, a feed pump, a CFS cell (SEPA CF, GE
Osmonics©, Minnetonka, MN), flowmeters, pressure gauges,
pressure sensors, a peristaltic pump, a dead-end cell, an
electronic balance, and data logging system. The effective
membrane areas of CFS cell and dead-end cell were 0.0155
m2 and 0.0095 m
2, respectively. To differentiate between
MFIconst.flux and CFS-MFIconst.flux, a non-retentive membrane
filter with straight-through pores (5 µm MF) was placed in
CFS cell for CFS-MFIconst.flux measurement, while the CFS
cell was left empty (no membrane) for the measurement of
MFIconst.flux. The adoptability of the CFS cell is to simulate the
crossflow filtration effect in the FI measuring devices as in
RO system [6], [7]. Pressure sensors were used to gauge the
TMP increase in the MFI cell (dead-end cell). The readings of
Experimental Investigation on Performance of Fouling
Prediction Devices for NF/RO System
C. H. Koo, A. W. Mohammad, and F. Suja’
International Journal of Chemical Engineering and Applications, Vol. 6, No. 3, June 2015
179DOI: 10.7763/IJCEA.2015.V6.477

the pressure sensors at the dead-end cell were continuously
recoded in the data logging system.
Fig. 1. Schematic of the MFIconst.flux and CFS-MFIconst.flux experimental set-up.
Reprinted from [21] with permission from Elsevier.
III. TESTING DEVICES
A. Experimental Procedures
In this study, the peristaltic pump was installed in the CFS
permeate stream to withdraw permeate from the CFS cell and
subsequently delivered the flow to the dead-end cell. The
constant flux in the dead-end cell was fixed at 30.9 L/m2h.
A constant crossflow rate of 3.2 L/min was maintained in
the channel of crossflow cell, which corresponds to the
crossflow velocity of 0.39 m/s. The crossflow velocity
selected was in the range of typical crossflow velocities
adopted in common RO membrane processes [8]. All fouling
runs subjected to MFIconst.flux and CFS-MFIconst.flux
measurements were tested with various types of foulant
under the same operating conditions. Table I summarizes
parameter values used for each run in this study. All filtration
experiments were conducted at room temperature of about
25 °C and repeated for at least twice to ensure the results were
reproducible.
B. Synthetic Solutions
Three types of foulants (i.e. 70-100 nm colloidal silica, 22
nm colloidal silica, Aldrich humic acid) were adopted in this
study. The colloidal silica was chosen to represent the
colloidal types of foulant, while the Adrich humic acid is
organic type. The model foulants for colloidal silica of
70-100 nm (ST-XL) and 22 nm (LUDOX-TM50) were
supplied by Nissan Chemicals and Sigma Aldrich,
respectively. The foulant solutions of colloidal silica were
prepared by adding a buffer solution to obtain the desired
concentration (i.e. 0, 50, 100, and 200 mg/L). The buffer
solution was prepared by mixing 6.81 g of potassium
dihydrogen phosphate (KH2PO4) with 467 ml of 0.1 M
sodium hydroxide (NaOH) to produce a feed solution of pH 8
[8]. The function of buffer solution is to help in enhancing the
solubility of colloidal silica in the feed solution. The
solubility of colloidal silica increases proportionally with pH
when the pH is greater than 7.8 [12]. The mixture of solution
was then exposed to sonication treatment for duration of 10
min to ensure that the solution was stable and free from any
large aggregates [13].
TABLE I: SUMMARY OF PARAMETER VALUES USED FOR EACH RUN
Test no. 1 Test no. 2 Test no. 3
Foulant properties:
Type: Colloidal silica SiO2 with
particle size: 70–100 nm
Colloidal silica SiO2 with
particle size: 22 nm
Aldrich humic acid (AHA) with
molecular weight: 4170 Da
Concentration: 200 mg/L 200 mg/L 10 mg/L pH 8 8 8.5
Temperature 25 °C
Flow configurations:
Crossflow velocity: 0.39 m/s
Feed in flow rate of peristaltic pump: 4.9 mL/min
Flux: 30.9 Lm-2h-1
Duration of test: 1 h
Membrane in CFS cell:
During MFI test No membrane
During CFS-MFI test
MF membrane: 5 µm Polycarbonate track-etch (PCTE)
Membrane in dead-end cell:
During both MFI & CFS-MFI tests UF membrane: Polyvinylidene fluoride (PVDF) 100
(100 kDa)
UF membrane: Polyether sulfone (PES)10
(10 kDa)
UF membrane: Polyether sulfone (PES)10
(10 kDa)
Commercial type of AHA with apparent molecular size of
300-10,000 Da purchased from Sigma Aldrich was used in
this study. The stock solution of AHA (0.2 g/L) was prepared
by dissolving the powdered form AHA in 0.05 M of sodium
bicarbonate solution (NaHCO3) to enhance its solubility [14].
Foulant solution was prepared by adding deionized (DI)
water to the stock solution to obtain the desired concentration.
The final AHA solution was adjusted to pH 8.5 with dilute
sodium hydroxide (NaOH).
C. Membranes
Flat sheet polyvinylidene fluoride (PVDF) UF membranes
International Journal of Chemical Engineering and Applications, Vol. 6, No. 3, June 2015
180
with the MWCO of 150 kDa (denoted as PVDF150) and 100
kDa (denoted as PVDF100) were adopted in the dead-end
cell for fouling test using colloidal silica of 70-100 nm as
model foulant. Other membranes employed in the dead-end
cell are presented in Table II. A polycarbonate track-etch
(PCTE) MF membrane of 5 µm was chosen in the CFS cell
for the CFS-MFIconst.flux measurement. Since the PCTE
membranes are prepared using track-etch method, it has
straight-through cylindrical pores rather than tortuous pores
[15]. The main reason of adopting this type of membrane was
to avoid retention of foulants on the surface of membrane
installed into the CFS cell. It was believed that no
depth-filtration would possibly happen in view of all foulants
would pass to the permeate side via the straight-through pores
[7]. The wettability of all membranes was measured using
EasyDrop contact angle measuring instrument (KRÜSS
GmbH, Hamburg) based on the standard sessile drop method.
IV. RESULTS AND DISCUSSION
A. Crossflow Hydrodynamic
The plot for determining MFIconst.flux and CFS-MFIconst.flux
under constant flux filtration mode is summarized in Table III.
From Table III, the consistently lower values of
CFS-MFIconst.flux than the MFIconst.flux values indicated that
crossflow hydrodynamic effect played a dominant role in
simulating the crossflow filtration effect as in RO system.
Under crossflow filtration mode, the hydrodynamic shear
force generated would help to reduce the effect of fouling by
preventing foulants to be deposited on the membrane surface
[16]-[18]. These findings were supported by Sim et al. [8]
who found that the values of CFS-MFIconst.flux obtained
through a UF membrane were lower than that of MFIconst.flux
with differences ranging from 5% to 38%.
B. Foulant Concentration
Table IV compares the values of MFIconst.flux filtering
colloidal silica of various solutions using two different types
of UF membranes (i.e. PVDF150 and PVDF100 membranes).
Consistent trends were observed for all the values of
MFIconst.flux, whereby a high concentration of colloidal silica
yielded a high value of MFIconst.flux. The increase of
MFIconst.flux was mostly caused by particle depositions on the
membrane surface. A higher rate of particle deposition onto
the membrane was anticipated when a higher feed particle
concentration was adopted. This is because a high particle
concentration promotes the increase in the rate of convective
transport of particles towards the membrane surface [19]. In
addition, when the cumulative amount of deposited colloids
increases, the hydraulic resistance of feedwater to flow
through the compressed fouling layer would significantly
increase and subsequently yields a high value of fouling
index [20]. Moreover, the fouling behaviour is often
accelerated when the load of particles deposited on
membrane increases with filtration time [18], [21], [22].
Similar proportional trends are observed for the foulants of
22 nm colloidal silica and Aldrich humic acid (not shown in
article).
C. Foulant Particle Sizes
Table V presents the values of MFIconst.flux for different
particles sizes of colloidal silica foulants tested using
PVDF100 membrane. The MFIconst.flux of the large
polydispersed colloidal silica (70–100 nm) was consistently
higher than that of smaller counterpart (22 nm) for all the
concentrations studied. The results were in a good agreement
with the research conducted by Song et al. [23]. They
reported that higher fouling potential was obtained when
filtering the feedwater containing broader particle sizes of
polydispersed colloidal silica. This is because polydispersed
particles are responsible to increase the effective depth of the
cake layer formed, and hence create a higher resistance than
those of the monodispersed particles of smaller size. Since
larger particles are susceptible to much greater hydraulic drag
force than those of small particles, it is suspected that
significant compression of the fouling layer had occurred
when large particles are used [24] and subsequently resulted
in high values of MFIconst.flux [20].
D. Membrane Resistance
Membrane resistance quantifies permeability in terms of
surface porosity, tortuosity, pore size and membrane
thickness. In order to demonstrate the effect of membrane
resistance on the MFIconst.flux, the values of MFIconst.flux
measured for the solutions of colloidal silica (70–100 nm)
using PVDF150 and PVDF100 membrane is presented in
Table IV. The measured MFIconst.flux values ranged from
290-11680 s/L2. The fouling indices for the membranes with
large membrane resistance had a higher value of MFIconst.flux
than those of small membrane resistance (i.e. PVDF150). For
instances, the fouling indices obtained for PVDF100
membrane were higher than that of PVDF150. It is generally
accepted that membrane with a higher membrane resistance
result in a much higher resistance of flow. Consequently, this
may cause an increase in the TMP on the dead-end cell.
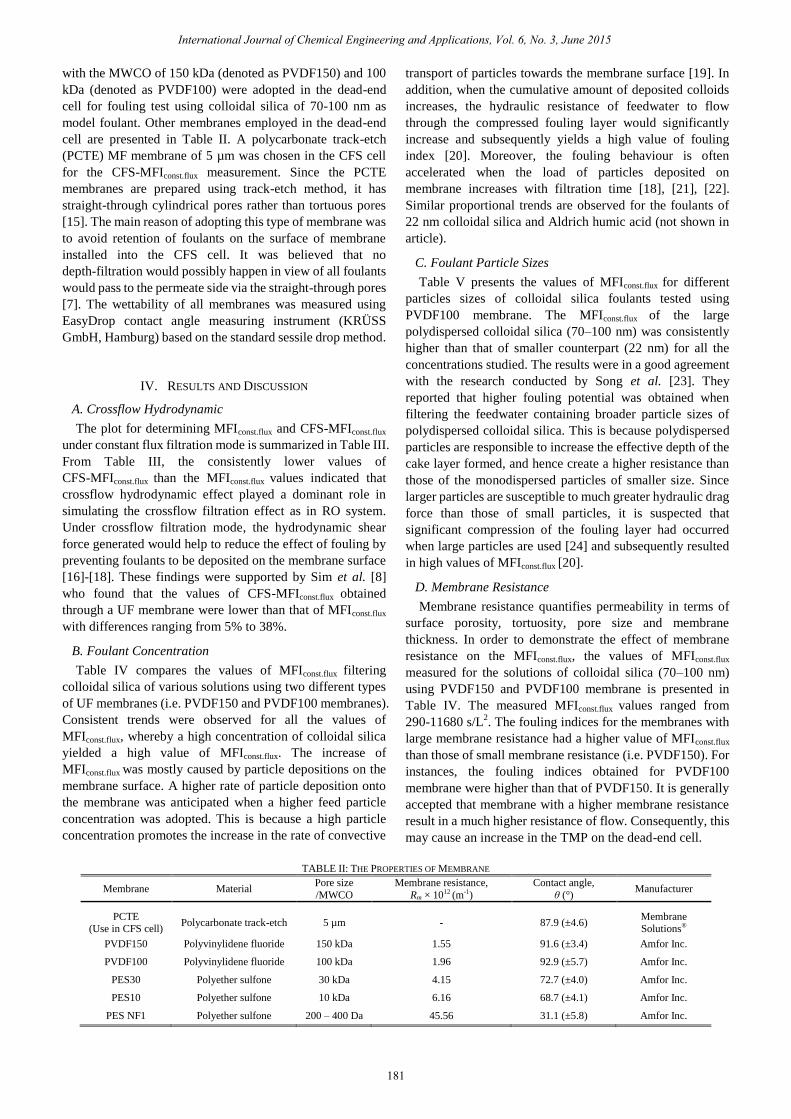
TABLE II: THE PROPERTIES OF MEMBRANE
Membrane Material Pore size
/MWCO
Membrane resistance,
Rm × 1012 (m-1)
Contact angle,
θ (°) Manufacturer
PCTE (Use in CFS cell)
Polycarbonate track-etch 5 µm - 87.9 (±4.6) Membrane Solutions®
PVDF150 Polyvinylidene fluoride 150 kDa 1.55 91.6 (±3.4) Amfor Inc.
PVDF100 Polyvinylidene fluoride 100 kDa 1.96 92.9 (±5.7) Amfor Inc.
PES30 Polyether sulfone 30 kDa 4.15 72.7 (±4.0) Amfor Inc.
PES10 Polyether sulfone 10 kDa 6.16 68.7 (±4.1) Amfor Inc.
PES NF1 Polyether sulfone 200 – 400 Da 45.56 31.1 (±5.8) Amfor Inc.
International Journal of Chemical Engineering and Applications, Vol. 6, No. 3, June 2015
181
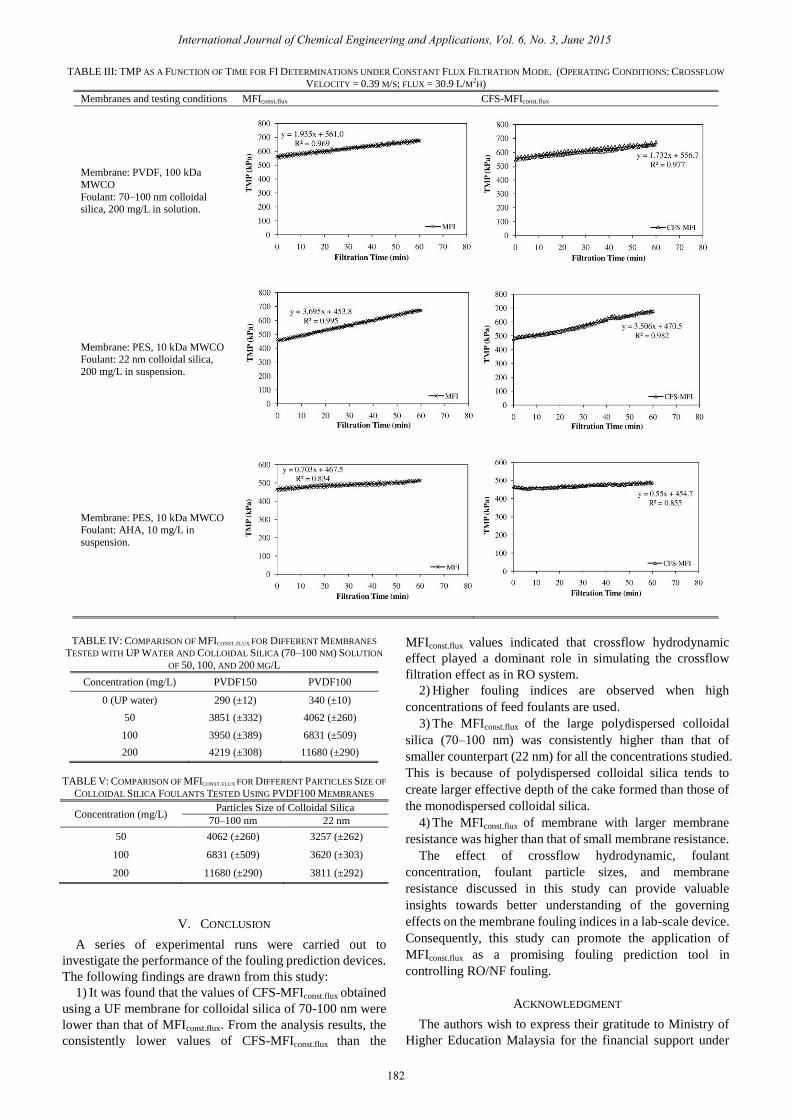
TABLE III: TMP AS A FUNCTION OF TIME FOR FI DETERMINATIONS UNDER CONSTANT FLUX FILTRATION MODE. (OPERATING CONDITIONS: CROSSFLOW
VELOCITY = 0.39 M/S; FLUX = 30.9 L/M2H)
Membranes and testing conditions MFIconst.flux CFS-MFIconst.flux
Membrane: PVDF, 100 kDa
MWCO
Foulant: 70–100 nm colloidal silica, 200 mg/L in solution.
Membrane: PES, 10 kDa MWCO Foulant: 22 nm colloidal silica,
200 mg/L in suspension.
Membrane: PES, 10 kDa MWCO Foulant: AHA, 10 mg/L in
suspension.
TABLE IV: COMPARISON OF MFICONST.FLUX FOR DIFFERENT MEMBRANES
TESTED WITH UP WATER AND COLLOIDAL SILICA (70–100 NM) SOLUTION
OF 50, 100, AND 200 MG/L
Concentration (mg/L) PVDF150 PVDF100
0 (UP water) 290 (±12) 340 (±10)
50 3851 (±332) 4062 (±260)
100 3950 (±389) 6831 (±509)
200 4219 (±308) 11680 (±290)
TABLE V: COMPARISON OF MFICONST.FLUX FOR DIFFERENT PARTICLES SIZE OF
COLLOIDAL SILICA FOULANTS TESTED USING PVDF100 MEMBRANES
Concentration (mg/L) Particles Size of Colloidal Silica
70–100 nm 22 nm
50 4062 (±260) 3257 (±262)
100 6831 (±509) 3620 (±303)
200 11680 (±290) 3811 (±292)
V. CONCLUSION
A series of experimental runs were carried out to
investigate the performance of the fouling prediction devices.
The following findings are drawn from this study:
1) It was found that the values of CFS-MFIconst.flux obtained
using a UF membrane for colloidal silica of 70-100 nm were
lower than that of MFIconst.flux. From the analysis results, the
consistently lower values of CFS-MFIconst.flux than the
MFIconst.flux values indicated that crossflow hydrodynamic
effect played a dominant role in simulating the crossflow
filtration effect as in RO system.
2) Higher fouling indices are observed when high
concentrations of feed foulants are used.
3) The MFIconst.flux of the large polydispersed colloidal
silica (70–100 nm) was consistently higher than that of
smaller counterpart (22 nm) for all the concentrations studied.
This is because of polydispersed colloidal silica tends to
create larger effective depth of the cake formed than those of
the monodispersed colloidal silica.
4) The MFIconst.flux of membrane with larger membrane
resistance was higher than that of small membrane resistance.
The effect of crossflow hydrodynamic, foulant
concentration, foulant particle sizes, and membrane
resistance discussed in this study can provide valuable
insights towards better understanding of the governing
effects on the membrane fouling indices in a lab-scale device.
Consequently, this study can promote the application of
MFIconst.flux as a promising fouling prediction tool in
controlling RO/NF fouling.
ACKNOWLEDGMENT
The authors wish to express their gratitude to Ministry of
Higher Education Malaysia for the financial support under
International Journal of Chemical Engineering and Applications, Vol. 6, No. 3, June 2015
182
the grant of Top-Down Long Term Research Grant Scheme
through project no. 4L804.
REFERENCES
[1] A. Alhadidi, A. J. B. Kemperman, B. Blankert, J. C. Schippers, M. Wessling, and W. G. J. van der Meer, “Silt density index and modified
fouling index relation, and effect of pressure, temperature and
membrane resistance,” Desalination, vol. 273, no. 1, pp. 48-56, 2011. [2] J. C. Schippers, and J. Verdouw, “The modified fouling index, a
method of determining the fouling characteristics of water,”
Desalination, vol. 32, pp. 137-148, 1980. [3] S. F. E. Boerlage, Scaling and Particulate Fouling in Membrane
Filtration Systems, Taylor and Francis, 2001.
[4] S. F. E. Boerlage, M. D. Kennedy, M. P. Aniye, E. M. Abogrean, G. Galjaard, and J. C. Schippers, “Monitoring particulate fouling in
membrane systems,” Desalination, vol. 118, no. 1-3, pp. 131-142,
1998. [5] S. G. Yiantsios and A. J. Karabelas, “The effect of colloid stability on
membrane fouling,” Desalination, vol. 118, no. 1-3, pp. 143-152,
1998. [6] M. A. Javeed, K. Chinu, H. K. Shon, and S. Vigneswaran, “Effect of
pre-treatment on fouling propensity of feed as depicted by the modified
fouling index (MFI) and cross-flow sampler-modified fouling index (CFS-MFI),” Desalination, vol. 238, no. 1-3, pp. 98-108, 2009.
[7] S. S. Adham and A. G. Fane, Crossflow Sampler Fouling Index,
National Water Research Institute, California, USA, 2008. [8] L. N. Sim, Y. Ye, V. Chen, and A. G. Fane, “Crossflow Sampler
Modified Fouling Index Ultrafiltration (CFS-MFIUF)--An alternative
Fouling Index,” Journal of Membrane Science, vol. 360, no. 1-2, pp. 174-184, 2010.
[9] M. A. Javeed, D. E. Wiley, and A. G. Fane, “Development of the
modified fouling index for the assessment of fouling propensity of the feed,” School of Chemical Engineering and Industrial Chemistry,
University of New South Wales, Australia, 2006.
[10] L. N. Sim, Y. Ye, V. Chen, and A. G. Fane, “Comparison of MFI-UF constant pressure, MFI-UF constant flux and Crossflow
Sampler-Modified Fouling Index Ultrafiltration (CFS-MFIUF),” Water
Research, vol. 45, no. 4, pp. 1639-1650, 2011. [11] S. F. E. Boerlage, M. D. Kennedy, M. R. Dickson, D. E. Y. El-Hodali,
and J. C. Schippers, “The modified fouling index using ultrafiltration
membranes (MFI-UF): characterisation, filtration mechanisms and proposed reference membrane,” Journal of Membrane Science, vol.
197, no. 1-2, pp. 1-21, 2002.
[12] A. J. Karabelas, “Critical assessment of fouling indices,” MEDRC Series of R&D Reports, 2003.
[13] K. Hong, S. Lee, S. Choi, Y. Yu, S. Hong, J. Moon, J. Sohn, and J.
Yang, “Assessment of various membrane fouling indexes under seawater conditions,” Desalination, vol. 247, no. 1-3, pp. 247-259,
2009.
[14] I. M. Adekunle, T. A. Arowolo, N. P. Ndahi, B. Bello, and D. A. Owolabi, “Chemical characteristics of humic acids in relation to lead,
copper and cadmium levels in contaminated soils from South West Nigeria,” Annals of Environmental Science, vol. 1, pp. 23-34, 2007.
[15] K. Nath, Membrane Seperation Process: Basic Concepts,
Prentice-Hall of India Pvt. Limited, New Delhi, 2008.
[16] C. H. Koo, A. W. Mohammad, F. Suja’, and M. Z. Meor Talib, “Use
and development of fouling index in predicting membrane fouling − A
Review,” Separation and Purification Reviews, vol. 42, pp. 296-339, 2013.
[17] S. Phuntsho, H. K. Shon, S. Vigneswaran, and J. Cho, “Assessing
membrane fouling potential of humic acid using flow field-flow fractionation,” Journal of Membrane Science, vol. 373, no. 1–2, pp.
64-73, 2011.
[18] J. Kim and F. A. DiGiano, “Fouling models for low-pressure membrane systems,” Separation and Purification Technology, vol. 68,
no. 3, pp. 293-304, 2009.
[19] X. Zhu and M. Elimelech, “Colloidal fouling of reverse osmosis
membranes: Measurements and fouling mechanisms,” Environmental Science & Technology, vol. 31, no. 12, pp. 3654-3662, 1997.
[20] C. H. Koo, A. W. Mohammad, F. Suja’, and M. Z. Meor Talib,
“Review of the effect of selected physicochemical factors on membrane fouling propensity based on fouling indices,” Desalination,
vol. 287, pp. 167-177, 2012.
[21] C. H. Koo, A. W. Mohammad, F. Suja, and M. Z. Meor Talib, “Setting-up of modified fouling index (MFI) and crossflow
sampler-modified fouling index (CFS-MFI) measurement devices for
NF/RO fouling,” Journal of Membrane Science, vol. 435, pp. 165-175, 2013.
[22] B. Van der Bruggen, M. Mänttäri, and M. Nyström, “Drawbacks of
applying nanofiltration and how to avoid them: A review,” Separation and Purification Technology, vol. 63, no. 2, pp. 251-263, 2008.
[23] L. Song, K. L. Chen, S. L. Ong, and W. J. Ng, “A new normalization
method for determination of colloidal fouling potential in membrane processes,” Journal of Colloid and Interface Science, vol. 271, no. 2,
pp. 426-433, 2004.
[24] N. N. Kramadhati, M. Mondor, and C. Moresoli, “Evaluation of the shear-induced diffusion model for the microfiltration of polydisperse
feed suspension,” Separation and Purification Technology, vol. 27, no.
1, pp. 11-24, 2002.
Charlene Koo is currently a lecturer in Universiti
Tunku Abdul Rahman (UTAR) of Kuala Lumpur campus. She received her B.Eng. degree in civil
engineering and M.Eng. degree in civil engineering
(environmental management) from the
Technological University of Malaysia (UTM) in
2005 and 2006, respectively. She then worked as a
process and design engineer in an environmental specialist company in Johor Bahru for years before
joining UTAR in 2009. In 2010, she pursued her
doctoral studies at the National University of Malaysia (UKMalaysia). Recently, she has passed her doctoral examination and is expected to
officially receive her scroll in October 2014. Her research interests are
mainly focuse on water and wastewater treatment using membrane technology. Besides, she will also plan to venture into the water recycling
and reclamation technology using membrane technology particularly for
industrial applications.
International Journal of Chemical Engineering and Applications, Vol. 6, No. 3, June 2015
183


![Fouling vs. Availability · PDF fileFouling vs. Availability CheMin ... Sanicro 28/ 63, Sandvik 8RE. Fouling vs. Availability CheMin ... Fouling rate...Heat Transfer [W/m2]](https://img.pdfslide.us/doc/110x75/5aadcccc7f8b9a8f498eba95/fouling-vs-availability-vs-availability-chemin-sanicro-28-63-sandvik-8re.jpg)