Embed Size (px)
Citation preview

1
Experiment 4 Introduction to TI C2000 microcontroller, Code Composer
Studio (CCS) and Matlab Graphic User Interface (GUI)
4.1 Objective
This experiment is in continuation of Experiments 2 and 3. In Experiment 2, the students learned how to generate a PWM signal on one of the I/O ports of the target board (microcontroller) by using Matlab/Simulink. In Experiment 3, the students learned how to read and import a square-wave signal from one of the I/O ports of the microcontroller and plot it in Matlab/Simulink.
In this experiment, the students learn how to (i) generate two complementary PWM signals on two I/O ports of the microcontroller and (ii) read and import the two generated PWM signals from the other two I/O ports of the microcontroller and plot them in Matlab/Simulink.
4.2 Building the Power Electronic Simulink Model
1. Simulink Program Create a new Simulink model to generate two PWM signals and also to read two square wave signals. For component configurations, use your knowledge/background from Experiments 2 and 3. A typical Simulink model developed for this purpose is shown in the following figure.
Target Preference
Board block
2
2. Configuration of the Blocks, Parameters, and Components
a) Configure your Target preference board as you did in Experiments 2 and 3.
b) Go to Simulation---- >Configuration Parameters
Change the solver to fixed step and leave the fixed step-size as ‘auto’ only.
c) Setting a Sampling Time for Simulink Blocks
You must choose ‘-1’(inherited) instead of specific numbers(ex. 1e-5sec) for all the blocks.
d) ADC Block parameters: Make sure to choose correct SOC trigger number and input channel. Ex: use if you use SOC0 then use input channel ADCINA0, for SOC1 use ADCINA1 etc.
e) PWM Block Configurations
Period and duty cycle must be controlled by “input ports”. You can use either a pair of a PWM block or two different PWMs for your design. Ex) PWM1A / PWM1B or PWM2A / PWM2B…, etc.
f) PWM Time Period and Duty Cycle Setting
Duty cycle must be controlled in a percentage format. For time period, using clock cycles is recommended. Ex: For clock cycle calculation use the following equation: Clock cycles (pts.) = desired time period (sec) * Target board frequency (60 MHz)
2400 pts = 40e-6s*60Mhz.

3
The ePWM block parameters which have to be changed are marked in the figures below:

4
4.3 GUI Program
1. Development of the GUI Develop a GUI program to control the duty cycle and period of the generated PWM waveforms and plot the imported square waveforms. For this purpose, you need to use the following components in your GUI program. Specify the Tag names for the components and change/edit the m-code associated with the GUI accordingly.
2. Editing the exp4cntrGUI m-file Edit the m-code associated with your GUI program to include the following features/functionalities. a) Plot/Adjust the Axis
Write this code from line 64
% Initial setting for two axes% set(handles.figure1, 'visible' , 'off' ) axes(handles.axes1); set(handles.axes1, 'xlim' ,[0 200]); set(handles.axes1, 'ylim' ,[-1 5]); set(handles.axes1, 'xlimmode' , 'manual' ); set(handles.axes1, 'ylimmode' , 'manual' ); set(handles.axes1, 'layer' , 'bottom' ); set(handles.axes1, 'nextplot' , 'add' );
xlabel( 'fixed steps' ); ylabel( 'pwm1' );

5
% Plot some dummy data first to get axes handle % allNaN = NaN*ones(1,200); plot(allNaN); handles.h1 = line( 'parent' , handles.axes1);
set(handles.figure1, 'visible' , 'off' ) axes(handles.axes2); set(handles.axes2, 'xlim' ,[0 200]); set(handles.axes2, 'ylim' ,[-1 5]); set(handles.axes2, 'xlimmode' , 'manual' ); set(handles.axes2, 'ylimmode' , 'manual' ); set(handles.axes2, 'layer' , 'bottom' ); set(handles.axes2, 'nextplot' , 'add' );
xlabel( 'fixed steps' ); ylabel( 'pwm2' ); % Plot some dummy data first to get axes handle % allNaN = NaN*ones(1,200); plot(allNaN); handles.h2 = line( 'parent' , handles.axes2);
b) Initialize the Code Composer Studio settings (Continuation) %intializing CCS settings global cc; cc=ticcs; configure(cc.rtdx,1024,4); %setting buffer memories for RTDX open(cc.rtdx, 'ichan1' , 'w' ); %open RTDX channel for ichan1 open(cc.rtdx, 'ichan2' , 'w' ); %open RTDX channel for ichan2 open(cc.rtdx, 'ochan1' , 'r' ); %open RTDX channel for ochan1 open(cc.rtdx, 'ochan2' , 'r' ); %open RTDX channel for ochan2 enable(cc.rtdx, 'ichan1' ); %enable ichan1 RTDX channel enable(cc.rtdx, 'ichan2' ); %enable ichan2 RTDX channel enable(cc.rtdx, 'ochan1' ); %enable ochan1 RTDX channel enable(cc.rtdx, 'ochan2' ); %enable ochan2 RTDX channel enable(cc.rtdx); %enable RTDX cc.rtdx; %link to CCS
c) Plot data on the Axes of GUI and show instantaneous value of the Ydata in the Edit box
(Continuation) % Plotting datas in your GUI% frameSize = 1; xlimit = 200; NumOfFrames = xlimit/frameSize; yLines = handles.h1; yLines2 = handles.h2; set(handles.figure1, 'visible' , 'on' ); r = cc.rtdx;

6
while (isenabled(cc.rtdx)) set(yLines, 'ydata' , allNaN, 'xdata' ,[1:xlimit]); pause(1e-7); set(yLines2, 'ydata' , allNaN, 'xdata' ,[1:xlimit]); pause(1e-7); for k = 1:NumOfFrames if ~ishandle(yLines) return ; end if ~ishandle(yLines2) return ; end yAll=get(yLines, 'ydata' ); x=(k-1)*frameSize+1; y=(k-1)*frameSize+frameSize; yAll2=get(yLines2, 'ydata' ); x2=(k-1)*frameSize+1; y2=(k-1)*frameSize+frameSize; %Read Value from Target board via RTDX % numMsgs = r.msgcount( 'ochan1' ); numMsgs2 = r.msgcount( 'ochan2' ); if (numMsgs > 0), if (numMsgs > 1), r.flush( 'ochan1' ,numMsgs-1); end yAll(x:y) = readmsg(cc.rtdx, 'ochan1' , 'int32' ); set(handles.dutyedit1, 'String' ,num2str(yAll(y))) end set(yLines, 'ydata' ,yAll, 'xdata' ,[1:xlimit]); pause(1e-7); if (numMsgs2 > 0), if (numMsgs2 > 1), r.flush( 'ochan2' ,numMsgs2-1); end yAll2(x2:y2) = readmsg(cc.rtdx, 'ochan2' , 'int32' ); set(handles.dutyedit2, 'String' ,num2str(yAll2(y2))) end set(yLines2, 'ydata' ,yAll2, 'xdata' ,[1:xlimit]); pause(1e-7); end end

7
d) Define the functionality of “duty1enable” and “prd1enable” pushbuttons function duty1enable_Callback(hObject, eventdata, handles) % hObject handle to duty1enable (see GCBO) % eventdata reserved - to be defined in a future v ersion of MATLAB % handles structure with handles and user data ( see GUIDATA) global cc; dutyin = str2num(get(handles.dutyedit, 'string' )); %convert strings of the dutyedit to nubmer% writemsg(cc.rtdx, 'ichan2' , int32(dutyin)); % write a message to duty_ichan rtdx channel% % --- Executes on button press in prd1enable. function prd1enable_Callback(hObject, eventdata, handles) % hObject handle to prd1enable (see GCBO) % eventdata reserved - to be defined in a future v ersion of MATLAB % handles structure with handles and user data ( see GUIDATA) global cc; prdin = str2num(get(handles.prdedit, 'string' )); %convert strings of the dutyedit to nubmer% writemsg(cc.rtdx, 'ichan1' , int32(prdin)); % write a message to duty_ichan rtdx channel%

8
e) Define the functionality of “RUN” and “HALT” pushbu ttons
% --- Executes on button press in Halt. function Halt_Callback(hObject, eventdata, handles) % hObject handle to Halt (see GCBO) % eventdata reserved - to be defined in a future v ersion of MATLAB % handles structure with handles and user data ( see GUIDATA) global cc; halt(cc); % --- Executes on button press in Run. function Run_Callback(hObject, eventdata, handles) % hObject handle to Run (see GCBO) % eventdata reserved - to be defined in a future v ersion of MATLAB % handles structure with handles and user data ( see GUIDATA) global cc; run(cc);
4.4 Implementation
1. Turn on the TI C2000 micro-controller
You must turn on the TI C2000 micro-controller by selecting the USB side of toggle switch.

9
2. Check the connection between the Matlab and TI C2000 micro-controller
Type “ticcs” in the Matlab command window to check the connection between the TI C2000 micro-controller and Matlab. If the connection is established, you will get the following message.
3. Build C code language from simulation model
Users can build the simulation model by clicking the build button in the simulation toolbar.
And then, IDE link links to Code Composer Studio to generate C code. If build is completed, Code Composer Studio must be linked like below.

10
4. Load the C code on the target board
Since the build action is selected as ‘build’, use must load the C code on the target board manually by selecting ‘load program’ command in the ‘File’ option.
11
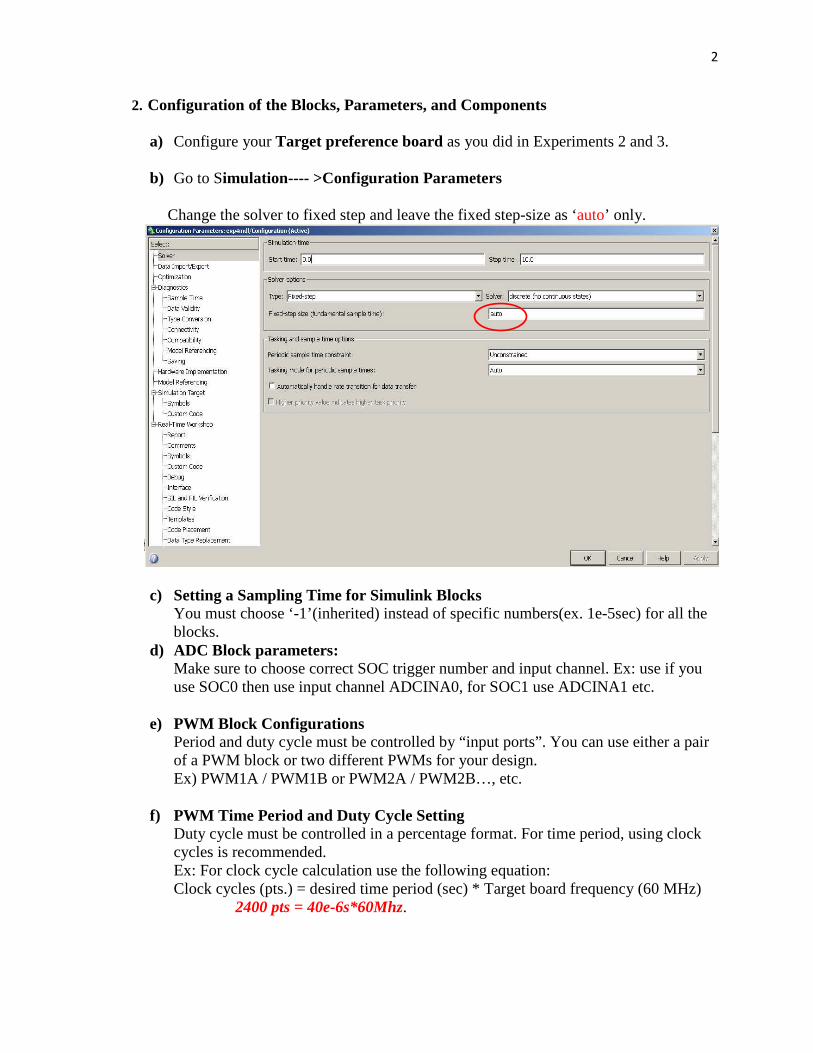
5. Run the m-file You can run the control interface by clicking RUN button of toolbar of m-file.
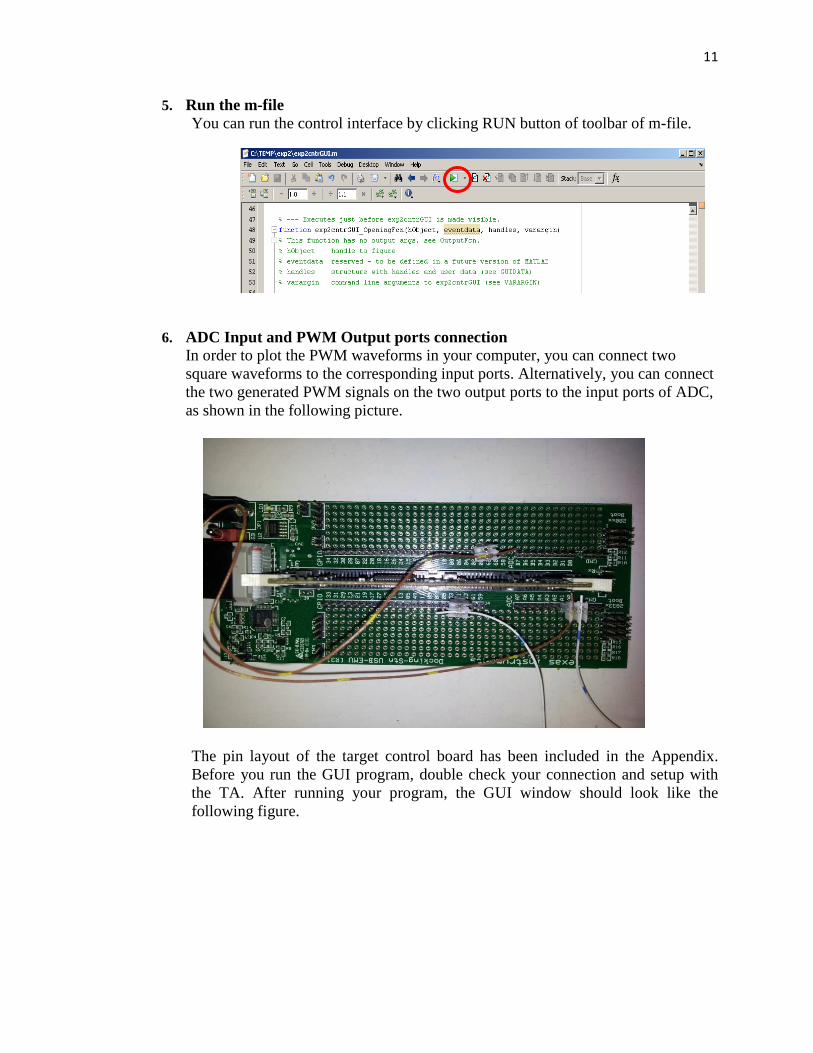
6. ADC Input and PWM Output ports connection
In order to plot the PWM waveforms in your computer, you can connect two square waveforms to the corresponding input ports. Alternatively, you can connect the two generated PWM signals on the two output ports to the input ports of ADC, as shown in the following picture.
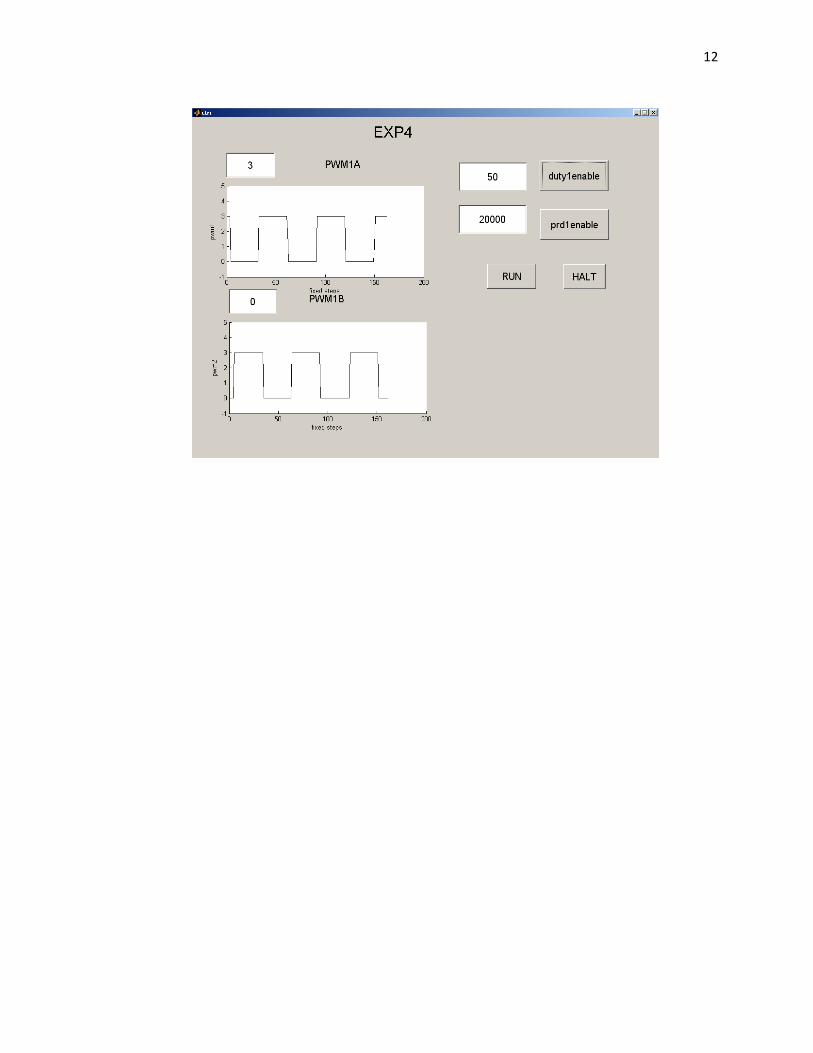
The pin layout of the target control board has been included in the Appendix. Before you run the GUI program, double check your connection and setup with the TA. After running your program, the GUI window should look like the following figure.
12

13
APPENDIX Pin Layout of the Target Board