Embed Size (px)
Citation preview
GS GMSCD0601-01E
General Specification
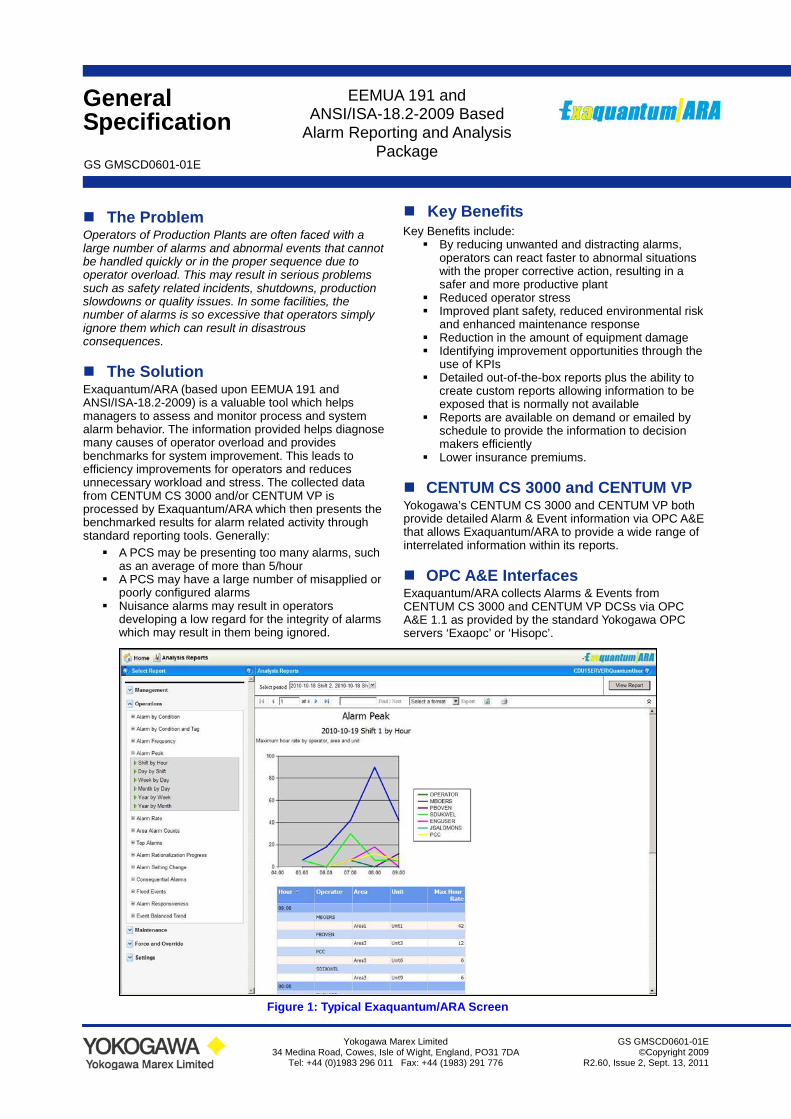
The Problem Operators of Production Plants are often faced with a large number of alarms and abnormal events that cannot be handled quickly or in the proper sequence due to operator overload. This may result in serious problems such as safety related incidents, shutdowns, production slowdowns or quality issues. In some facilities, the number of alarms is so excessive that operators simply ignore them which can result in disastrous consequences.
The Solution Exaquantum/ARA (based upon EEMUA 191 and ANSI/ISA-18.2-2009) is a valuable tool which helps managers to assess and monitor process and system alarm behavior. The information provided helps diagnose many causes of operator overload and provides benchmarks for system improvement. This leads to efficiency improvements for operators and reduces unnecessary workload and stress. The collected data from CENTUM CS 3000 and/or CENTUM VP is processed by Exaquantum/ARA which then presents the benchmarked results for alarm related activity through standard reporting tools. Generally: A PCS may be presenting too many alarms, such
as an average of more than 5/hour A PCS may have a large number of misapplied or
poorly configured alarms Nuisance alarms may result in operators
developing a low regard for the integrity of alarms which may result in them being ignored.
Key Benefits Key Benefits include: By reducing unwanted and distracting alarms,
operators can react faster to abnormal situations with the proper corrective action, resulting in a safer and more productive plant
Reduced operator stress Improved plant safety, reduced environmental risk
and enhanced maintenance response Reduction in the amount of equipment damage Identifying improvement opportunities through the
use of KPIs Detailed out-of-the-box reports plus the ability to
create custom reports allowing information to be exposed that is normally not available
Reports are available on demand or emailed by schedule to provide the information to decision makers efficiently
Lower insurance premiums.
CENTUM CS 3000 and CENTUM VP Yokogawa’s CENTUM CS 3000 and CENTUM VP both provide detailed Alarm & Event information via OPC A&E that allows Exaquantum/ARA to provide a wide range of interrelated information within its reports.
OPC A&E Interfaces Exaquantum/ARA collects Alarms & Events from CENTUM CS 3000 and CENTUM VP DCSs via OPC A&E 1.1 as provided by the standard Yokogawa OPC servers ‘Exaopc’ or ‘Hisopc’.
EEMUA 191 and ANSI/ISA-18.2-2009 Based
Alarm Reporting and Analysis Package
Yokogawa Marex Limited 34 Medina Road, Cowes, Isle of Wight, England, PO31 7DA
Tel: +44 (0)1983 296 011 Fax: +44 (1983) 291 776
GS GMSCD0601-01E ©Copyright 2009
R2.60, Issue 2, Sept. 13, 2011
Figure 1: Typical Exaquantum/ARA Screen
2
All Rights Reserved. Copyright © 2009, Yokogawa Marex Limited Subject to change without notice.
GS GMSCD0601-01E R2.60 Issue 2, Sept. 13, 2011
Capabilities Collection of Continuous Alarms & Events Alarms and events are continuously collected from the Yokogawa DCS(s) to provide statistical Alarms & Events reports to Exaquantum/ARA clients based on EEMUA 191 and ANSI/ISA-18.2-2009 guidelines. Yokogawa has uniquely extended Exaopc (Yokogawa’s OPC DA, A&E, HDA and Batch OPC server) implementation of OPC HDA to include Historical Alarms & Events (HAE). This allows Exaopc to automatically buffer all Alarms & Events that are received when contact to Exaquantum/ARA is lost. Once communication is restored, all buffered Alarms & Events can be provided to Exaquantum/ARA, resulting in no information loss.
Interface with Yokogawa’s ‘CAMS for HIS’ Exaquantum/ARA will interface with Yokogawa’s ‘CAMS for HIS’ as follows: An alarm is set to Alarm detection/disable in CAMS
to remove low-value Alarm Messages from DCS Alarm Displays within an Operator Station. An Alarm that is detection/disabled does not contribute to the statistics reported in Exaquantum/ARA with the only exception of the ‘Alarm Frequency’ Report.
The Priority functions in CAMS provide alternative settings to those used in the DCS. The processing of new alarms will attempt to find a priority defined by CAMS and if this doesn’t exist, then the DCS Alarm Level is used instead.
Critical, High, Medium and Low priority alarms are used in Exaquantum/ARA reports.
Alarms that are subject to active CAMS Group Suppression are excluded from those ARA Reports that are designed to reflect alarm loading from the Operators perspective.
Standards Organizations EEMUA 191 The following table lists the EEMUA 191 guidelines met by the listed Exaquantum/ARA reports.
Report Name EEMUA 191
Ref. Section
Alarm Frequency (Figure 7) A12.6
Alarm Peak (Figure 8) A12.7
Alarm Rate (Figure 9) A12.5
Consequential Alarms (Figure 14) A12.11
Alarm Responsiveness (Figure 16) A12.10
Event Balanced Trend (Figure 17) A12.10
Chattering Alarms (Figure 19) A11.7
Long Standing (Stale) Alarms
(Figure 21) A12.8
Suppressed Alarms (Figure 22) A8.3
Bad Actors (Figure 23) A8.3
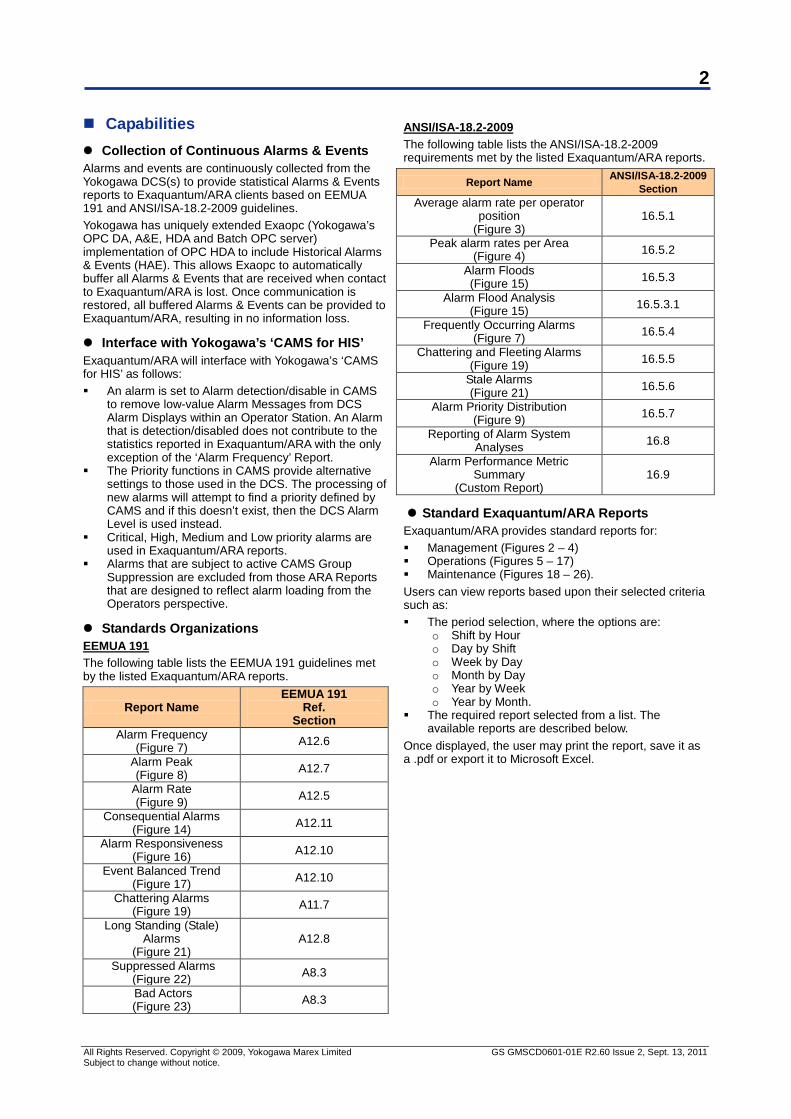
ANSI/ISA-18.2-2009 The following table lists the ANSI/ISA-18.2-2009 requirements met by the listed Exaquantum/ARA reports.
Report Name ANSI/ISA-18.2-2009 Section
Average alarm rate per operator position
(Figure 3) 16.5.1
Peak alarm rates per Area (Figure 4) 16.5.2
Alarm Floods (Figure 15) 16.5.3
Alarm Flood Analysis (Figure 15) 16.5.3.1
Frequently Occurring Alarms (Figure 7) 16.5.4
Chattering and Fleeting Alarms (Figure 19) 16.5.5
Stale Alarms (Figure 21) 16.5.6
Alarm Priority Distribution (Figure 9) 16.5.7
Reporting of Alarm System Analyses 16.8
Alarm Performance Metric Summary
(Custom Report) 16.9
Standard Exaquantum/ARA Reports Exaquantum/ARA provides standard reports for: Management (Figures 2 – 4) Operations (Figures 5 – 17) Maintenance (Figures 18 – 26). Users can view reports based upon their selected criteria such as: The period selection, where the options are:
o Shift by Hour o Day by Shift o Week by Day o Month by Day o Year by Week o Year by Month.
The required report selected from a list. The available reports are described below.
Once displayed, the user may print the report, save it as a .pdf or export it to Microsoft Excel.
3
All Rights Reserved. Copyright © 2009, Yokogawa Marex Limited Subject to change without notice.
GS GMSCD0601-01E R2.60 Issue 2, Sept. 13, 2011
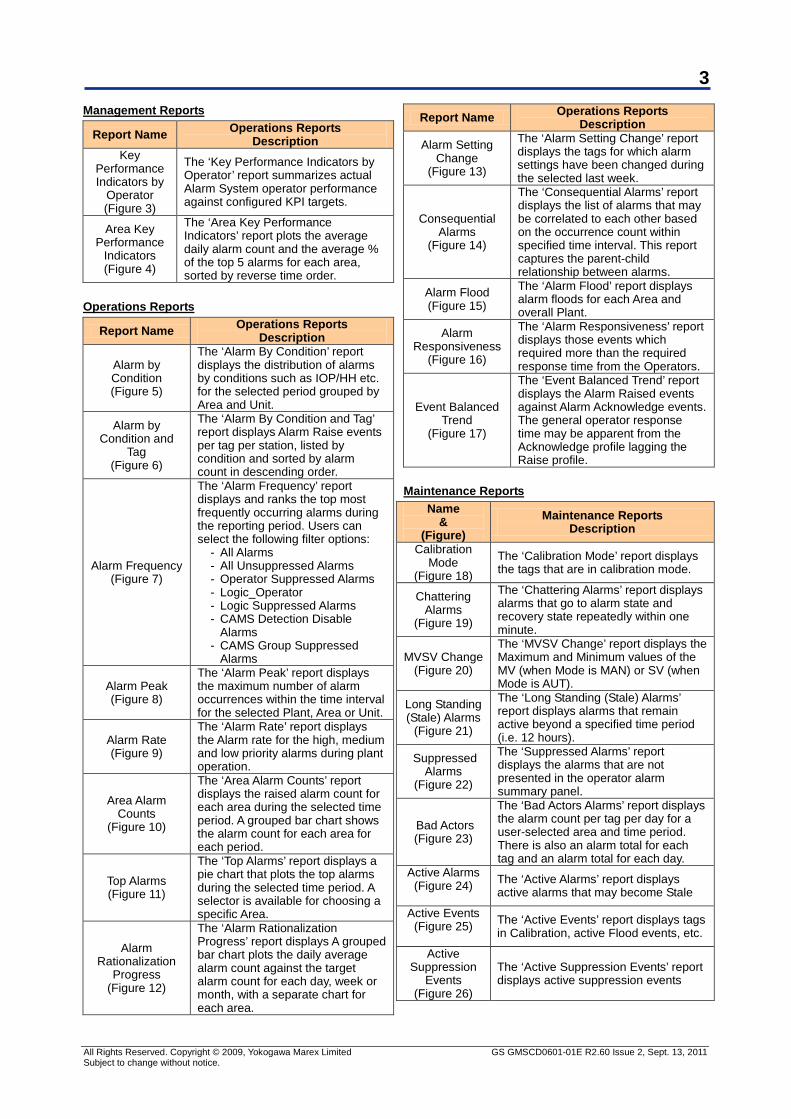
Management Reports
Report Name Operations Reports Description
Key Performance Indicators by
Operator (Figure 3)
The ‘Key Performance Indicators by Operator’ report summarizes actual Alarm System operator performance against configured KPI targets.
Area Key Performance
Indicators (Figure 4)
The ‘Area Key Performance Indicators’ report plots the average daily alarm count and the average % of the top 5 alarms for each area, sorted by reverse time order.
Operations Reports
Report Name Operations Reports Description
Alarm by Condition (Figure 5)
The ‘Alarm By Condition’ report displays the distribution of alarms by conditions such as IOP/HH etc. for the selected period grouped by Area and Unit.
Alarm by Condition and
Tag (Figure 6)
The ‘Alarm By Condition and Tag’ report displays Alarm Raise events per tag per station, listed by condition and sorted by alarm count in descending order.
Alarm Frequency (Figure 7)
The ‘Alarm Frequency’ report displays and ranks the top most frequently occurring alarms during the reporting period. Users can select the following filter options:
- All Alarms - All Unsuppressed Alarms - Operator Suppressed Alarms - Logic_Operator - Logic Suppressed Alarms - CAMS Detection Disable
Alarms - CAMS Group Suppressed
Alarms
Alarm Peak (Figure 8)
The ‘Alarm Peak’ report displays the maximum number of alarm occurrences within the time interval for the selected Plant, Area or Unit.
Alarm Rate (Figure 9)
The ‘Alarm Rate’ report displays the Alarm rate for the high, medium and low priority alarms during plant operation.
Area Alarm Counts
(Figure 10)
The ‘Area Alarm Counts’ report displays the raised alarm count for each area during the selected time period. A grouped bar chart shows the alarm count for each area for each period.
Top Alarms (Figure 11)
The ‘Top Alarms’ report displays a pie chart that plots the top alarms during the selected time period. A selector is available for choosing a specific Area.
Alarm Rationalization
Progress (Figure 12)
The ‘Alarm Rationalization Progress’ report displays A grouped bar chart plots the daily average alarm count against the target alarm count for each day, week or month, with a separate chart for each area.
Report Name Operations Reports Description
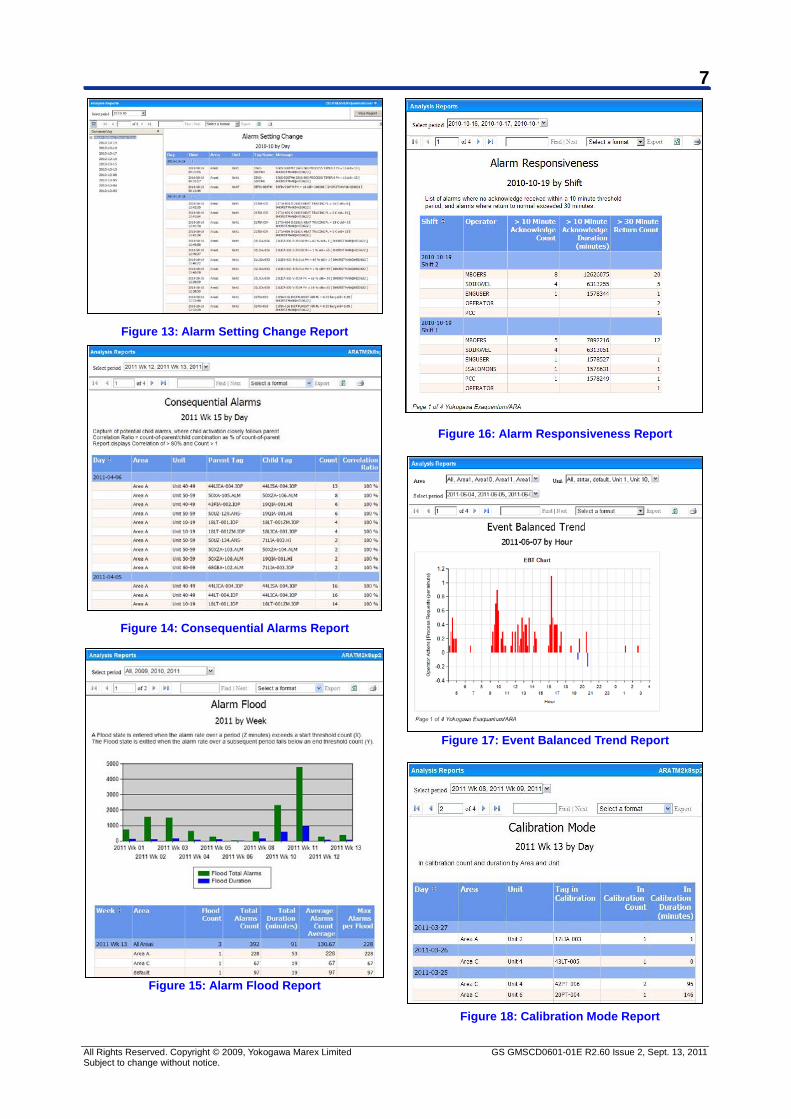
Alarm Setting Change
(Figure 13)
The ‘Alarm Setting Change’ report displays the tags for which alarm settings have been changed during the selected last week.
Consequential Alarms
(Figure 14)
The ‘Consequential Alarms’ report displays the list of alarms that may be correlated to each other based on the occurrence count within specified time interval. This report captures the parent-child relationship between alarms.
Alarm Flood (Figure 15)
The ‘Alarm Flood’ report displays alarm floods for each Area and overall Plant.
Alarm Responsiveness
(Figure 16)
The ‘Alarm Responsiveness’ report displays those events which required more than the required response time from the Operators.
Event Balanced Trend
(Figure 17)
The ‘Event Balanced Trend’ report displays the Alarm Raised events against Alarm Acknowledge events. The general operator response time may be apparent from the Acknowledge profile lagging the Raise profile.
Maintenance Reports
Name &
(Figure) Maintenance Reports
Description Calibration
Mode (Figure 18)
The ‘Calibration Mode’ report displays the tags that are in calibration mode.
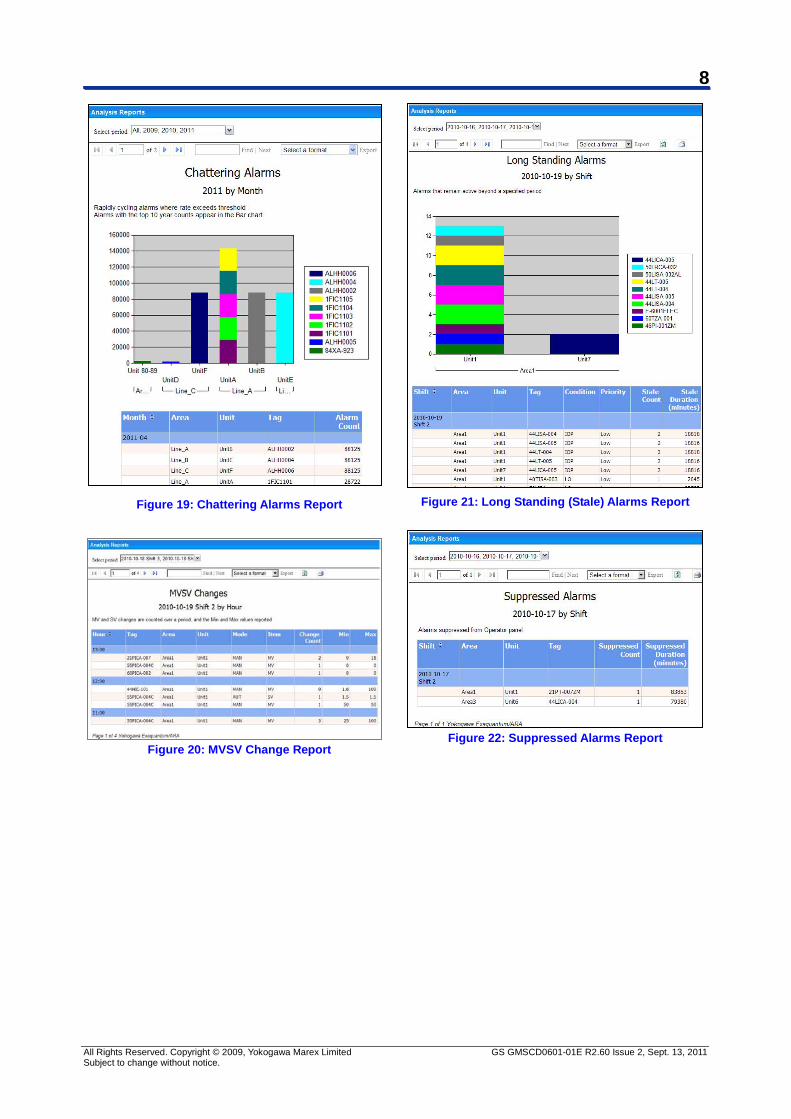
Chattering Alarms
(Figure 19)
The ‘Chattering Alarms’ report displays alarms that go to alarm state and recovery state repeatedly within one minute.
MVSV Change (Figure 20)
The ‘MVSV Change’ report displays the Maximum and Minimum values of the MV (when Mode is MAN) or SV (when Mode is AUT).
Long Standing (Stale) Alarms
(Figure 21)
The ‘Long Standing (Stale) Alarms’ report displays alarms that remain active beyond a specified time period (i.e. 12 hours).
Suppressed Alarms
(Figure 22)
The ‘Suppressed Alarms’ report displays the alarms that are not presented in the operator alarm summary panel.
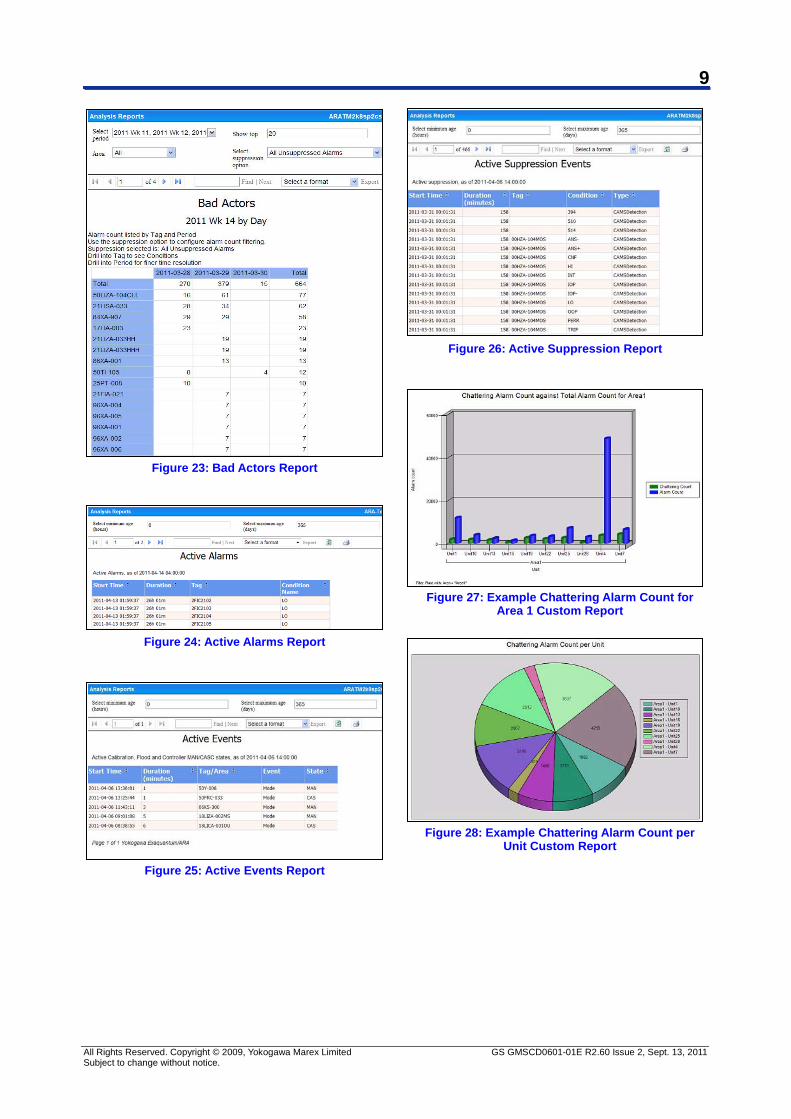
Bad Actors (Figure 23)
The ‘Bad Actors Alarms’ report displays the alarm count per tag per day for a user-selected area and time period. There is also an alarm total for each tag and an alarm total for each day.
Active Alarms (Figure 24)
The ‘Active Alarms’ report displays active alarms that may become Stale
Active Events (Figure 25)
The ‘Active Events’ report displays tags in Calibration, active Flood events, etc.
Active Suppression
Events (Figure 26)
The ‘Active Suppression Events’ report displays active suppression events
4
All Rights Reserved. Copyright © 2009, Yokogawa Marex Limited Subject to change without notice.
GS GMSCD0601-01E R2.60 Issue 2, Sept. 13, 2011
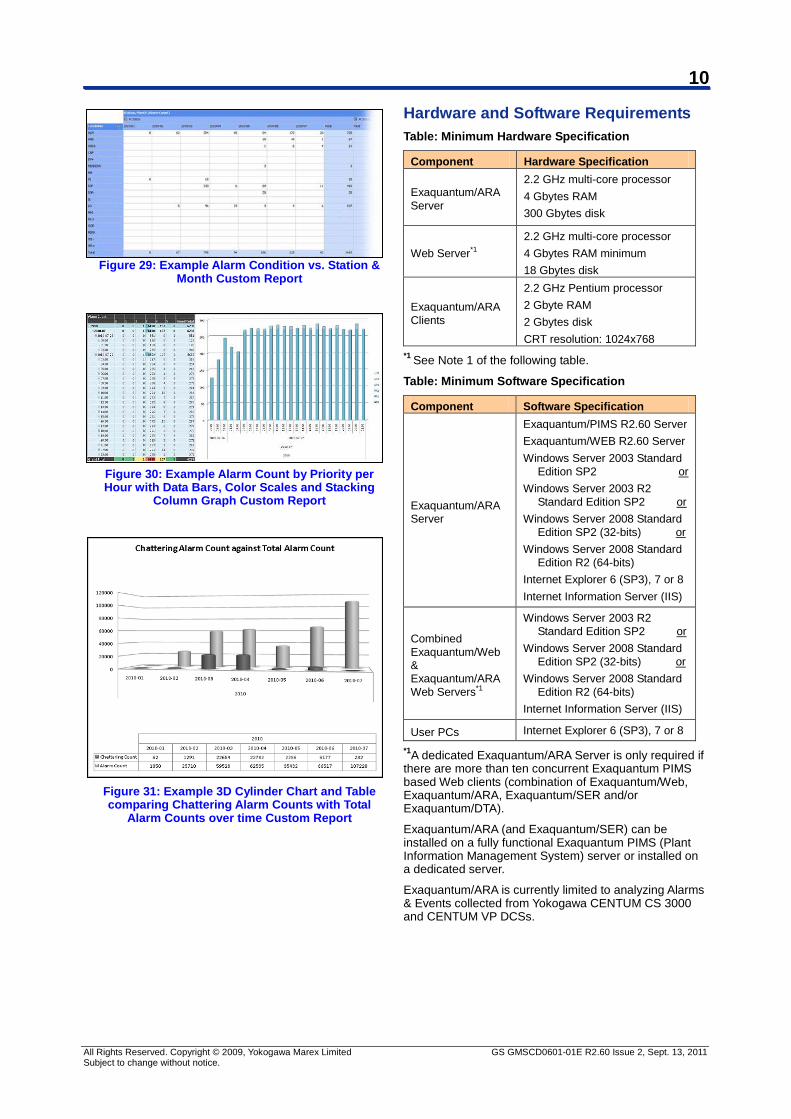
Custom Reports Custom reports can be created using Excel (users) or SQL Server Report Builder (administrator). Examples of typical administrator configured reports can be seen in Figures 27 – 31.
Benefits The benefits of integrating alarm & event messages from a control system(s) are significant. Some of the typical benefits are described below.
Improved Plant Operational Benefits Exaquantum/ARA provides operators with the ability to quickly evaluate abnormal events that will provide: Enhanced safety for plant personnel and reduction
or elimination of environmental damage by allowing alarms to be quickly analyzed by operators for faster action response to unsafe operating conditions
Quicker participation of the maintenance department to minimize the impact on plant operations
Reduction in the amount of plant damage, waste and low quality
Improvement opportunities provided by the Exaquantum/ARA KPI reports, such as the efficiency of each operator in dealing with alarms
Improved operator morale.
Business Benefits Exaquantum/ARA can provide a number of business benefits, including: Increased production, reduced waste and improved
quality Staffing levels (operations, maintenance, etc.) can
be streamlined as the number of Alarms & Events are reduced by having the information available to understand the causes
By having an effective and formalized Alarm Reporting and Analysis System, some insurance providers will reduce their premiums.
Web Based Report Viewing By making reports available as web pages, they are accessible from any networked PC via Microsoft Internet Explorer, eliminating the need for specific client software.
Integrated with Exaquantum/SER (Sequence of Events Recorder)
Exaquantum/ARA can be integrated with Exaquantum/SER (Sequence of Events Recorder). Exaquantum/SER extends the capability of operators in determining the cause of incidents and trips by allowing Alarms & Events to be analyzed. By having the ability to access both Exaquantum/ARA and Exaquantum/SER, operators can obtain, through the same Web based GUI interface, Alarm & Event information using two different techniques based on the same information. The Exaquantum/ARA reports are supplemented by Exaquantum/SER's ability to view and analyze the associated time series based Alarms & Events, time stamped to 1 millisecond. If a configured trip should occur then Alarms & Events and associated process information can be analyzed to examine the sequence of occurrence before and after the trip.
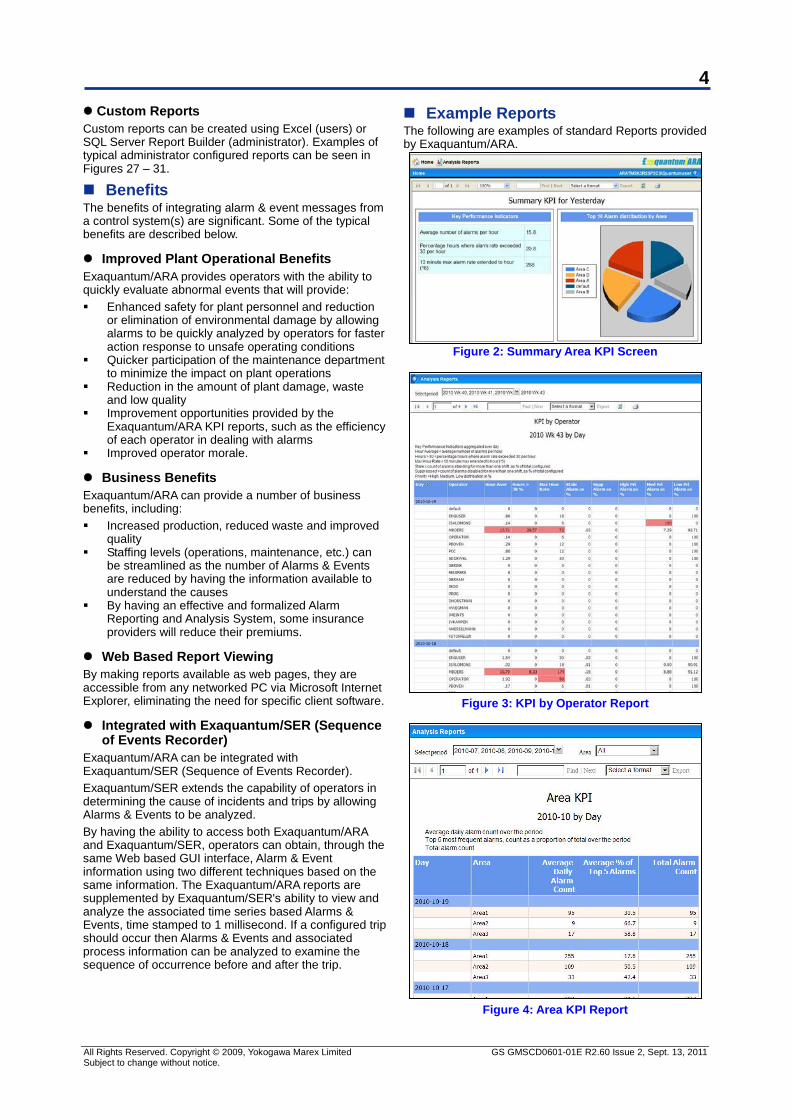
Example Reports The following are examples of standard Reports provided by Exaquantum/ARA.
Figure 2: Summary Area KPI Screen
Figure 3: KPI by Operator Report
Figure 4: Area KPI Report
5
All Rights Reserved. Copyright © 2009, Yokogawa Marex Limited Subject to change without notice.
GS GMSCD0601-01E R2.60 Issue 2, Sept. 13, 2011
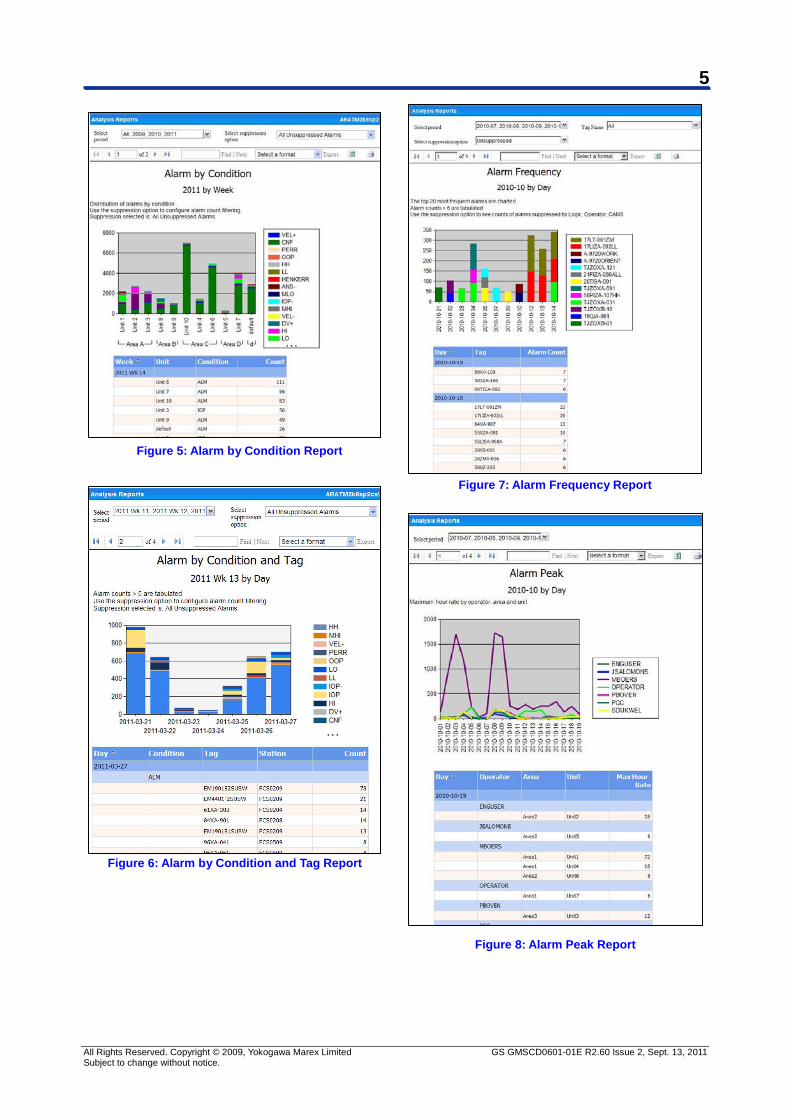
Figure 5: Alarm by Condition Report
Figure 6: Alarm by Condition and Tag Report
Figure 7: Alarm Frequency Report
Figure 8: Alarm Peak Report
6
All Rights Reserved. Copyright © 2009, Yokogawa Marex Limited Subject to change without notice.
GS GMSCD0601-01E R2.60 Issue 2, Sept. 13, 2011
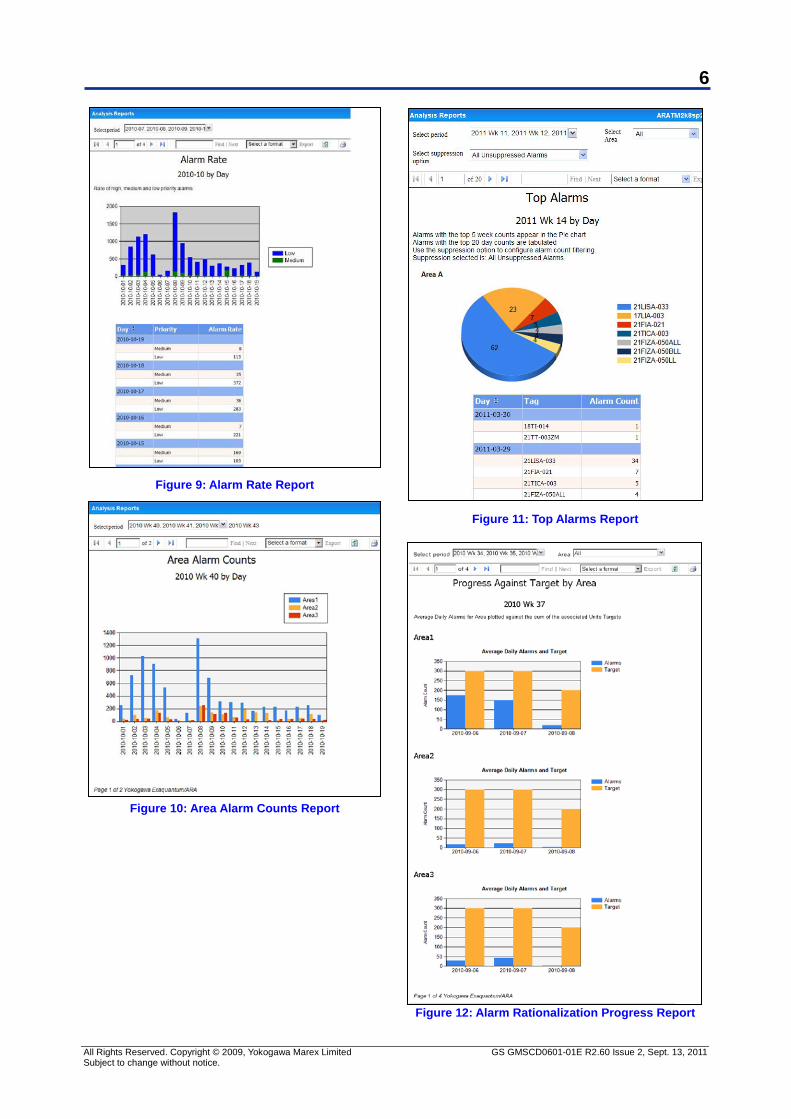
Figure 9: Alarm Rate Report
Figure 10: Area Alarm Counts Report
Figure 11: Top Alarms Report
Figure 12: Alarm Rationalization Progress Report
7
All Rights Reserved. Copyright © 2009, Yokogawa Marex Limited Subject to change without notice.
GS GMSCD0601-01E R2.60 Issue 2, Sept. 13, 2011
Figure 13: Alarm Setting Change Report
Figure 14: Consequential Alarms Report
Figure 15: Alarm Flood Report
Figure 16: Alarm Responsiveness Report
Figure 17: Event Balanced Trend Report
Figure 18: Calibration Mode Report
8
All Rights Reserved. Copyright © 2009, Yokogawa Marex Limited Subject to change without notice.
GS GMSCD0601-01E R2.60 Issue 2, Sept. 13, 2011
Figure 19: Chattering Alarms Report
Figure 20: MVSV Change Report
Figure 21: Long Standing (Stale) Alarms Report
Figure 22: Suppressed Alarms Report
9
All Rights Reserved. Copyright © 2009, Yokogawa Marex Limited Subject to change without notice.
GS GMSCD0601-01E R2.60 Issue 2, Sept. 13, 2011
Figure 23: Bad Actors Report
Figure 24: Active Alarms Report
Figure 25: Active Events Report
Figure 26: Active Suppression Report
Figure 27: Example Chattering Alarm Count for
Area 1 Custom Report
Figure 28: Example Chattering Alarm Count per
Unit Custom Report
10
All Rights Reserved. Copyright © 2009, Yokogawa Marex Limited Subject to change without notice.
GS GMSCD0601-01E R2.60 Issue 2, Sept. 13, 2011
Figure 29: Example Alarm Condition vs. Station &
Month Custom Report
Figure 30: Example Alarm Count by Priority per Hour with Data Bars, Color Scales and Stacking
Column Graph Custom Report
Figure 31: Example 3D Cylinder Chart and Table comparing Chattering Alarm Counts with Total
Alarm Counts over time Custom Report
Hardware and Software Requirements Table: Minimum Hardware Specification
Component Hardware Specification
Exaquantum/ARA Server
2.2 GHz multi-core processor 4 Gbytes RAM 300 Gbytes disk
Web Server*1 2.2 GHz multi-core processor 4 Gbytes RAM minimum 18 Gbytes disk
Exaquantum/ARA Clients
2.2 GHz Pentium processor 2 Gbyte RAM 2 Gbytes disk CRT resolution: 1024x768
*1 See Note 1 of the following table.
Table: Minimum Software Specification
Component Software Specification
Exaquantum/ARA Server
Exaquantum/PIMS R2.60 Server Exaquantum/WEB R2.60 Server Windows Server 2003 Standard
Edition SP2 or Windows Server 2003 R2
Standard Edition SP2 or Windows Server 2008 Standard
Edition SP2 (32-bits) or Windows Server 2008 Standard
Edition R2 (64-bits) Internet Explorer 6 (SP3), 7 or 8 Internet Information Server (IIS)
Combined Exaquantum/Web & Exaquantum/ARA Web Servers*1
Windows Server 2003 R2 Standard Edition SP2 or
Windows Server 2008 Standard Edition SP2 (32-bits) or
Windows Server 2008 Standard Edition R2 (64-bits)
Internet Information Server (IIS)
User PCs Internet Explorer 6 (SP3), 7 or 8
*1A dedicated Exaquantum/ARA Server is only required if there are more than ten concurrent Exaquantum PIMS based Web clients (combination of Exaquantum/Web, Exaquantum/ARA, Exaquantum/SER and/or Exaquantum/DTA).
Exaquantum/ARA (and Exaquantum/SER) can be installed on a fully functional Exaquantum PIMS (Plant Information Management System) server or installed on a dedicated server.
Exaquantum/ARA is currently limited to analyzing Alarms & Events collected from Yokogawa CENTUM CS 3000 and CENTUM VP DCSs.
11
All Rights Reserved. Copyright © 2009, Yokogawa Marex Limited Subject to change without notice.
GS GMSCD0601-01E R2.60 Issue 2, Sept. 13, 2011
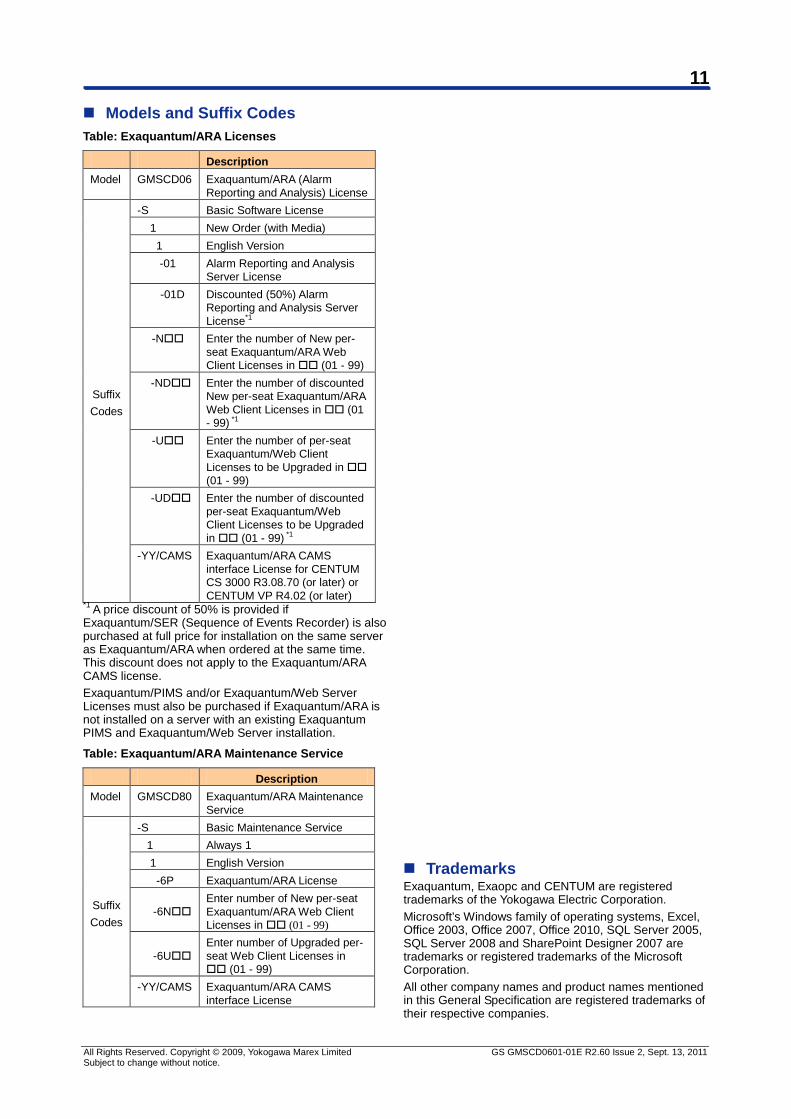
Models and Suffix Codes Table: Exaquantum/ARA Licenses
Description Model GMSCD06 Exaquantum/ARA (Alarm
Reporting and Analysis) License
Suffix Codes
-S Basic Software License 1 New Order (with Media) 1 English Version
-01 Alarm Reporting and Analysis Server License
-01D Discounted (50%) Alarm Reporting and Analysis Server License*1
-N Enter the number of New per-seat Exaquantum/ARA Web Client Licenses in (01 - 99)
-ND Enter the number of discounted New per-seat Exaquantum/ARA Web Client Licenses in (01 - 99) *1
-U Enter the number of per-seat Exaquantum/Web Client Licenses to be Upgraded in (01 - 99)
-UD Enter the number of discounted per-seat Exaquantum/Web Client Licenses to be Upgraded in (01 - 99) *1
-YY/CAMS Exaquantum/ARA CAMS interface License for CENTUM CS 3000 R3.08.70 (or later) or CENTUM VP R4.02 (or later)
*1 A price discount of 50% is provided if Exaquantum/SER (Sequence of Events Recorder) is also purchased at full price for installation on the same server as Exaquantum/ARA when ordered at the same time. This discount does not apply to the Exaquantum/ARA CAMS license. Exaquantum/PIMS and/or Exaquantum/Web Server Licenses must also be purchased if Exaquantum/ARA is not installed on a server with an existing Exaquantum PIMS and Exaquantum/Web Server installation.
Table: Exaquantum/ARA Maintenance Service
Description Model GMSCD80 Exaquantum/ARA Maintenance
Service
Suffix Codes
-S Basic Maintenance Service 1 Always 1 1 English Version -6P Exaquantum/ARA License
-6N Enter number of New per-seat Exaquantum/ARA Web Client Licenses in (01 - 99)
-6U Enter number of Upgraded per-seat Web Client Licenses in (01 - 99)
-YY/CAMS Exaquantum/ARA CAMS interface License
Trademarks Exaquantum, Exaopc and CENTUM are registered trademarks of the Yokogawa Electric Corporation. Microsoft’s Windows family of operating systems, Excel, Office 2003, Office 2007, Office 2010, SQL Server 2005, SQL Server 2008 and SharePoint Designer 2007 are trademarks or registered trademarks of the Microsoft Corporation. All other company names and product names mentioned in this General Specification are registered trademarks of their respective companies.