Embed Size (px)
Citation preview
Examining the Impacts of Wildfire on Throughfall andStemflow Chemistry and Flux at Plot and Catchment Scales
Item Type text; Electronic Thesis
Authors White, Alissa Marie
Publisher The University of Arizona.
Rights Copyright © is held by the author. Digital access to this materialis made possible by the University Libraries, University of Arizona.Further transmission, reproduction or presentation (such aspublic display or performance) of protected items is prohibitedexcept with permission of the author.
Download date 21/08/2018 11:02:35
Link to Item http://hdl.handle.net/10150/595818
EXAMINING THE IMPACTS OF WILDFIRE ON THROUGHFALL AND STEMFLOW
CHEMISTRY AND FLUX AT PLOT AND CATCHMENT SCALES
by
Alissa White
____________________________
A Thesis Submitted to the Faculty of the
DEPARTMENT OF HYDROLOGY AND WATER RESOURCES
In Partial Fulfillment of the Requirements
For the Degree of
MASTER OF SCIENCE
WITH A MAJOR IN HYDROLOGY
In the Graduate College
THE UNIVERSITY OF ARIZONA
2015
2
STATEMENT BY AUTHOR
The thesis titled Examining the Impacts of Wildfire on Throughfall and Stemflow
Chemistry and Flux at Plot and Catchment Scales prepared by Alissa White has been submitted
in partial fulfillment of requirements for a master’s degree at the University of Arizona and is
deposited in the University Library to be made available to borrowers under rules of the Library.
Brief quotations from this thesis are allowable without special permission, provided
that an accurate acknowledgement of the source is made. Requests for permission for
extended quotation from or reproduction of this manuscript in whole or in part may be
granted by the head of the major department or the Dean of the Graduate College when in
his or her judgment the proposed use of the material is in the interests of scholarship. In all
other instances, however, permission must be obtained from the author.
SIGNED: Alissa White
APPROVAL BY THESIS DIRECTOR
This thesis has been approved on the date shown below:
December 7, 2015
Jennifer McIntosh Date
Associate Professor of Hydrology

3
ACKNOWLEDGEMENTS
This study was supported by the National Science Foundation funded Jemez River Basin
and Santa Catalina Mountains Critical Zone Observatory EAR-0724958 and EAR-1331408. I
would like to thank my thesis advisors Drs. Jennifer McIntosh and Jon Chorover and my
committee members Drs. Tom Meixner and Paul Brooks for their guidance and valuable input. I
am also very grateful to Tyson Swetnam for help with the canopy height model, Rodrigo Andres
Sanchez, Mark Losleben, and Kate Condon for help with fieldwork and sample collection, and
Matej Durcik for help creating maps.
4
TABLE OF CONTENTS
LIST OF FIGURES………………………………………………………………………... 5
LIST OF TABLES………………………………………………………………………….6
ABSTRACT………………………………………………………………………………...7
1.0 INTRODUCTION………………………………………………………………………9
2.0 BACKGROUND………………………………………………………………………..11
3.0 METHODS……………………………………………………………………………...14
3.1 Site Description……………………………………………………………....….14
3.2 Experimental Design…………………………………………………………….16
3.3 Sample Collection and Analysis…………………………………………………18
3.4 Data Analysis and Upscaling Solute Fluxes……………………………………..19
4.0 RESULTS………………………………………………………………………………..23
4.1 Volumetric Changes……………………………………………………………..23
4.2 Chemical Composition…………………………………………………………..24
4.2.1 Burned versus Unburned………………………………………………24
4.2.2 Stemflow versus Throughfall………………………………………….25
4.2.3 Solute Fluxes…………………………………………………………..26
5.0 DISCUSSION…………………………………………………………………………...28
6.0 CONCLUSION.………………………………………………………………………....33
7.0 FIGURES and TABLES………………………………………………………………...34
8.0 REFERENCES…………………………………………………………………………..46
9.0 SUPPLEMENTAL MATERIALS………………………………………………………51
9.1 Supplemental Figures and Tables………………………………………………..51
5
LIST OF FIGURES
Figure 1: Conceptual Model…………………………………………………………………..…34
Figure 2: Overview of study area……………………………………………..……………….....35
Figure 3: Burned, unburned, and open precipitation plots…………………….…………………36
Figure 4: Stemflow and throughfall volumes combined...…………………….…………………37
Figure 5: Stemflow and throughfall volumes by catchment…………………….……………….38
Figure 6: Ca and Sr volume weighted mean concentrations…………………….……………….39
Figure 7: PO4 and DIC volume weighted mean concentrations………………….……………...40
Figure 8: Burned and unburned throughfall volume weighted mean concentrations……………41
Figure 9: Burned stemflow and throughfall volume weighted mean concentrations……………42
Supplemental Figure 1: Stemflow and throughfall collectors…………………………………...49

6
LIST OF TABLES
Table 1: Solute Fluxes…………………………………………………………………………..44
Supplemental Table 1: Surface area solute flux calculations…………………………………...50
7
ABSTRACT
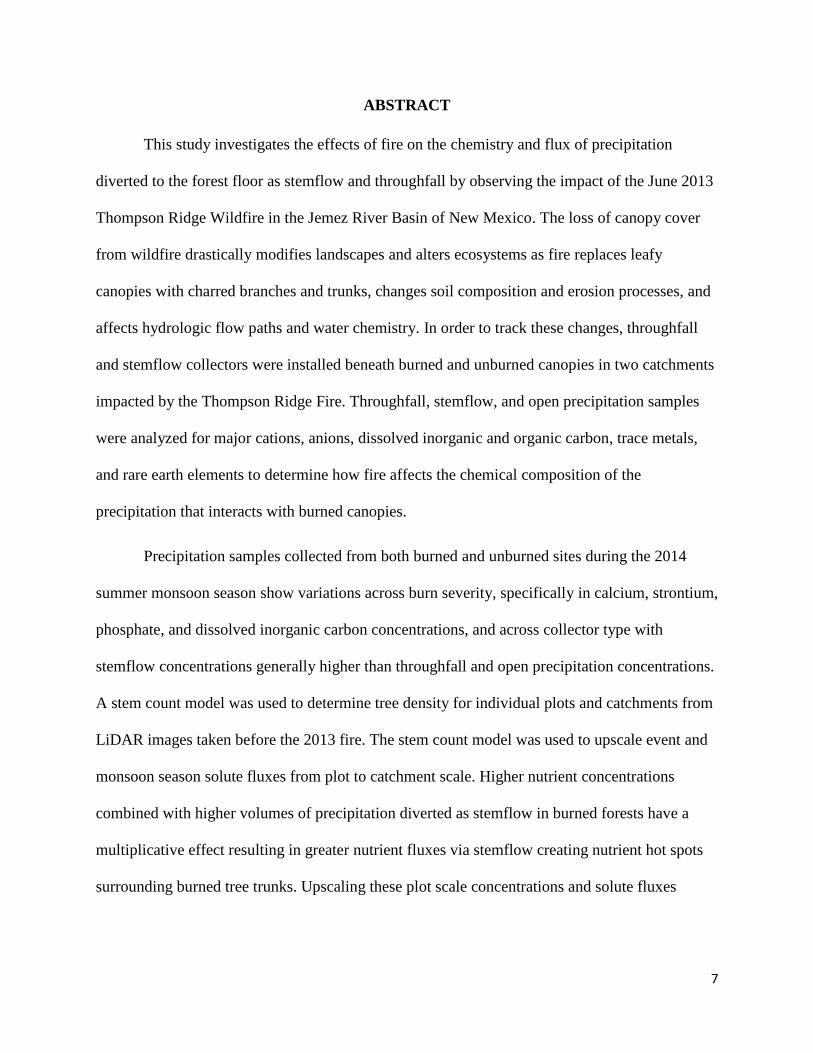
This study investigates the effects of fire on the chemistry and flux of precipitation
diverted to the forest floor as stemflow and throughfall by observing the impact of the June 2013
Thompson Ridge Wildfire in the Jemez River Basin of New Mexico. The loss of canopy cover
from wildfire drastically modifies landscapes and alters ecosystems as fire replaces leafy
canopies with charred branches and trunks, changes soil composition and erosion processes, and
affects hydrologic flow paths and water chemistry. In order to track these changes, throughfall
and stemflow collectors were installed beneath burned and unburned canopies in two catchments
impacted by the Thompson Ridge Fire. Throughfall, stemflow, and open precipitation samples
were analyzed for major cations, anions, dissolved inorganic and organic carbon, trace metals,
and rare earth elements to determine how fire affects the chemical composition of the
precipitation that interacts with burned canopies.
Precipitation samples collected from both burned and unburned sites during the 2014
summer monsoon season show variations across burn severity, specifically in calcium, strontium,
phosphate, and dissolved inorganic carbon concentrations, and across collector type with
stemflow concentrations generally higher than throughfall and open precipitation concentrations.
A stem count model was used to determine tree density for individual plots and catchments from
LiDAR images taken before the 2013 fire. The stem count model was used to upscale event and
monsoon season solute fluxes from plot to catchment scale. Higher nutrient concentrations
combined with higher volumes of precipitation diverted as stemflow in burned forests have a
multiplicative effect resulting in greater nutrient fluxes via stemflow creating nutrient hot spots
surrounding burned tree trunks. Upscaling these plot scale concentrations and solute fluxes

8
allows this study to represent changes to an entire catchment and quantify effects of wildfire on
chemical loads and water chemistry.
9
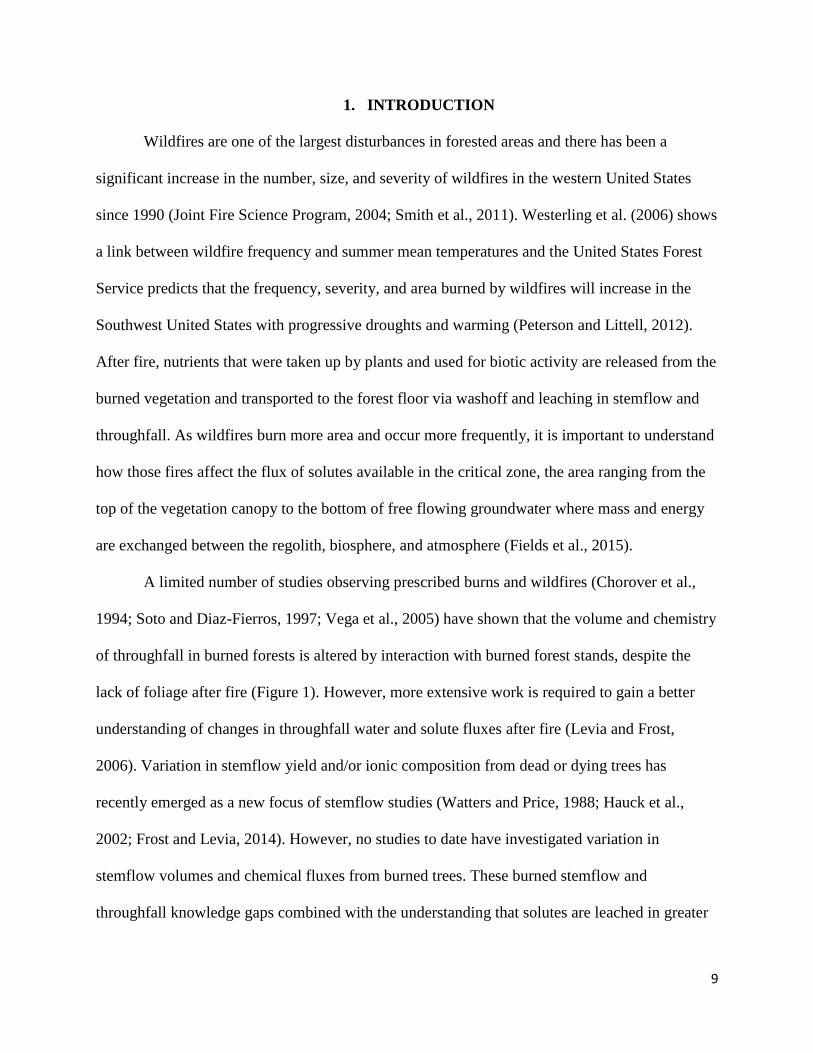
1. INTRODUCTION
Wildfires are one of the largest disturbances in forested areas and there has been a
significant increase in the number, size, and severity of wildfires in the western United States
since 1990 (Joint Fire Science Program, 2004; Smith et al., 2011). Westerling et al. (2006) shows
a link between wildfire frequency and summer mean temperatures and the United States Forest
Service predicts that the frequency, severity, and area burned by wildfires will increase in the
Southwest United States with progressive droughts and warming (Peterson and Littell, 2012).
After fire, nutrients that were taken up by plants and used for biotic activity are released from the
burned vegetation and transported to the forest floor via washoff and leaching in stemflow and
throughfall. As wildfires burn more area and occur more frequently, it is important to understand
how those fires affect the flux of solutes available in the critical zone, the area ranging from the
top of the vegetation canopy to the bottom of free flowing groundwater where mass and energy
are exchanged between the regolith, biosphere, and atmosphere (Fields et al., 2015).
A limited number of studies observing prescribed burns and wildfires (Chorover et al.,
1994; Soto and Diaz-Fierros, 1997; Vega et al., 2005) have shown that the volume and chemistry
of throughfall in burned forests is altered by interaction with burned forest stands, despite the
lack of foliage after fire (Figure 1). However, more extensive work is required to gain a better
understanding of changes in throughfall water and solute fluxes after fire (Levia and Frost,
2006). Variation in stemflow yield and/or ionic composition from dead or dying trees has
recently emerged as a new focus of stemflow studies (Watters and Price, 1988; Hauck et al.,
2002; Frost and Levia, 2014). However, no studies to date have investigated variation in
stemflow volumes and chemical fluxes from burned trees. These burned stemflow and
throughfall knowledge gaps combined with the understanding that solutes are leached in greater

10
concentrations from stemflow than throughfall (Levia and Frost, 2003; Germer et al., 2012) and
recent findings suggesting that standing dead trees can persist in forests for decades (Aakala et
al., 2008; Angers et al., 2010) motivate this study.
In order to inform our understanding of wildfire induced tree mortality on nutrient
availability via stemflow and throughfall this study seeks to answer the following questions: 1)
How do forest fires change the volumetric partitioning of precipitation in burned forest stands?
2) How are the solutes that leach from burned forests different from the solutes leached from
unburned forests? And 3) Based on differences in volume and solute concentration, how does
wildfire affect the fluxes of those solutes to the critical zone? In order to address these questions,
this study observes the effects of wildfire on the chemistry and flux of stemflow and throughfall
at plot and catchment scales.
11
2. BACKGROUND
Throughfall refers to the precipitation that interacts with the forest canopy before falling
to the forest floor. Stemflow refers to the precipitation that is funneled down tree stems and
trunks before reaching the forest floor. In this study, leaching during throughfall and stemflow
refers both to washoff of exogenous elements and release of endogenous soluble elements. In an
extensive review of the throughfall literature, Levia and Frost (2003 and 2006) demonstrated that
throughfall water and solute inputs are highly variable and may change temporally and spatially
as a function of latitude, seasonality, precipitation event magnitude, event intensity, event
duration, wind speed and direction during precipitation events, vegetation cover, plant species,
canopy structure, plant area index, and interception storage. Levia and Frost (2003) and Levia
and Germer (2015) also showed in stemflow literature reviews that stemflow water and solute
inputs vary across sites, tree species, meteorological conditions, canopy structure, seasonality,
and precipitation events. Due to the wide range of variability in stemflow and throughfall fluxes,
it is important to note that this study focuses solely on differences in stemflow and throughfall
water and solute fluxes due to wildfire. Therefore, it is assumed that tree size and canopy
structure do not vary significantly within catchments and that meteorological conditions are
consistent throughout the monsoon season over which samples were collected.
It is understood that the chemistry of throughfall and stemflow are different from that of
open precipitation in live forest stands (Parker, 1983; Pyatt, 1992; Li et al., 1997; Levia and
Frost, 2003; Levia and Frost, 2006; Germer et al., 2007; Zimmermann et al., 2008; Germer et al.,
2012; Levia and Germer, 2015). Throughfall chemistry is commonly enriched in dissolved
organic carbon (DOC), K+, Ca2+, Mg2+, Na+, and Cl- compared to open precipitation chemistry as
solutes are leached from live canopies (Parker, 1983; Li et al., 1997; Levia and Frost, 2006) and
12
may be depleted in NH4+ and NO3
- relative to open precipitation chemistry as N is taken up and
used by plants (Li et al., 1997). Stemflow chemistry is often enriched in K+, Cl-, NO3-, and Ca2+
compared to the chemistry of open precipitation as solutes are leached from stems and trunks
(Parker, 1983; Pyatt, 1992; Levia and Frost, 2003; Germer et al., 2012; Levia and Germer, 2015).
Stemflow nutrient deposition is typically more concentrated than throughfall and open
precipitation because of the longer contact time of precipitation over stems and trunks (Levia and
Frost, 2006). Stemflow deposition is also localized to a relatively small area encircling the tree’s
trunk producing hot spots of greater nutrient availability extending from and surrounding
individual trees (Levia and Germer, 2015) while throughfall contributes to the creation of
heterogeneous nutrient pools across forests. Parker (1983) discusses the importance of nutrient
recycling via the uptake and release of nutrients in forests. He stresses the central role that
stemflow and throughfall have in nutrient recycling as a major pathway of solutes, specifically
N, P, K+, Ca2+, Mg2+, and Mn, to the forest floor.
Limiting nutrients such as N and P are commonly taken up by plants for biotic use. Nezat
et al. (2010) suggest that Ca2+ may also become a limiting nutrient for vegetation. After tree
death, in the absence of biotic activity, these nutrients are released to the forest floor via leaching
from stemflow and throughfall. Watters and Price (1988) suggested that stemflow from standing
dead trees may contribute a very significant transfer of PO43- and NO3
- to the forest floor and
greatly affect nutrient availability. The release of macronutrients like P and Ca2+ from burned
trees via stemflow and throughfall may help to replenish the nutrient pool and may create
nutrient stores in the absence of live, healthy plants.
In an effort to examine wildfires as a disturbance affecting hydrologic and chemical
fluxes and storage dynamics (Ebel and Mirus, 2014), this study observes wildfire’s effects one
13
year after containment of the Thompson Ridge Fire in the Valles Caldera National Preserve
located in northern New Mexico. Therefore, this study is more indicative of continuing changes
to nutrient load and release of lithogenic elements from biomass combustion than immediate
wildfire effects. Chorover et al. (1994) found that concentrations of bivalent cations, such as
Ca2+ and Mg2+ in soil solutions remained elevated over longer periods of time after fire
compared to highly mobile monovalent cations like K+, NH4+, and Na+ because of their higher
affinity for adsorptive retention on ion exchange sites. Therefore, leaching of major monovalent
cations likely occurred immediately after fire and cannot be wholly accounted for in this study.
This study also focuses solely on precipitation in the form of rain during the North American
Monsoon season and examines the nutrient load and release of lithogenic elements mobilized
from those intense storms.
14
3. METHODS
3.1 Site Description
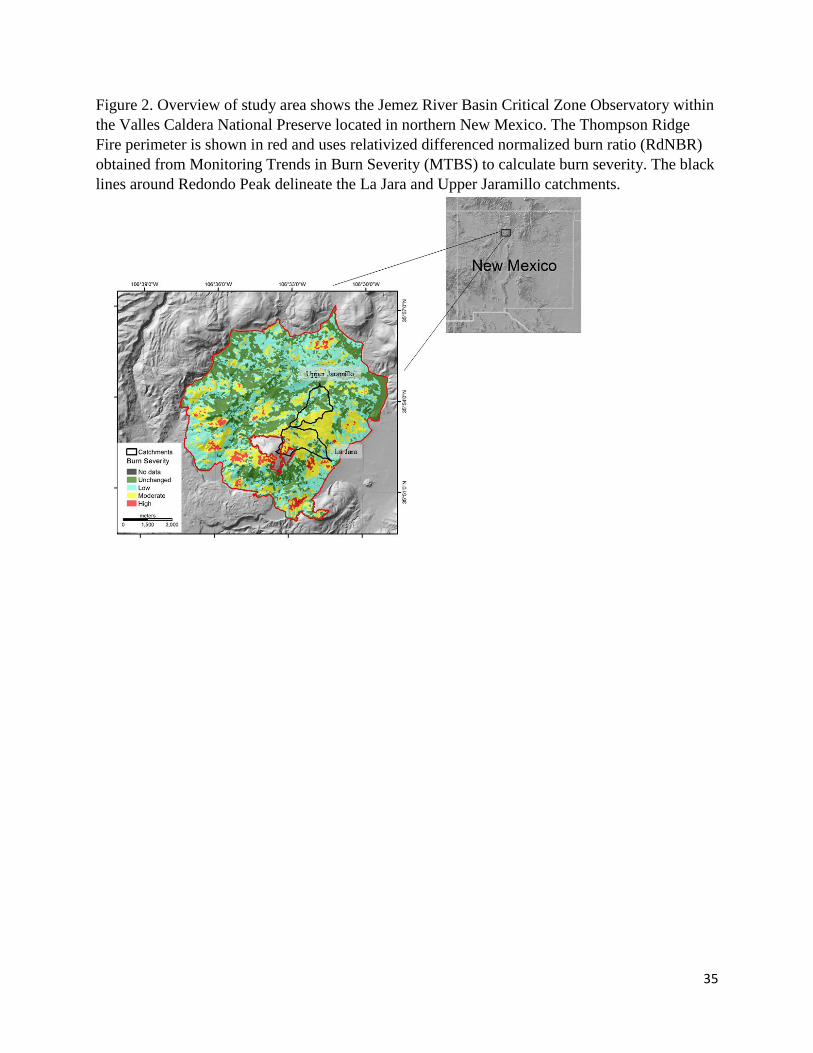
This study focuses on the effects of the Thompson Ridge Fire (Figure 2) which burned
approximately 24,000 acres around Redondo Peak within the Valles Caldera National Preserve
(VCNP) during June 2013 (Lujan, 2013). The preserve is located in the Jemez Mountains in
northern New Mexico northwest of Albuquerque. Redondo Peak stands at an elevation of 3,432
m and is the site of the Jemez River Basin Critical Zone Observatory (JRB-CZO) which has been
characterized in previous studies (Broxton et al., 2009; Perdrial et al., 2014; Swetnam and Falk,
2014; Vazquez-Ortega et al., 2015; Zapata-Rios et al., 2015). This region is located in the
transition zone between the snow dominated Rocky Mountains and the monsoon dominated
deserts of the southwestern United States (Broxton et al., 2009; Huckle, In Review). The VCNP
is in a montane, continental, semi-arid climate characterized by a bimodal precipitation pattern.
The average annual precipitation is 711 mm, of which approximately half falls as snow and rain
during the winter months and the other half falls as brief but intense rainfall associated with the
North American Monsoons during the summer months. The average summer and winter
temperatures are 10.7oC and -1.1oC, respectively (Zapata-Rios et al., 2015). The geology of
Redondo Peak is dominated by Pleistocene aged Bandelier Tuff, rhyolite, and andesitic rocks
(Broxton et al., 2009; Vazquez-Ortega et al., 2015).
Redondo peak is surrounded by multiple catchments and this study focuses on two
catchments of different aspect, north facing Upper Jaramillo and south facing La Jara (Figure 2).
Both catchments have similar mean slopes and are situated at similar elevations with Upper
Jaramillo catchment ranging in elevation from 2,723 to 3,324 m with a mean slope of 14.7o and
La Jara catchment ranging in elevation from 2,702 to 3,429 m with a mean slope of 15.7o. Upper
15
Jaramillo catchment drains an area of 3.06 km2 while La Jara catchment drains an area of 2.66
km2. Upper Jaramillo catchment has 46% forest cover while La Jara catchment has 57% forest
cover (Perdrial et al., 2014). Both catchments include mixed-conifer forests dominated by a
range of fir and spruce species including blue spruce (Picea pungens), Douglas fir (Pseudotsuga
menziesii), white fir (Abies concolor), and Engelmann spruce (Picea engelmannii) (Muldavin et
al., 2006; Broxton et al., 2009; Perdrial et al., 2014; Swetnam et al., 2014).
The Thompson Ridge Wildfire began May 31, 2013 when a tree collapsed into a power
line in Sulfur Canyon. The fire burned up and over Thompson Ridge before ascending the
western slope of Redondo Mountain where it progressed eastward just short of the boundary of
the 2011 Las Conchas Fire perimeter at the Valles Grande. It burned about 24,000 acres before
its containment July 1, 2013 (Lujan, 2013). According to the relativized differenced normalized
burn ratio (RdNBR) obtained from Monitoring Trends in Burn Severity, the burn severity of the
Thompson Ridge Fire varied throughout the VC (Figure 2; MTBS). According to the Burned
Area Emergency Response Assessment completed immediately after the fire’s containment, 74%
of land within the fire perimeter was classified as unburned or low severity burn, 23% was
classified as moderately burned, and 3% was noted as severely burned (Lujan, 2013).
16
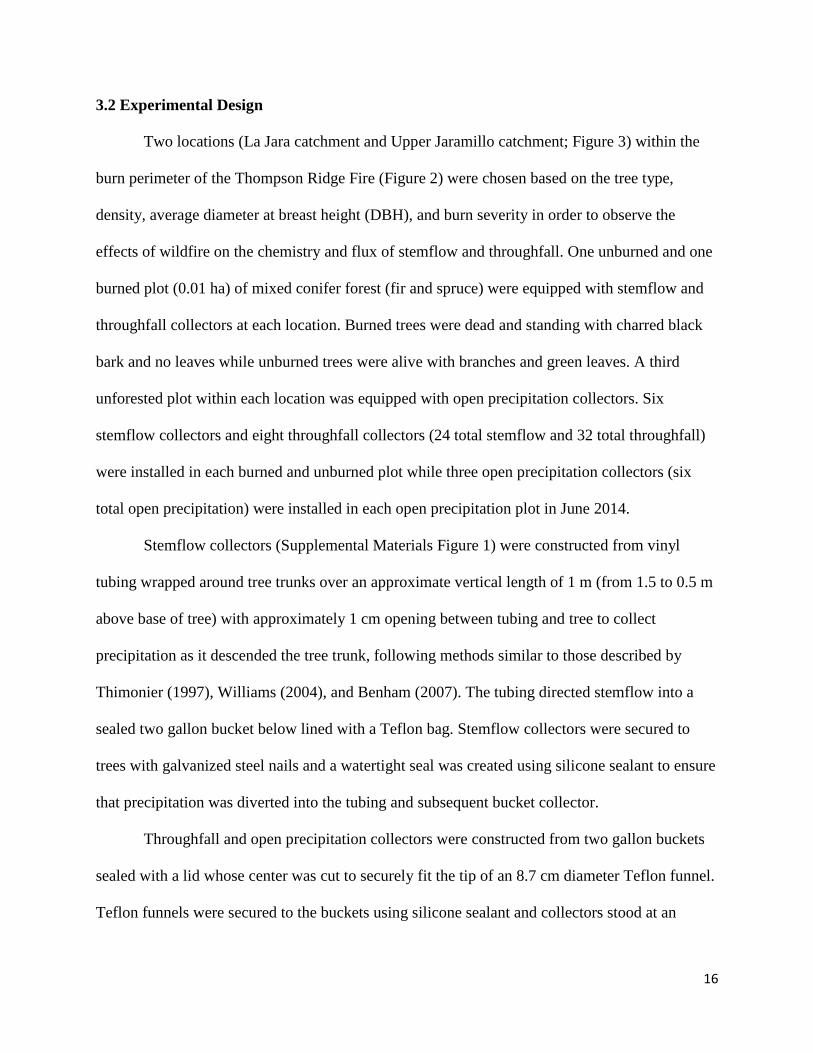
3.2 Experimental Design
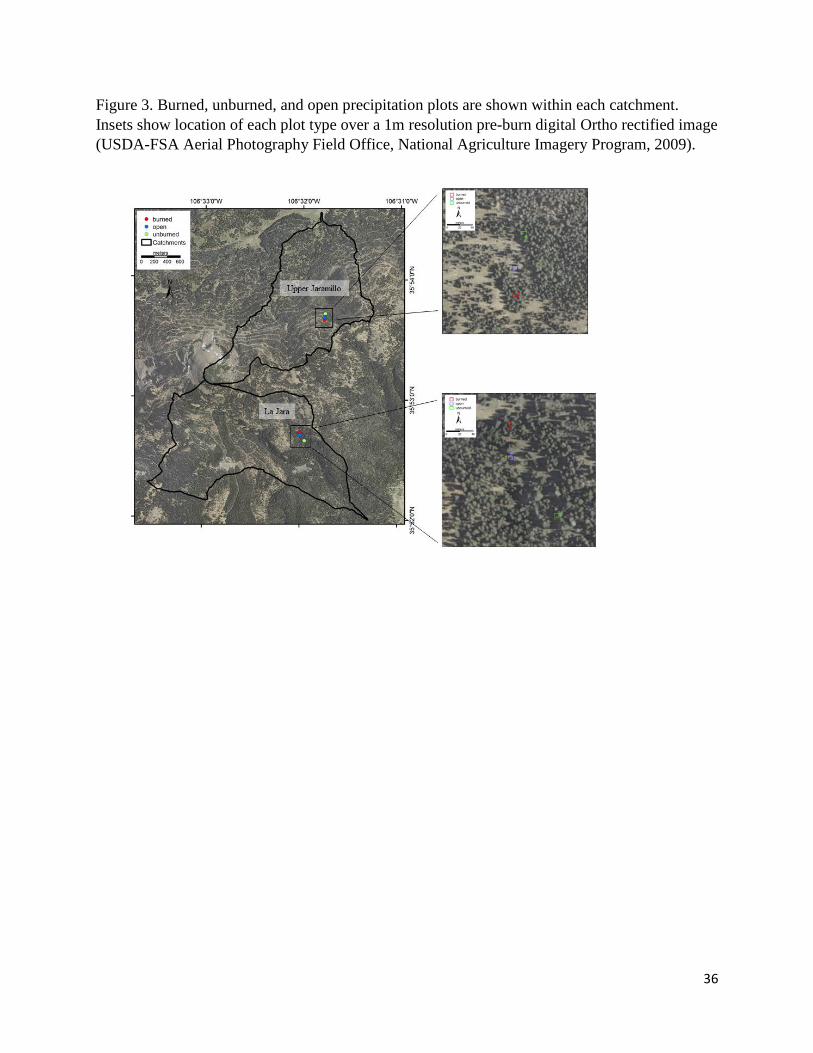
Two locations (La Jara catchment and Upper Jaramillo catchment; Figure 3) within the
burn perimeter of the Thompson Ridge Fire (Figure 2) were chosen based on the tree type,
density, average diameter at breast height (DBH), and burn severity in order to observe the
effects of wildfire on the chemistry and flux of stemflow and throughfall. One unburned and one
burned plot (0.01 ha) of mixed conifer forest (fir and spruce) were equipped with stemflow and
throughfall collectors at each location. Burned trees were dead and standing with charred black
bark and no leaves while unburned trees were alive with branches and green leaves. A third
unforested plot within each location was equipped with open precipitation collectors. Six
stemflow collectors and eight throughfall collectors (24 total stemflow and 32 total throughfall)
were installed in each burned and unburned plot while three open precipitation collectors (six
total open precipitation) were installed in each open precipitation plot in June 2014.
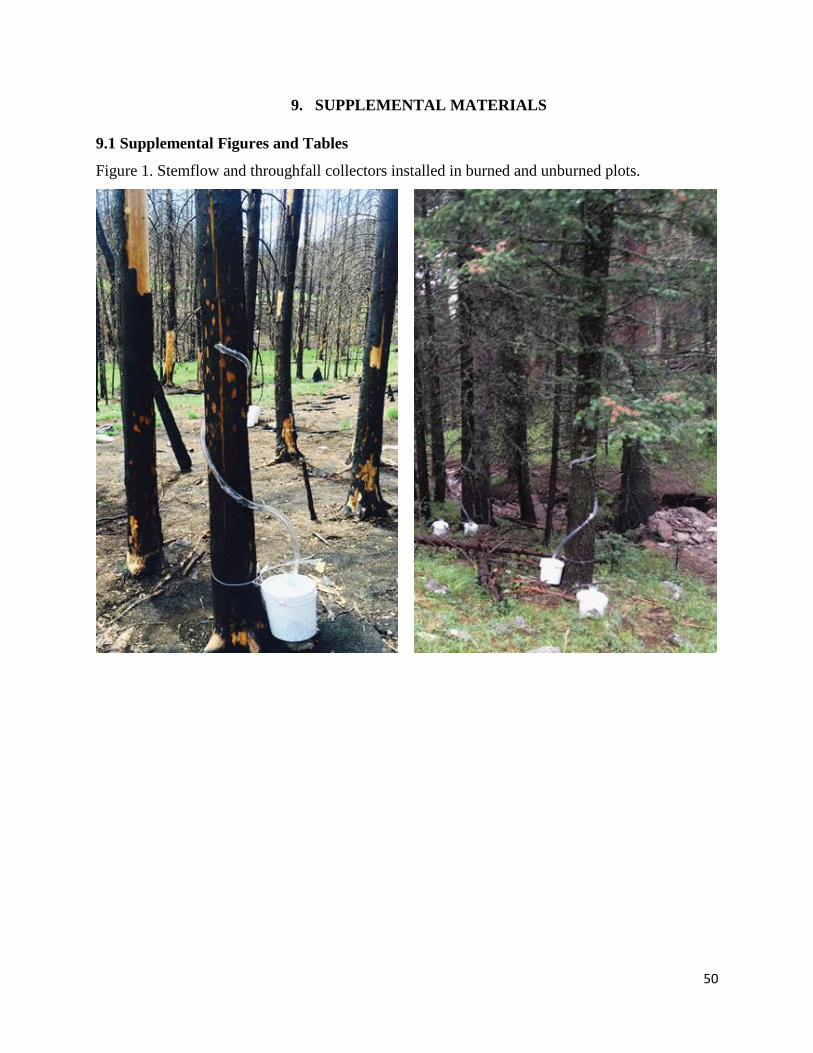
Stemflow collectors (Supplemental Materials Figure 1) were constructed from vinyl
tubing wrapped around tree trunks over an approximate vertical length of 1 m (from 1.5 to 0.5 m
above base of tree) with approximately 1 cm opening between tubing and tree to collect
precipitation as it descended the tree trunk, following methods similar to those described by
Thimonier (1997), Williams (2004), and Benham (2007). The tubing directed stemflow into a
sealed two gallon bucket below lined with a Teflon bag. Stemflow collectors were secured to
trees with galvanized steel nails and a watertight seal was created using silicone sealant to ensure
that precipitation was diverted into the tubing and subsequent bucket collector.
Throughfall and open precipitation collectors were constructed from two gallon buckets
sealed with a lid whose center was cut to securely fit the tip of an 8.7 cm diameter Teflon funnel.
Teflon funnels were secured to the buckets using silicone sealant and collectors stood at an
17
approximate height of 0.4 m above the ground surface. Open precipitation collectors were
situated in a clearing away from trees at a distance of at least twice the height of the surrounding
forest. Throughfall collectors were situated beneath the tree dripline, approximately 1 m from the
base of tree to provide consistent measurements across burned and unburned plots (Supplemental
Materials Figure 1). Cardinal directions of collector placement relative to tree base varies.
Throughfall and stemflow collectors were randomly spaced in fixed locations on and around
trees representative of the whole plot.
18
3.3 Sample Collection and Analysis
Precipitation samples were collected on an individual storm event basis. Fresh Teflon
bags were placed in buckets before monsoon storm events and immediately removed the
subsequent day. Samples were collected from four summer 2014 monsoon storm events, two
early in the monsoon season and two late in the monsoon season. Precipitation samples were
combined by collector type on an event basis due to volume constraints of chemical analysis.
Therefore, eight samples of each collector type (stemflow, throughfall, and open precipitation)
were collected during the span of this study.
Samples were packed on ice and shipped back to the University of Arizona where they
were stored at 4oC in their respective Teflon bags until prompt filtration and analysis. Samples
were weighed using a mass balance before filtration to determine the total volume collected from
each collector type at each plot on an event basis. Samples were filtered for anion, cation, trace
metal, and rare earth element concentrations through 0.45 µm nylon filters and cation splits were
acidified with optima grade concentrated nitric acid. Samples used for dissolved organic carbon
(DOC), dissolved inorganic carbon (DIC), and total dissolved nitrogen (TDN) analyses were
filtered through combusted 0.7 µm glass fiber filters. Cation, trace metal, and rare earth element
concentrations were measured on an inductively coupled plasma mass spectrometer (ICP-MS)
(ELAN DRC-II, Perkin Elmer, Shelton, CT) in the Arizona Laboratory for Emerging
Contaminants (ALEC). Anion concentrations were measured using ion chromatography (Dionex
Ion Chromatograph DX-500, Sunnyvale, CA) at the University of Arizona. DOC, DIC, and TDN
were measured using catalytic oxidation at 720oC using a Shimadzu TOC-VCSH with a TNM-1
nitrogen measuring unit (Shimadzu, Columbia, MD).
19
3.4 Data Analysis and Upscaling Solute Fluxes
Two tailed t-tests with a confidence interval of 95% were used to determine significant
differences in concentration and volume across burn severity and collector type. Due to
volumetric constraints of chemical analysis, samples from each plot were combined based on
collector type; therefore, volumes of stemflow and throughfall are not known for individual
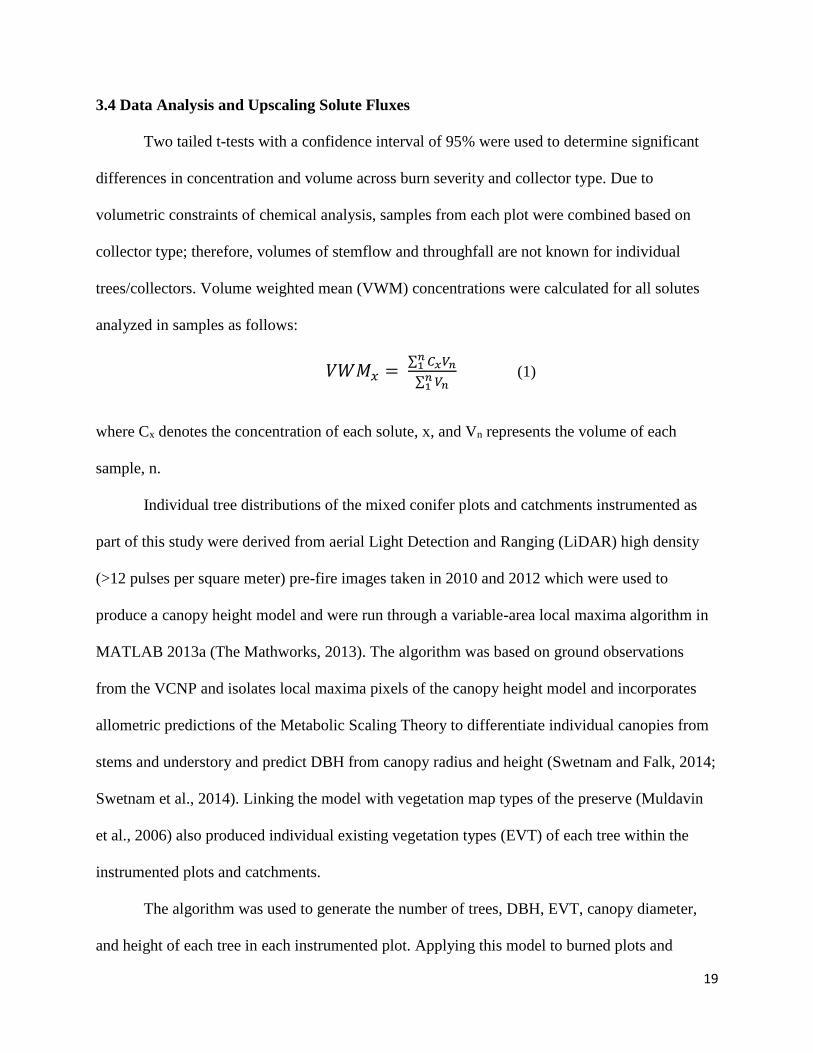
trees/collectors. Volume weighted mean (VWM) concentrations were calculated for all solutes
analyzed in samples as follows:
𝑉𝑊𝑀𝑥 = ∑ 𝐶𝑥𝑉𝑛
𝑛1
∑ 𝑉𝑛𝑛1
(1)
where Cx denotes the concentration of each solute, x, and Vn represents the volume of each
sample, n.
Individual tree distributions of the mixed conifer plots and catchments instrumented as
part of this study were derived from aerial Light Detection and Ranging (LiDAR) high density
(>12 pulses per square meter) pre-fire images taken in 2010 and 2012 which were used to
produce a canopy height model and were run through a variable-area local maxima algorithm in
MATLAB 2013a (The Mathworks, 2013). The algorithm was based on ground observations
from the VCNP and isolates local maxima pixels of the canopy height model and incorporates
allometric predictions of the Metabolic Scaling Theory to differentiate individual canopies from
stems and understory and predict DBH from canopy radius and height (Swetnam and Falk, 2014;
Swetnam et al., 2014). Linking the model with vegetation map types of the preserve (Muldavin
et al., 2006) also produced individual existing vegetation types (EVT) of each tree within the
instrumented plots and catchments.
The algorithm was used to generate the number of trees, DBH, EVT, canopy diameter,
and height of each tree in each instrumented plot. Applying this model to burned plots and
20
overlaying the RdNBR to determine burn severity of each plot relies on the assumption that tree
trunks seen in pre-fire LiDAR within the instrumented plots were moderately burned and remain
as standing charred dying trunks after fire. Based on the principles of allometry and
modifications to the representative area method and tree/stemflow correlation method created by
Hanchi and Rapp (1997), the above parameters were used to calculate the surface area of each
tree by treating each tree as a cylinder.
Relationships between diameter at breast height (DBH) and stemflow volume are
commonly observed (Strigel et al., 1994; Hanchi and Rapp, 1997; Aboal et al., 1999; Dezzeo and
Chacón, 2006; Germer et al., 2012). However, determining this specific relationship by fitting a
regression to stemflow volume and DBH data was not an option in this study because samples
were combined due to volumetric constraints of chemical analysis. Therefore, two DBH based
methods are considered when estimating solute fluxes: cross sectional basal area associated with
stemflow volumes and cylindrical surface area associated with available leaching area. The
solute fluxes calculated using the sum of the cross sectional basal area of each tree within
sampled plots were compared to the solute fluxes calculated using the sum of surface area
calculated by treating each tree in the sampled plots as a cylinder without bases (Supplemental
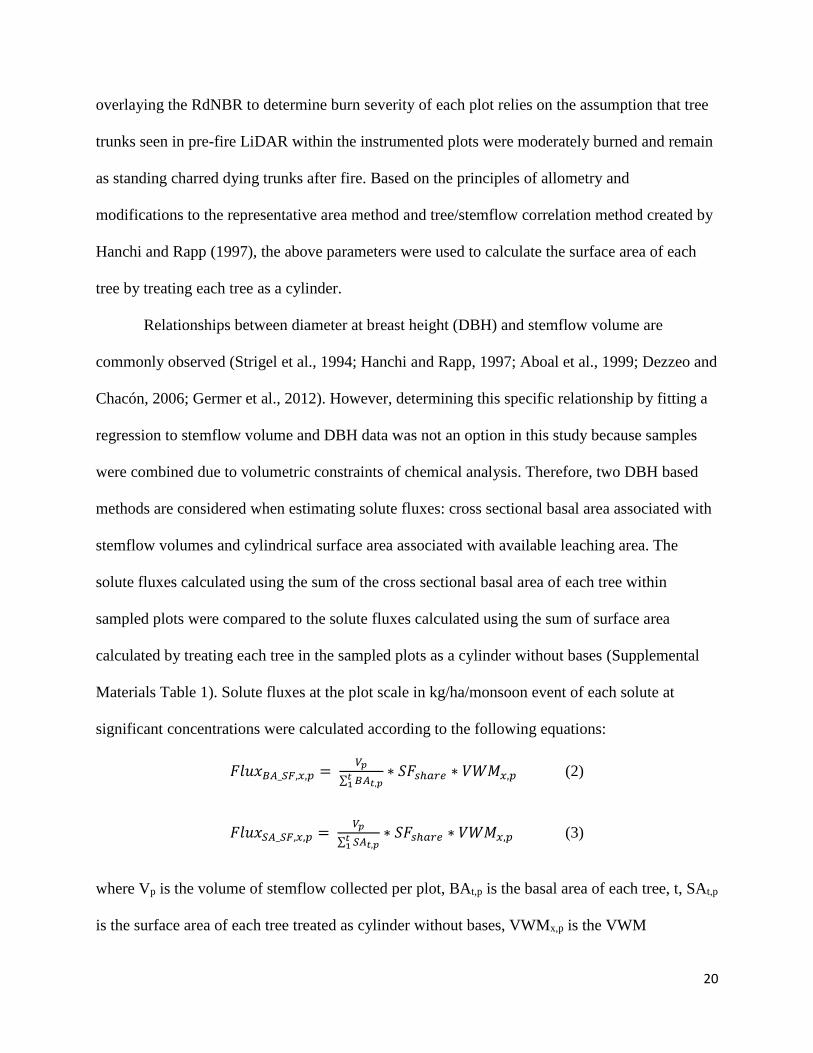
Materials Table 1). Solute fluxes at the plot scale in kg/ha/monsoon event of each solute at
significant concentrations were calculated according to the following equations:
𝐹𝑙𝑢𝑥𝐵𝐴_𝑆𝐹,𝑥,𝑝 = 𝑉𝑝
∑ 𝐵𝐴𝑡,𝑝𝑡1
∗ 𝑆𝐹𝑠ℎ𝑎𝑟𝑒 ∗ 𝑉𝑊𝑀𝑥,𝑝 (2)
𝐹𝑙𝑢𝑥𝑆𝐴_𝑆𝐹,𝑥,𝑝 = 𝑉𝑝
∑ 𝑆𝐴𝑡,𝑝𝑡1
∗ 𝑆𝐹𝑠ℎ𝑎𝑟𝑒 ∗ 𝑉𝑊𝑀𝑥,𝑝 (3)
where Vp is the volume of stemflow collected per plot, BAt,p is the basal area of each tree, t, SAt,p
is the surface area of each tree treated as cylinder without bases, VWMx,p is the VWM
21
concentration of each element, x, for each plot, p, and SFshare refers to the ratio of stemflow
collectors to trees in each plot. The surface area is calculated by treating each tree as a cylinder
without bases because of the increased surface area available for direct contact with the
precipitation because of lack of foliage and reduced stems after fire.
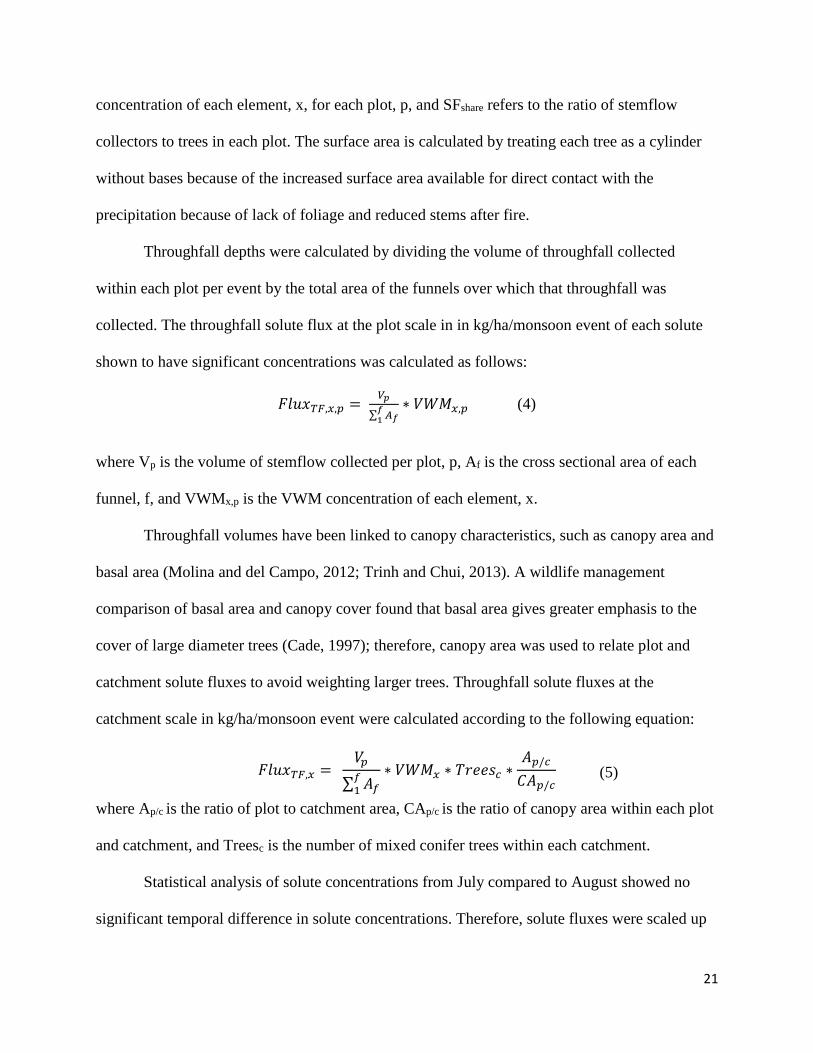
Throughfall depths were calculated by dividing the volume of throughfall collected
within each plot per event by the total area of the funnels over which that throughfall was
collected. The throughfall solute flux at the plot scale in in kg/ha/monsoon event of each solute
shown to have significant concentrations was calculated as follows:
𝐹𝑙𝑢𝑥𝑇𝐹,𝑥,𝑝 = 𝑉𝑝
∑ 𝐴𝑓𝑓1
∗ 𝑉𝑊𝑀𝑥,𝑝 (4)
where Vp is the volume of stemflow collected per plot, p, Af is the cross sectional area of each
funnel, f, and VWMx,p is the VWM concentration of each element, x.
Throughfall volumes have been linked to canopy characteristics, such as canopy area and
basal area (Molina and del Campo, 2012; Trinh and Chui, 2013). A wildlife management
comparison of basal area and canopy cover found that basal area gives greater emphasis to the
cover of large diameter trees (Cade, 1997); therefore, canopy area was used to relate plot and
catchment solute fluxes to avoid weighting larger trees. Throughfall solute fluxes at the
catchment scale in kg/ha/monsoon event were calculated according to the following equation:
where Ap/c is the ratio of plot to catchment area, CAp/c is the ratio of canopy area within each plot
and catchment, and Treesc is the number of mixed conifer trees within each catchment.
Statistical analysis of solute concentrations from July compared to August showed no
significant temporal difference in solute concentrations. Therefore, solute fluxes were scaled up
𝐹𝑙𝑢𝑥𝑇𝐹,𝑥 = 𝑉𝑝
∑ 𝐴𝑓𝑓1
∗ 𝑉𝑊𝑀𝑥 ∗ 𝑇𝑟𝑒𝑒𝑠𝑐 ∗𝐴𝑝/𝑐
𝐶𝐴𝑝/𝑐 (5)
22
from individual monsoon events (kg/ha/monsoon event) to the full monsoon season solute flux
(kg/ha/monsoon season) by multiplying each event flux by a precipitation depth scaling factor,
Pshare calculated as follows:
𝑃𝑠ℎ𝑎𝑟𝑒 =∑ 𝐷𝑛
1 𝑡𝑦𝑝𝑒,𝑛∗𝐷𝑝𝑝𝑡,𝑠𝑒𝑎𝑠𝑜𝑛,𝑀𝐸𝑇
𝐷𝑝𝑝𝑡,𝑒𝑣𝑒𝑛𝑡𝑠,𝑀𝐸𝑇 (6)
where Dtype,n is the sum of the depth of each precipitation type (stemflow or throughfall) from
each event, n, Dppt,season,MET is the depth of open precipitation over the whole monsoon season,
and Dppt,events,MET represents the depth of open precipitation from the dates of the events collected.
The depth of open precipitation from monsoon events from July 1, 2014 to September 30, 2014
was calculated based on data recorded at the Redondo Peak Valles Caldera New Mexico
Meteorological Station (35o53’02’’ N, 106o33’13’’ W; 3231 masl), located roughly between the
two catchments at a similar elevation.
The algorithm was also run for La Jara and Upper Jaramillo catchments in which the
collector plots were situated. The flux of solutes at the plot scale were scaled up to calculate the
flux of solutes to the catchment scale (kg/ha/monsoon event) based on collector type and burn
severity by multiplying the number of spruce, fir, or mixed conifer trees (EVT 1, 2, 4, and 5)
within each catchment (Treesc) by the flux of solutes to the plot, assuming the DBH and canopy
diameter of spruce and fir trees does not vary significantly across the catchment. Post-fire
LiDAR are not publicly available yet, so the number of burned and unburned trees cannot be
distinguished in each catchment. Therefore, catchment scale fluxes assume all trees are burned in
burned catchment solute flux calculations and that all trees are healthy and unburned in unburned
catchment flux calculations. Thus, catchment fluxes represent the maximum impact of wildfire to
a whole watershed.
23
4. RESULTS
4.1 Volumetric Changes
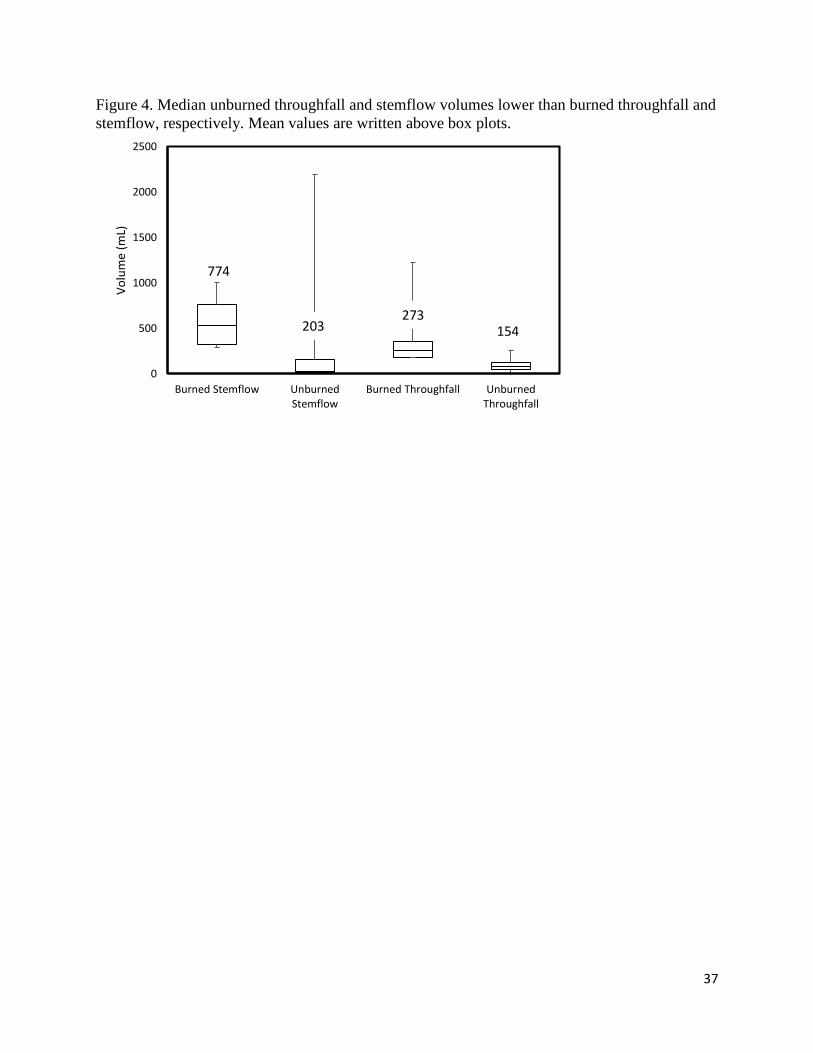
Collected volumes of burned stemflow were 2.8 times greater than volumes of burned
throughfall and volumes of unburned stemflow were 1.3 times greater than those of unburned
throughfall averaged over both catchments suggesting that precipitation is intercepted by tree
canopies in both burned and unburned areas (Figure 4). However, quantitative analysis of
interception volumes is outside of the scope of this study as open precipitation volumes were
lower than all other sample volumes collected suggesting that the Teflon funnels used for open
precipitation collectors were too small to completely capture precipitation in open areas away
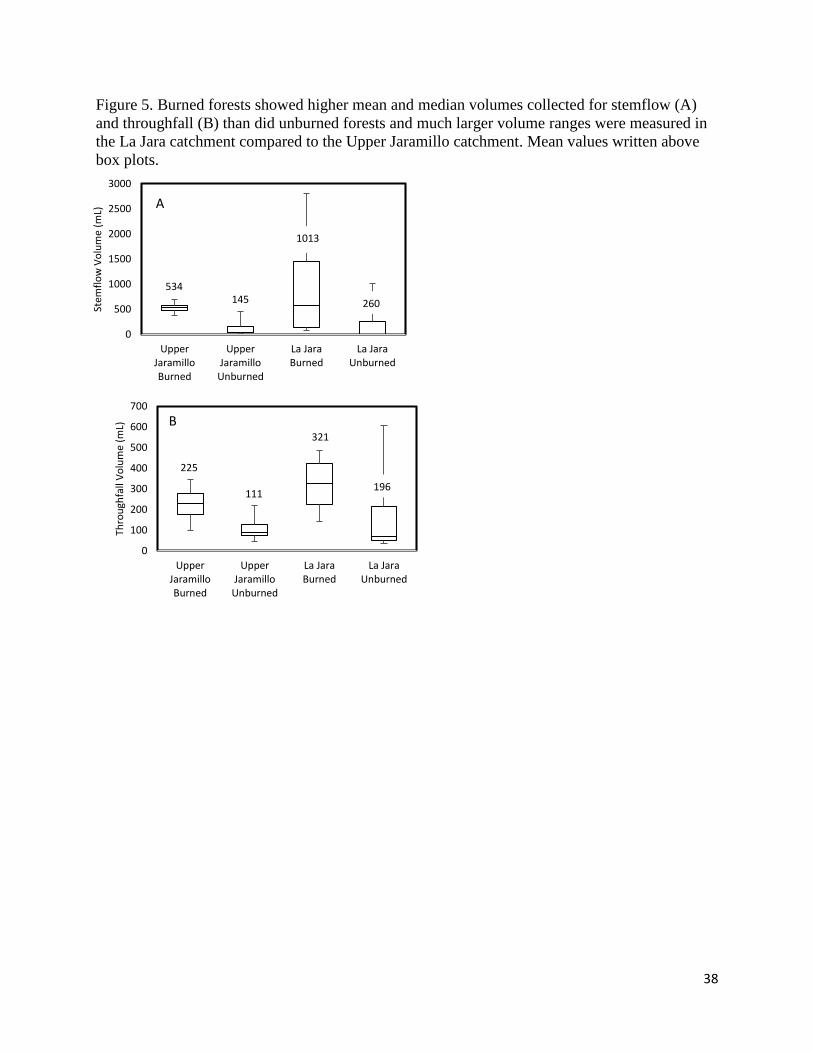
from tree cover. In the La Jara catchment, average volumes of burned stemflow were 3.9 times
greater than average volumes of unburned stemflow and average volumes of burned throughfall
were 1.6 times greater than average volumes of unburned throughfall (Figure 5). In the Upper
Jaramillo catchment, average volumes of burned stemflow were 3.7 times greater than average
volumes of unburned stemflow and average volumes of burned throughfall were 2.0 times
greater than average volumes of unburned throughfall (Figure 5) showing that less precipitation
was lost as interception and more precipitation made its way to the forest floor after interacting
with burned forest stands compared to healthy, unburned forests.
24
4.2 Chemical Composition
4.2.1 Burned versus Unburned
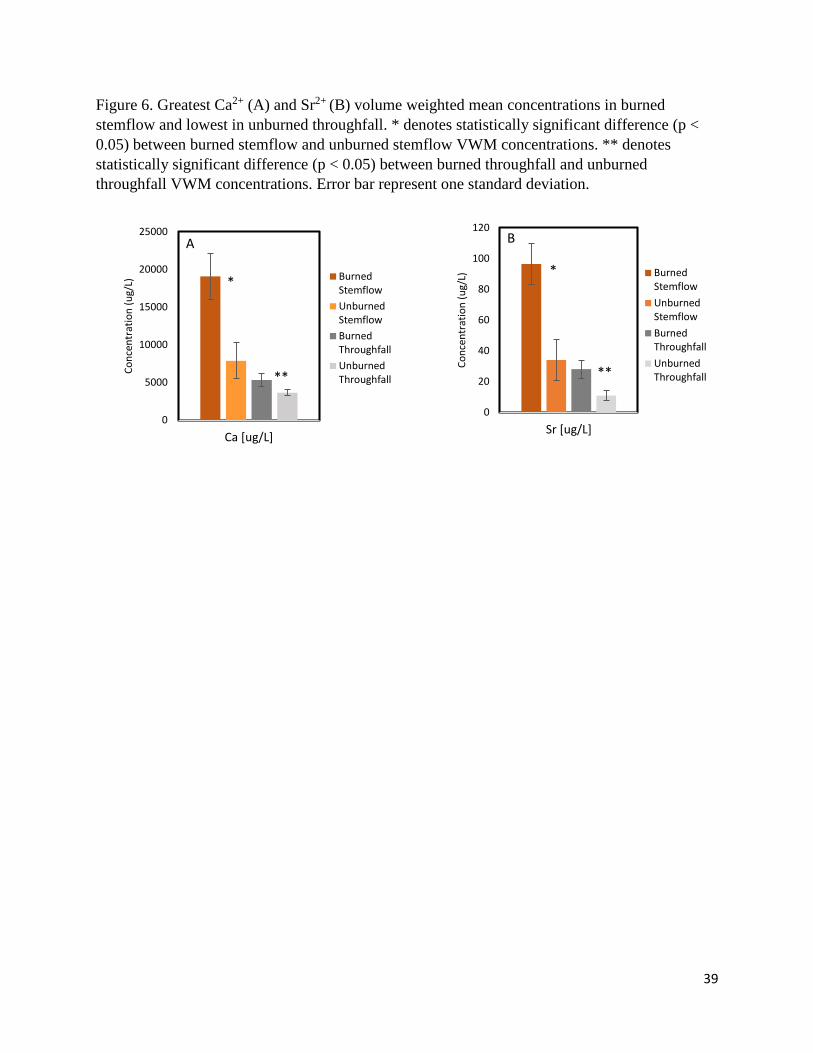
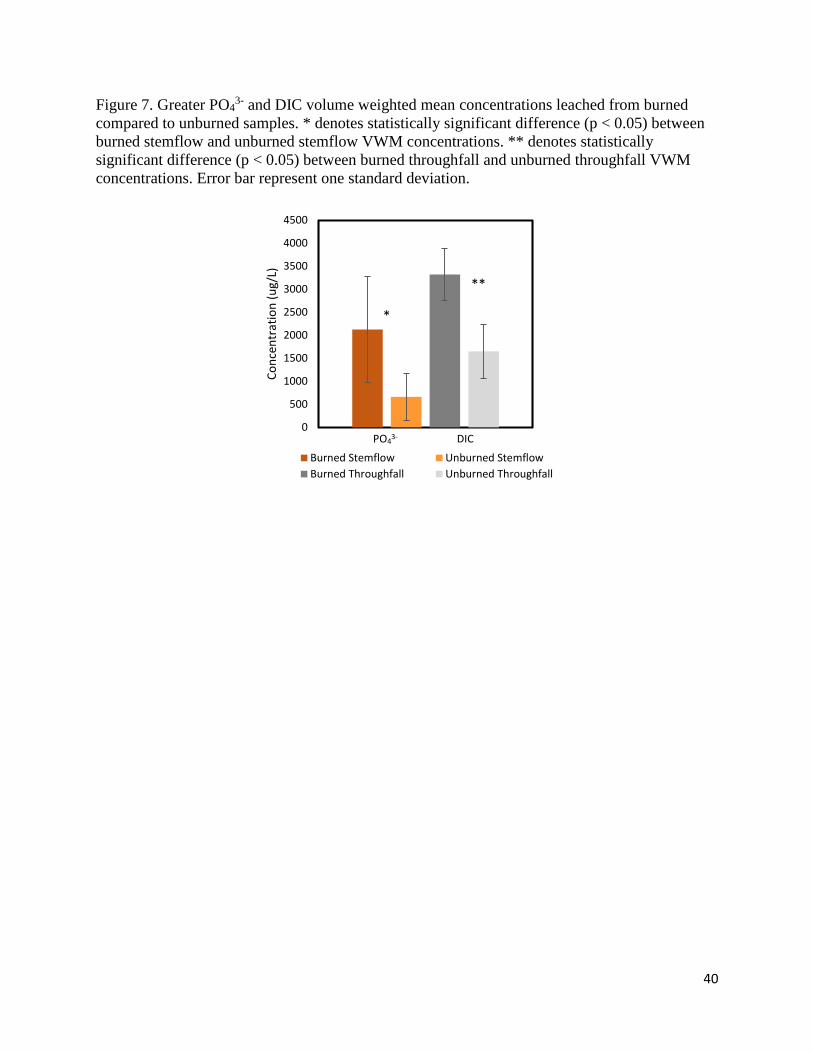
Volume weighted mean concentrations of PO43-, Ca2+, and Sr2+ are significantly higher (p
< 0.05) in burned stemflow relative to unburned stemflow. Ca2+ concentrations are 2.4 times
higher in burned stemflow than in unburned stemflow (Figure 6). Sr2+ concentrations are 2.8
times higher in burned stemflow than in unburned stemflow (Figure 6). PO43-
concentrations are
3.2 times higher in burned stemflow than in unburned stemflow (Figure 7). Concentrations of all
other solutes analyzed were not significantly different (p > 0.05) between burned and unburned
stemflow.
VWM concentrations of DIC, Ca2+, and Sr2+ were significantly higher (p < 0.05) in
burned throughfall than in unburned throughfall. Ca2+ content was found to be 1.5 times higher
in burned throughfall than unburned throughfall (Figure 6). Sr2+ concentrations were 2.6 times
higher in burned throughfall than unburned throughfall (Figure 6). DIC concentrations were 2.0
times higher in burned throughfall than unburned throughfall (Figure 7). Differences between
burned and unburned throughfall concentrations of all other solutes analyzed were not
statistically significant (p > 0.05).
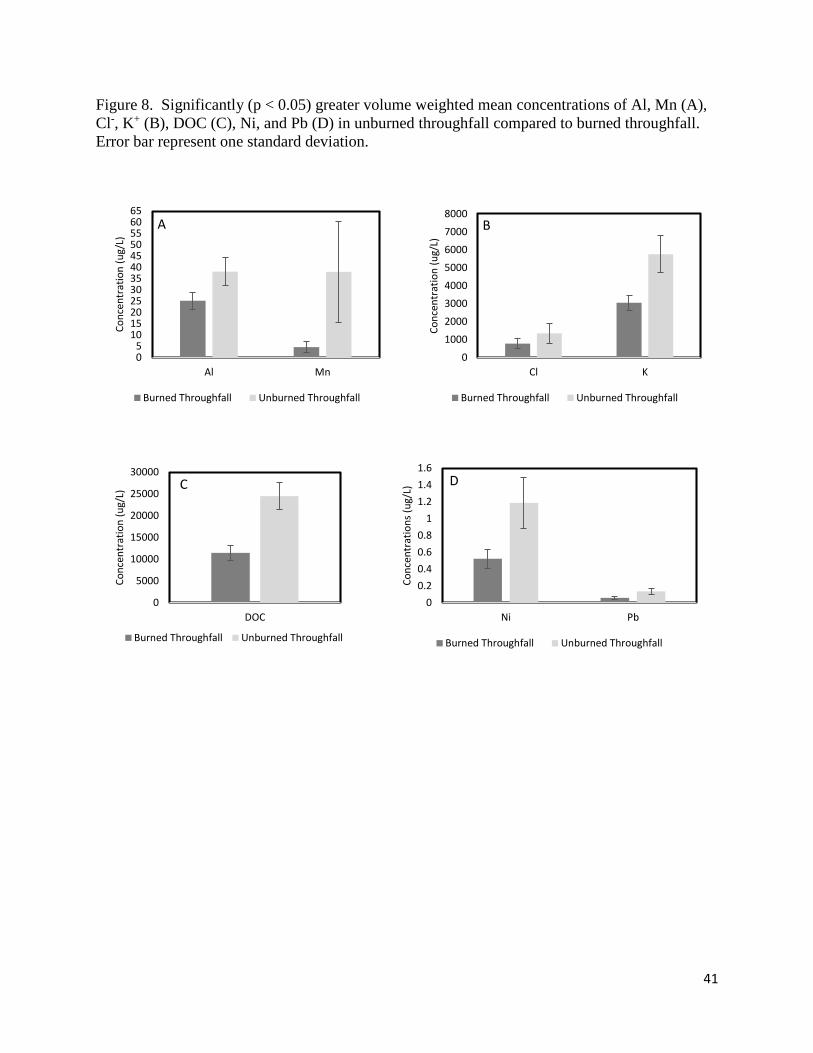
VWM concentrations of DOC, Cl-, K+, Al, Mn, and Ni are statistically higher (p < 0.05)
in unburned throughfall compared to burned throughfall (Figure 8). DOC concentrations are 2.1
times higher in unburned throughfall than burned throughfall. Unburned throughfall Cl-
concentrations are 1.7 times higher than burned throughfall. K+ content is 1.9 times greater, Al
concentrations are 1.5 times higher, Mn concentrations are 8.2 times higher, and Ni is 2.3 times
greater in unburned throughfall than burned throughfall. No solutes were found to have
statistically higher concentrations (p > 0.05) in unburned stemflow than burned stemflow.
25
4.2.2 Stemflow versus Throughfall
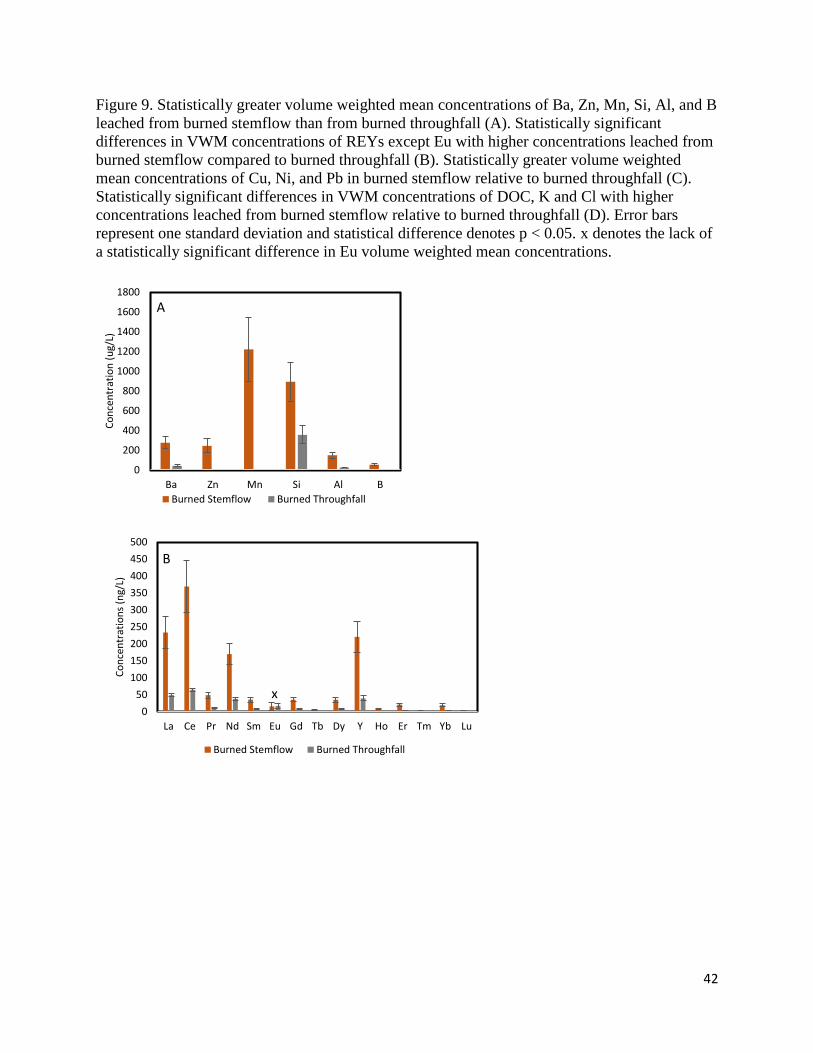
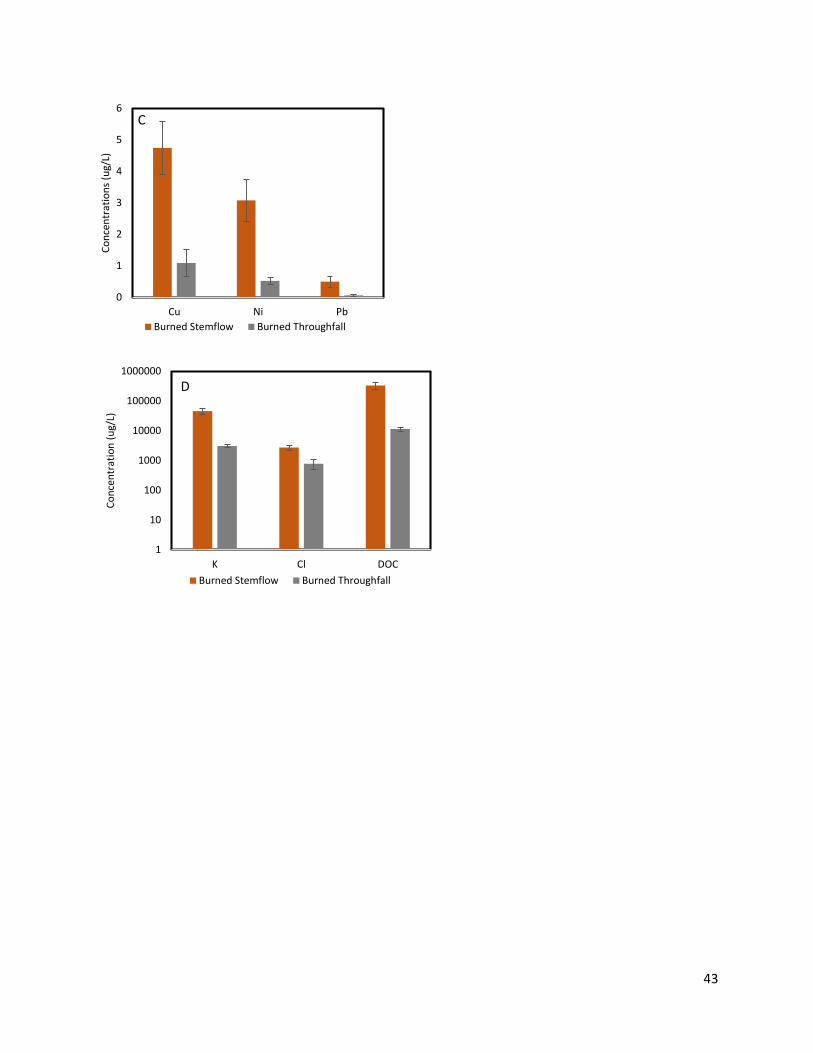
VWM concentrations of DOC, Ca2+, Sr2+, Mn, Zn, Ba, Si, Al, Cu, Ni, Pb, Cl-, and K+ are
statistically higher (p < 0.05) in burned stemflow than in burned throughfall (Figure 6 and 8).
DOC concentrations are 28.9 times greater in burned stemflow than burned throughfall. VWM
concentrations of Ca2+ and Sr2+ are 3.6 and 3.4 times higher, respectively. Zn concentrations are
42.5 times greater, Ba content is 6.4 times higher, Cu is 4.3 times greater, and Ni content is 5.9
times greater in burned stemflow than burned throughfall. Si concentrations are 2.5 times greater
and Pb content is 8.5 times higher in burned stemflow relative to burned throughfall. K+ content
is 14.9 times greater, Al concentrations are 5.9 times higher, B concentrations are 5.7 times
higher, and Cl- content is 3.5 times greater in burned stemflow than burned throughfall. Mn
concentrations are 264.9 times greater in burned stemflow than burned throughfall. However, it
should be noted that the contribution of Si, Pb, and Zn from collector materials (i.e. silicone
sealant and galvanized nails) is still being investigated. Finally, VWM concentrations of all rare
earth elements (La, Ce, Pr, Nd, Sm, Gd, Tb, Dy, Y, Ho, Er, Tm, Yb, and Lu) except Eu are
statistically higher in burned stemflow than in burned throughfall, as well, suggesting the
immediate release of Eu after fire (Figure 9).
26
4.2.3 Solute Fluxes
Estimation of fluxes of solutes previously shown to have statistically higher volume weighted
mean concentrations in burned and unburned plots was conducted for stemflow and throughfall
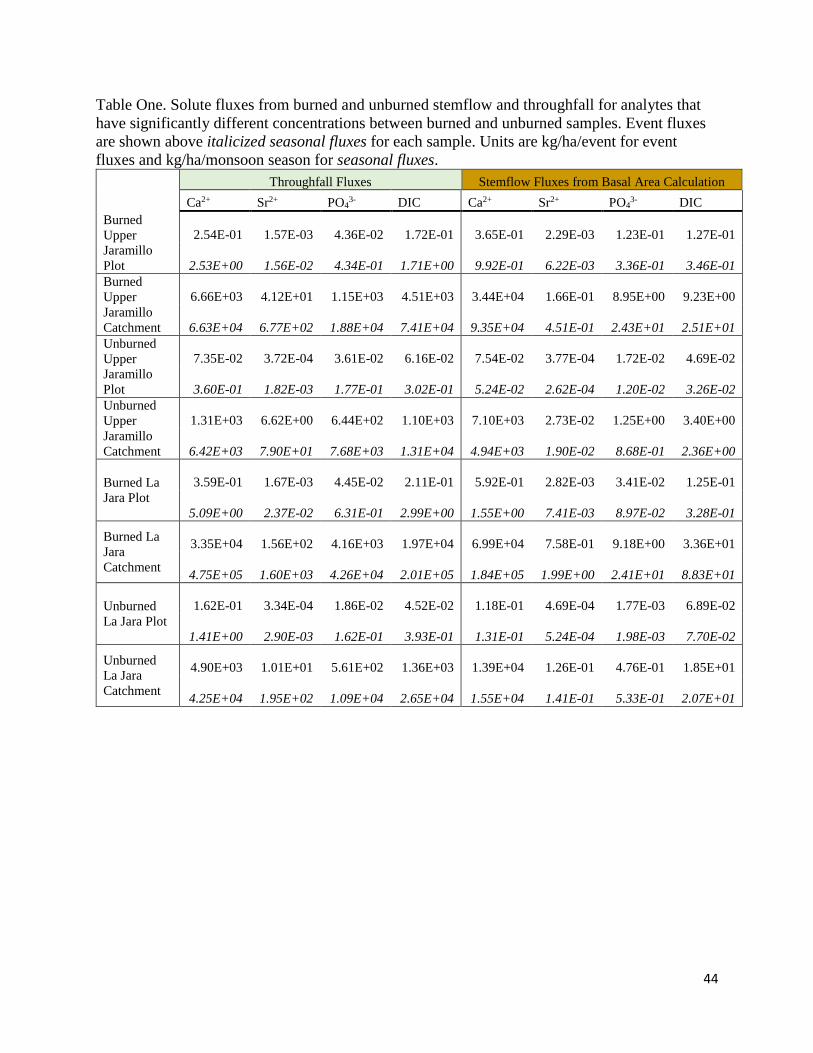
at the plot and catchment scale (Table 1). Trends seen in event and seasonal fluxes are consistent
with those seen in VWM concentrations. The event and seasonal fluxes in kg/ha of Ca2+, Sr2+,
PO43-, and DIC are highest in burned stemflow and lowest in unburned throughfall. Solute fluxes
follow the general trend of Ca2+ > DIC > PO43- > Sr2+ in burned and unburned stemflow whereas
solute fluxes in burned and unburned throughfall follow the general trend of Ca2+ > Sr2+ > PO43-
~ DIC. The fluxes of Ca2+, Sr2+, PO43-, and DIC are slightly greater in the south facing La Jara
plots than the north facing Upper Jaramillo plots for stemflow and throughfall.
Solute fluxes from burned stemflow and throughfall are greater relative to unburned
stemflow and throughfall. Ca2+ fluxes from burned throughfall are 10.3 and 11.2 times greater
than from unburned throughfall in Upper Jaramillo and La Jara catchments, respectively. Sr2+
fluxes are 8.6 and 8.2 times higher from burned throughfall than unburned throughfall in Upper
Jaramillo and La Jara catchments. DIC fluxes are 5.7 and 7.6 times larger in burned throughfall
compared to unburned throughfall in Upper Jaramillo and La Jara catchments. Basal area method
Ca2+ fluxes from burned stemflow are 18.9 and 11.8 times larger than fluxes from unburned
stemflow in Upper Jaramillo and La Jara catchments. Sr2+ fluxes calculated from basal area are
23.8 and 8.2 times greater in burned stemflow compared to unburned stemflow in Upper
Jaramillo and La Jara catchments. Finally, PO43- fluxes calculated from the basal area method are
28.0 and 45.3 times greater in Upper Jaramillo and La Jara catchments, respectively. The
calculations of seasonal solute flux from stemflow at the catchment scale differ by approximately

27
2 orders of magnitude based on method, as the basal area estimations are significantly larger than
the cylindrical surface area estimations (Supplemental Materials Table 1).
28
5. DISCUSSION
In both catchments, volumes of stemflow collected in burned forests from standing, dead
trees were significantly greater than volumes of stemflow collected in unburned forests from live
trees. Throughfall volumes in burned forests beneath standing dead trees were also significantly
greater than volumes of throughfall collected beneath live, unburned forests. These volumetric
trends contrast with trends in volumes collected from stressed and standing, dead but not burned
trees in previous studies which found smaller volumes of stemflow collected from dead and
dying trees than from live trees (Watters and Price, 1988; Hauck et al., 2002; Frost and Levia,
2014). This volumetric difference is likely because burned trees in this study were surrounded by
other burned trees that experienced little loss of precipitation via interception at the stand scale
whereas the unburned but dead and dying trees sampled in previous studies were interspersed
within live, healthy forest stands in which live trees intercept precipitation and limit its
interaction with dead trees. It is also important to note that charred bark observed after the
Thompson Ridge Fire was visibly smoother than unburned bark which likely increased the
volume of stemflow diverted down stems as Parker (1983) noted that nutrient deposition via
stemflow is greater in smooth bark stems. Further research is needed to investigate the roughness
of burned bark and its direct influence on stemflow generation.
Concentrations of DIC, Ca2+ and Sr2+ were elevated in burned throughfall compared to
unburned throughfall. Limiting nutrients, namely PO43-, Ca2+, and Sr2+, were leached in
significantly higher concentrations from burned stemflow relative to unburned stemflow. Pyatt
(2007) noted that Ca2+ is important for plant growth and Ulrich (1983) described how trees take
up Ca2+ from the soil to recharge exchange sites on their cell walls. Sr2+ is thought to behave
similarly to Ca2+ during nutrient uptake because of their similar ionic radii and positive ionic
29
charge and is known to replace Ca2+ at ionic exchange sites (Miller et al., 1993; Nezat et al.,
2010). Dasch et al. (2006) showed biologic uptake of both Ca2+ and Sr2+ in three tree species in a
study conducted in the Hubbard Brook Experimental Forest. Regardless of species, they found
increasing uptake of Ca2+ compared to Sr2+ into trees over time and with increasing elevation and
internal ion exchange favoring Sr2+ over Ca2+.
Raison et al. (1985) refers to Ca2+ as nonvolatile because of its very high vaporization
temperature and suggests that Ca2+ loss after fire can be attributed solely to particulate transport.
Elevated Ca2+ concentrations in burned stemflow and throughfall can likely be attributed to the
bonds formed between orthophosphate and Ca2+ to create calcium phosphate which is more
likely to precipitate at higher temperatures as its solubility decreases with increasing
temperature. Ranalli (2004) suggests that burning of plant cell water greatly concentrates those
elements taken up for biotic use which explains greater leaching of Ca2+, Sr2+, and PO43- from
burned trees than unburned trees observed in this study. Certini (2005) surmised that burning
converts P to orthophosphate which is the sole form of P available to biota. In acid soils, this
orthophosphate binds to Al, Fe, and Mn oxides but binds to Ca2+ in neutral or alkaline soils. The
pH of precipitation events sampled during this study were near neutral and ranged from 6 to 7
suggesting that calcium phosphate likely precipitated on burned trees after fire. It has also been
suggested that spruce can directly access calcium phosphate to retrieve nutrients (Blum et al.,
2002). The biologic uptake of Ca2+ and Sr2+ and the likely presence of calcium phosphate after
fire explains why higher concentrations of these solutes were leached in burned stemflow
relative to unburned stemflow and burned throughfall compared to unburned throughfall. Hauck
et al. (2002) also found significant increases in PO43- concentrations leached from stemflow of
30
decomposing trees compared to live trees, which agrees with findings of elevated PO43- found
leaching from burned trees.
Finally, concentrations of divalent cations, such as Ca2+ and Sr2+, are significantly higher
in burned plots than unburned plots while significant differences are not observed in
concentrations of monovalent cations one year after fire. The persistence of bivalent cations over
monovalent cations has also been noted in previous wildfire studies because of their higher
selectivity for ion exchange sites (Chorover et al., 1994; Ranalli, 2004). The absence of
significantly different concentrations of nutrients like NH4+ and NO3
- as well as monovalent
cations such as K+ and Na+ between burned and unburned samples suggest that immediate
effects of wildfire were not captured in this study and future work should explore wildfire’s
immediate effect on stemflow and throughfall leaching.
VWM concentrations of DOC, Ca2+, Sr2+, Mn, Zn, Ba, Si, Al, Cu, Ni, Pb, Cl-, and K+ are
statistically higher (p < 0.05) in burned stemflow than in burned throughfall. Higher solute
concentrations in burned stemflow relative to burned throughfall are likely due to the longer
contact time of precipitation diverted down the trunk compared to precipitation falling through
the canopy. Previous studies comparing stemflow and throughfall solute concentrations from
unburned trees have also noted this trend of greater solute concentrations leached from stemflow
compared to throughfall (Levia and Frost, 2003; Germer et al., 2012). Studies of post-fire surface
water chemistry also noted trace element enrichment in burned watersheds, specifically Ba, Cu,
Ni, Pb, Zn, Al, and Mn, as compared to unburned conditions. Elevated trace element
concentrations were attributed to release from vegetation (Smith et al., 2011; Burke et al., 2013)
which corresponds with the increased trace element release observed in burned stemflow in this
study. Elevated B concentrations, as seen in this study, were not found in fire previous studies;
31
however, the International Plant Nutrition Institute notes its importance as a micronutrient
(Nutri-Facts-North American Edition, 2015). Mn concentrations were also exceptionally high in
burned stemflow samples analyzed in this study and were found to be 264.9 times greater in
burned stemflow than burned throughfall. Hauck et al. (2002) noted higher K+, Ca2+, Mn, Zn and
Pb concentrations in stemflow from dying trees compared to healthy trees. Gonzalez Parra et al.
(1996) also observed elevated Mn concentrations in burned soils as compared to unburned soils
and accredits this Mn increase to ash from burned vegetation and complexes with organic matter.
It appears that the rare earth element Eu was also immediately released after fire. Marked
increases in the positive Eu anomalies (normalized to the upper continental crust; Taylor and
McLennan, 1981) of soil solutions from burned soil pits and stream waters collected in La Jara
and Upper Jaramillo flumes immediately after fire also suggest that Eu was immediately released
from burned plants in contrast to other REYs. The immediate release of Eu after fire is also the
likely cause of the differences in Eu anomalies seen in open precipitation, stemflow, and
throughfall samples. Both open precipitation and unburned stemflow have similar Eu anomalies
around 30 suggesting that stemflow on live trees does not affect the Eu anomaly already present
in open precipitation through leaching or preferential uptake. However, unburned throughfall has
a lower Eu anomaly of about 8 suggesting that Eu is preferentially taken up by the leaves of
living trees. Finally, the Eu anomalies of burned stemflow (approximately 3) and burned
throughfall (approximately 8) are also lower than those of open precipitation and unburned
stemflow even though Eu cannot be taken up in these dead trees and more immediate leaching
took place from stemflow than from throughfall.
Chemical fluxes of Ca2+, Sr2+, PO43-, and DIC from burned trees are significantly larger
than fluxes of those solutes from unburned trees because of greater volumes and higher solute

32
concentrations in burned sites compared to unburned sites. Estimated stemflow solute fluxes
from burned trees in this study are also greater than those from healthy and dead trees (Watters
and Price, 1988) burned throughfall solute fluxes from a prescribed burn that did not combust the
canopy (Chorover et al., 1994), and unburned stemflow solute fluxes (Germer et al., 2007)
observed in previous throughfall and stemflow studies. However, because of the large variability
of stemflow and throughfall water and solute inputs previously described, direct comparisons
between solute fluxes observed in this study and previous studies is not possible (Figure 1).
Greater solute fluxes from stemflow and throughfall in the south facing La Jara catchment
compared to the north facing Upper Jaramillo catchment can likely be attributed to the southerly
storm direction of the North American Monsoon (Adams and Comrie, 1997). Chemical fluxes
from burned stemflow directly to the base of burned trees and throughfall inputs beneath tree
drip lines add significant loads of nutrients to burned watersheds which will likely help to
stimulate vegetation regrowth and soil microbial activity after fire. These nutrient loads may
have important implications for fire management, specifically the use of salvage logging after
fire. In future work, leaching of solutes from stemflow and throughfall will be important
components of understanding changes to the hydrologic system after fire as they are necessary to
understand nutrient pathways and how fire propagates through the critical zone.
33
6. CONCLUSION
Greater volumes of stemflow and throughfall were measured in burned stands compared
to unburned stands due to decreased interception in the absence of foliage and presence of
smooth, charred bark. Concentrations of DOC, nutrients (Ca2+), elements that commonly
substitute for Ca2+ (Sr2+ and Mn), several trace elements, and REYs except Eu are greater in
burned stemflow relative to burned throughfall due to longer contact time of precipitation with
stems producing greater leaching of elements taken up by plants for biotic use. Elevated
concentrations of Ca2+, Sr2+, and PO43- in burned stemflow relative to unburned stemflow can be
attributed to the similar behavior of Ca2+ and Sr2+ and the concentration of Ca2+, Sr2+, and PO43-
during the burning of plant cell water which leads to the precipitation of those elements as
calcium phosphate and their subsequent leaching from burned trees during monsoon events. The
persistence of divalent cations compared to monovalent cations in burned samples suggests the
immediate release of monovalent cations and Eu.
Finally, chemical fluxes from burned stemflow and throughfall observed after the
Thompson Ridge Fire are greater than fluxes estimated in previous studies. More specifically,
greater volumes of stemflow in burned forests combined with greater concentrations of leached
solutes from burned stemflow will have a multiplicative effect on burned stemflow fluxes. As
precipitation leaches nutrients from burned stems and releases them directly to the critical zone,
elevated nutrient deposition from burned stemflow may result in nutrient hot spots surrounding
burned trees. Substantial loads of potentially limiting nutrients, namely Ca2+, Sr2+, and PO43- will
likely have important implications for vegetation regrowth and biogeochemical processes within
the critical zone.

34
7. FIGURES and TABLES
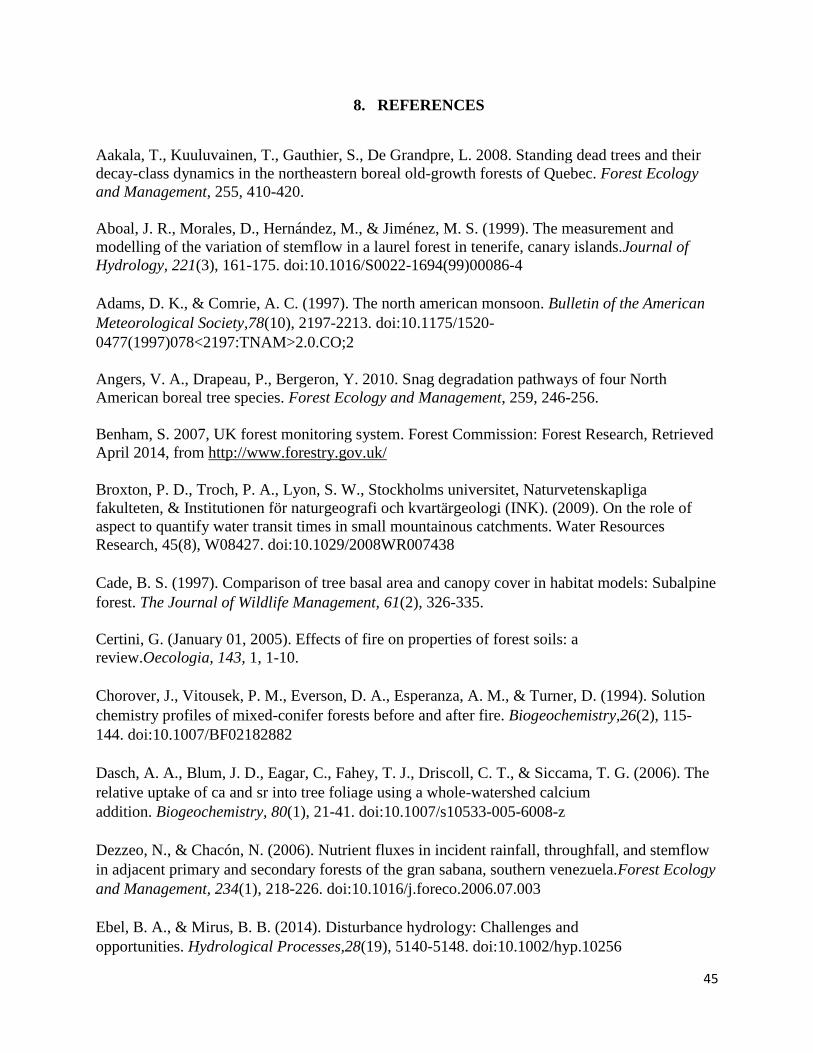
Figure 1. Conceptual model of critical zone response to water partitioning and solute fluxes
in healthy (A) and burned (B) forests in stemflow (orange arrows), throughfall (grey arrows),
and open precipitation (blue arrows). Width of arrows corresponds to the amount of water
fluxes in those precipitation types.
A
B
Open Precipitation: Open Precipitation fluxes are not well understood from this study as not all precipitation was captured
35
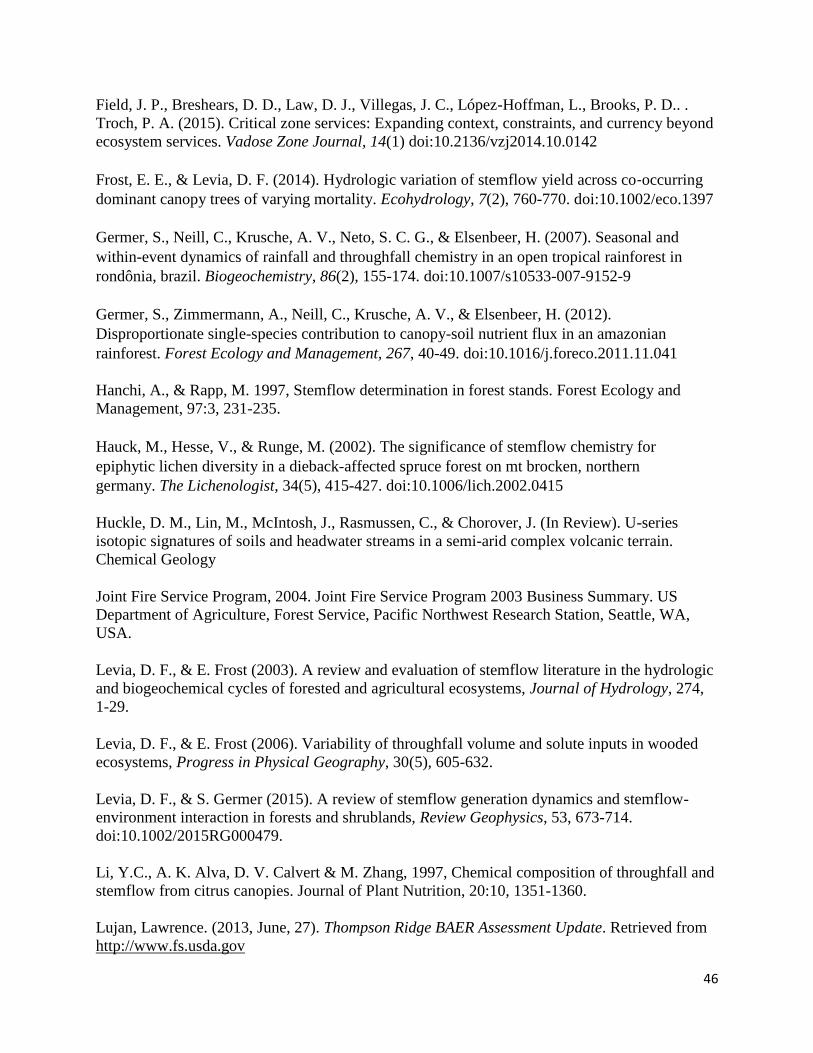
Figure 2. Overview of study area shows the Jemez River Basin Critical Zone Observatory within
the Valles Caldera National Preserve located in northern New Mexico. The Thompson Ridge
Fire perimeter is shown in red and uses relativized differenced normalized burn ratio (RdNBR)
obtained from Monitoring Trends in Burn Severity (MTBS) to calculate burn severity. The black
lines around Redondo Peak delineate the La Jara and Upper Jaramillo catchments.
36
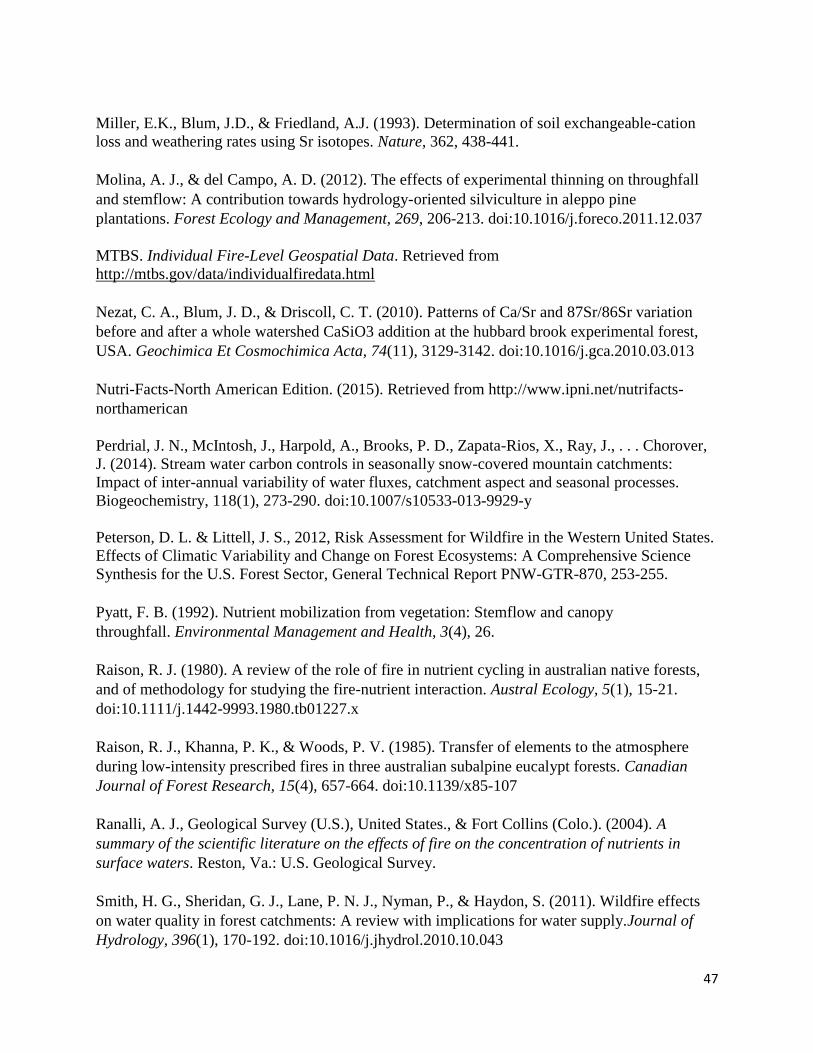
Figure 3. Burned, unburned, and open precipitation plots are shown within each catchment.
Insets show location of each plot type over a 1m resolution pre-burn digital Ortho rectified image
(USDA-FSA Aerial Photography Field Office, National Agriculture Imagery Program, 2009).
37
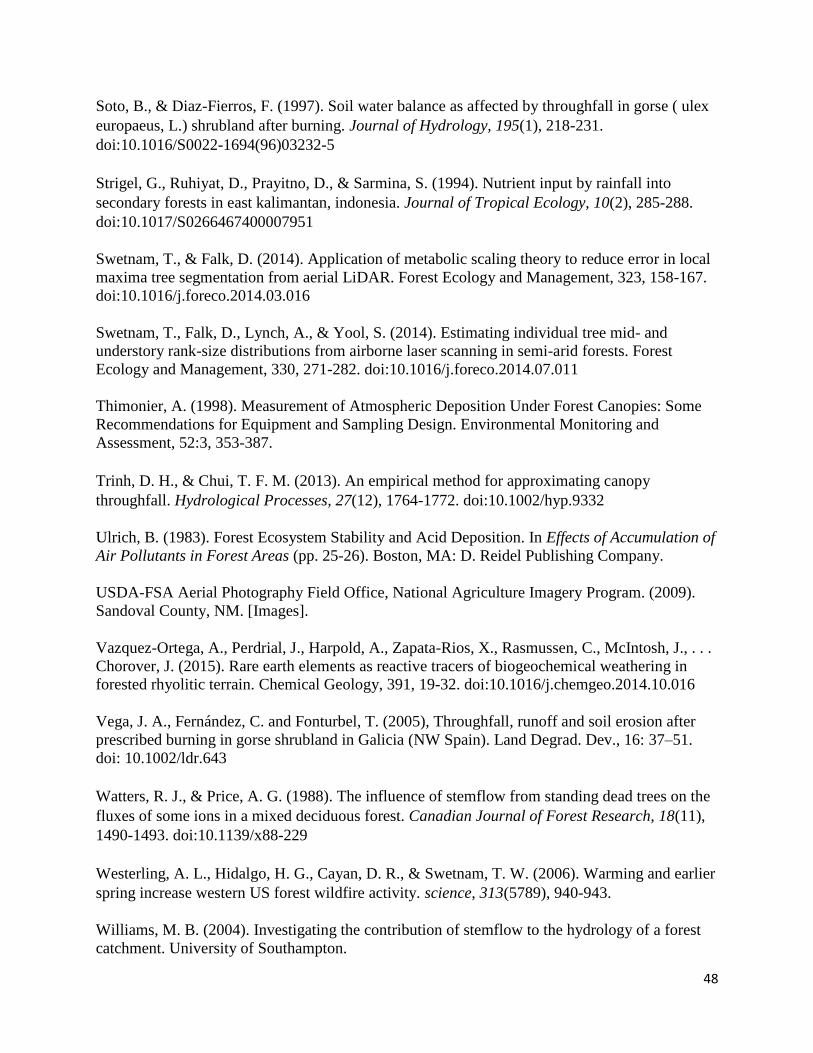
Figure 4. Median unburned throughfall and stemflow volumes lower than burned throughfall and
stemflow, respectively. Mean values are written above box plots.
0
500
1000
1500
2000
2500
Burned Stemflow UnburnedStemflow
Burned Throughfall UnburnedThroughfall
Vo
lum
e (m
L)
774
534
203
534
273
534 154
534
38
Figure 5. Burned forests showed higher mean and median volumes collected for stemflow (A)
and throughfall (B) than did unburned forests and much larger volume ranges were measured in
the La Jara catchment compared to the Upper Jaramillo catchment. Mean values written above
box plots.
0
100
200
300
400
500
600
700
UpperJaramilloBurned
UpperJaramillo
Unburned
La JaraBurned
La JaraUnburned
Thro
ugh
fall
Vo
lum
e (m
L)
225
111
321
196
0
500
1000
1500
2000
2500
3000
UpperJaramilloBurned
UpperJaramillo
Unburned
La JaraBurned
La JaraUnburned
Stem
flo
w V
olu
me
(mL)
534 145
1013
260
A
B
39
Figure 6. Greatest Ca2+ (A) and Sr2+ (B) volume weighted mean concentrations in burned
stemflow and lowest in unburned throughfall. * denotes statistically significant difference (p <
0.05) between burned stemflow and unburned stemflow VWM concentrations. ** denotes
statistically significant difference (p < 0.05) between burned throughfall and unburned
throughfall VWM concentrations. Error bar represent one standard deviation.
0
5000
10000
15000
20000
25000
Ca [ug/L]
Co
nce
ntr
atio
n (
ug/
L)
BurnedStemflow
UnburnedStemflow
BurnedThroughfall
UnburnedThroughfall
A
*
0
20
40
60
80
100
120
Sr [ug/L]
Co
nce
ntr
atio
n (
ug/
L) BurnedStemflow
UnburnedStemflow
BurnedThroughfall
UnburnedThroughfall
B
****
*
40
Figure 7. Greater PO43- and DIC volume weighted mean concentrations leached from burned
compared to unburned samples. * denotes statistically significant difference (p < 0.05) between
burned stemflow and unburned stemflow VWM concentrations. ** denotes statistically
significant difference (p < 0.05) between burned throughfall and unburned throughfall VWM
concentrations. Error bar represent one standard deviation.
0
500
1000
1500
2000
2500
3000
3500
4000
4500
Co
nce
ntr
atio
n (
ug/
L)
Burned Stemflow Unburned Stemflow
Burned Throughfall Unburned Throughfall
*
**
PO43- DIC
41
Figure 8. Significantly (p < 0.05) greater volume weighted mean concentrations of Al, Mn (A),
Cl-, K+ (B), DOC (C), Ni, and Pb (D) in unburned throughfall compared to burned throughfall.
Error bar represent one standard deviation.
05
101520253035404550556065
Al Mn
Co
nce
ntr
atio
n (
ug/
L)
Burned Throughfall Unburned Throughfall
A
0
1000
2000
3000
4000
5000
6000
7000
8000
Cl K
Co
nce
ntr
atio
n (
ug/
L)
Burned Throughfall Unburned Throughfall
B
0
5000
10000
15000
20000
25000
30000
DOC
Co
nce
ntr
atio
n (
ug/
L)
Burned Throughfall Unburned Throughfall
C
0
0.2
0.4
0.6
0.8
1
1.2
1.4
1.6
Ni Pb
Co
nce
ntr
atio
ns
(ug/
L)
Burned Throughfall Unburned Throughfall
D
42
Figure 9. Statistically greater volume weighted mean concentrations of Ba, Zn, Mn, Si, Al, and B
leached from burned stemflow than from burned throughfall (A). Statistically significant
differences in VWM concentrations of REYs except Eu with higher concentrations leached from
burned stemflow compared to burned throughfall (B). Statistically greater volume weighted
mean concentrations of Cu, Ni, and Pb in burned stemflow relative to burned throughfall (C).
Statistically significant differences in VWM concentrations of DOC, K and Cl with higher
concentrations leached from burned stemflow relative to burned throughfall (D). Error bars
represent one standard deviation and statistical difference denotes p < 0.05. x denotes the lack of
a statistically significant difference in Eu volume weighted mean concentrations.
0
200
400
600
800
1000
1200
1400
1600
1800
Ba Zn Mn Si Al B
Co
nce
ntr
atio
n (
ug/
L)
Burned Stemflow Burned Throughfall
0
50
100
150
200
250
300
350
400
450
500
La Ce Pr Nd Sm Eu Gd Tb Dy Y Ho Er Tm Yb Lu
Co
nce
ntr
atio
ns
(ng/
L)
Burned Stemflow Burned Throughfall
A
-500500
C
B
-500500
C
x
43
0
1
2
3
4
5
6
Cu Ni Pb
Co
nce
ntr
atio
ns
(ug/
L)
Burned Stemflow Burned Throughfall
1
10
100
1000
10000
100000
1000000
K Cl DOC
Co
nce
ntr
atio
n (
ug/
L)
Burned Stemflow Burned Throughfall
C
-500500
C
D
-500500
C
44
Table One. Solute fluxes from burned and unburned stemflow and throughfall for analytes that
have significantly different concentrations between burned and unburned samples. Event fluxes
are shown above italicized seasonal fluxes for each sample. Units are kg/ha/event for event
fluxes and kg/ha/monsoon season for seasonal fluxes.
Throughfall Fluxes Stemflow Fluxes from Basal Area Calculation
Ca2+ Sr2+ PO43- DIC Ca2+ Sr2+ PO4
3- DIC
Burned
Upper
Jaramillo
Plot
2.54E-01 1.57E-03 4.36E-02 1.72E-01 3.65E-01 2.29E-03 1.23E-01 1.27E-01
2.53E+00 1.56E-02 4.34E-01 1.71E+00 9.92E-01 6.22E-03 3.36E-01 3.46E-01
Burned
Upper
Jaramillo
Catchment
6.66E+03 4.12E+01 1.15E+03 4.51E+03 3.44E+04 1.66E-01 8.95E+00 9.23E+00
6.63E+04 6.77E+02 1.88E+04 7.41E+04 9.35E+04 4.51E-01 2.43E+01 2.51E+01
Unburned
Upper
Jaramillo
Plot
7.35E-02 3.72E-04 3.61E-02 6.16E-02 7.54E-02 3.77E-04 1.72E-02 4.69E-02
3.60E-01 1.82E-03 1.77E-01 3.02E-01 5.24E-02 2.62E-04 1.20E-02 3.26E-02
Unburned
Upper
Jaramillo
Catchment
1.31E+03 6.62E+00 6.44E+02 1.10E+03 7.10E+03 2.73E-02 1.25E+00 3.40E+00
6.42E+03 7.90E+01 7.68E+03 1.31E+04 4.94E+03 1.90E-02 8.68E-01 2.36E+00
Burned La
Jara Plot
3.59E-01 1.67E-03 4.45E-02 2.11E-01 5.92E-01 2.82E-03 3.41E-02 1.25E-01
5.09E+00 2.37E-02 6.31E-01 2.99E+00 1.55E+00 7.41E-03 8.97E-02 3.28E-01
Burned La
Jara
Catchment
3.35E+04 1.56E+02 4.16E+03 1.97E+04 6.99E+04 7.58E-01 9.18E+00 3.36E+01
4.75E+05 1.60E+03 4.26E+04 2.01E+05 1.84E+05 1.99E+00 2.41E+01 8.83E+01
Unburned
La Jara Plot
1.62E-01 3.34E-04 1.86E-02 4.52E-02 1.18E-01 4.69E-04 1.77E-03 6.89E-02
1.41E+00 2.90E-03 1.62E-01 3.93E-01 1.31E-01 5.24E-04 1.98E-03 7.70E-02
Unburned
La Jara
Catchment
4.90E+03 1.01E+01 5.61E+02 1.36E+03 1.39E+04 1.26E-01 4.76E-01 1.85E+01
4.25E+04 1.95E+02 1.09E+04 2.65E+04 1.55E+04 1.41E-01 5.33E-01 2.07E+01
45
8. REFERENCES
Aakala, T., Kuuluvainen, T., Gauthier, S., De Grandpre, L. 2008. Standing dead trees and their
decay-class dynamics in the northeastern boreal old-growth forests of Quebec. Forest Ecology
and Management, 255, 410-420.
Aboal, J. R., Morales, D., Hernández, M., & Jiménez, M. S. (1999). The measurement and
modelling of the variation of stemflow in a laurel forest in tenerife, canary islands.Journal of
Hydrology, 221(3), 161-175. doi:10.1016/S0022-1694(99)00086-4
Adams, D. K., & Comrie, A. C. (1997). The north american monsoon. Bulletin of the American
Meteorological Society,78(10), 2197-2213. doi:10.1175/1520-
0477(1997)078<2197:TNAM>2.0.CO;2
Angers, V. A., Drapeau, P., Bergeron, Y. 2010. Snag degradation pathways of four North
American boreal tree species. Forest Ecology and Management, 259, 246-256.
Benham, S. 2007, UK forest monitoring system. Forest Commission: Forest Research, Retrieved
April 2014, from http://www.forestry.gov.uk/
Broxton, P. D., Troch, P. A., Lyon, S. W., Stockholms universitet, Naturvetenskapliga
fakulteten, & Institutionen för naturgeografi och kvartärgeologi (INK). (2009). On the role of
aspect to quantify water transit times in small mountainous catchments. Water Resources
Research, 45(8), W08427. doi:10.1029/2008WR007438
Cade, B. S. (1997). Comparison of tree basal area and canopy cover in habitat models: Subalpine
forest. The Journal of Wildlife Management, 61(2), 326-335.
Certini, G. (January 01, 2005). Effects of fire on properties of forest soils: a
review.Oecologia, 143, 1, 1-10.
Chorover, J., Vitousek, P. M., Everson, D. A., Esperanza, A. M., & Turner, D. (1994). Solution
chemistry profiles of mixed-conifer forests before and after fire. Biogeochemistry,26(2), 115-
144. doi:10.1007/BF02182882
Dasch, A. A., Blum, J. D., Eagar, C., Fahey, T. J., Driscoll, C. T., & Siccama, T. G. (2006). The
relative uptake of ca and sr into tree foliage using a whole-watershed calcium
addition. Biogeochemistry, 80(1), 21-41. doi:10.1007/s10533-005-6008-z
Dezzeo, N., & Chacón, N. (2006). Nutrient fluxes in incident rainfall, throughfall, and stemflow
in adjacent primary and secondary forests of the gran sabana, southern venezuela.Forest Ecology
and Management, 234(1), 218-226. doi:10.1016/j.foreco.2006.07.003
Ebel, B. A., & Mirus, B. B. (2014). Disturbance hydrology: Challenges and
opportunities. Hydrological Processes,28(19), 5140-5148. doi:10.1002/hyp.10256
46
Field, J. P., Breshears, D. D., Law, D. J., Villegas, J. C., López-Hoffman, L., Brooks, P. D.. .
Troch, P. A. (2015). Critical zone services: Expanding context, constraints, and currency beyond
ecosystem services. Vadose Zone Journal, 14(1) doi:10.2136/vzj2014.10.0142
Frost, E. E., & Levia, D. F. (2014). Hydrologic variation of stemflow yield across co‐occurring
dominant canopy trees of varying mortality. Ecohydrology, 7(2), 760-770. doi:10.1002/eco.1397
Germer, S., Neill, C., Krusche, A. V., Neto, S. C. G., & Elsenbeer, H. (2007). Seasonal and
within-event dynamics of rainfall and throughfall chemistry in an open tropical rainforest in
rondônia, brazil. Biogeochemistry, 86(2), 155-174. doi:10.1007/s10533-007-9152-9
Germer, S., Zimmermann, A., Neill, C., Krusche, A. V., & Elsenbeer, H. (2012).
Disproportionate single-species contribution to canopy-soil nutrient flux in an amazonian
rainforest. Forest Ecology and Management, 267, 40-49. doi:10.1016/j.foreco.2011.11.041
Hanchi, A., & Rapp, M. 1997, Stemflow determination in forest stands. Forest Ecology and
Management, 97:3, 231-235.
Hauck, M., Hesse, V., & Runge, M. (2002). The significance of stemflow chemistry for
epiphytic lichen diversity in a dieback-affected spruce forest on mt brocken, northern
germany. The Lichenologist, 34(5), 415-427. doi:10.1006/lich.2002.0415
Huckle, D. M., Lin, M., McIntosh, J., Rasmussen, C., & Chorover, J. (In Review). U-series
isotopic signatures of soils and headwater streams in a semi-arid complex volcanic terrain.
Chemical Geology
Joint Fire Service Program, 2004. Joint Fire Service Program 2003 Business Summary. US
Department of Agriculture, Forest Service, Pacific Northwest Research Station, Seattle, WA,
USA.
Levia, D. F., & E. Frost (2003). A review and evaluation of stemflow literature in the hydrologic
and biogeochemical cycles of forested and agricultural ecosystems, Journal of Hydrology, 274,
1-29.
Levia, D. F., & E. Frost (2006). Variability of throughfall volume and solute inputs in wooded
ecosystems, Progress in Physical Geography, 30(5), 605-632.
Levia, D. F., & S. Germer (2015). A review of stemflow generation dynamics and stemflow-
environment interaction in forests and shrublands, Review Geophysics, 53, 673-714.
doi:10.1002/2015RG000479.
Li, Y.C., A. K. Alva, D. V. Calvert & M. Zhang, 1997, Chemical composition of throughfall and
stemflow from citrus canopies. Journal of Plant Nutrition, 20:10, 1351-1360.
Lujan, Lawrence. (2013, June, 27). Thompson Ridge BAER Assessment Update. Retrieved from
http://www.fs.usda.gov
47
Miller, E.K., Blum, J.D., & Friedland, A.J. (1993). Determination of soil exchangeable-cation
loss and weathering rates using Sr isotopes. Nature, 362, 438-441.
Molina, A. J., & del Campo, A. D. (2012). The effects of experimental thinning on throughfall
and stemflow: A contribution towards hydrology-oriented silviculture in aleppo pine
plantations. Forest Ecology and Management, 269, 206-213. doi:10.1016/j.foreco.2011.12.037
MTBS. Individual Fire-Level Geospatial Data. Retrieved from
http://mtbs.gov/data/individualfiredata.html
Nezat, C. A., Blum, J. D., & Driscoll, C. T. (2010). Patterns of Ca/Sr and 87Sr/86Sr variation
before and after a whole watershed CaSiO3 addition at the hubbard brook experimental forest,
USA. Geochimica Et Cosmochimica Acta, 74(11), 3129-3142. doi:10.1016/j.gca.2010.03.013
Nutri-Facts-North American Edition. (2015). Retrieved from http://www.ipni.net/nutrifacts-
northamerican
Perdrial, J. N., McIntosh, J., Harpold, A., Brooks, P. D., Zapata-Rios, X., Ray, J., . . . Chorover,
J. (2014). Stream water carbon controls in seasonally snow-covered mountain catchments:
Impact of inter-annual variability of water fluxes, catchment aspect and seasonal processes.
Biogeochemistry, 118(1), 273-290. doi:10.1007/s10533-013-9929-y
Peterson, D. L. & Littell, J. S., 2012, Risk Assessment for Wildfire in the Western United States.
Effects of Climatic Variability and Change on Forest Ecosystems: A Comprehensive Science
Synthesis for the U.S. Forest Sector, General Technical Report PNW-GTR-870, 253-255.
Pyatt, F. B. (1992). Nutrient mobilization from vegetation: Stemflow and canopy
throughfall. Environmental Management and Health, 3(4), 26.
Raison, R. J. (1980). A review of the role of fire in nutrient cycling in australian native forests,
and of methodology for studying the fire-nutrient interaction. Austral Ecology, 5(1), 15-21.
doi:10.1111/j.1442-9993.1980.tb01227.x
Raison, R. J., Khanna, P. K., & Woods, P. V. (1985). Transfer of elements to the atmosphere
during low-intensity prescribed fires in three australian subalpine eucalypt forests. Canadian
Journal of Forest Research, 15(4), 657-664. doi:10.1139/x85-107
Ranalli, A. J., Geological Survey (U.S.), United States., & Fort Collins (Colo.). (2004). A
summary of the scientific literature on the effects of fire on the concentration of nutrients in
surface waters. Reston, Va.: U.S. Geological Survey.
Smith, H. G., Sheridan, G. J., Lane, P. N. J., Nyman, P., & Haydon, S. (2011). Wildfire effects
on water quality in forest catchments: A review with implications for water supply.Journal of
Hydrology, 396(1), 170-192. doi:10.1016/j.jhydrol.2010.10.043
48
Soto, B., & Diaz-Fierros, F. (1997). Soil water balance as affected by throughfall in gorse ( ulex
europaeus, L.) shrubland after burning. Journal of Hydrology, 195(1), 218-231.
doi:10.1016/S0022-1694(96)03232-5
Strigel, G., Ruhiyat, D., Prayitno, D., & Sarmina, S. (1994). Nutrient input by rainfall into
secondary forests in east kalimantan, indonesia. Journal of Tropical Ecology, 10(2), 285-288.
doi:10.1017/S0266467400007951
Swetnam, T., & Falk, D. (2014). Application of metabolic scaling theory to reduce error in local
maxima tree segmentation from aerial LiDAR. Forest Ecology and Management, 323, 158-167.
doi:10.1016/j.foreco.2014.03.016
Swetnam, T., Falk, D., Lynch, A., & Yool, S. (2014). Estimating individual tree mid- and
understory rank-size distributions from airborne laser scanning in semi-arid forests. Forest
Ecology and Management, 330, 271-282. doi:10.1016/j.foreco.2014.07.011
Thimonier, A. (1998). Measurement of Atmospheric Deposition Under Forest Canopies: Some
Recommendations for Equipment and Sampling Design. Environmental Monitoring and
Assessment, 52:3, 353-387.
Trinh, D. H., & Chui, T. F. M. (2013). An empirical method for approximating canopy
throughfall. Hydrological Processes, 27(12), 1764-1772. doi:10.1002/hyp.9332
Ulrich, B. (1983). Forest Ecosystem Stability and Acid Deposition. In Effects of Accumulation of
Air Pollutants in Forest Areas (pp. 25-26). Boston, MA: D. Reidel Publishing Company.
USDA-FSA Aerial Photography Field Office, National Agriculture Imagery Program. (2009).
Sandoval County, NM. [Images].
Vazquez-Ortega, A., Perdrial, J., Harpold, A., Zapata-Rios, X., Rasmussen, C., McIntosh, J., . . .
Chorover, J. (2015). Rare earth elements as reactive tracers of biogeochemical weathering in
forested rhyolitic terrain. Chemical Geology, 391, 19-32. doi:10.1016/j.chemgeo.2014.10.016
Vega, J. A., Fernández, C. and Fonturbel, T. (2005), Throughfall, runoff and soil erosion after
prescribed burning in gorse shrubland in Galicia (NW Spain). Land Degrad. Dev., 16: 37–51.
doi: 10.1002/ldr.643
Watters, R. J., & Price, A. G. (1988). The influence of stemflow from standing dead trees on the
fluxes of some ions in a mixed deciduous forest. Canadian Journal of Forest Research, 18(11),
1490-1493. doi:10.1139/x88-229
Westerling, A. L., Hidalgo, H. G., Cayan, D. R., & Swetnam, T. W. (2006). Warming and earlier
spring increase western US forest wildfire activity. science, 313(5789), 940-943.
Williams, M. B. (2004). Investigating the contribution of stemflow to the hydrology of a forest
catchment. University of Southampton.

49
Zapata-Rios, X., McIntosh, J., Rademacher, L., Troch, P. A., Brooks, P. D., Rasmussen, C., &
Chorover, J. (2015). Climatic and landscape controls on water transit times and silicate mineral
weathering in the critical zone. Water Resources Research, doi:10.1002/2015WR017018
Zimmermann, A., Wilcke, W., & Elsenbeer, H. (2007). Spatial and temporal patterns of
throughfall quantity and quality in a tropical montane forest in ecuador. Journal of
Hydrology, 343(1), 80-96. doi:10.1016/j.jhydrol.2007.06.012
50
9. SUPPLEMENTAL MATERIALS
9.1 Supplemental Figures and Tables
Figure 1. Stemflow and throughfall collectors installed in burned and unburned plots.
51
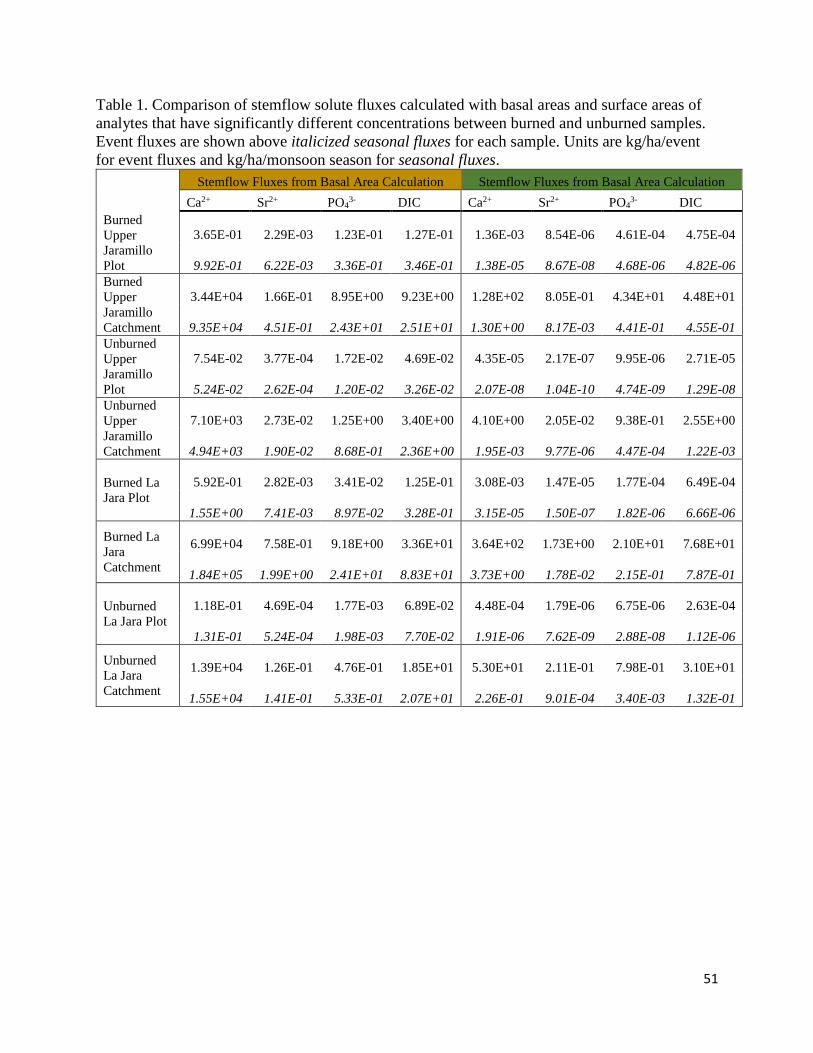
Table 1. Comparison of stemflow solute fluxes calculated with basal areas and surface areas of
analytes that have significantly different concentrations between burned and unburned samples.
Event fluxes are shown above italicized seasonal fluxes for each sample. Units are kg/ha/event
for event fluxes and kg/ha/monsoon season for seasonal fluxes.
Stemflow Fluxes from Basal Area Calculation Stemflow Fluxes from Basal Area Calculation
Ca2+ Sr2+ PO43- DIC Ca2+ Sr2+ PO4
3- DIC
Burned
Upper
Jaramillo
Plot
3.65E-01 2.29E-03 1.23E-01 1.27E-01 1.36E-03 8.54E-06 4.61E-04 4.75E-04
9.92E-01 6.22E-03 3.36E-01 3.46E-01 1.38E-05 8.67E-08 4.68E-06 4.82E-06
Burned
Upper
Jaramillo
Catchment
3.44E+04 1.66E-01 8.95E+00 9.23E+00 1.28E+02 8.05E-01 4.34E+01 4.48E+01
9.35E+04 4.51E-01 2.43E+01 2.51E+01 1.30E+00 8.17E-03 4.41E-01 4.55E-01
Unburned
Upper
Jaramillo
Plot
7.54E-02 3.77E-04 1.72E-02 4.69E-02 4.35E-05 2.17E-07 9.95E-06 2.71E-05
5.24E-02 2.62E-04 1.20E-02 3.26E-02 2.07E-08 1.04E-10 4.74E-09 1.29E-08
Unburned
Upper
Jaramillo
Catchment
7.10E+03 2.73E-02 1.25E+00 3.40E+00 4.10E+00 2.05E-02 9.38E-01 2.55E+00
4.94E+03 1.90E-02 8.68E-01 2.36E+00 1.95E-03 9.77E-06 4.47E-04 1.22E-03
Burned La
Jara Plot
5.92E-01 2.82E-03 3.41E-02 1.25E-01 3.08E-03 1.47E-05 1.77E-04 6.49E-04
1.55E+00 7.41E-03 8.97E-02 3.28E-01 3.15E-05 1.50E-07 1.82E-06 6.66E-06
Burned La
Jara
Catchment
6.99E+04 7.58E-01 9.18E+00 3.36E+01 3.64E+02 1.73E+00 2.10E+01 7.68E+01
1.84E+05 1.99E+00 2.41E+01 8.83E+01 3.73E+00 1.78E-02 2.15E-01 7.87E-01
Unburned
La Jara Plot
1.18E-01 4.69E-04 1.77E-03 6.89E-02 4.48E-04 1.79E-06 6.75E-06 2.63E-04
1.31E-01 5.24E-04 1.98E-03 7.70E-02 1.91E-06 7.62E-09 2.88E-08 1.12E-06
Unburned
La Jara
Catchment
1.39E+04 1.26E-01 4.76E-01 1.85E+01 5.30E+01 2.11E-01 7.98E-01 3.10E+01
1.55E+04 1.41E-01 5.33E-01 2.07E+01 2.26E-01 9.01E-04 3.40E-03 1.32E-01