Embed Size (px)
Citation preview
October 2016 v Volume 7(10) v Article e014781 v www.esajournals.org
Wildfire impacts on California spotted owl nesting habitat in the Sierra Nevada
Scott L. Stephens,1,† Jay D. Miller,2 Brandon M. Collins,3,4 Malcolm P. North,3 John J. Keane,3 and Susan L. Roberts5
1Division of Ecosystem Science, Department of Environmental Science, Policy, and Management, University of California, 130 Mulford Hall, Berkeley, California 94720 USA
2USDA Forest Service, Pacific Southwest Region, Fire and Aviation Management, McClellan, California 95652 USA3Pacific Southwest Research Station, USDA Forest Service, Davis, California 95618 USA
4Center for Fire Research and Outreach, University of California, Berkeley, California 94720 USA5University of California, Merced, Sierra Nevada Research Station, 7799 Chilnualna Falls Road, Wawona, California 95389 USA
Citation: Stephens, S. L., J. D. Miller, B. M. Collins, M. P. North, J. J. Keane, and S. L. Roberts. 2016. Wildfire impacts on California spotted owl nesting habitat in the Sierra Nevada. Ecosphere 7(10):e01478. 10.1002/ecs2.1478
Abstract. California spotted owls (CSOs) (Strix occidentalis occidentalis) have received significant conser-vation attention beginning with the U.S. Forest Service interim management guidelines in 1992. The most commonly reported forest habitat feature for successful nesting habitat of CSO is canopy cover > 70%. Loss and degradation of Sierra Nevada CSO habitat, however, has been a growing concern, initially from commercial tree harvesting and, more recently, from wildfire. This study examined trends in wildfire im-pacts on potential nesting habitat of the CSO and discusses different management approaches that might lead to the conservation of CSO in fire- dependent forests. A total of 85,046 ha of CSO potential nesting habitat was burned by fire that resulted in ≥ 50% tree basal area (BA) mortality, reducing canopy cover on average to < 25%, during 2000–2014; this included 2.7%, 12.3%, and 7.6% of dense red fir (Abies magnifica), eastside pine, and westside forests, respectively. Based on regression predictions, within the next 75 yr, the cumulative amount of nesting habitat burned at ≥ 50% tree basal area mortality will exceed the total existing habitat. Four management strategies are discussed that could enhance the conservation of the CSO: (1) increased fire suppression, (2) strategically reducing fire hazards using mechanical treatments and/or prescribed fire, (3) increasing the amount of managed wildfire in CSO habitat, and (4) developing a landscape strategy that uses historical forest structure information to identify areas where high- canopy cover forests are more sustainable. Our estimates of how moderate- and high- severity fire may affect for-ests into the future poise a substantial threat to CSO persistence. More comprehensive forest restoration activities may be needed in CSO habitat to avoid significant losses of older forests.
Key words: coarse filter; conservation; fine–filter; Jeffrey pine; mixed conifer forests; ponderosa pine; prescribed fire; restoration; wildfire.
Received 24 November 2015; revised 10 June 2016; accepted 21 June 2016. Corresponding Editor: F. Biondi. Copyright: © 2016 Stephens et al. This is an open access article under the terms of the Creative Commons Attribution License, which permits use, distribution and reproduction in any medium, provided the original work is properly cited.† E-mail: [email protected]
IntroductIon
The California spotted owl (CSO) (Strix occi-dentalis occidentalis) has been a species of concern in the Sierra Nevada for decades due to its associ-ation with high- canopy cover forests dominated by large trees (Bias and Gutiérrez 1992, Verner
et al. 1992). The U.S. Forest Service (USFS) has implemented and amended several management guidelines to retain and promote the develop-ment of key habitat features for the CSO (Verner et al. 1992, USDA- FS 2001, 2004). A commonly reported forest habitat feature for successful nesting habitat of CSO is forest canopy cover
October 2016 v Volume 7(10) v Article e014782 v www.esajournals.org
STEPhENS ET AL.
> 70% (North et al. 2000, Phillips et al. 2010), which has recently been suggested to be limiting owl populations in several areas (Tempel et al. 2014a, 2015). In response to recent concerns over potentially declining CSO populations (Conner et al. 2013, Tempel et al. 2014b), the USFS is considering expanding current requirements for high- canopy cover forest habitat. however, this potential expansion may conflict with large- scale forest restoration efforts (Burnett and Roberts 2015) which are guided by historical reconstruc-tions. Recent landscape- level forest reconstruc-tions in the Sierra Nevada demonstrated much lower overall canopy cover in pine- dominated, mixed conifer forests before fire suppression and harvesting became common practices (Scholl and Taylor 2010, Collins et al. 2015, Stephens et al. 2015).
historical fire regimes in the majority of CSO habitat have been characterized by fires burn-ing at low–moderate intensity at intervals of 5–20 yr (Skinner and Chang 1996, Stephens and Collins 2004, Taylor and Beaty 2005, Scholl and Taylor 2010), although some relatively small high- severity patches historically occurred in these forests (Stephens et al. 2015). however, a century of fire exclusion and forest harvest-ing has disrupted historical fire regimes and led to increases in the frequency of large fires (Westerling et al. 2006, Dennison et al. 2014), as well as increased area burned by high- severity fire (Miller et al. 2009b, Miller and Safford 2012, Mallek et al. 2013). Climate change is antici-pated to further increase fire activity in the Sierra Nevada (Westerling and Bryant 2008, Liu et al. 2013), and this could substantially impact CSO nesting habitat.
Initial concern for the habitat of the CSO was related to forest harvesting practices primar-ily on USFS lands (Verner et al. 1992), but more recently the impacts of wildfire on its habi-tat are being examined (Tempel et al. 2015). Although some wildlife species are adapted to high- severity fire (Fontaine and Kennedy 2012), other species, particularly those associated with old- forest characteristics, may be negatively impacted by changes in vegetation structure and composition resulting from large patches of high- severity fire (Roberts et al. 2015, Tempel et al. 2015, Jones et al. 2016a). In response to cur-rent and projected increases in wildfire size and
severity, forest restoration treatments, which include mechanical thinning and prescribed burning, have been recommended across large landscapes (Ager et al. 2007, 2010, 2013, North et al. 2009). Restoration treatments are designed not only to reduce extreme fire behavior, but also to enhance ecosystem resilience and sustainabil-ity given likely future climatic and drought con-ditions (Allen et al. 2002). The USFS is currently developing new plans for each National Forest. In California, the conflict between reducing fuels and stem densities, and providing high- canopy cover, multilayered, large tree nesting habitat is a fundamental management problem by which plans will be evaluated and potentially litigated.
A closely related subspecies, the northern spot-ted owl (Strix occidentalis caurina) (NSO) is feder-ally listed as “threatened” due to habitat loss and fragmentation. Research has documented that the most degraded coniferous forest ecosystems within the NSO’s range are the old- growth forests and landscapes of the dry provinces (Spies et al. 2006). Similar to the CSO, the historical structure and function of dry NSO forests have been exten-sively altered by fire exclusion, increasing tree densities and canopy cover, and the abundance of large snags and logs that might otherwise have been consumed by frequent burns (Everett et al. 1997, hagmann et al. 2014, hessburg et al. 2015). New structural definitions of old- growth forest types are needed that recognize their eco-logical variability and provide a vision of desired future conditions at multiple spatial and tempo-ral scales (Spies et al. 2006, Kaufmann et al. 2007, Perry et al. 2011, Franklin and Johnson 2012, hessburg et al. 2015, 2016). Furthermore, these desired conditions should be consistent with the historical fire regimes of the different forest types with which spotted owls are associated (Stephens et al. 2013).
In Yosemite National Park where managers are reintroducing fire to the landscape and re- establishing natural fire regimes, there was no significant difference in CSO site occupancy between sites burned under the natural fire regime (i.e., predominately low- to moderate- severity fires) and unburned or fire- suppressed sites (Roberts et al. 2011). Studies on USFS lands have also reported no effect of mixed- severity fire on CSO site occupancy, fidelity, or reproduc-tive success (Bond et al. 2002, Lee et al. 2012).
October 2016 v Volume 7(10) v Article e014783 v www.esajournals.org
STEPhENS ET AL.
Studies are less conclusive regarding the effects of high- severity fire on CSO. Thresholds have been reported where no effects of high- severity fire occurred when 0–50 ha of habitat within 203- ha core areas burned at high- severity fire, with extirpation increasing with rising amounts of habitat burned at high- severity fire above the 50- ha threshold (Lee et al. 2013). While recent studies suggest CSOs are able to occupy sites in some burned landscapes, key uncertainties per-sist regarding the effects of the amounts and spa-tial patterns of fire of all severities (particularly high severity) on CSO survival, reproduction, and habitat quality, and on the long- term popula-tion density that can be sustained across burned landscapes.
The objectives of this study are to examine trends in wildfire impacts on potential nesting habitat of the CSO. Specifically, we examine three questions: (1) how much potential nesting habi-tat was significantly burned from 2000 to 2014? (2) how were these impacts distributed between different vegetation/habitat types and U.S. National Forests? (3) Using models based on cur-rent trends, how much habitat may be impacted over the next century? Finally, using this infor-mation we discuss different management strate-gies that might reduce these impacts and lead to the conservation of CSO nesting habitat in fire- dependent forests.
Study areaThis study focused on U.S. National Forests
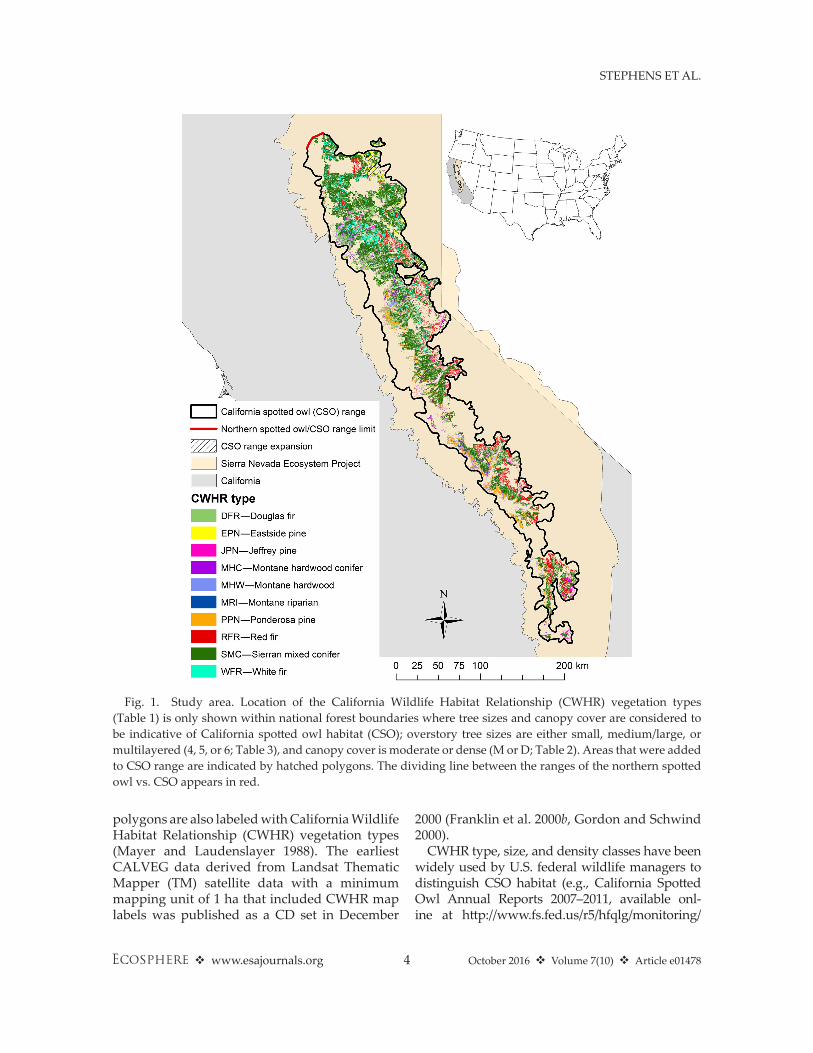
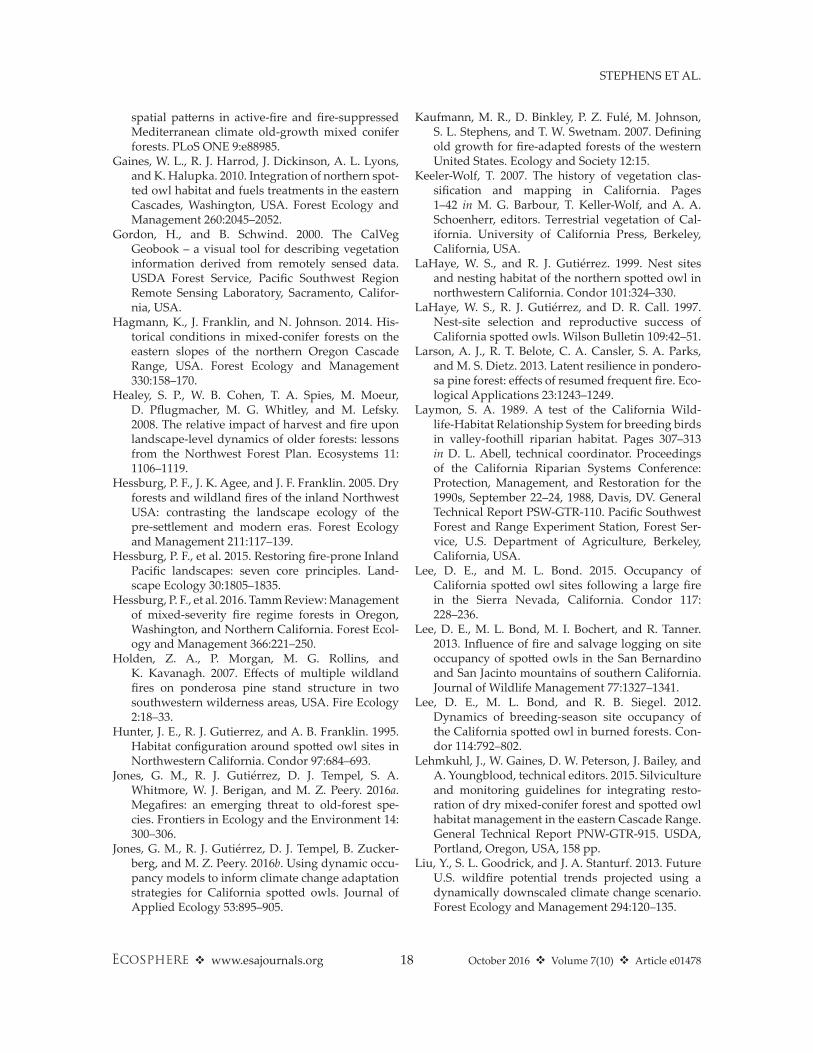
within the Sierra Nevada Ecosystem Project (SNEP) area managed under the Sierra Nevada Forest Plan Amendment (SNFPA) (Fig. 1) (USDA- FS 2004). The study area not only includes the Sierra Nevada and its foothills but also the Warner Mountains, Modoc Plateau, White Mountains, Inyo Mountains, and portions of the southern Cascades. The climate is Mediterranean, with warm, dry summers and cool, wet winters, in which nearly all precipitation falls between October and April (Minnich 2007). Forest vegeta-tion is diverse, with different dominant species and high variation in density and vertical struc-ture dependent upon past management, topogra-phy, fire, soils, and latitude (North et al. 2016).
Our study focused primarily on forest types that comprise CSO habitat within the study area (Table 1, Fig. 1; Mayer and Laudenslayer 1988,
Blakesley et al. 2010). Ponderosa pine (Pinus ponderosa Lawson & C. Lawson) forests and woodlands dominate lower elevations (300 m to about 1800 m in the northern study area, and about 1200–2100 m in the southern study area), but various hardwood species including can-yon live oak (Quercus chrysolepis Liebm.), inte-rior live oak (Q. wislizenii A. DC.), and tanoak (Notholithocarpus densiflorus [hook. & Arn.]) also occur. At intermediate elevations, mixed conifer forests dominate with three or more codominant conifer species, including various mixtures of ponderosa pine, Jeffrey pine (P. jef-freyi Balf.), sugar pine (P. lambertiana Douglas), white fir (Abies concolor [Gord. & Glend.] Lindl. ex hildebr.), incense cedar (Calocedrus decurrens [Torr.] Florin), and Douglas fir (Pseudotsuga men-ziesii [Mirb.] Franco), including hardwoods such as California black oak (Q. kelloggii Newberry) and canyon live oak. Jeffrey pine- dominated for-ests occur mostly between 1500 and 2400 m in the northern study area and from 1700 to 2800 m in the southern study area (Barbour and Minnich 2000, Fites- Kaufman et al. 2007). A large area east of the Sierra Nevada crest supports a mixed yellow pine forest codominated by ponderosa and Jeffrey pine, commonly referred to as “east-side pine”. Red fir (A. magnifica A. Murray bis)- dominated forests generally occur above mixed conifer (2000–2800 m depending on latitude). The boundary between mixed conifer and red fir forests is an important ecological transition that corresponds with the approximate elevation of freezing in mid- winter storms and the elevation of the deepest winter snowpack (Safford and Van de Water 2014).
Methods
VegetationWe used the Classification and Assessment
with Landsat of Visible Ecological Groupings (CALVEG) data produced by the USFS in California as a measurement of prefire vegeta-tion conditions (forest type, canopy cover, tree size class). Technically, CALVEG is a vegetation classification scheme; however, we follow stan-dard practice and also refer to the vegetation map data as CALVEG (Matyas and Parker 1980, Keeler- Wolf 2007, USDA- FS 2014). In addition to being labeled by CALVEG vegetation types, map
October 2016 v Volume 7(10) v Article e014784 v www.esajournals.org
STEPhENS ET AL.
polygons are also labeled with California Wildlife habitat Relationship (CWhR) vegetation types (Mayer and Laudenslayer 1988). The earliest CALVEG data derived from Landsat Thematic Mapper (TM) satellite data with a minimum mapping unit of 1 ha that included CWhR map labels was published as a CD set in December
2000 (Franklin et al. 2000b, Gordon and Sch wind 2000).
CWhR type, size, and density classes have been widely used by U.S. federal wildlife managers to distinguish CSO habitat (e.g., California Spotted Owl Annual Reports 2007–2011, available onl-ine at http://www.fs.fed.us/r5/hfqlg/monitoring/
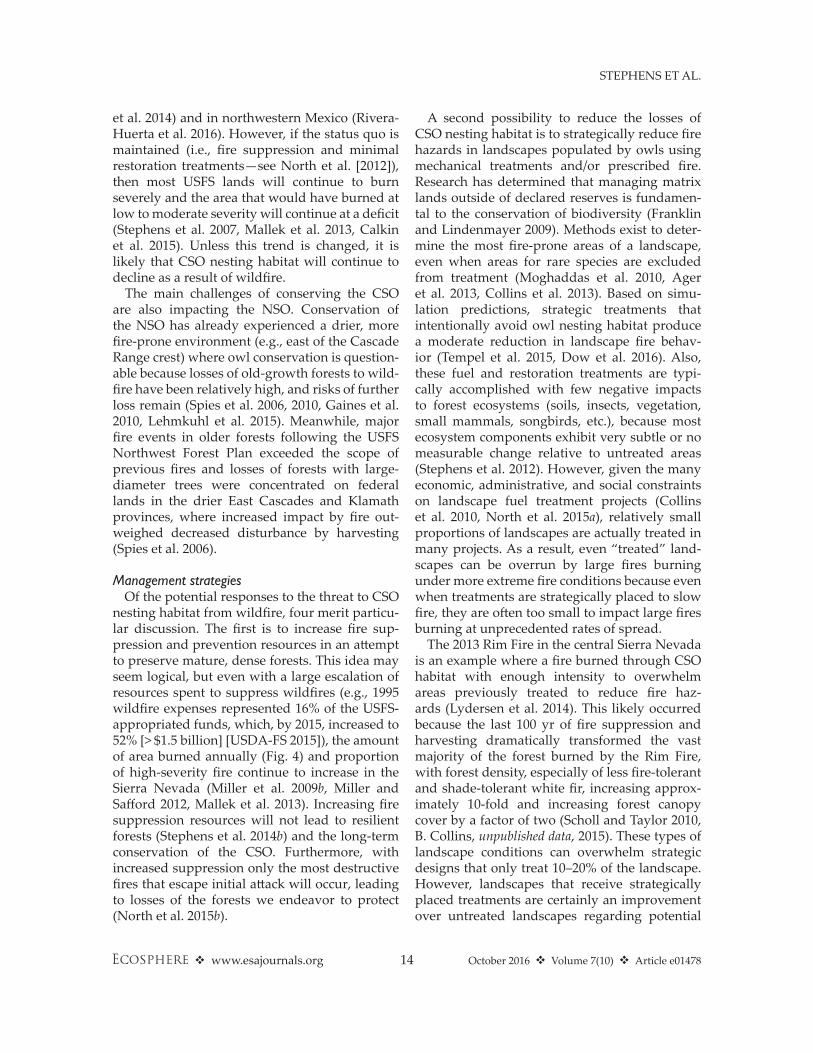
Fig. 1. Study area. Location of the California Wildlife habitat Relationship (CWhR) vegetation types (Table 1) is only shown within national forest boundaries where tree sizes and canopy cover are considered to be indicative of California spotted owl habitat (CSO); overstory tree sizes are either small, medium/large, or multilayered (4, 5, or 6; Table 3), and canopy cover is moderate or dense (M or D; Table 2). Areas that were added to CSO range are indicated by hatched polygons. The dividing line between the ranges of the northern spotted owl vs. CSO appears in red.
October 2016 v Volume 7(10) v Article e014785 v www.esajournals.org
STEPhENS ET AL.
resource_reports/wildlife/; accessed August 2015). Although there are several limitations to the CWhR classification system (Laymon 1989, Purcell et al. 1992, Block et al. 1994, North and Manley 2012), its focus on tree size and canopy cover habitat cat-egories is consistent with the two stand structures most strongly associated with preferred CSO nest-ing habitat (Verner et al. 1992, Tempel et al. 2014a, 2015). Although limited to coarse- resolution cat-egorization of habitat classes, the CWhR system does provide an ecologically relevant classifica-tion for a species focused on large trees and areas of high canopy cover. In this study, we adhere to common practice and define CSO nesting hab-itat using CWhR canopy cover classes M and D (Table 2) and tree size classes 4, 5, and 6 (Table 3).
CSO habitat rangeFor identifying CSO range within the study
area, we started with a CWhR range map and modified it to reflect the Sierra Nevada popula-tion of the CSO subspecies (Fig. 1; Zeiner et al.
1988–1990). First, to separate the California and northern spotted owl subspecies, we divided the map where the neck was the narrowest close to the northwestern boundary of the SNEP area, which is generally consistent with the subspecies boundary suggested between the Pit River and Mount Lassen based on recent genetic analyses (Barrowclough et al. 2011). Second, we slightly expanded the boundaries of the map to include known CSO protected activity centers (PACs) on the eastside of the Lassen and Tahoe National Forests (NF), and the Lake Tahoe Basin Man-agement Unit. The boundary expansions were limited to areas of dense forest habitat identified using aerial photography because of the known association between these forest conditions and nesting locations (North et al. 2000, Tempel et al. 2015).
Fire severityThe fire severity data used in this study came
from the database maintained by the USFS Pacific Southwest Region. The database contains fire severity data for most large wildfires since 1984 that have occurred at least partially on USFS lands in California (available online at http://www.fs.usda.gov/detail/r5/landmanagement/gis/?cid=STELPRDB5327833). For the SNEP study area, the database contains wildfires > 80 ha. All
Table 1. California Wildlife habitat Relationship (CWhR) types included in the study.
Abbreviation TypePrimary
ecological zone
DFR Douglas fir WestsideEPN Eastside pine EastsideJPN Jeffrey pine EastsideMhC Montane
hardwood-coniferWestside
MhW Montane hardwood WestsideMRI Montane riparian N/APPN Ponderosa pine WestsideRFR Red fir Upper elevationSMC Sierran mixed conifer WestsideWFR White fir Westside
Note: N/A, not applicable.
Table 2. California Wildlife habitat Relationship (CWhR) standards for canopy cover.
CWhR code
Canopy cover class
Vegetation cover (canopy cover) (%)
S Sparse 10–25P Open 25–40M Moderate 40–60D Dense ≥ 60
Table 3. California Wildlife habitat Relationship (CWhR) class standards for tree size.
CWhR code Size class Conifer crown diameter (m) hardwood crown diameter (m) dbh (cm)
1 Seedling N/A N/A < 2.52 Sapling N/A < 4.6 2.5–153 Pole < 3.7 4.6–9.1 15–284 Small 3.7–7.3 9.1–13.7 28–615 Medium/large ≥ 7.3 ≥ 13.7 ≥ 616 Multilayered A distinct layer of size class 5 trees over a distinct layer of size class 4 and/or 3 trees,
and total tree canopy cover of the layers ≥ 60% (layers must have ≥ 10% canopy cover and distinctive height separation)
Notes: dbh, diameter at breast height; N/A, not applicable.
October 2016 v Volume 7(10) v Article e014786 v www.esajournals.org
STEPhENS ET AL.
severity data were derived from calibrations of percentage change in tree basal area (BA) to the relativized difference normalized burn ratio (RdNBR) satellite index calculated from 30 m x 30 m pixel Landsat images (Miller and Thode 2007, Miller et al. 2009a, Miller and Quayle 2015,). The RdNBR index was developed to allow inter-fire comparisons of severity by compensating for different prefire vegetation conditions (Miller and Thode 2007). A majority of the RdNBR data used to produce the database was acquired from the Monitoring Trends in Burn Severity (MTBS) (Eidenshink et al. 2007) and Rapid Assessment of VeGetation (RAVG) projects (Miller and Quayle 2015), but the database also contains many fires that were mapped by the USFS Pacific Southwest Region. Before applying the calibrations to create categorical severity data, we applied a focal mean in a 30 m x 30 m pixel (0.81 ha) moving window to the RdNBR index data, which matches the 90 meter diameter of the field plots used to derive the calibrations and reduces the number of single pixel polygons in the database (Miller and Thode 2007, Miller and Quayle 2015). All severity data were converted from raster to polygons using standard geographic information system (GIS) conversion procedures to consolidate individual pixels into homogeneous patches of seven catego-ries of percentage change in tree BA (Table 4).
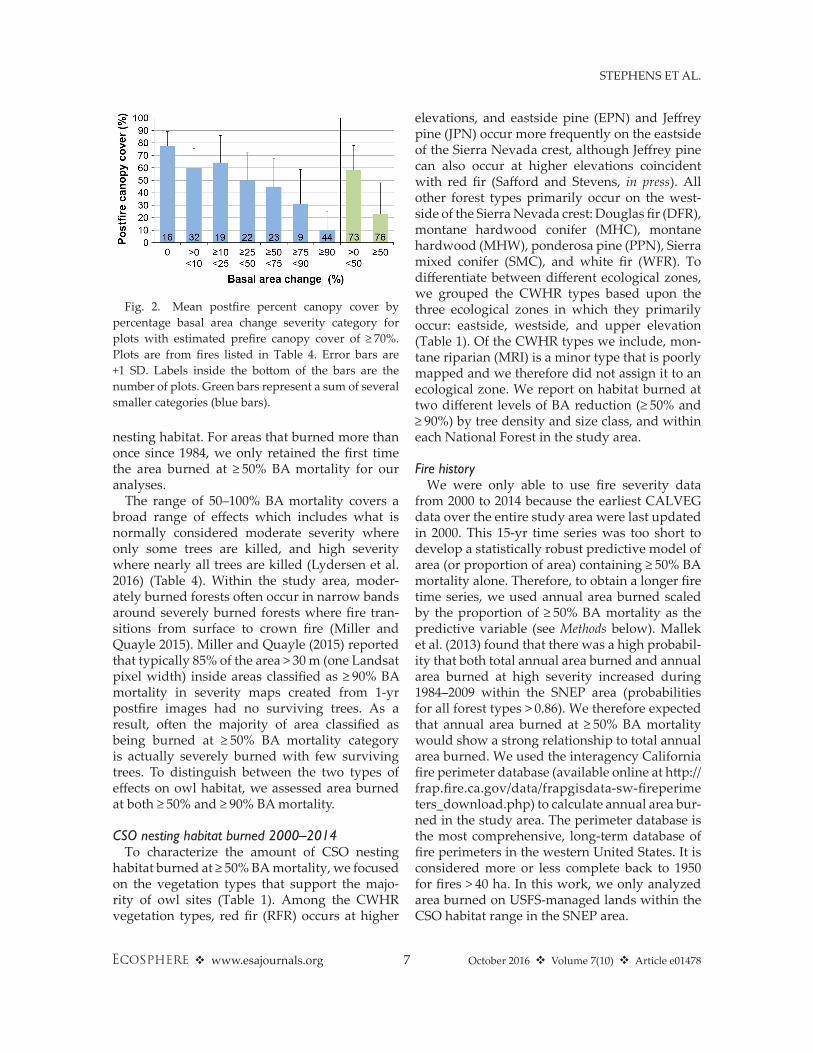
Forest canopy cover > 70% has been found to be most highly related to CSO nesting habitat (North et al. 2000, Phillips et al. 2010, Tempel et al. 2014a, 2015). Therefore, to determine a percentage BA change severity category that would reduce canopy cover below 70%, we examined pre- and postfire canopy cover esti-mates calculated from 1-yr postfire plot data that
were acquired in fires within CSO habitat range (Table 5; Miller et al. 2009a). Plot- level pre- and postfire canopy cover of trees prior to the fire and alive after the fire was previously estimated using the Forest Vegetation Simulator (FVS) for the calibration of RdNBR to percentage change in canopy cover and BA (Dixon 2002, Miller et al. 2009a). Trees were assumed to be alive prior to the fire based upon the presence or absence of dead needles as well as bark and wood consump-tion patterns. FVS uses empirically derived rela-tionships of tree species and diameter at breast height (dbh) to model tree canopies that assume trees are healthy and unaffected by fire or dis-ease. however, fire can modify dbh to canopy architecture relationships by raising crown base height, thereby reducing canopy width.
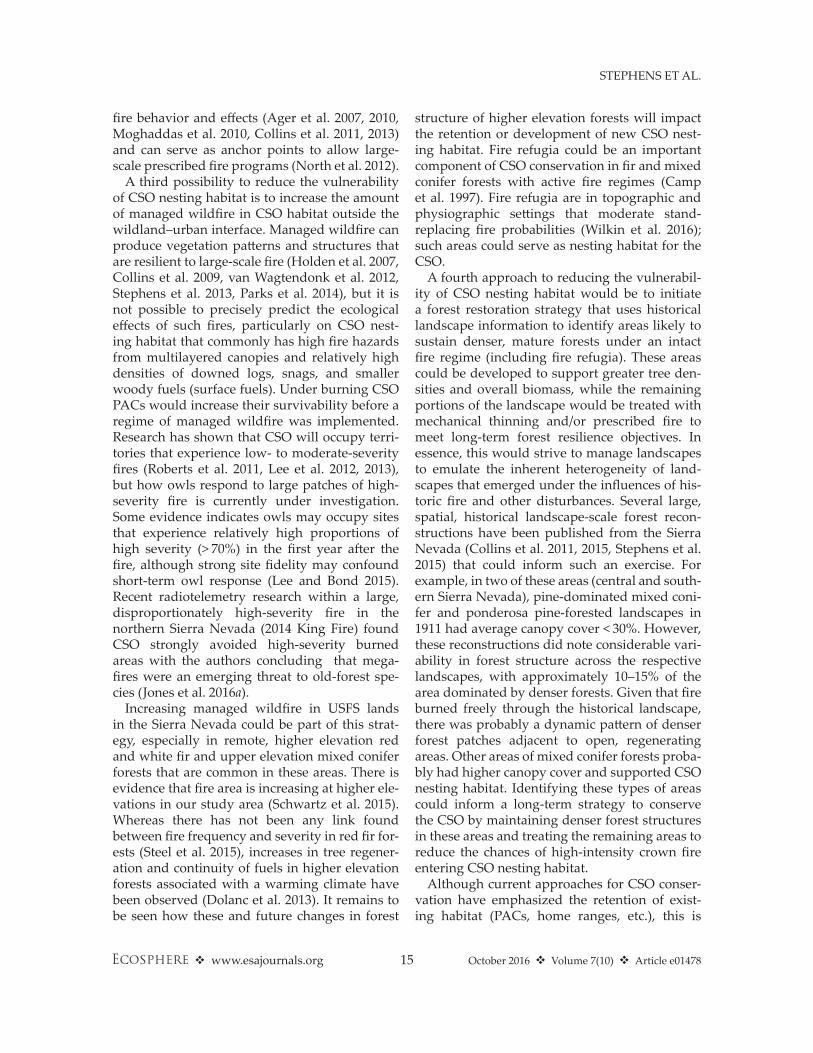
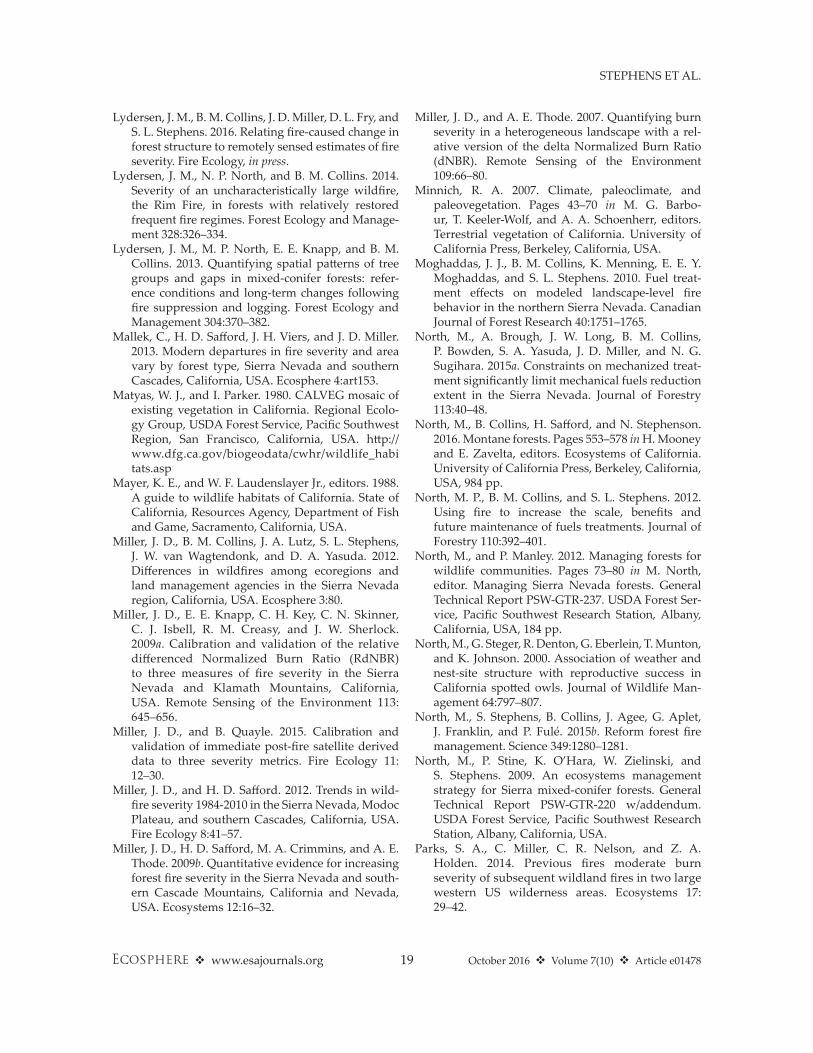
Because there was no way to modify crown width inside FVS to estimate postfire canopy cover, we applied a crown cover correction factor as a function of the percentage of crown volume scorched based upon plot measurements of tree height, scorch height, and crown base height (for details on the correction factor, see Miller et al. [2009a]). We grouped plots that showed an esti-mated ≥ 70% prefire canopy cover into seven cat-egories of percentage change in tree BA as they were mapped in 1-yr postfire severity maps. The mean + 1 SD of postfire canopy cover fell below 70% for severity categories with ≥ 50% BA mortality (Fig. 2). As a conservative estimate, we therefore used areas that were mapped as experiencing ≥ 50% BA mortality within fires to identify areas that would severely impact CSO
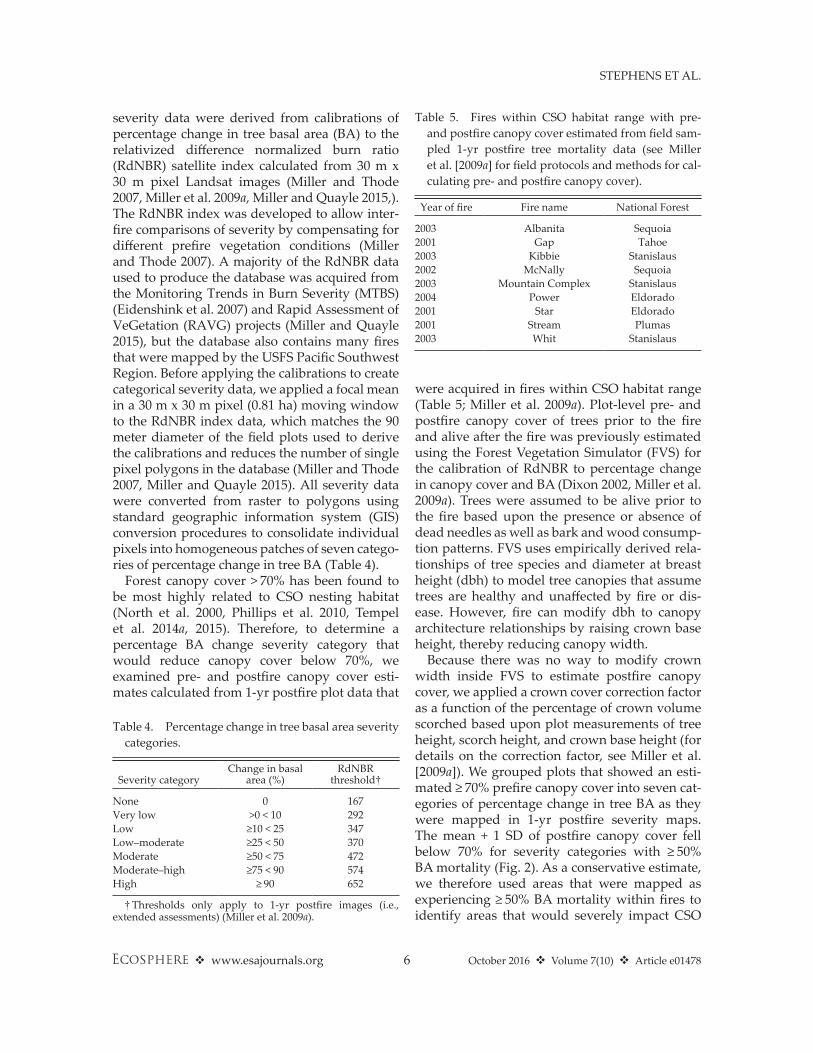
Table 5. Fires within CSO habitat range with pre- and postfire canopy cover estimated from field sam-pled 1-yr postfire tree mortality data (see Miller et al. [2009a] for field protocols and methods for cal-culating pre- and postfire canopy cover).
Year of fire Fire name National Forest
2003 Albanita Sequoia2001 Gap Tahoe2003 Kibbie Stanislaus2002 McNally Sequoia2003 Mountain Complex Stanislaus2004 Power Eldorado2001 Star Eldorado2001 Stream Plumas2003 Whit Stanislaus
Table 4. Percentage change in tree basal area severity categories.
Severity categoryChange in basal
area (%)RdNBR
threshold†
None 0 167Very low >0 < 10 292Low ≥10 < 25 347Low–moderate ≥25 < 50 370Moderate ≥50 < 75 472Moderate–high ≥75 < 90 574high ≥ 90 652
† Thresholds only apply to 1-yr postfire images (i.e., extended assessments) (Miller et al. 2009a).
October 2016 v Volume 7(10) v Article e014787 v www.esajournals.org
STEPhENS ET AL.
nesting habitat. For areas that burned more than once since 1984, we only retained the first time the area burned at ≥ 50% BA mortality for our analyses.
The range of 50–100% BA mortality covers a broad range of effects which includes what is normally considered moderate severity where only some trees are killed, and high severity where nearly all trees are killed (Lydersen et al. 2016) (Table 4). Within the study area, moder-ately burned forests often occur in narrow bands around severely burned forests where fire tran-sitions from surface to crown fire (Miller and Quayle 2015). Miller and Quayle (2015) reported that typically 85% of the area > 30 m (one Landsat pixel width) inside areas classified as ≥ 90% BA mortality in severity maps created from 1-yr postfire images had no surviving trees. As a result, often the majority of area classified as being burned at ≥ 50% BA mortality category is actually severely burned with few surviving trees. To distinguish between the two types of effects on owl habitat, we assessed area burned at both ≥ 50% and ≥ 90% BA mortality.
CSO nesting habitat burned 2000–2014To characterize the amount of CSO nesting
habitat burned at ≥ 50% BA mortality, we focused on the vegetation types that support the majo-rity of owl sites (Table 1). Among the CWhR vegetation types, red fir (RFR) occurs at higher
elevations, and eastside pine (EPN) and Jeffrey pine (JPN) occur more frequently on the eastside of the Sierra Nevada crest, although Jeffrey pine can also occur at higher elevations coincident with red fir (Safford and Stevens, in press). All other forest types primarily occur on the west-side of the Sierra Nevada crest: Douglas fir (DFR), montane hardwood conifer (MhC), montane hardwood (MhW), ponderosa pine (PPN), Sierra mixed conifer (SMC), and white fir (WFR). To differentiate between different ecological zones, we grouped the CWhR types based upon the three ecological zones in which they primarily occur: eastside, westside, and upper elevation (Table 1). Of the CWhR types we include, mon-tane riparian (MRI) is a minor type that is poorly mapped and we therefore did not assign it to an ecological zone. We report on habitat burned at two different levels of BA reduction (≥ 50% and ≥ 90%) by tree density and size class, and within each National Forest in the study area.
Fire historyWe were only able to use fire severity data
from 2000 to 2014 because the earliest CALVEG data over the entire study area were last updated in 2000. This 15-yr time series was too short to develop a statistically robust predictive model of area (or proportion of area) containing ≥ 50% BA mortality alone. Therefore, to obtain a longer fire time series, we used annual area burned scaled by the proportion of ≥ 50% BA mortality as the predictive variable (see Methods below). Mallek et al. (2013) found that there was a high probabil-ity that both total annual area burned and annual area burned at high severity increased during 1984–2009 within the SNEP area (probabilities for all forest types > 0.86). We therefore expected that annual area burned at ≥ 50% BA mortality would show a strong relationship to total annual area burned. We used the interagency California fire perimeter database (available online at http://frap.fire.ca.gov/data/frapgisdata-sw-fireperime ters_download.php) to calculate annual area bur-ned in the study area. The perimeter database is the most comprehensive, long- term database of fire perimeters in the western United States. It is considered more or less complete back to 1950 for fires > 40 ha. In this work, we only analyzed area burned on USFS- managed lands within the CSO habitat range in the SNEP area.
Fig. 2. Mean postfire percent canopy cover by percentage basal area change severity category for plots with estimated prefire canopy cover of ≥ 70%. Plots are from fires listed in Table 4. Error bars are +1 SD. Labels inside the bottom of the bars are the number of plots. Green bars represent a sum of several smaller categories (blue bars).
October 2016 v Volume 7(10) v Article e014788 v www.esajournals.org
STEPhENS ET AL.
Model of area burned at ≥50% BA mortalityWe used ordinary least squares (OLS) regres-
sion to develop a predictive model of area burned at ≥ 50% BA mortality across all CWhR types, sizes, and densities (4, 5, 6, M, D). Although the regression slope of area burned over 2000–2014 was positive [1.8 (square root- transformed)], the regression was not significant (P = 0.48, results not shown). Because we suspected the lack of sig-nificance was due to a small sample size (15 yr) with area burned at > 50% BA mortality, we examined a highly correlated variable (total ann-ual burned area) that has a much longer history (from 1970 to 2014).
Therefore, to develop a predictive model, we used a regression of total annual area burned scaled by the slope of an OLS regression of the square root of area burned at ≥ 50% BA mortal-ity to the square root of annual area burned from 2000 to 2014:
where a = regression slope of area burned at ≥ 50% BA mortality to the total annual area burned from 2000 to 2014 (the intercept was not included in the regression model); b, c = intercept and slope from the annual area burned time series regression.
To calculate 95% confidence intervals, we esti-mated the variance of y using the Delta method:
We approximated the variances and covariances with their estimates:
The approximate 95% confidence intervals for the estimate of area burned at ≥ 50% BA mortality for E(y) are therefore:
We investigated three different time series for the annual area burned regression: 1950–2014, 1970–2014, and 1985–2014. All three time series had significant positive slopes. The 1970–2014 model gave the best fit (R2), and the residuals
were closest to being normally distributed. The slope of the 1970–2014 model was also inter-mediate between the other two models, which is a compromise for under- or overpredicting future effects based on the 1950–2014 or 1985–2014 slopes, respectively. We therefore chose to use annual area burned beginning in 1970 in our regression (i.e., terms b,c in Eq. 1). We used square root transformation for all areas to meet OLS residuals normality assumptions and assumptions of equal variance across time. We performed a Durbin– Watson test to check that the residuals of the time series OLS regression were not autocorrelated (Durbin and Watson 1950, 1951). We performed all statistics in SAS ver. 9.4 (SAS Institute Inc. 2012).
results
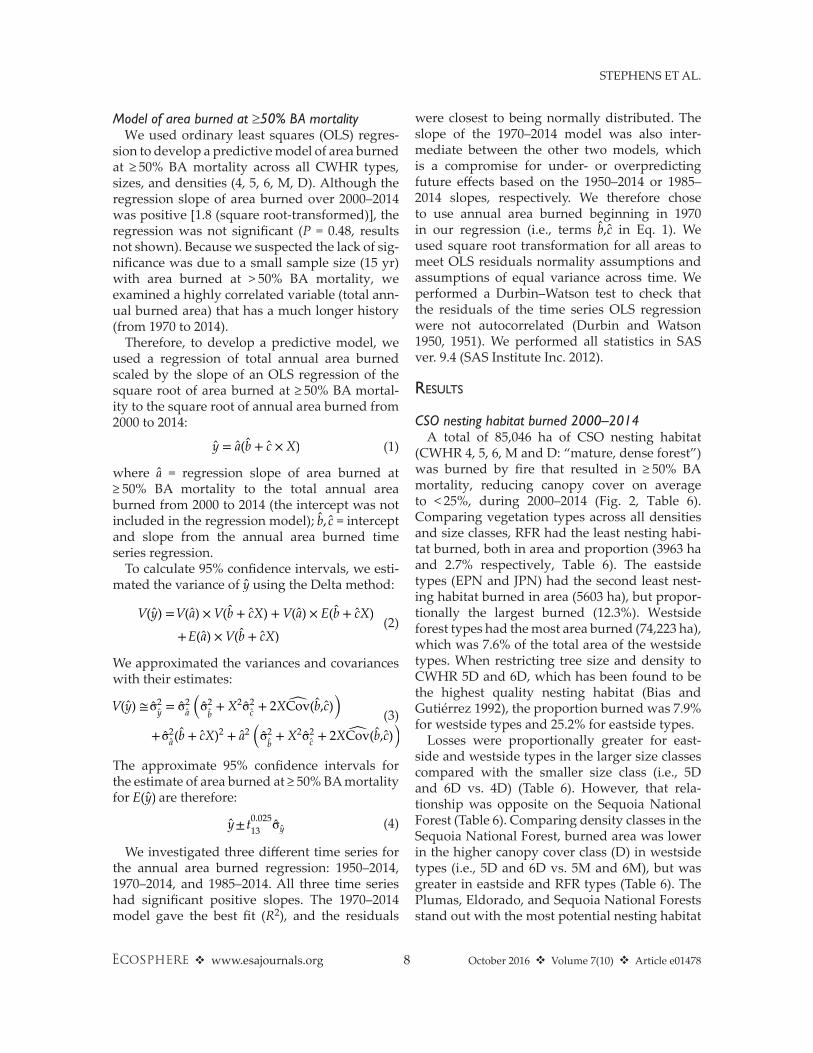
CSO nesting habitat burned 2000–2014A total of 85,046 ha of CSO nesting habitat
(CWhR 4, 5, 6, M and D: “mature, dense forest”) was burned by fire that resulted in ≥ 50% BA mortality, reducing canopy cover on average to < 25%, during 2000–2014 (Fig. 2, Table 6). Comparing vegetation types across all densities and size classes, RFR had the least nesting habi-tat burned, both in area and proportion (3963 ha and 2.7% respectively, Table 6). The eastside types (EPN and JPN) had the second least nest-ing habitat burned in area (5603 ha), but propor-tionally the largest burned (12.3%). Westside forest types had the most area burned (74,223 ha), which was 7.6% of the total area of the westside types. When restricting tree size and density to CWhR 5D and 6D, which has been found to be the highest quality nesting habitat (Bias and Gutiérrez 1992), the proportion burned was 7.9% for westside types and 25.2% for eastside types.
Losses were proportionally greater for east-side and westside types in the larger size classes compared with the smaller size class (i.e., 5D and 6D vs. 4D) (Table 6). however, that rela-tionship was opposite on the Sequoia National Forest (Table 6). Comparing density classes in the Sequoia National Forest, burned area was lower in the higher canopy cover class (D) in westside types (i.e., 5D and 6D vs. 5M and 6M), but was greater in eastside and RFR types (Table 6). The Plumas, Eldorado, and Sequoia National Forests stand out with the most potential nesting habitat
(1)y = a(b + c × X)
(2)V(y) =V(a) × V(b + cX) + V(a) × E(b + cX)
+E(a) × V(b + cX)
(3)V(y) ≅σ
2y = σ
2a
(
σ2b+ X2σ2c + 2X�Cov(b,c)
)
+σ2a(b + cX)
2+ a2
(
σ2b+ X2σ2c + 2X�Cov(b,c)
)
(4)y± t0.02513 σy
October 2016 v Volume 7(10) v Article e014789 v www.esajournals.org
STEPhENS ET AL.
impacted, in both total area and proportion of area (Table 7). The largest area burned at ≥ 50% BA mortality was in westside vegetation types, but the largest proportions were in the eastside types.
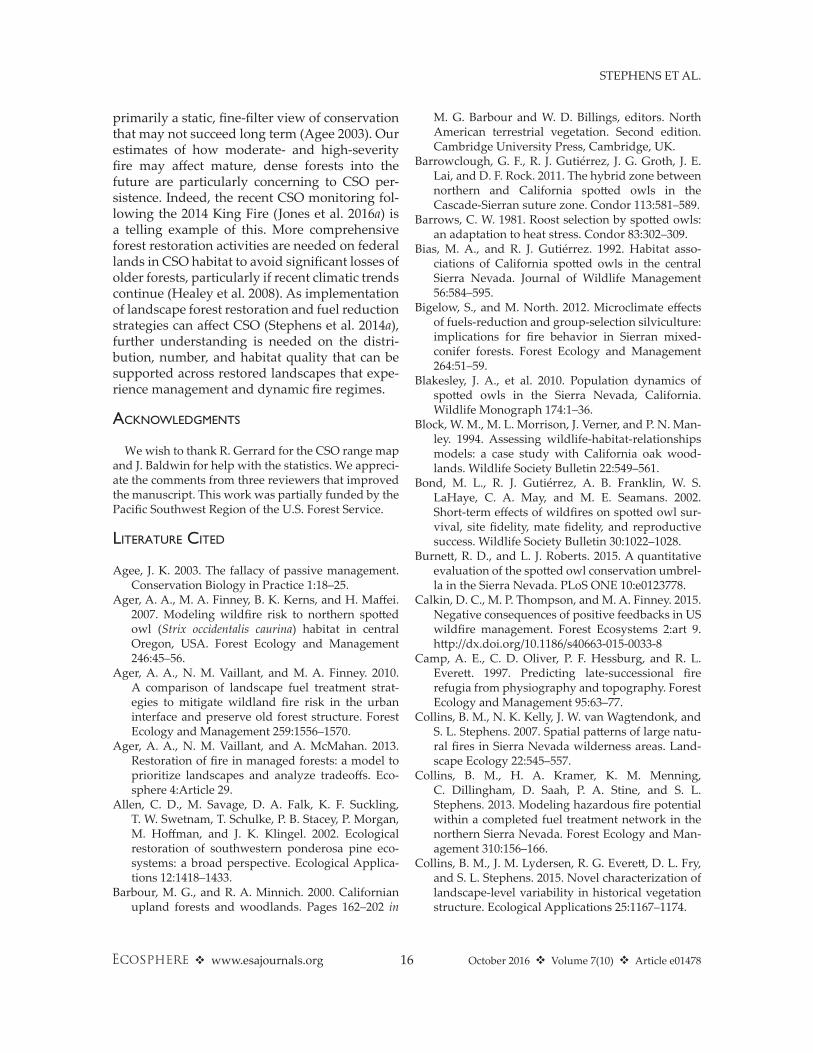
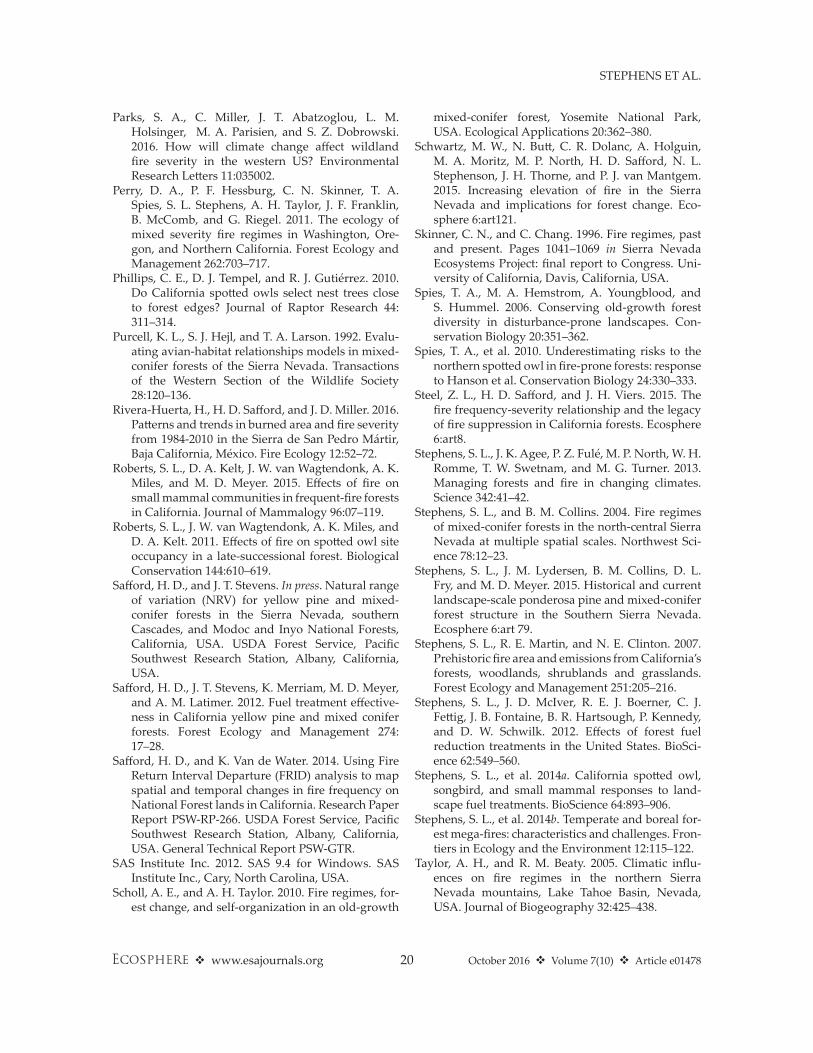
Area burned at ≥50% BA mortalityThere was a strong relationship between
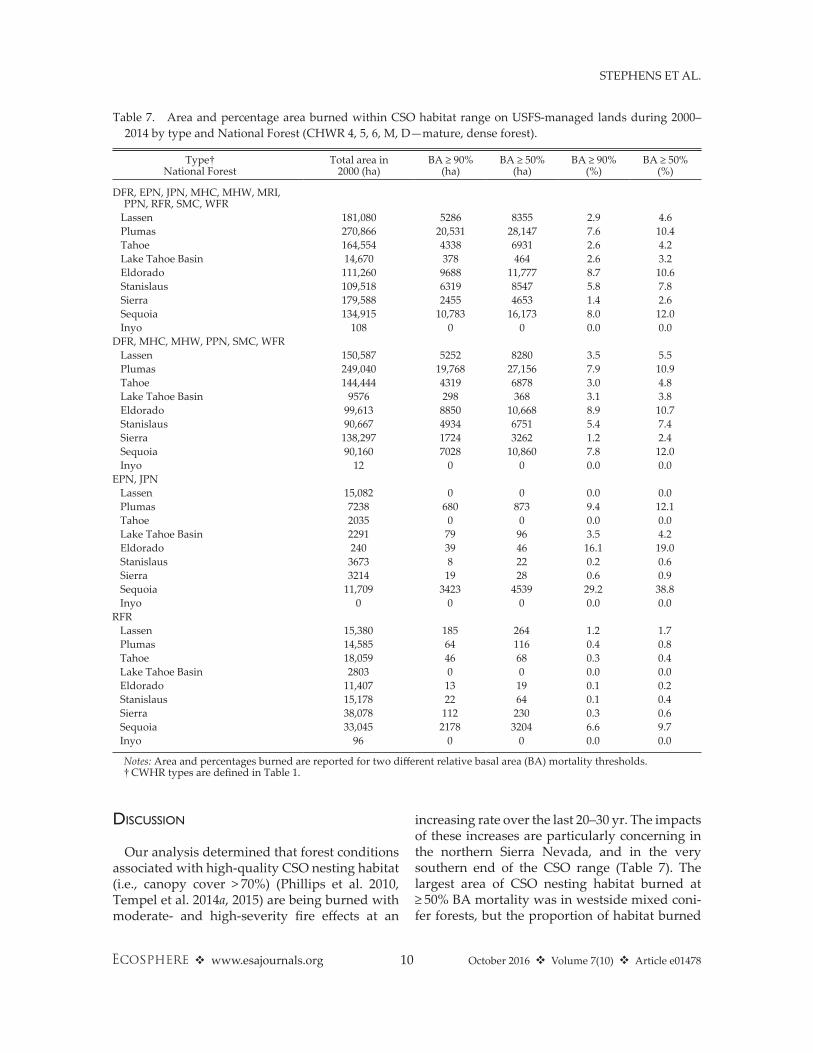
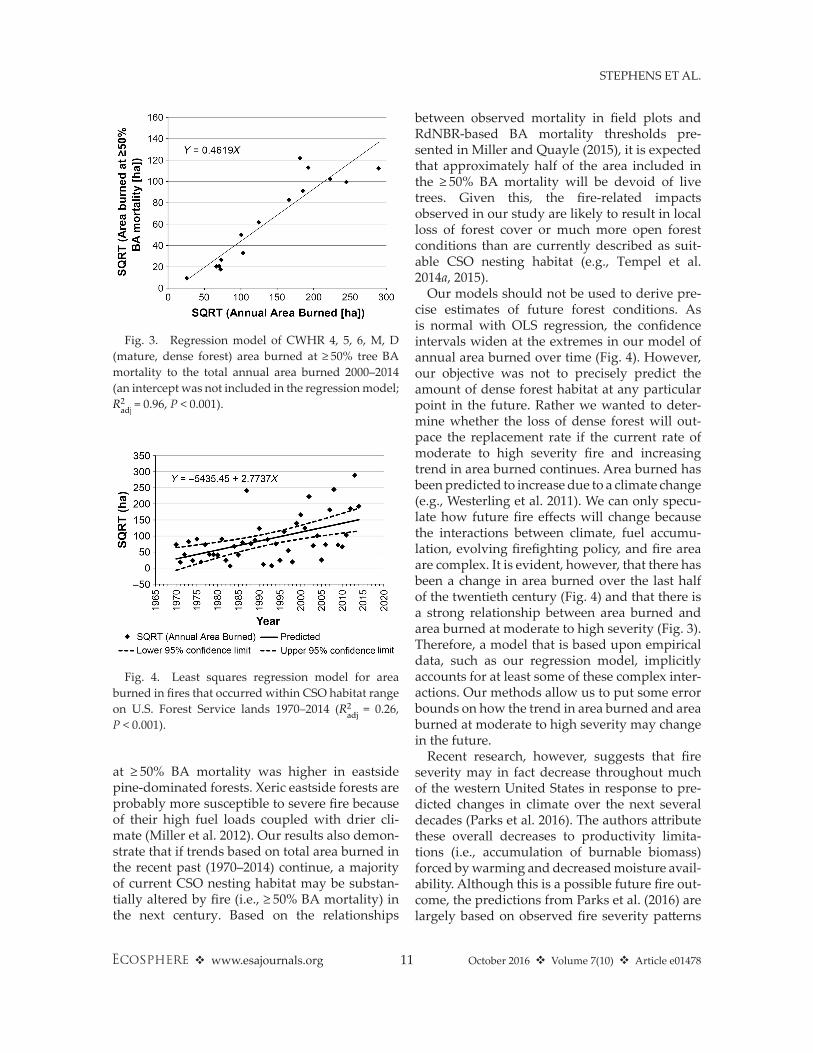
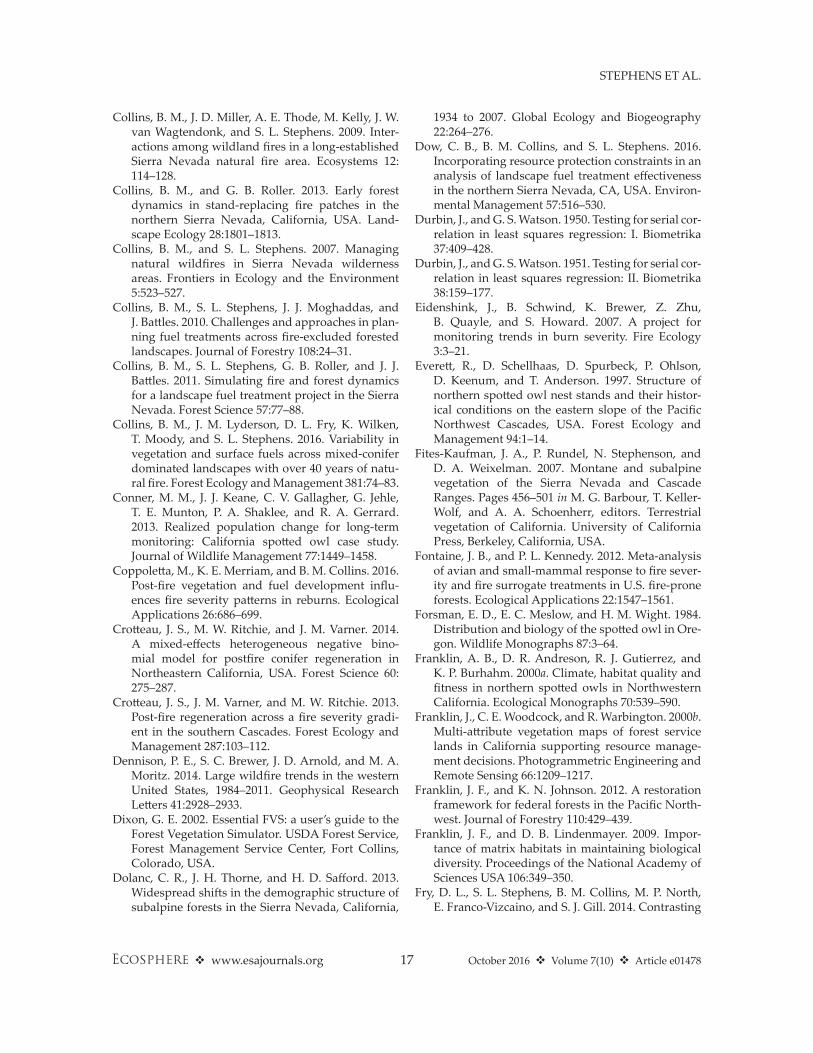
mature, dense forest area burned at ≥ 50% BA mortality and annual area burned (Fig. 3, R2adj = 0.96, P < 0.001). Evaluating annual area burned alone, there was a significant increase over the
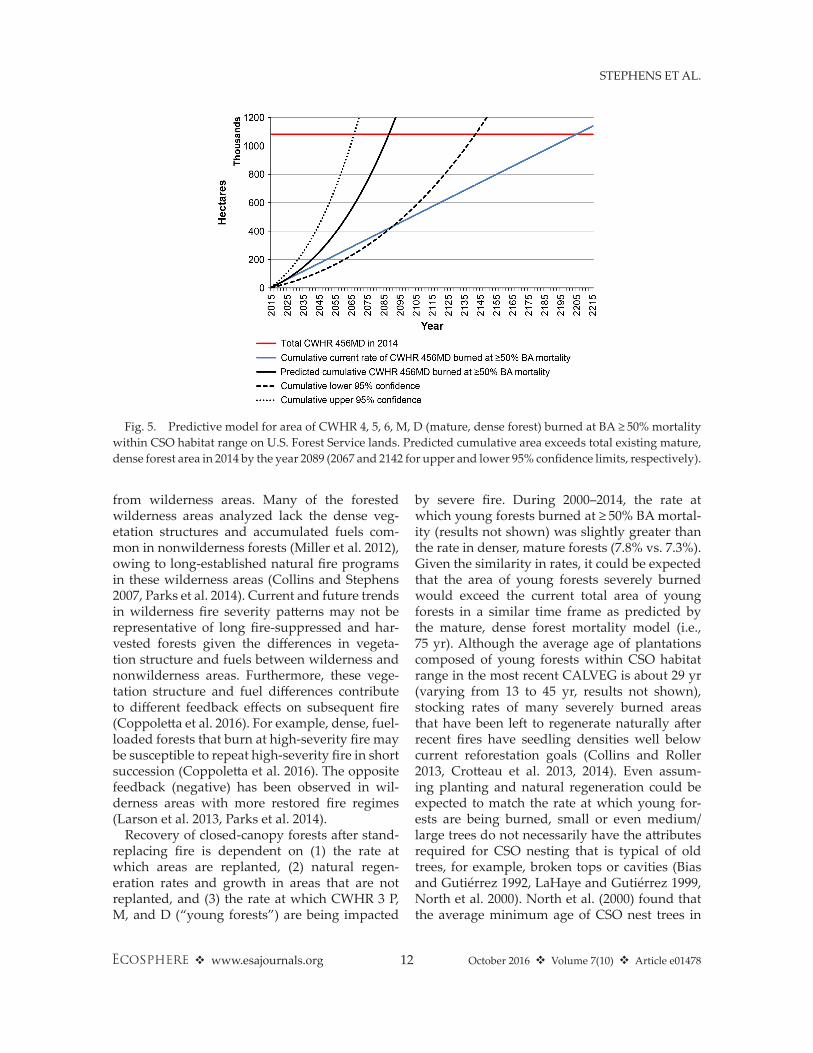
period 1970–2014 (Fig. 4, R2adj = 0.26, P < 0.001). The residuals of the OLS regression were not autocorrelated (Durbin– Watson P > 0.15 for each of the first four orders). The model for area of mature, dense forest burned within CSO habitat range (Eq. 1, Fig. 5) predicts that the cumulative habitat that burned with resulting ≥ 50% BA mor-tality exceeds total existing mature, dense forest area in 2014 (1,081,514 ha = 1,166,560 − 85,046 ha; Table 6) after 75 yr (i.e., 2014–2089; 53 and 128 yr for upper and lower 95% confidence limits, respectively).
Table 6. Area and percentage area burned within CSO habitat range on USFS- managed lands during 2000–2014 by CWhR type, size, and density.
Type†Size and density
Total area in 2000 (ha) BA ≥ 90% (ha) BA ≥ 50% (ha) BA ≥ 90% (%) BA ≥ 50% (%)
DFR, EPN, JPN, MhC, MhW, MRI, PPN, RFR, SMC, WFR
4 M 306,433 15,996 22,761 5.2 7.456 M 112,663 6775 10,130 6.0 9.0456 M 419,096 22,771 32,891 5.4 7.8
4 D 405,956 18,177 25,576 4.5 6.356 D 341,508 18,830 26,579 5.5 7.8456 D 747,464 37,007 52,155 5.0 7.04 MD 712,389 34,173 48,337 4.8 6.856 MD 454,170 25,606 36,709 5.6 8.1456 MD 1,166,560 59,778 85,046 5.1 7.3
DFR, MhC, MhW, PPN, SMC, WFR
4 M 227,794 12,998 18,484 5.7 8.156 M 88,954 6066 9127 6.8 10.3456 M 316,748 19,064 27,611 6.0 8.7
4 D 343,506 15,512 21,804 4.5 6.356 D 312,142 17,598 24,808 5.6 7.9456 D 655,648 33,110 46,612 5.0 7.14 MD 571,300 28,510 40,288 5.0 7.156 MD 401,097 23,664 33,934 5.9 8.5456 MD 972,396 52,174 74,223 5.4 7.6
EPN, JPN 4 M 25,745 1446 2017 5.6 7.856 M 3966 523 704 13.2 17.8456 M 29,711 1969 2721 6.6 9.2
4 D 12,074 1560 1949 12.9 16.156 D 3697 719 933 19.4 25.2456 D 15,771 2279 2882 14.4 18.34 MD 37,819 3006 3966 7.9 10.556 MD 7663 1242 1637 16.2 21.4456 MD 45,482 4248 5603 9.3 12.3
RFR 4 M 52,894 881 1448 1.7 2.756 M 19,740 158 274 0.8 1.4456 M 72,634 1039 1722 1.4 2.4
4 D 50,328 1076 1553 2.1 3.156 D 25,668 506 689 2.0 2.7456 D 75,996 1582 2242 2.1 2.94 MD 103,223 1957 3001 1.9 2.956 MD 45,408 663 963 1.5 2.1456 MD 148,631 2620 3963 1.8 2.7
Notes: Area and percentages burned are reported for two different relative basal area (BA) mortality thresholds.† CWhR types are defined in Table 1.
October 2016 v Volume 7(10) v Article e0147810 v www.esajournals.org
STEPhENS ET AL.
dIscussIon
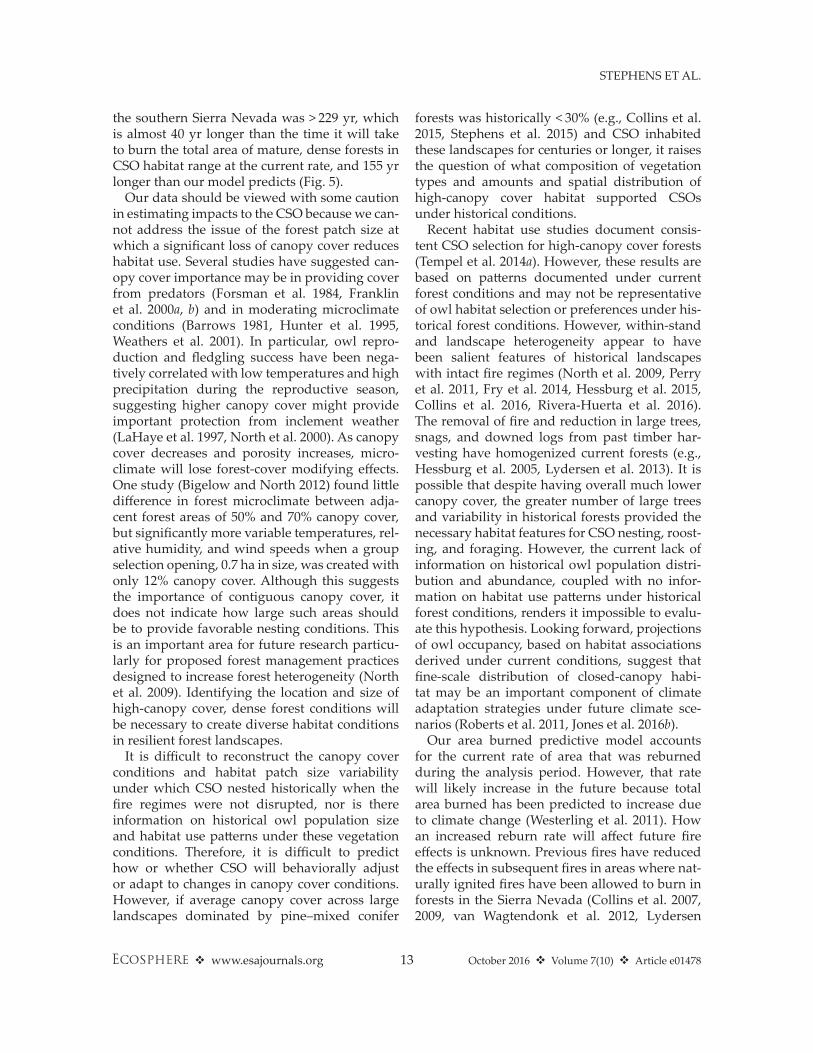
Our analysis determined that forest conditions associated with high- quality CSO nesting habitat (i.e., canopy cover > 70%) (Phillips et al. 2010, Tempel et al. 2014a, 2015) are being burned with moderate- and high- severity fire effects at an
increasing rate over the last 20–30 yr. The impacts of these increases are particularly concerning in the northern Sierra Nevada, and in the very southern end of the CSO range (Table 7). The largest area of CSO nesting habitat burned at ≥ 50% BA mortality was in westside mixed coni-fer forests, but the proportion of habitat burned
Table 7. Area and percentage area burned within CSO habitat range on USFS- managed lands during 2000–2014 by type and National Forest (ChWR 4, 5, 6, M, D—mature, dense forest).
Type† National Forest
Total area in 2000 (ha)
BA ≥ 90% (ha)
BA ≥ 50% (ha)
BA ≥ 90% (%)
BA ≥ 50% (%)
DFR, EPN, JPN, MhC, MhW, MRI, PPN, RFR, SMC, WFR
Lassen 181,080 5286 8355 2.9 4.6Plumas 270,866 20,531 28,147 7.6 10.4Tahoe 164,554 4338 6931 2.6 4.2Lake Tahoe Basin 14,670 378 464 2.6 3.2Eldorado 111,260 9688 11,777 8.7 10.6Stanislaus 109,518 6319 8547 5.8 7.8Sierra 179,588 2455 4653 1.4 2.6Sequoia 134,915 10,783 16,173 8.0 12.0Inyo 108 0 0 0.0 0.0
DFR, MhC, MhW, PPN, SMC, WFRLassen 150,587 5252 8280 3.5 5.5Plumas 249,040 19,768 27,156 7.9 10.9Tahoe 144,444 4319 6878 3.0 4.8Lake Tahoe Basin 9576 298 368 3.1 3.8Eldorado 99,613 8850 10,668 8.9 10.7Stanislaus 90,667 4934 6751 5.4 7.4Sierra 138,297 1724 3262 1.2 2.4Sequoia 90,160 7028 10,860 7.8 12.0Inyo 12 0 0 0.0 0.0
EPN, JPNLassen 15,082 0 0 0.0 0.0Plumas 7238 680 873 9.4 12.1Tahoe 2035 0 0 0.0 0.0Lake Tahoe Basin 2291 79 96 3.5 4.2Eldorado 240 39 46 16.1 19.0Stanislaus 3673 8 22 0.2 0.6Sierra 3214 19 28 0.6 0.9Sequoia 11,709 3423 4539 29.2 38.8Inyo 0 0 0 0.0 0.0
RFRLassen 15,380 185 264 1.2 1.7Plumas 14,585 64 116 0.4 0.8Tahoe 18,059 46 68 0.3 0.4Lake Tahoe Basin 2803 0 0 0.0 0.0Eldorado 11,407 13 19 0.1 0.2Stanislaus 15,178 22 64 0.1 0.4Sierra 38,078 112 230 0.3 0.6Sequoia 33,045 2178 3204 6.6 9.7Inyo 96 0 0 0.0 0.0
Notes: Area and percentages burned are reported for two different relative basal area (BA) mortality thresholds.† CWhR types are defined in Table 1.
October 2016 v Volume 7(10) v Article e0147811 v www.esajournals.org
STEPhENS ET AL.
at ≥ 50% BA mortality was higher in eastside pine- dominated forests. Xeric eastside forests are probably more susceptible to severe fire because of their high fuel loads coupled with drier cli-mate (Miller et al. 2012). Our results also demon-strate that if trends based on total area burned in the recent past (1970–2014) continue, a majority of current CSO nesting habitat may be substan-tially altered by fire (i.e., ≥ 50% BA mortality) in the next century. Based on the relationships
between observed mortality in field plots and RdNBR- based BA mortality thresholds pre-sented in Miller and Quayle (2015), it is expected that approximately half of the area included in the ≥ 50% BA mortality will be devoid of live trees. Given this, the fire- related impacts observed in our study are likely to result in local loss of forest cover or much more open forest conditions than are currently described as suit-able CSO nesting habitat (e.g., Tempel et al. 2014a, 2015).
Our models should not be used to derive pre-cise estimates of future forest conditions. As is normal with OLS regression, the confidence intervals widen at the extremes in our model of annual area burned over time (Fig. 4). however, our objective was not to precisely predict the amount of dense forest habitat at any particular point in the future. Rather we wanted to deter-mine whether the loss of dense forest will out-pace the replacement rate if the current rate of moderate to high severity fire and increasing trend in area burned continues. Area burned has been predicted to increase due to a climate change (e.g., Westerling et al. 2011). We can only specu-late how future fire effects will change because the interactions between climate, fuel accumu-lation, evolving firefighting policy, and fire area are complex. It is evident, however, that there has been a change in area burned over the last half of the twentieth century (Fig. 4) and that there is a strong relationship between area burned and area burned at moderate to high severity (Fig. 3). Therefore, a model that is based upon empirical data, such as our regression model, implicitly accounts for at least some of these complex inter-actions. Our methods allow us to put some error bounds on how the trend in area burned and area burned at moderate to high severity may change in the future.
Recent research, however, suggests that fire severity may in fact decrease throughout much of the western United States in response to pre-dicted changes in climate over the next several decades (Parks et al. 2016). The authors attribute these overall decreases to productivity limita-tions (i.e., accumulation of burnable biomass) forced by warming and decreased moisture avail-ability. Although this is a possible future fire out-come, the predictions from Parks et al. (2016) are largely based on observed fire severity patterns
Fig. 3. Regression model of CWhR 4, 5, 6, M, D (mature, dense forest) area burned at ≥ 50% tree BA mortality to the total annual area burned 2000–2014 (an intercept was not included in the regression model; R2adj = 0.96, P < 0.001).
Fig. 4. Least squares regression model for area burned in fires that occurred within CSO habitat range on U.S. Forest Service lands 1970–2014 (R2
adj = 0.26, P < 0.001).
October 2016 v Volume 7(10) v Article e0147812 v www.esajournals.org
STEPhENS ET AL.
from wilderness areas. Many of the forested wilderness areas analyzed lack the dense veg-etation structures and accumulated fuels com-mon in nonwilderness forests (Miller et al. 2012), owing to long- established natural fire programs in these wilderness areas (Collins and Stephens 2007, Parks et al. 2014). Current and future trends in wilderness fire severity patterns may not be representative of long fire- suppressed and har-vested forests given the differences in vegeta-tion structure and fuels between wilderness and nonwilderness areas. Furthermore, these vege-tation structure and fuel differences contribute to different feedback effects on subsequent fire (Coppoletta et al. 2016). For example, dense, fuel- loaded forests that burn at high- severity fire may be susceptible to repeat high- severity fire in short succession (Coppoletta et al. 2016). The opposite feedback (negative) has been observed in wil-derness areas with more restored fire regimes (Larson et al. 2013, Parks et al. 2014).
Recovery of closed- canopy forests after stand- replacing fire is dependent on (1) the rate at which areas are replanted, (2) natural regen-eration rates and growth in areas that are not replanted, and (3) the rate at which CWhR 3 P, M, and D (“young forests”) are being impacted
by severe fire. During 2000–2014, the rate at which young forests burned at ≥ 50% BA mortal-ity (results not shown) was slightly greater than the rate in denser, mature forests (7.8% vs. 7.3%). Given the similarity in rates, it could be expected that the area of young forests severely burned would exceed the current total area of young forests in a similar time frame as predicted by the mature, dense forest mortality model (i.e., 75 yr). Although the average age of plantations composed of young forests within CSO habitat range in the most recent CALVEG is about 29 yr (varying from 13 to 45 yr, results not shown), stocking rates of many severely burned areas that have been left to regenerate naturally after recent fires have seedling densities well below current reforestation goals (Collins and Roller 2013, Crotteau et al. 2013, 2014). Even assum-ing planting and natural regeneration could be expected to match the rate at which young for-ests are being burned, small or even medium/large trees do not necessarily have the attributes required for CSO nesting that is typical of old trees, for example, broken tops or cavities (Bias and Gutiérrez 1992, Lahaye and Gutiérrez 1999, North et al. 2000). North et al. (2000) found that the average minimum age of CSO nest trees in
Fig. 5. Predictive model for area of CWhR 4, 5, 6, M, D (mature, dense forest) burned at BA ≥ 50% mortality within CSO habitat range on U.S. Forest Service lands. Predicted cumulative area exceeds total existing mature, dense forest area in 2014 by the year 2089 (2067 and 2142 for upper and lower 95% confidence limits, respectively).
October 2016 v Volume 7(10) v Article e0147813 v www.esajournals.org
STEPhENS ET AL.
the southern Sierra Nevada was > 229 yr, which is almost 40 yr longer than the time it will take to burn the total area of mature, dense forests in CSO habitat range at the current rate, and 155 yr longer than our model predicts (Fig. 5).
Our data should be viewed with some caution in estimating impacts to the CSO because we can-not address the issue of the forest patch size at which a significant loss of canopy cover reduces habitat use. Several studies have suggested can-opy cover importance may be in providing cover from predators (Forsman et al. 1984, Franklin et al. 2000a, b) and in moderating microclimate conditions (Barrows 1981, hunter et al. 1995, Weathers et al. 2001). In particular, owl repro-duction and fledgling success have been nega-tively correlated with low temperatures and high precipitation during the reproductive season, suggesting higher canopy cover might provide important protection from inclement weather (Lahaye et al. 1997, North et al. 2000). As canopy cover decreases and porosity increases, micro-climate will lose forest- cover modifying effects. One study (Bigelow and North 2012) found little difference in forest microclimate between adja-cent forest areas of 50% and 70% canopy cover, but significantly more variable temperatures, rel-ative humidity, and wind speeds when a group selection opening, 0.7 ha in size, was created with only 12% canopy cover. Although this suggests the importance of contiguous canopy cover, it does not indicate how large such areas should be to provide favorable nesting conditions. This is an important area for future research particu-larly for proposed forest management practices designed to increase forest heterogeneity (North et al. 2009). Identifying the location and size of high- canopy cover, dense forest conditions will be necessary to create diverse habitat conditions in resilient forest landscapes.
It is difficult to reconstruct the canopy cover conditions and habitat patch size variability under which CSO nested historically when the fire regimes were not disrupted, nor is there information on historical owl population size and habitat use patterns under these vegetation conditions. Therefore, it is difficult to predict how or whether CSO will behaviorally adjust or adapt to changes in canopy cover conditions. however, if average canopy cover across large landscapes dominated by pine–mixed conifer
forests was historically < 30% (e.g., Collins et al. 2015, Stephens et al. 2015) and CSO inhabited these landscapes for centuries or longer, it raises the question of what composition of vegetation types and amounts and spatial distribution of high- canopy cover habitat supported CSOs under historical conditions.
Recent habitat use studies document consis-tent CSO selection for high- canopy cover forests (Tempel et al. 2014a). however, these results are based on patterns documented under current forest conditions and may not be representative of owl habitat selection or preferences under his-torical forest conditions. however, within- stand and landscape heterogeneity appear to have been salient features of historical landscapes with intact fire regimes (North et al. 2009, Perry et al. 2011, Fry et al. 2014, hessburg et al. 2015, Collins et al. 2016, Rivera- huerta et al. 2016). The removal of fire and reduction in large trees, snags, and downed logs from past timber har-vesting have homogenized current forests (e.g., hessburg et al. 2005, Lydersen et al. 2013). It is possible that despite having overall much lower canopy cover, the greater number of large trees and variability in historical forests provided the necessary habitat features for CSO nesting, roost-ing, and foraging. however, the current lack of information on historical owl population distri-bution and abundance, coupled with no infor-mation on habitat use patterns under historical forest conditions, renders it impossible to evalu-ate this hypothesis. Looking forward, projections of owl occupancy, based on habitat associations derived under current conditions, suggest that fine- scale distribution of closed- canopy habi-tat may be an important component of climate adaptation strategies under future climate sce-narios (Roberts et al. 2011, Jones et al. 2016b).
Our area burned predictive model accounts for the current rate of area that was reburned during the analysis period. however, that rate will likely increase in the future because total area burned has been predicted to increase due to climate change (Westerling et al. 2011). how an increased reburn rate will affect future fire effects is unknown. Previous fires have reduced the effects in subsequent fires in areas where nat-urally ignited fires have been allowed to burn in forests in the Sierra Nevada (Collins et al. 2007, 2009, van Wagtendonk et al. 2012, Lydersen
October 2016 v Volume 7(10) v Article e0147814 v www.esajournals.org
STEPhENS ET AL.
et al. 2014) and in northwestern Mexico (Rivera- huerta et al. 2016). however, if the status quo is maintained (i.e., fire suppression and minimal restoration treatments—see North et al. [2012]), then most USFS lands will continue to burn severely and the area that would have burned at low to moderate severity will continue at a deficit (Stephens et al. 2007, Mallek et al. 2013, Calkin et al. 2015). Unless this trend is changed, it is likely that CSO nesting habitat will continue to decline as a result of wildfire.
The main challenges of conserving the CSO are also impacting the NSO. Conservation of the NSO has already experienced a drier, more fire- prone environment (e.g., east of the Cascade Range crest) where owl conservation is question-able because losses of old- growth forests to wild-fire have been relatively high, and risks of further loss remain (Spies et al. 2006, 2010, Gaines et al. 2010, Lehmkuhl et al. 2015). Meanwhile, major fire events in older forests following the USFS Northwest Forest Plan exceeded the scope of previous fires and losses of forests with large- diameter trees were concentrated on federal lands in the drier East Cascades and Klamath provinces, where increased impact by fire out-weighed decreased disturbance by harvesting (Spies et al. 2006).
Management strategiesOf the potential responses to the threat to CSO
nesting habitat from wildfire, four merit particu-lar discussion. The first is to increase fire sup-pression and prevention resources in an attempt to preserve mature, dense forests. This idea may seem logical, but even with a large escalation of resources spent to suppress wildfires (e.g., 1995 wildfire expenses represented 16% of the USFS- appropriated funds, which, by 2015, increased to 52% [> $1.5 billion] [USDA- FS 2015]), the amount of area burned annually (Fig. 4) and proportion of high- severity fire continue to increase in the Sierra Nevada (Miller et al. 2009b, Miller and Safford 2012, Mallek et al. 2013). Increasing fire suppression resources will not lead to resilient forests (Stephens et al. 2014b) and the long- term conservation of the CSO. Furthermore, with increased suppression only the most destructive fires that escape initial attack will occur, leading to losses of the forests we endeavor to protect (North et al. 2015b).
A second possibility to reduce the losses of CSO nesting habitat is to strategically reduce fire hazards in landscapes populated by owls using mechanical treatments and/or prescribed fire. Research has determined that managing matrix lands outside of declared reserves is fundamen-tal to the conservation of biodiversity (Franklin and Lindenmayer 2009). Methods exist to deter-mine the most fire- prone areas of a landscape, even when areas for rare species are excluded from treatment (Moghaddas et al. 2010, Ager et al. 2013, Collins et al. 2013). Based on simu-lation predictions, strategic treatments that intentionally avoid owl nesting habitat produce a moderate reduction in landscape fire behav-ior (Tempel et al. 2015, Dow et al. 2016). Also, these fuel and restoration treatments are typi-cally accomplished with few negative impacts to forest ecosystems (soils, insects, vegetation, small mammals, songbirds, etc.), because most ecosystem components exhibit very subtle or no measurable change relative to untreated areas (Stephens et al. 2012). however, given the many economic, administrative, and social constraints on landscape fuel treatment projects (Collins et al. 2010, North et al. 2015a), relatively small proportions of landscapes are actually treated in many projects. As a result, even “treated” land-scapes can be overrun by large fires burning under more extreme fire conditions because even when treatments are strategically placed to slow fire, they are often too small to impact large fires burning at unprecedented rates of spread.
The 2013 Rim Fire in the central Sierra Nevada is an example where a fire burned through CSO habitat with enough intensity to overwhelm areas previously treated to reduce fire haz-ards (Lydersen et al. 2014). This likely occurred because the last 100 yr of fire suppression and harvesting dramatically transformed the vast majority of the forest burned by the Rim Fire, with forest density, especially of less fire- tolerant and shade- tolerant white fir, increasing approx-imately 10- fold and increasing forest canopy cover by a factor of two (Scholl and Taylor 2010, B. Collins, unpublished data, 2015). These types of landscape conditions can overwhelm strategic designs that only treat 10–20% of the landscape. however, landscapes that receive strategically placed treatments are certainly an improvement over untreated landscapes regarding potential
October 2016 v Volume 7(10) v Article e0147815 v www.esajournals.org
STEPhENS ET AL.
fire behavior and effects (Ager et al. 2007, 2010, Moghaddas et al. 2010, Collins et al. 2011, 2013) and can serve as anchor points to allow large- scale prescribed fire programs (North et al. 2012).
A third possibility to reduce the vulnerability of CSO nesting habitat is to increase the amount of managed wildfire in CSO habitat outside the wildland–urban interface. Managed wildfire can produce vegetation patterns and structures that are resilient to large- scale fire (holden et al. 2007, Collins et al. 2009, van Wagtendonk et al. 2012, Stephens et al. 2013, Parks et al. 2014), but it is not possible to precisely predict the ecological effects of such fires, particularly on CSO nest-ing habitat that commonly has high fire hazards from multilayered canopies and relatively high densities of downed logs, snags, and smaller woody fuels (surface fuels). Under burning CSO PACs would increase their survivability before a regime of managed wildfire was implemented. Research has shown that CSO will occupy terri-tories that experience low- to moderate- severity fires (Roberts et al. 2011, Lee et al. 2012, 2013), but how owls respond to large patches of high- severity fire is currently under investigation. Some evidence indicates owls may occupy sites that experience relatively high proportions of high severity (> 70%) in the first year after the fire, although strong site fidelity may confound short- term owl response (Lee and Bond 2015). Recent radiotelemetry research within a large, disproportionately high- severity fire in the northern Sierra Nevada (2014 King Fire) found CSO strongly avoided high- severity burned areas with the authors concluding that mega-fires were an emerging threat to old- forest spe-cies (Jones et al. 2016a).
Increasing managed wildfire in USFS lands in the Sierra Nevada could be part of this strat-egy, especially in remote, higher elevation red and white fir and upper elevation mixed conifer forests that are common in these areas. There is evidence that fire area is increasing at higher ele-vations in our study area (Schwartz et al. 2015). Whereas there has not been any link found between fire frequency and severity in red fir for-ests (Steel et al. 2015), increases in tree regener-ation and continuity of fuels in higher elevation forests associated with a warming climate have been observed (Dolanc et al. 2013). It remains to be seen how these and future changes in forest
structure of higher elevation forests will impact the retention or development of new CSO nest-ing habitat. Fire refugia could be an important component of CSO conservation in fir and mixed conifer forests with active fire regimes (Camp et al. 1997). Fire refugia are in topographic and physiographic settings that moderate stand- replacing fire probabilities (Wilkin et al. 2016); such areas could serve as nesting habitat for the CSO.
A fourth approach to reducing the vulnerabil-ity of CSO nesting habitat would be to initiate a forest restoration strategy that uses historical landscape information to identify areas likely to sustain denser, mature forests under an intact fire regime (including fire refugia). These areas could be developed to support greater tree den-sities and overall biomass, while the remaining portions of the landscape would be treated with mechanical thinning and/or prescribed fire to meet long- term forest resilience objectives. In essence, this would strive to manage landscapes to emulate the inherent heterogeneity of land-scapes that emerged under the influences of his-toric fire and other disturbances. Several large, spatial, historical landscape- scale forest recon-structions have been published from the Sierra Nevada (Collins et al. 2011, 2015, Stephens et al. 2015) that could inform such an exercise. For example, in two of these areas (central and south-ern Sierra Nevada), pine- dominated mixed coni-fer and ponderosa pine- forested landscapes in 1911 had average canopy cover < 30%. however, these reconstructions did note considerable vari-ability in forest structure across the respective landscapes, with approximately 10–15% of the area dominated by denser forests. Given that fire burned freely through the historical landscape, there was probably a dynamic pattern of denser forest patches adjacent to open, regenerating areas. Other areas of mixed conifer forests proba-bly had higher canopy cover and supported CSO nesting habitat. Identifying these types of areas could inform a long- term strategy to conserve the CSO by maintaining denser forest structures in these areas and treating the remaining areas to reduce the chances of high- intensity crown fire entering CSO nesting habitat.
Although current approaches for CSO conser-vation have emphasized the retention of exist-ing habitat (PACs, home ranges, etc.), this is
October 2016 v Volume 7(10) v Article e0147816 v www.esajournals.org
STEPhENS ET AL.
primarily a static, fine- filter view of conservation that may not succeed long term (Agee 2003). Our estimates of how moderate- and high- severity fire may affect mature, dense forests into the future are particularly concerning to CSO per-sistence. Indeed, the recent CSO monitoring fol-lowing the 2014 King Fire (Jones et al. 2016a) is a telling example of this. More comprehensive forest restoration activities are needed on federal lands in CSO habitat to avoid significant losses of older forests, particularly if recent climatic trends continue (healey et al. 2008). As implementation of landscape forest restoration and fuel reduction strategies can affect CSO (Stephens et al. 2014a), further understanding is needed on the distri-bution, number, and habitat quality that can be supported across restored landscapes that expe-rience management and dynamic fire regimes.
AcknowledgMents
We wish to thank R. Gerrard for the CSO range map and J. Baldwin for help with the statistics. We appreci-ate the comments from three reviewers that improved the manuscript. This work was partially funded by the Pacific Southwest Region of the U.S. Forest Service.
lIterAture cIted
Agee, J. K. 2003. The fallacy of passive management. Conservation Biology in Practice 1:18–25.
Ager, A. A., M. A. Finney, B. K. Kerns, and h. Maffei. 2007. Modeling wildfire risk to northern spotted owl (Strix occidentalis caurina) habitat in central Oregon, USA. Forest Ecology and Management 246:45–56.
Ager, A. A., N. M. Vaillant, and M. A. Finney. 2010. A comparison of landscape fuel treatment strat-egies to mitigate wildland fire risk in the urban interface and preserve old forest structure. Forest Ecology and Management 259:1556–1570.
Ager, A. A., N. M. Vaillant, and A. McMahan. 2013. Restoration of fire in managed forests: a model to prioritize landscapes and analyze tradeoffs. Eco-sphere 4:Article 29.
Allen, C. D., M. Savage, D. A. Falk, K. F. Suckling, T. W. Swetnam, T. Schulke, P. B. Stacey, P. Morgan, M. hoffman, and J. K. Klingel. 2002. Ecological restoration of southwestern ponderosa pine eco-systems: a broad perspective. Ecological Applica-tions 12:1418–1433.
Barbour, M. G., and R. A. Minnich. 2000. Californian upland forests and woodlands. Pages 162–202 in
M. G. Barbour and W. D. Billings, editors. North American terrestrial vegetation. Second edition. Cambridge University Press, Cambridge, UK.
Barrowclough, G. F., R. J. Gutiérrez, J. G. Groth, J. E. Lai, and D. F. Rock. 2011. The hybrid zone between northern and California spotted owls in the Cascade- Sierran suture zone. Condor 113:581–589.
Barrows, C. W. 1981. Roost selection by spotted owls: an adaptation to heat stress. Condor 83:302–309.
Bias, M. A., and R. J. Gutiérrez. 1992. habitat asso-ciations of California spotted owls in the central Sierra Nevada. Journal of Wildlife Management 56:584–595.
Bigelow, S., and M. North. 2012. Microclimate effects of fuels- reduction and group- selection silviculture: implications for fire behavior in Sierran mixed- conifer forests. Forest Ecology and Management 264:51–59.
Blakesley, J. A., et al. 2010. Population dynamics of spotted owls in the Sierra Nevada, California. Wildlife Monograph 174:1–36.
Block, W. M., M. L. Morrison, J. Verner, and P. N. Man-ley. 1994. Assessing wildlife- habitat- relationships models: a case study with California oak wood-lands. Wildlife Society Bulletin 22:549–561.
Bond, M. L., R. J. Gutiérrez, A. B. Franklin, W. S. Lahaye, C. A. May, and M. E. Seamans. 2002. Short- term effects of wildfires on spotted owl sur-vival, site fidelity, mate fidelity, and reproductive success. Wildlife Society Bulletin 30:1022–1028.
Burnett, R. D., and L. J. Roberts. 2015. A quantitative evaluation of the spotted owl conservation umbrel-la in the Sierra Nevada. PLoS ONE 10:e0123778.
Calkin, D. C., M. P. Thompson, and M. A. Finney. 2015. Negative consequences of positive feedbacks in US wildfire management. Forest Ecosystems 2:art 9. http://dx.doi.org/10.1186/s40663-015-0033-8
Camp, A. E., C. D. Oliver, P. F. hessburg, and R. L. Everett. 1997. Predicting late- successional fire refugia from physiography and topography. Forest Ecology and Management 95:63–77.
Collins, B. M., N. K. Kelly, J. W. van Wagtendonk, and S. L. Stephens. 2007. Spatial patterns of large natu-ral fires in Sierra Nevada wilderness areas. Land-scape Ecology 22:545–557.
Collins, B. M., h. A. Kramer, K. M. Menning, C. Dillingham, D. Saah, P. A. Stine, and S. L. Stephens. 2013. Modeling hazardous fire potential within a completed fuel treatment network in the northern Sierra Nevada. Forest Ecology and Man-agement 310:156–166.
Collins, B. M., J. M. Lydersen, R. G. Everett, D. L. Fry, and S. L. Stephens. 2015. Novel characterization of landscape- level variability in historical vegetation structure. Ecological Applications 25:1167–1174.
October 2016 v Volume 7(10) v Article e0147817 v www.esajournals.org
STEPhENS ET AL.
Collins, B. M., J. D. Miller, A. E. Thode, M. Kelly, J. W. van Wagtendonk, and S. L. Stephens. 2009. Inter-actions among wildland fires in a long- established Sierra Nevada natural fire area. Ecosystems 12: 114–128.
Collins, B. M., and G. B. Roller. 2013. Early forest dynamics in stand- replacing fire patches in the northern Sierra Nevada, California, USA. Land-scape Ecology 28:1801–1813.
Collins, B. M., and S. L. Stephens. 2007. Managing natural wildfires in Sierra Nevada wilderness areas. Frontiers in Ecology and the Environment 5:523–527.
Collins, B. M., S. L. Stephens, J. J. Moghaddas, and J. Battles. 2010. Challenges and approaches in plan-ning fuel treatments across fire- excluded forested landscapes. Journal of Forestry 108:24–31.
Collins, B. M., S. L. Stephens, G. B. Roller, and J. J. Battles. 2011. Simulating fire and forest dynamics for a landscape fuel treatment project in the Sierra Nevada. Forest Science 57:77–88.
Collins, B. M., J. M. Lyderson, D. L. Fry, K. Wilken, T. Moody, and S. L. Stephens. 2016. Variability in vegetation and surface fuels across mixed- conifer dominated landscapes with over 40 years of natu-ral fire. Forest Ecology and Management 381:74–83.
Conner, M. M., J. J. Keane, C. V. Gallagher, G. Jehle, T. E. Munton, P. A. Shaklee, and R. A. Gerrard. 2013. Realized population change for long- term monitoring: California spotted owl case study. Journal of Wildlife Management 77:1449–1458.
Coppoletta, M., K. E. Merriam, and B. M. Collins. 2016. Post- fire vegetation and fuel development influ-ences fire severity patterns in reburns. Ecological Applications 26:686–699.
Crotteau, J. S., M. W. Ritchie, and J. M. Varner. 2014. A mixed- effects heterogeneous negative bino-mial model for postfire conifer regeneration in Northeastern California, USA. Forest Science 60: 275–287.
Crotteau, J. S., J. M. Varner, and M. W. Ritchie. 2013. Post- fire regeneration across a fire severity gradi-ent in the southern Cascades. Forest Ecology and Management 287:103–112.
Dennison, P. E., S. C. Brewer, J. D. Arnold, and M. A. Moritz. 2014. Large wildfire trends in the western United States, 1984–2011. Geophysical Research Letters 41:2928–2933.
Dixon, G. E. 2002. Essential FVS: a user’s guide to the Forest Vegetation Simulator. USDA Forest Service, Forest Management Service Center, Fort Collins, Colorado, USA.
Dolanc, C. R., J. h. Thorne, and h. D. Safford. 2013. Widespread shifts in the demographic structure of subalpine forests in the Sierra Nevada, California,
1934 to 2007. Global Ecology and Biogeography 22:264–276.
Dow, C. B., B. M. Collins, and S. L. Stephens. 2016. Incorporating resource protection constraints in an analysis of landscape fuel treatment effectiveness in the northern Sierra Nevada, CA, USA. Environ-mental Management 57:516–530.
Durbin, J., and G. S. Watson. 1950. Testing for serial cor-relation in least squares regression: I. Biometrika 37:409–428.
Durbin, J., and G. S. Watson. 1951. Testing for serial cor-relation in least squares regression: II. Biometrika 38:159–177.
Eidenshink, J., B. Schwind, K. Brewer, Z. Zhu, B. Quayle, and S. howard. 2007. A project for monitoring trends in burn severity. Fire Ecology 3:3–21.
Everett, R., D. Schellhaas, D. Spurbeck, P. Ohlson, D. Keenum, and T. Anderson. 1997. Structure of northern spotted owl nest stands and their histor-ical conditions on the eastern slope of the Pacific Northwest Cascades, USA. Forest Ecology and Management 94:1–14.
Fites-Kaufman, J. A., P. Rundel, N. Stephenson, and D. A. Weixelman. 2007. Montane and subalpine vegetation of the Sierra Nevada and Cascade Ranges. Pages 456–501 in M. G. Barbour, T. Keller-Wolf, and A. A. Schoenherr, editors. Terrestrial vegetation of California. University of California Press, Berkeley, California, USA.
Fontaine, J. B., and P. L. Kennedy. 2012. Meta- analysis of avian and small- mammal response to fire sever-ity and fire surrogate treatments in U.S. fire- prone forests. Ecological Applications 22:1547–1561.
Forsman, E. D., E. C. Meslow, and h. M. Wight. 1984. Distribution and biology of the spotted owl in Ore-gon. Wildlife Monographs 87:3–64.
Franklin, A. B., D. R. Andreson, R. J. Gutierrez, and K. P. Burhahm. 2000a. Climate, habitat quality and fitness in northern spotted owls in Northwestern California. Ecological Monographs 70:539–590.
Franklin, J., C. E. Woodcock, and R. Warbington. 2000b. Multi- attribute vegetation maps of forest service lands in California supporting resource manage-ment decisions. Photogrammetric Engineering and Remote Sensing 66:1209–1217.
Franklin, J. F., and K. N. Johnson. 2012. A restoration framework for federal forests in the Pacific North-west. Journal of Forestry 110:429–439.
Franklin, J. F., and D. B. Lindenmayer. 2009. Impor-tance of matrix habitats in maintaining biological diversity. Proceedings of the National Academy of Sciences USA 106:349–350.
Fry, D. L., S. L. Stephens, B. M. Collins, M. P. North, E. Franco-Vizcaino, and S. J. Gill. 2014. Contrasting
October 2016 v Volume 7(10) v Article e0147818 v www.esajournals.org
STEPhENS ET AL.
spatial patterns in active- fire and fire- suppressed Mediterranean climate old- growth mixed conifer forests. PLoS ONE 9:e88985.
Gaines, W. L., R. J. harrod, J. Dickinson, A. L. Lyons, and K. halupka. 2010. Integration of northern spot-ted owl habitat and fuels treatments in the eastern Cascades, Washington, USA. Forest Ecology and Management 260:2045–2052.
Gordon, h., and B. Schwind. 2000. The CalVeg Geobook – a visual tool for describing vegetation information derived from remotely sensed data. USDA Forest Service, Pacific Southwest Region Remote Sensing Laboratory, Sacramento, Califor-nia, USA.
hagmann, K., J. Franklin, and N. Johnson. 2014. his-torical conditions in mixed- conifer forests on the eastern slopes of the northern Oregon Cascade Range, USA. Forest Ecology and Management 330:158–170.
healey, S. P., W. B. Cohen, T. A. Spies, M. Moeur, D. Pflugmacher, M. G. Whitley, and M. Lefsky. 2008. The relative impact of harvest and fire upon landscape- level dynamics of older forests: lessons from the Northwest Forest Plan. Ecosystems 11: 1106–1119.
hessburg, P. F., J. K. Agee, and J. F. Franklin. 2005. Dry forests and wildland fires of the inland Northwest USA: contrasting the landscape ecology of the pre- settlement and modern eras. Forest Ecology and Management 211:117–139.
hessburg, P. F., et al. 2015. Restoring fire- prone Inland Pacific landscapes: seven core principles. Land-scape Ecology 30:1805–1835.
hessburg, P. F., et al. 2016. Tamm Review: Management of mixed- severity fire regime forests in Oregon, Washington, and Northern California. Forest Ecol-ogy and Management 366:221–250.
holden, Z. A., P. Morgan, M. G. Rollins, and K. Kavanagh. 2007. Effects of multiple wildland fires on ponde rosa pine stand structure in two southwestern wilderness areas, USA. Fire Ecology 2:18–33.
hunter, J. E., R. J. Gutierrez, and A. B. Franklin. 1995. habitat configuration around spotted owl sites in Northwestern California. Condor 97:684–693.
Jones, G. M., R. J. Gutiérrez, D. J. Tempel, S. A. Whitmore, W. J. Berigan, and M. Z. Peery. 2016a. Megafires: an emerging threat to old- forest spe-cies. Frontiers in Ecology and the Environment 14: 300–306.
Jones, G. M., R. J. Gutiérrez, D. J. Tempel, B. Zucker-berg, and M. Z. Peery. 2016b. Using dynamic occu-pancy models to inform climate change adaptation strategies for California spotted owls. Journal of Applied Ecology 53:895–905.
Kaufmann, M. R., D. Binkley, P. Z. Fulé, M. Johnson, S. L. Stephens, and T. W. Swetnam. 2007. Defining old growth for fire- adapted forests of the western United States. Ecology and Society 12:15.
Keeler-Wolf, T. 2007. The history of vegetation clas-sification and mapping in California. Pages 1–42 in M. G. Barbour, T. Keller-Wolf, and A. A. Schoenherr, editors. Terrestrial vegetation of Cal-ifornia. University of California Press, Berkeley, California, USA.
Lahaye, W. S., and R. J. Gutiérrez. 1999. Nest sites and nesting habitat of the northern spotted owl in northwestern California. Condor 101:324–330.
Lahaye, W. S., R. J. Gutiérrez, and D. R. Call. 1997. Nest- site selection and reproductive success of California spotted owls. Wilson Bulletin 109:42–51.
Larson, A. J., R. T. Belote, C. A. Cansler, S. A. Parks, and M. S. Dietz. 2013. Latent resilience in pondero-sa pine forest: effects of resumed frequent fire. Eco-logical Applications 23:1243–1249.
Laymon, S. A. 1989. A test of the California Wild-life-habitat Relationship System for breeding birds in valley-foothill riparian habitat. Pages 307–313 in D. L. Abell, technical coordinator. Proceedings of the California Riparian Systems Conference: Protection, Management, and Restoration for the 1990s, September 22–24, 1988, Davis, DV. General Technical Report PSW-GTR-110. Pacific Southwest Forest and Range Experiment Station, Forest Ser-vice, U.S. Department of Agriculture, Berkeley, California, USA.
Lee, D. E., and M. L. Bond. 2015. Occupancy of California spotted owl sites following a large fire in the Sierra Nevada, California. Condor 117: 228–236.
Lee, D. E., M. L. Bond, M. I. Bochert, and R. Tanner. 2013. Influence of fire and salvage logging on site occupancy of spotted owls in the San Bernardino and San Jacinto mountains of southern California. Journal of Wildlife Management 77:1327–1341.
Lee, D. E., M. L. Bond, and R. B. Siegel. 2012. Dynamics of breeding- season site occupancy of the California spotted owl in burned forests. Con-dor 114:792–802.
Lehmkuhl, J., W. Gaines, D. W. Peterson, J. Bailey, and A. Youngblood, technical editors. 2015. Silviculture and monitoring guidelines for integrating resto-ration of dry mixed-conifer forest and spotted owl habitat management in the eastern Cascade Range. General Technical Report PNW-GTR-915. USDA, Portland, Oregon, USA, 158 pp.
Liu, Y., S. L. Goodrick, and J. A. Stanturf. 2013. Future U.S. wildfire potential trends projected using a dynamically downscaled climate change scenario. Forest Ecology and Management 294:120–135.
October 2016 v Volume 7(10) v Article e0147819 v www.esajournals.org
STEPhENS ET AL.
Lydersen, J. M., B. M. Collins, J. D. Miller, D. L. Fry, and S. L. Stephens. 2016. Relating fire- caused change in forest structure to remotely sensed estimates of fire severity. Fire Ecology, in press.
Lydersen, J. M., N. P. North, and B. M. Collins. 2014. Severity of an uncharacteristically large wildfire, the Rim Fire, in forests with relatively restored frequent fire regimes. Forest Ecology and Manage-ment 328:326–334.
Lydersen, J. M., M. P. North, E. E. Knapp, and B. M. Collins. 2013. Quantifying spatial patterns of tree groups and gaps in mixed- conifer forests: refer-ence conditions and long- term changes following fire suppression and logging. Forest Ecology and Management 304:370–382.
Mallek, C., h. D. Safford, J. h. Viers, and J. D. Miller. 2013. Modern departures in fire severity and area vary by forest type, Sierra Nevada and southern Cascades, California, USA. Ecosphere 4:art153.
Matyas, W. J., and I. Parker. 1980. CALVEG mosaic of existing vegetation in California. Regional Ecolo-gy Group, USDA Forest Service, Pacific Southwest Region, San Francisco, California, USA. http://www.dfg.ca.gov/biogeodata/cwhr/wildlife_habi tats.asp
Mayer, K. E., and W. F. Laudenslayer Jr., editors. 1988. A guide to wildlife habitats of California. State of California, Resources Agency, Department of Fish and Game, Sacramento, California, USA.
Miller, J. D., B. M. Collins, J. A. Lutz, S. L. Stephens, J. W. van Wagtendonk, and D. A. Yasuda. 2012. Differences in wildfires among ecoregions and land management agencies in the Sierra Nevada region, California, USA. Ecosphere 3:80.
Miller, J. D., E. E. Knapp, C. h. Key, C. N. Skinner, C. J. Isbell, R. M. Creasy, and J. W. Sherlock. 2009a. Calibration and validation of the relative differenced Normalized Burn Ratio ( RdNBR) to three measures of fire severity in the Sierra Nevada and Klamath Mountains, California, USA. Remote Sensing of the Environment 113: 645–656.
Miller, J. D., and B. Quayle. 2015. Calibration and validation of immediate post- fire satellite derived data to three severity metrics. Fire Ecology 11: 12–30.
Miller, J. D., and h. D. Safford. 2012. Trends in wild-fire severity 1984- 2010 in the Sierra Nevada, Modoc Plateau, and southern Cascades, California, USA. Fire Ecology 8:41–57.
Miller, J. D., h. D. Safford, M. A. Crimmins, and A. E. Thode. 2009b. Quantitative evidence for increasing forest fire severity in the Sierra Nevada and south-ern Cascade Mountains, California and Nevada, USA. Ecosystems 12:16–32.
Miller, J. D., and A. E. Thode. 2007. Quantifying burn severity in a heterogeneous landscape with a rel-ative version of the delta Normalized Burn Ratio (dNBR). Remote Sensing of the Environment 109:66–80.
Minnich, R. A. 2007. Climate, paleoclimate, and paleovegetation. Pages 43–70 in M. G. Barbo-ur, T. Keeler-Wolf, and A. A. Schoenherr, editors. Terrestrial vegetation of California. University of California Press, Berkeley, California, USA.
Moghaddas, J. J., B. M. Collins, K. Menning, E. E. Y. Moghaddas, and S. L. Stephens. 2010. Fuel treat-ment effects on modeled landscape- level fire behavior in the northern Sierra Nevada. Canadian Journal of Forest Research 40:1751–1765.
North, M., A. Brough, J. W. Long, B. M. Collins, P. Bowden, S. A. Yasuda, J. D. Miller, and N. G. Sugihara. 2015a. Constraints on mechanized treat-ment significantly limit mechanical fuels reduction extent in the Sierra Nevada. Journal of Forestry 113:40–48.
North, M., B. Collins, h. Safford, and N. Stephenson. 2016. Montane forests. Pages 553–578 in h. Mooney and E. Zavelta, editors. Ecosystems of California. University of California Press, Berkeley, California, USA, 984 pp.
North, M. P., B. M. Collins, and S. L. Stephens. 2012. Using fire to increase the scale, benefits and future maintenance of fuels treatments. Journal of Forestry 110:392–401.
North, M., and P. Manley. 2012. Managing forests for wildlife communities. Pages 73–80 in M. North, editor. Managing Sierra Nevada forests. General Technical Report PSW-GTR-237. USDA Forest Ser-vice, Pacific Southwest Research Station, Albany, California, USA, 184 pp.
North, M., G. Steger, R. Denton, G. Eberlein, T. Munton, and K. Johnson. 2000. Association of weather and nest- site structure with reproductive success in California spotted owls. Journal of Wildlife Man-agement 64:797–807.
North, M., S. Stephens, B. Collins, J. Agee, G. Aplet, J. Franklin, and P. Fulé. 2015b. Reform forest fire management. Science 349:1280–1281.
North, M., P. Stine, K. O’hara, W. Zielinski, and S. Stephens. 2009. An ecosystems management strategy for Sierra mixed-conifer forests. General Technical Report PSW-GTR-220 w/addendum. USDA Forest Service, Pacific Southwest Research Station, Albany, California, USA.
Parks, S. A., C. Miller, C. R. Nelson, and Z. A. holden. 2014. Previous fires moderate burn severity of subsequent wildland fires in two large western US wilderness areas. Ecosystems 17: 29–42.
October 2016 v Volume 7(10) v Article e0147820 v www.esajournals.org
STEPhENS ET AL.
Parks, S. A., C. Miller, J. T. Abatzoglou, L. M. holsinger, M. A. Parisien, and S. Z. Dobrowski. 2016. how will climate change affect wildland fire severity in the western US? Environmental Research Letters 11:035002.
Perry, D. A., P. F. hessburg, C. N. Skinner, T. A. Spies, S. L. Stephens, A. h. Taylor, J. F. Franklin, B. McComb, and G. Riegel. 2011. The ecology of mixed severity fire regimes in Washington, Ore-gon, and Northern California. Forest Ecology and Management 262:703–717.
Phillips, C. E., D. J. Tempel, and R. J. Gutiérrez. 2010. Do California spotted owls select nest trees close to forest edges? Journal of Raptor Research 44: 311–314.
Purcell, K. L., S. J. hejl, and T. A. Larson. 1992. Evalu-ating avian- habitat relationships models in mixed- conifer forests of the Sierra Nevada. Transactions of the Western Section of the Wildlife Society 28:120–136.
Rivera-huerta, h., h. D. Safford, and J. D. Miller. 2016. Patterns and trends in burned area and fire severity from 1984- 2010 in the Sierra de San Pedro Mártir, Baja California, México. Fire Ecology 12:52–72.
Roberts, S. L., D. A. Kelt, J. W. van Wagtendonk, A. K. Miles, and M. D. Meyer. 2015. Effects of fire on small mammal communities in frequent- fire forests in California. Journal of Mammalogy 96:07–119.
Roberts, S. L., J. W. van Wagtendonk, A. K. Miles, and D. A. Kelt. 2011. Effects of fire on spotted owl site occupancy in a late- successional forest. Biological Conservation 144:610–619.
Safford, h. D., and J. T. Stevens. In press. Natural range of variation (NRV) for yellow pine and mixed- conifer forests in the Sierra Nevada, southern Cascades, and Modoc and Inyo National Forests, California, USA. USDA Forest Service, Pacific Southwest Research Station, Albany, California, USA.
Safford, h. D., J. T. Stevens, K. Merriam, M. D. Meyer, and A. M. Latimer. 2012. Fuel treatment effective-ness in California yellow pine and mixed conifer forests. Forest Ecology and Management 274: 17–28.
Safford, h. D., and K. Van de Water. 2014. Using Fire Return Interval Departure (FRID) analysis to map spatial and temporal changes in fire frequency on National Forest lands in California. Research Paper Report PSW-RP-266. USDA Forest Service, Pacific Southwest Research Station, Albany, California, USA. General Technical Report PSW-GTR.
SAS Institute Inc. 2012. SAS 9.4 for Windows. SAS Institute Inc., Cary, North Carolina, USA.
Scholl, A. E., and A. h. Taylor. 2010. Fire regimes, for-est change, and self- organization in an old- growth
mixed- conifer forest, Yosemite National Park, USA. Ecological Applications 20:362–380.
Schwartz, M. W., N. Butt, C. R. Dolanc, A. holguin, M. A. Moritz, M. P. North, h. D. Safford, N. L. Stephenson, J. h. Thorne, and P. J. van Mantgem. 2015. Increasing elevation of fire in the Sierra Nevada and implications for forest change. Eco-sphere 6:art121.
Skinner, C. N., and C. Chang. 1996. Fire regimes, past and present. Pages 1041–1069 in Sierra Nevada Ecosystems Project: final report to Congress. Uni-versity of California, Davis, California, USA.
Spies, T. A., M. A. hemstrom, A. Youngblood, and S. hummel. 2006. Conserving old- growth forest diversity in disturbance- prone landscapes. Con-servation Biology 20:351–362.
Spies, T. A., et al. 2010. Underestimating risks to the northern spotted owl in fire- prone forests: response to hanson et al. Conservation Biology 24:330–333.
Steel, Z. L., h. D. Safford, and J. h. Viers. 2015. The fire frequency- severity relationship and the legacy of fire suppression in California forests. Ecosphere 6:art8.
Stephens, S. L., J. K. Agee, P. Z. Fulé, M. P. North, W. h. Romme, T. W. Swetnam, and M. G. Turner. 2013. Managing forests and fire in changing climates. Science 342:41–42.
Stephens, S. L., and B. M. Collins. 2004. Fire regimes of mixed- conifer forests in the north- central Sierra Nevada at multiple spatial scales. Northwest Sci-ence 78:12–23.
Stephens, S. L., J. M. Lydersen, B. M. Collins, D. L. Fry, and M. D. Meyer. 2015. historical and current landscape- scale ponderosa pine and mixed- conifer forest structure in the Southern Sierra Nevada. Ecosphere 6:art 79.
Stephens, S. L., R. E. Martin, and N. E. Clinton. 2007. Prehistoric fire area and emissions from California’s forests, woodlands, shrublands and grasslands. Forest Ecology and Management 251:205–216.
Stephens, S. L., J. D. McIver, R. E. J. Boerner, C. J. Fettig, J. B. Fontaine, B. R. hartsough, P. Kennedy, and D. W. Schwilk. 2012. Effects of forest fuel reduction treatments in the United States. BioSci-ence 62:549–560.
Stephens, S. L., et al. 2014a. California spotted owl, songbird, and small mammal responses to land-scape fuel treatments. BioScience 64:893–906.
Stephens, S. L., et al. 2014b. Temperate and boreal for-est mega- fires: characteristics and challenges. Fron-tiers in Ecology and the Environment 12:115–122.
Taylor, A. h., and R. M. Beaty. 2005. Climatic influ-ences on fire regimes in the northern Sierra Nevada mountains, Lake Tahoe Basin, Nevada, USA. Journal of Biogeography 32:425–438.
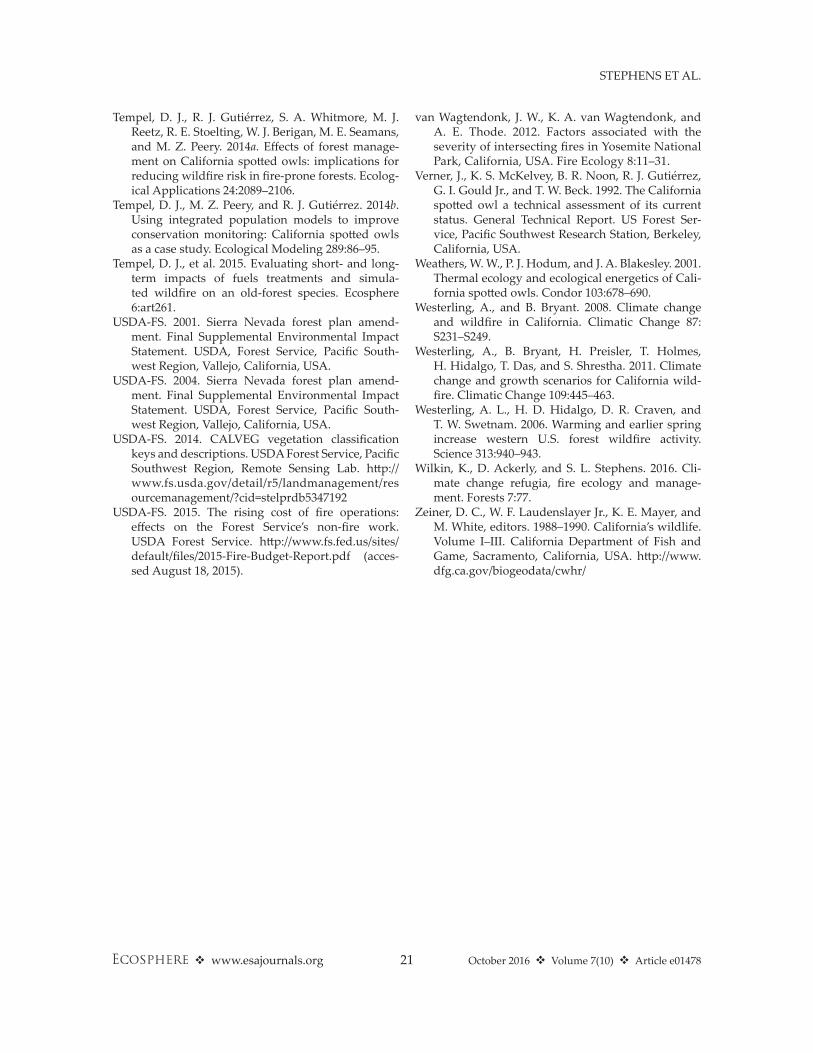
October 2016 v Volume 7(10) v Article e0147821 v www.esajournals.org
STEPhENS ET AL.
Tempel, D. J., R. J. Gutiérrez, S. A. Whitmore, M. J. Reetz, R. E. Stoelting, W. J. Berigan, M. E. Seamans, and M. Z. Peery. 2014a. Effects of forest manage-ment on California spotted owls: implications for reducing wildfire risk in fire- prone forests. Ecolog-ical Applications 24:2089–2106.
Tempel, D. J., M. Z. Peery, and R. J. Gutiérrez. 2014b. Using integrated population models to improve conservation monitoring: California spotted owls as a case study. Ecological Modeling 289:86–95.
Tempel, D. J., et al. 2015. Evaluating short- and long- term impacts of fuels treatments and simula-ted wildfire on an old- forest species. Ecosphere 6:art261.
USDA-FS. 2001. Sierra Nevada forest plan amend-ment. Final Supplemental Environmental Impact Statement. USDA, Forest Service, Pacific South-west Region, Vallejo, California, USA.
USDA-FS. 2004. Sierra Nevada forest plan amend-ment. Final Supplemental Environmental Impact Statement. USDA, Forest Service, Pacific South-west Region, Vallejo, California, USA.
USDA-FS. 2014. CALVEG vegetation classification keys and descriptions. USDA Forest Service, Pacific Southwest Region, Remote Sensing Lab. http://www.fs.usda.gov/detail/r5/landmanagement/res ourcemanagement/?cid=stelprdb5347192
USDA-FS. 2015. The rising cost of fire operations: effects on the Forest Service’s non-fire work. USDA Forest Service. http://www.fs.fed.us/sites/default/files/2015-Fire-Budget-Report.pdf (acces-sed August 18, 2015).
van Wagtendonk, J. W., K. A. van Wagtendonk, and A. E. Thode. 2012. Factors associated with the seve rity of intersecting fires in Yosemite National Park, California, USA. Fire Ecology 8:11–31.
Verner, J., K. S. McKelvey, B. R. Noon, R. J. Gutiérrez, G. I. Gould Jr., and T. W. Beck. 1992. The California spotted owl a technical assessment of its current status. General Technical Report. US Forest Ser-vice, Pacific Southwest Research Station, Berkeley, California, USA.
Weathers, W. W., P. J. hodum, and J. A. Blakesley. 2001. Thermal ecology and ecological energetics of Cali-fornia spotted owls. Condor 103:678–690.
Westerling, A., and B. Bryant. 2008. Climate change and wildfire in California. Climatic Change 87: S231–S249.
Westerling, A., B. Bryant, h. Preisler, T. holmes, h. hidalgo, T. Das, and S. Shrestha. 2011. Climate change and growth scenarios for California wild-fire. Climatic Change 109:445–463.
Westerling, A. L., h. D. hidalgo, D. R. Craven, and T. W. Swetnam. 2006. Warming and earlier spring increase western U.S. forest wildfire activity. Science 313:940–943.
Wilkin, K., D. Ackerly, and S. L. Stephens. 2016. Cli-mate change refugia, fire ecology and manage-ment. Forests 7:77.
Zeiner, D. C., W. F. Laudenslayer Jr., K. E. Mayer, and M. White, editors. 1988–1990. California’s wildlife. Volume I–III. California Department of Fish and Game, Sacramento, California, USA. http://www.dfg.ca.gov/biogeodata/cwhr/