Embed Size (px)
Citation preview

EVALUATION OF THE QUALITY ATTRIBUTES OF SELECTED LOCAL COWPEA
ACCESSIONS AND THEIR RESPONSE TO POSTHARVEST TREATMENTS
KIRAKOU STANLEY
A56/76116/2014
THESIS SUBMITTED IN PARTIAL FULFILMENT OF THE REQUIREMENT FOR
THE AWARD OF THE DEGREE OF MASTER OF SCIENCE IN HORTICULTURE
DEPARTMENT OF PLANT SCIENCE AND CROP PROTECTION
FACULTY OF AGRICULTURE
UNIVERSITY OF NAIROBI

i
DECLARATION
This thesis is my original work and has not been presented for award of a degree in any other
university.
Kirakou Stanley
Signature ……………………………….Date ……………………………..
This thesis has been submitted with our approval as university supervisors.
Prof. M. J. Hutchinson
Department of Plant Science and Crop Protection
University of Nairobi
P.O. Box 29053 - 00625,
Nairobi, Kenya.
Signature ………………………………….Date ………………………..…
Dr. Jane Ambuko
Department of Plant Science and Crop Protection
University of Nairobi
P.O Box 29053 - 00625, Nairobi
Signature ………………………………….Date …………………….…..
Dr. Willis O. Owino
Department of Food Science and Technology
Jomo Kenyatta University of Agriculture and Technology (JKUAT), Kenya
Signature……………………………………Date ………………………..

ii
DEDICATION
I dedicate this work to my parents Mr.Kirakou Lochilikou and Mrs. Veronica Kirakou, my wife
Doreen Chirchir and my sister Linah Kirakou for their love and support which ensured
successful completion of my studies.

iii
ACKNOWLEDGEMENTS
I would like to thank God for the grace and favour He has shown me throughout my studies and
project.
I acknowledge Kenya Agricultural Productivity and Agribusiness Project (KAPAP) through
Prof. Jesang Hutchinson which financed my project, The University of Nairobi for granting me a
scholarship and the Department of Food Science and Technology, Jomo Kenyatta University of
Agriculture and Technology for allowing me to use their facilities for my project work.
I am indebted to my supervisor Prof. Jesang Hutchinson for the guidance, time, criticism and
mentorship throughout this work. I appreciate the assistance and support from my other
supervisors; Dr. Jane Ambuko and Dr. Willis Owino.
My sincere appreciation goes to Mr. P. Karanja, Ms. Jescar Oruka, Mr. David Abuga, Mr.
Simion Bartilol and John Kimotho who assisted me with laboratory work.
I appreciate the support from all my friends and my classmates during my studies.

iv
LIST OF ACRONYMS
AFLP Amplified Fragment Length Polymorphism
ALVs African leafy vegetables
AOAC Association of Official Analytical Chemists
ASALs Arid and Semi-Arid Lands
EPC Export Promotion Council
HCD Horticultural Crop Directorate
KALRO Kenya Agricultural and Livestock Research Organisation
MAP Modified Atmosphere Packaging

v
ABSTRACT
African leafy vegetables (ALVs) have a great potential in reducing the gap in nutritional status
between low and high income households because of their nutrient densities and affordability.
Cowpea is one of the major ALVs produced and consumed widely at the Coast and Western
regions of Kenya as a dual purpose crop (grain and leaf). Although local cowpea accessions are
preferred by farmers and consumers, there are still many challenges encountered. There is lack of
sufficient information on nutrients and micro-nutrient densities and high postharvest losses. High
post-harvest losses have also been reported as a result of perishability. The objective of this study
was to evaluate and compare the nutritional and sensory attributes of five popular dual purpose
local cowpea accessions and an improved variety developed by KALRO. In addition, the effect
of blanching, solar drying and modified atmosphere packaging (MAP) on the shelf life and
quality attributes of one superior cowpea accession was evaluated.
The cowpeas were planted in The University of Nairobi field station during the short rains from
October to December 2014 and long rains from March to May 2015. The cowpea leaves were
randomly sampled in the experimental plots. One superior accession was chosen for post-harvest
treatments. The treatments were, solar drying without blanching, blanching in pure water and
solar drying, blanching in salty water and solar drying and fresh non-blanched leaves as control.
The samples were then analysed for proximates, vitamins, minerals, anti-nutrients, sensory
characteristics, colour change during processing and packaging, cumulative water loss and
wilting in The University of Nairobi and Jomo Kenyatta University of Agriculture and
Technology laboratories.
In the first objective on evaluating and comparing nutritional attributes of local cowpea
accessions with an improved variety, beta carotene content of M66 which is an improved variety
was the lowest at 29.71mg/100g whereas Sura Mbaya had the highest beta carotene content at
36.4mg/100g. On the other hand, M66 had the lowest ascorbic acid content of 192.8 mg/100g
whereas Usimpe Mtu Mdogo had the highest ascorbic acid content at 213.1mg/100g in season 1.
The iron content of Usimpe Mtu Mdogo was the lowest at 395.9PPM compared to Mnyenze at
1034.3 PPM in season 1.
In the second objective of evaluating the efficacy of post-harvest treatments on the quality of
fresh and processed cowpeas, it was found that blanching and dehydration had little effect on

vi
most proximate and mineral elements. However, vitamin and total phenolic contents were the
most affected. Solar drying without blanching recorded the highest vitamin retention levels at
68.02% for beta carotene and 68.39% for ascorbic acid unlike blanching in pure water and solar
drying at 55.58% for beta carotene and 21.08% for ascorbic acid and blanching in salty water
and solar drying at 52.78% beta carotene and 20.24% ascorbic acid. In addition, solar drying
without blanching recorded the highest retention total phenolic content at 149.91%. Blanching in
pure water and solar drying and blanching in salty water and solar drying recorded retention
levels of 62.58% and 65.79% of total phenolic content respectively. On the other hand, solar
drying without blanching, blanching in pure water and solar drying and blanching in salty water
and solar drying recorded a loss of 5.87%, 10.77% and 11.17% of oxalates and 37.22%, 69.98%
and 58.7% of nitrates respectively.
In the samples subjected to MAP, the end stage of control, ordinary polythene bag and Extend®
bag under room conditions was 1 day, 4 days and 6 days respectively. By the end stage control,
ordinary polythene bag and Extend® bag had lost 28.84%, 0.93% and 3.27% cumulative weight
for season 1 and 23.84%, 0.89% and 2.31% for season 2 respectively.
The results of the present study indicated that evaluated local cowpea accessions were
comparable with each other but slightly superior to the improved variety developed by KALRO.
Solar drying without blanching was found to be effective in maintaining the quality attributes of
cowpeas. In addition, MAP was found to be effective in preserving quality of fresh cowpea
leaves and improving shelf life. Therefore MAP and solar drying without blanching are simple
and convenient technologies for preserving cowpea nutrients and improving shelf life.
KEYWORDS: Cowpea accessions; dehydration; MAP; nutritional quality

vii
TABLE OF CONTENTS
DECLARATION .................................................................................................................................... i
DEDICATION ....................................................................................................................................... ii
ACKNOWLEDGEMENTS ..................................................................................................................iii
LIST OF ACRONYMS ........................................................................................................................ iv
ABSTRACT ........................................................................................................................................... v
TABLE OF CONTENTS ..................................................................................................................... vii
LIST OF TABLES ................................................................................................................................. x
LIST OF FIGURES .............................................................................................................................. xi
CHAPTER ONE .................................................................................................................................... 1
1.0 INTRODUCTION ...................................................................................................................... 1
1.1. Problem statement .................................................................................................................. 4
1.2. Justification of the study ......................................................................................................... 4
1.3. General objective .................................................................................................................... 5
1.3.1. Specific objectives .......................................................................................................... 5
1.3.2. Null hypotheses ................................................................................................................... 5
CHAPTER TWO ................................................................................................................................... 6
2.0 LITERATURE REVIEW ................................................................................................................ 6
2.1 Nutrition status in Kenya ............................................................................................................. 6
2.2African leafy vegetables(ALVs) in Kenya .................................................................................... 6
2.3Botany and centre of origin of cowpeas ........................................................................................ 7
2.4 Cowpea morphology .................................................................................................................... 8
2.5Uses of cowpea ............................................................................................................................. 8
2.6 Ecological growth requirements of cowpeas ............................................................................... 9
2.6.1 Temperatures ......................................................................................................................... 9
2.6.2 Rainfall .................................................................................................................................. 9
2.6.3 Edaphic factors and fertilizer application of ALVs ............................................................. 10
2.6.4 Light intensity...................................................................................................................... 10
2.7 Constraints of production and utilization of cowpeas ................................................................ 10
2.8Nutritional composition of ALVs ............................................................................................... 11
2.8.1 Anti-oxidative activities of ALVs ....................................................................................... 12
2.8.2 Minerals constituents of ALVs ............................................................................................ 13

viii
2.8.3 Other macro-nutrients.......................................................................................................... 14
2.8.4 Anti-nutrient content in ALVs ............................................................................................ 15
2.9 Post-harvest losses of cowpeas and other ALVs ........................................................................ 15
2.10 Post-harvest management ......................................................................................................... 16
2.11Sensory properties of AIVs ....................................................................................................... 17
CHAPTER THREE ............................................................................................................................. 18
3.0 EVALUATION OF NUTRITIONAL QUALITY ATTRIBUTES OF SELECTED SUPERIOR
LOCAL LEAFY COWPEA ACCESSIONS AND AN IMPROVED VARIETY .............................. 18
3.1. ABSTRACT .............................................................................................................................. 18
3.2. INTRODUCTION..................................................................................................................... 19
3.3. MATERIALS AND METHODS ......................................................................................... 20
3.3.1. Cowpea accessions under study .................................................................................... 20
3.3.2. Site description .............................................................................................................. 20
3.3.3. Experimental set up and preparation of cowpea leaves ................................................ 21
3.3.4. Moisture content ........................................................................................................... 21
3.3.5. Ash ................................................................................................................................ 21
3.3.6. Minerals ........................................................................................................................ 22
3.3.7. Crude protein content .................................................................................................... 22
3.3.8. Crude fibre .................................................................................................................... 22
3.3.9. Beta carotenes ............................................................................................................... 23
3.3.10. Ascorbic acid................................................................................................................. 23
3.3.11. Nitrates .......................................................................................................................... 24
3.3.12. Oxalates ......................................................................................................................... 24
3.3.13. Total phenolic content ................................................................................................... 24
3.3.14. Sensory evaluation ........................................................................................................ 25
3.3.15. Statistical analysis ......................................................................................................... 25
3.4. RESULTS ............................................................................................................................. 26
3.4.1. Proximate analysis ........................................................................................................ 26
3.4.2. Beta carotene, ascorbic acid and total phenols ................................................................... 27
3.4.3. Mineral elements ................................................................................................................ 29
3.4.4. Nitrates and oxalates .......................................................................................................... 31
3.4.5. Sensory evaluation ............................................................................................................. 32

ix
3.5. DISCUSSION ....................................................................................................................... 34
3.6. CONCLUSION .................................................................................................................... 36
CHAPTER FOUR ................................................................................................................................ 37
4.0 EFFICACY OF POST-HARVEST TREATMENTS IN MAINTAINING THE QUALITY
ATTRIBUTES OF COWPEA LEAVES ............................................................................................. 37
4.1. ABSTRACT .............................................................................................................................. 37
4.2. INTRODUCTION..................................................................................................................... 38
4.3. MATERIALS AND METHODS .............................................................................................. 41
4.4. PARAMETERS ANALYSED .................................................................................................. 42
4.4.1. Sensory evaluation ............................................................................................................. 42
4.4.2. Colour change evaluation ................................................................................................... 43
4.4.3. Cumulative weight loss (percentage) ................................................................................. 44
4.4.4. Wilting ................................................................................................................................ 44
4.4.5. Statistical analysis .............................................................................................................. 44
4.5. RESULTS ................................................................................................................................. 44
4.5.1. Proximate analysis .............................................................................................................. 44
4.5.2. Beta carotene, ascorbic acid and total phenols ................................................................... 46
4.5.3. Mineral elements ................................................................................................................ 48
4.5.4. Nitrates and oxalates .......................................................................................................... 49
4.5.5. Colour change during processing ....................................................................................... 50
4.5.6. Sensory quality analysis ..................................................................................................... 51
4.5.7. Cumulative weight loss ...................................................................................................... 53
4.5.8. Wilting ................................................................................................................................ 54
4.5.9. Colour change of fresh cowpea leaves in MAP ................................................................. 55
4.6. DISCUSSION ........................................................................................................................... 55
4.7. CONCLUSION ......................................................................................................................... 59
CHAPTER FIVE ................................................................................................................................. 60
5.0. OVERALL CONCLUSION AND RECOMMENDATION ........................................................ 60
7.0. REFERENCES ............................................................................................................................. 61
8.0. APPENDICES .............................................................................................................................. 78

x
LIST OF TABLES
Table 1: Performance of African Leafy vegetables 2012-2014 ...................................................... 3
Table 2: Selected proximate content of fresh cowpea leaves expressed in dry matter basis,
Season 1. ....................................................................................................................................... 26
Table 3: Selected proximate content of fresh cowpea leaves expressed in dry matter basis, season
2..................................................................................................................................................... 27
Table 4: Beta carotene, ascorbic acid and total phenolic contents of fresh cowpea leaves
expressed in dry matter basis, Season 1. ....................................................................................... 28
Table 5: Beta carotene, ascorbic acid and total phenolic contents of fresh cowpea leaves
expressed in dry matter basis, Season 2. ....................................................................................... 29
Table 6: Selected mineral element content of fresh cowpea leaves expressed in dry matter basis,
Season 1. ....................................................................................................................................... 30
Table 7: Selected mineral element content of fresh cowpea leaves expressed in dry matter basis,
season 2. ........................................................................................................................................ 31
Table 8: Levels of selected anti-nutrients of fresh cowpea leaves expressed in dry matter basis. 32
Table 9: Hedonic scores for sensory quality attributes of fresh cowpea leaves, season 1. ........... 33
Table 10: Hedonic scores for sensory quality attributes of fresh cowpea leaves, season 2. ......... 34
Table 11: Levels of selected proximate of fresh and processed cowpea leaves expressed in dry
matter basis, Season 1. .................................................................................................................. 45
Table 12: Levels of selected proximate of fresh and processed cowpea leaves expressed in dry
matter basis, Season 2. .................................................................................................................. 46
Table 13: Levels of beta carotene, ascorbic acid and total phenolic content of fresh and processed
cowpea leaves expressed in dry matter basis, season 1. ............................................................... 47
Table 14: Levels of beta carotene, ascorbic acid and total phenolic content of fresh and processed
cowpea leaves expressed in dry matter basis, season 2. ............................................................... 47
Table 15: Levels of selected mineral elements of fresh and processed cowpea leaves expressed in
dry matter basis, season 1. ............................................................................................................ 48
Table 16: Levels of selected mineral elements of fresh and processed cowpea leaves expressed in
dry matter basis, season 2. ............................................................................................................ 49
Table 17: Levels of selected anti-nutrients of fresh and processed cowpea leaves expressed in dry
matter basis. .................................................................................................................................. 50
Table 18: Hedonic scores for sensory quality attributes of fresh and processed cowpea leaves,
season 1. ........................................................................................................................................ 52
Table 19: Hedonic scores for sensory quality attributes of fresh and processed cowpea leaves,
Season 2. ....................................................................................................................................... 53

xi
LIST OF FIGURES
Figure 1: Hue angle distribution (in degrees). .............................................................................. 44
Figure 2: changes in colour (hue angle) of fresh, blanched and dehydrated cowpea leaves
expressed in degrees for season 1 an 2. ........................................................................................ 51
Figure 3: Percentage Cumulative weight loss of cowpea leaves packaged in Extend® bag and
ordinary polythene bag and control season 1 and 2. ..................................................................... 54
Figure 4: Wilting indices of cowpea leaves packaged in Extend® bag and ordinary polythene bag
and control season 1 and 2. ........................................................................................................... 54
Figure 5: Colour change of cowpea leaves packaged in Extend® bag and ordinary polythene bag
and control season 1 and 2. ........................................................................................................... 55

1
CHAPTER ONE
1.0 INTRODUCTION
Agriculture has been the mainstay of Kenya’s economy for decades. The sector contributes to
nutrition, food security, employment and foreign exchange earnings. According to The Kenya
Economic Report (2013), agricultural sector directly accounts for about 26% of Kenya’s Gross
Domestic Product (GDP) and 27% indirectly through linkages with manufacturing, distribution
and other service related sectors. The sector declined from a growth rate of 4.2% in the year
2012 to 2.9% in 2013 partly due to inadequate rainfall received in some growing regions in the
country but increased to 3.5% in 2014 (Economic Survey highlights, 2014 and 2015).
Agriculture industry accounts for 65% of Kenya’s total exports, 18% and 60% of the formal and
total employment, respectively. In addition it directly and indirectly supports the livelihood of
80% of the population living in the rural areas (Kenya Economic Report, 2013). According to
economic survey (2015), the value of marketed agricultural production declined marginally from
Ksh 334.8 billion in 2013 to 333.2 billion in 2014.
The horticulture sector has been a major contributor to the good performance of the agricultural
sector. In the year 2012 and 2013, the subsector contributed 26% and 25% respectively to the
agricultural growth by value (Economic survey, 2014). By quantity, fresh horticultural produce
contributed 205,700T in 2012, 213, 800Tin 2013 and 220,200T in 2014 becoming second after
tea (Economic Survey highlights, 2014 and 2015). These statistics should be taken as an estimate
to the actual horticultural growth since most of the horticultural commodities such as African
leafy vegetables do not reach formal markets or export. In addition, many surveys do not inform
of the farm gate prices of vegetables, farm level production quantity and value at the local and
informal markets. Considering this situation, the horticultural subsector may be having far much
more positive impact to the population than it is estimated.
The horticulture sector is made up of subsectors which include flower and ornamental, fruit and
vegetable production. According to HCD report (2014), vegetables occupied the largest
production portion at 32% by value, followed by flowers at 30%, fruits at 30%, and nuts at 5%.
The major export destination is the European Union where the horticulture industry command
about 30% market share. In general, vegetable production in Kenya has been increasing steadily

2
over the past years. In 2012, the quantity of vegetables exported was 66,352 tonnes valued at
Ksh.20226 million. In 2013 exports increased to 77172 tonnes valued at Ksh.22923 million and
in 2014, exports slightly reduced to 70335T valued at Ksh.18781 million (HCD Annual Report,
2014). Considering the report touched on exports, it means that the production is larger since the
consumption in the country is larger compared to the exports. The major producing counties as
reflected by exports include Meru, Bungoma, Murang’a, Kiambu and Kirinyaga in that order
(HCD Annual Report, 2014).
Vegetable production is widely practised in the country. The development of the sector is due to
the readily available markets with a higher marginal return per unit areas compared to cereal
crops. Vegetable production has short growth cycles enabling farmers to have two to three
seasons in a year. This combination, in addition to emerging health issues has placed vegetable
production at a strategic position to expand even more.
Vegetables can be classified as exotic or indigenous depending on their origin, utilization and
commercialization. Some exotic vegetables commercialized in Kenya include kales, spinach,
snow peas, French beans among others whereas indigenous vegetables include African
nightshade, spider plant, cowpeas, amaranth among others. Major export vegetables comprise of
exotic and Asian vegetables (EPC, 2014). Current trends have seen the incorporation of value
addition strategies to ensure continuous availability and reduction of postharvest losses. Such
strategies include canning, freezing, solar drying and/or roasting in addition to pre-packs for
fresh produce meant for supermarkets.
Unlike other type of vegetables, trade and consumption of African leafy vegetables had been
side-lined to serve the local population especially in the rural areas or among the poor and denied
entry to formal markets. However, the HCD report,(2014) indicated that there has been a
tremendous increase in production in ALVs in the country. This can be attributed to the
awareness created to the population on the health benefits and nutritional superiority of these
vegetables (Abukutsa, 2007) and value chain support by non-governmental organisations. As a
result, in 2014 the acreage under ALVs increased by 10% and the yields and value rose by 5.6%
and 6.2%, respectively (HCD Annual Report, 2014). According to AVRDC (2010), it is
estimated that approximately 9000 tonnes of ALVs have been sold to formal and informal
markets in the period between 2008 and 2010 in central Kenya only.

3
Table 1: Performance of African Leafy vegetables 2012-2014
2012 2013 2014
Crop Area
(Ha)
Quantity
(Ton)
Value
Kshs
(million)
Area
(Ha)
Quantity
(Ton)
Value
Kshs
(million)
Area
(Ha)
Quantity
(Ton)
Value
Kshs
(million)
African
Nightshade
2,820 18,945 505 3,018 29,796 561 3,376 25,435 763
Spider
plant
2,273 20,134 455.1 2,239 20,912 529.1 2,435 16,752 640.5
Cowpeas 25,544 69,940 910 23,195 55,223 764 24,431 65,096 622
Jute
mallow
1,708 7,919 215 2,096 10,269 251.1 1,832 9,290 284.5
Leaf
Amaranth
1,035 9,913 208.3 1,187 12,208 227.7 1,586 17,001 195.6
Pumpkin
leaves
797 3,948 107.8 877 4,552 119.4 921 4,602 129.2
Rattle pod 286 1,984 43.2 370 2,780 58.2 533 5,100 119.1
Grain
Amaranth
525 3,951 85.3 445 1,856 63.3 389 2,057 70
Total 34,988 136,734 2,530 33,427 137,596 2,574 35,503 145,333 2,824
Source: HCD report (2014).
Kenya, like many other tropical countries, is endowed with a great diversity of ALVs. These
vegetables have a great social and economic importance for the local communities therefore
making them part and parcel of their culture. The priority species grown and marketed in Kenya
include African nightshades (Solanum spp), amaranth (Amaranthus spp.), spider plant (Cleome
gynandra), cowpeas (Vigna unguiculata), Ethiopian kale (Brassica carinata), ‘mitoo’
(Crotalaria ochroleuca and C. brevidens)), ‘kahuhura’ (Cucurbita ficifolia), jute plant
(Corchorus olitorius) and pumpkin leaves (Cucurbita maxima and C. moschata). (Irungu et al.,
2007). Among the ALVs, African nightshade accounted for 27% of market value followed by
Spider plant and Cowpeas at 23% and 22% respectively in 2014 (HCD report, 2014). However,

4
in terms of quantity produced, cowpea outperformed all other ALVs from 2012 to 2014 as shown
in Table 1.
Cowpea (Vigna unguiculata) is an important grain legume in tropical and subtropical regions
where a shortage of animal protein sources is often experienced (Tshovhote et al., 2003).
Although a lot of emphasis has been put on the grain crop, the high potential in the vegetable has
not been fully exploited (Abukutsa, 2003).
1.1.Problem statement
Cowpea leaves has been viewed as a woman’s crop and therefore it has received little attention
from stakeholders (Abukutsa, 2003).Nutritional information and quality among the cultivated
cowpea varieties is scanty (Muchoki et al., 2007). However, the situation is worse among local
cowpea accessions although they are preferred by farmers because of superior taste and
palatability compared to improved varieties such as KVU, K-80 and M66 (KARI, 2010). The
information available on the nutritional quality of cowpea leaves has been restricted to improved
varieties and some few local accessions (Mamiro et al., 2011). However, the nutritional
information available for the few lines studied has recorded a very large variability. For instance
Mamiro et al., (2011) indicated that cowpeas crude protein ranges from 18 to 25%, Okonya and
Maass (2014) found the protein content to be between 29.4 to 34.3% whereas, Ono et al., (1996)
recorded as high as 43% crude protein content. On the other hand, ascorbic acid levels reported
range of between 33.5mg/100g to 308 mg/100g (Muchoki et al., 2007; Ahenkora et al., 1998;
Njoroge et al., 2015).
The potential of cowpea leaves has not been maximized due to post-harvest handling limitations
(Affognona et al., 2014). It is estimated that post-harvest losses contribute to about 50% of total
losses in the cowpea value chain (Masarirambi et al., 2010). The high losses can be attributed to
lack of proper post-harvest knowledge, high perishability, poor processing practises and
inefficient or high cost of post-harvest technologies. The situation is worsened during the periods
of glut where production of these vegetables exceeds market demand.
1.2.Justification of the study
Local cowpea accessions have important significance to farmers although their nutritional
quality has not extensively assessed (KARI, 2010). Nutritional profiling of superior local cowpea

5
accessions study will compliment or add new information that will help in sensitizing the entire
population to enhance utilization of cowpea vegetable. Ilelaboye et al., (2013) indicated that
adequate nutritional information on ALVs will be useful for nutritional education to the public
especially the vulnerable groups as a means to improving their nutritional status. The information
will also enable further improvement of the local accessions which are thought to be adapted to
wide range of climatic conditions (D’Andrea et al., 2007).
The high post-harvest losses on cowpea vegetable have led to led to decreased availability of the
vegetable in households and markets (Shiundu and Oniang’o, 2007). The existing technologies to
reduce post-harvest have been inefficient or expensive to the resource constrained farmer. Such
technologies include sun drying, fermentation, charcoal cooling and refrigeration (Muchoki et
al., 2007). However, very few technologies that suit small scale farmers been evaluated. Low
cost methods of improving and lengthening shelf life such as modified atmosphere packaging
and solar drying have been proposed (Chavasit et al., 2002) but have not been tested for ALVs.
The reduction in post-harvest losses will be improved nutritional and food security and income.
1.3.General objective
To evaluate the nutritional quality attributes of local cowpea accessions and reduce loss of the
quality attributes to improve the shelf life and enhance availability of quality vegetables and
improve food security.
1.3.1. Specific objectives
1. To compare the nutritional quality attributes of selected superior local leafy cowpeas
accessions with an improved variety.
2. To evaluate the effect of blanching, solar drying and modified atmosphere packaging on
the quality attributes and shelf life of cowpeas leaves.
1.3.2. Null hypotheses
1. Selected superior local cowpea accessions have similar nutritional content compared to
the improved variety.
2. Blanching, solar drying and modified atmosphere packaging does not preserve quality
and does not improve the shelf life of cowpea leaves.

6
CHAPTER TWO
2.0 LITERATURE REVIEW
2.1 Nutrition status in Kenya
Malnutrition is one of the major concerns in Kenya and many other developing countries (Mibei
et al., 2011). Children being weaned, pregnant and lactating mothers are the most affected. The
occurrence of nutrient-deficiency diseases such as night blindness, scurvy and rickets are
common in rural areas and informal settlements in Kenya (Mibei et al., 2011). It is estimated that
35% of children under the age of five years are stunted, 4% are severely underweight, 6% are
wasted and one in ten infants are born with a low birth weight in Kenya (UNICEF, 2009).
It is noted that protein-energy malnutrition of infants is one of the major nutritional problems in
the world (Oyeleke et al., 1985). This can be attributed to the lack of proper constituted weaning
foods, the provision of weaning foods with inadequate protein content, and to the use of foods
too low in energy density to satisfy the needs of the growing infant. Nutritional deficiencies of
iron and zinc are also widespread in developing countries, where staple diets are frequently
plant-based and consumption of meat and other animal-based food products is low due to
prohibitively high price (Smith and Eyzaguirre, 2007). One of the contributing factors to
malnutrition is the poor quality of food that is consumed (Senga et al., 2013). Owing to the rich
nutrient content of ALVs, (Abukutsa, 2007) consumption of the right amount of these vegetables
can improve the status of malnutrition.
2.2African leafy vegetables (ALVs) in Kenya
Kenya just like any other African country is endowed with a great diversity of African leafy
vegetables (ALVs). The priority species marketed in Kenya include African nightshades
(Solanum spp), amaranth (Amaranthus spp.), spider plant (Cleome gynandra), cowpeas (Vigna
unguiculata), Ethiopian kale (Brassica carinata), ‘mitoo’ (Crotalaria ochroleuca and C.
brevidens)), ‘kahuhura’ (Cucurbita ficifolia), jute plant (Corchorus olitorius) and pumpkin
leaves (Cucurbita maxima and C. moschata) (Irungu et al., 2007). Some of the vegetables grow
naturally in the wild and not domesticated. They includestinging nettle (Urtica massaica) and
vine spinach (Basella alba) which are consumed in western Kenya and parts of Rift Valley
(Tumwet et al., 2014). The degree of importance and preference of these vegetables varies with
the various regions and ethnic groups in Kenya. For instance, cowpeas, slenderleaf, spiderplant,

7
African kale and African nightshades are popular in Nyanza and Western region (Abukutsa et
al., 2005).
African leafy vegetables have been grown and utilized traditionally by many African
communities and are believed to possess several nutritional advantages and potentials that have
not been fully exploited (Schippers, 2000). They have been found to be important source of
adequate amounts of vitamins and minerals (Abukutsa, 2007). Since high proportions of ALVs
are consumed in the household level, they contribute to nutrition security (Hutchinson et al.,
2016).In addition, the excess sold contributes to household incomes (Mwaura et al., 2013).
In recent years, ALVs have gained commercial importance as a result of the growth in awareness
and marketing (Irungu et al., 2007). As a result, trade in these vegetables have been conducted in
more formal marketing channels, especially in urban areas. African leafy vegetables have
therefore provided empowerment opportunities to women and other resource constrained groups
through their role in subsistence and commercial production. Abukutsa et al., (2005) indicated
that, although growing of ALVs still follows traditional farming system such as using organic
sources of manure that are available on-farms, intervention to exploit the potential for
commercialization exist. Therefore, to realize full potential, technical support for ALV farming
is important (Mwaura et al., 2013). The suggested support include seed supply systems, value
chain intervention, postharvest management, promotion and marketing and awareness
campaigns.
2.3Botany and centre of origin of cowpeas
Cowpea is a widely grown crop in the semi-arid and sub-humid zones of Africa and Asia
(Padolosi and Ng, 1997). West and Central Africa particularly dominate world production
(Lambot, 2002). It is primarily a savannah species, highly adapted to marginal environments and
depleted field conditions where other crops do not perform well (D’Andrea et al., 2007).
Cowpea [Vigna unguicalata (L.)Walp.] is a diploid species (2n=2x=22) belonging to the section
catiang, subspecies unguiculata, genus Vigna, tribe Phaseoleae and the family Fabaceae (Ng
and Marechal, 1985). Studies using amplified fragment length polymorphism analysis (AFLP)
have concluded that the two most likely areas of early domestication of cowpea are tropical West
or north-eastern Africa (Coulibaly et al., 2002). Specifically, cowpea has been found to be native

8
to Africa, West Africa, Nigeria being the primary centre of diversity (Ng and Marechal, 1985).
South-Eastern Africa is however reported as the centre of diversity of the wild Vigna species (Ng
and Marechal, 1985). Studies have further shown that India appears to be a secondary centre of
diversity since significant genetic variability occurs on the subcontinent (Pant et al., 1982). The
study also indicated that there is likelihood that the crop was first introduced to India during the
Neolithic period.
2.4 Cowpea morphology
Cowpea is an herbaceous warm-season annual plant that shares common characteristics such as
appearance with common bean except that their leaves are generally darker green, shinier, and
less pubescent (Timko et al., 2007). In addition, they are more robust, with better developed root
systems, thicker stems and branches (Timko et al., 2007). Cowpea growth habit can be erect,
semi-erect, prostrate or climbing depending on the genotype. Ecological factors also have shown
to greatly influence the morphology and physiology of the crop. Emergence is epigeal just like
common bean and lupin (Timko et al., 2007). Cowpea primarily is self-pollinating, but with
outcrossing rates of as high as 5%. Most cowpea genotypes are photoperiod sensitive (Craufurd
et al., 1997) and according to Wien and Summerfield (1980), they are generally quantitative
short day plants with a varying critical day length but generally lies close to 13.5 hours.
Photoperiod has tremendous effect on vegetative development, phenology and reproductive
development. For instance, flowering is delayed but not prevented by photoperiods longer than
critical value (Nuhu and Mukhtar, 2013). Cowpea genotypes usually adapt to their diverse
environment through plasticity in phenology and morphology conditions affected by temperature
and photoperiod (Wien and Summerfield, 1980).
2.5Uses of cowpea
Cowpea is a versatile crop with a wide range of uses. Young cowpea leaves are consumed as an
accompaniment of a stable starch food in at least 18 countries in Africa and 7 countries in Asia
and the Pacific (Ahenkora et al., 1998). The leaves are boiled as with most traditional
preparation systems, boiled and fried or fried only (Imungi and Potter, 1983). Cowpea grain can
be boiled and fried then eaten as an accompaniment or in a mixture with other starch based
grains such as maize. In addition, the grain can be ground to obtain flour used in food/feed
fortification, generation of oil and manufacture of cakes (FAO, 1997). The addition of cowpea to

9
plantain based snacks has been documented to increase their protein content considerably (Etsey
et al., 2007). Oyeleke et al., (1985) indicated that cowpea grain can be used to improve popular
Nigerian weaning foods among breastfeeding children which included a mixture of sorghum
(Sorghum bicolor) with a limited amount of dried-milk powder.
2.6 Ecological growth requirements of cowpeas
Cowpeas and many other African indigenous vegetables are domesticated at almost all the agro-
ecological zones. They are grown from the sea level to regions above 1800 meters above the sea
level. In general, indigenous vegetables are well adapted to harsh climatic conditions and disease
infestation and are easier to grow in comparison to their exotic counterparts (Abukutsa, 2010).
This can be attributed to the existing wide genetic base as a result of low selection pressure in
addition to the early maturity intervals.
2.6.1 Temperatures
The importance of temperature in the crop production has been studied for a long time. The rate
of growth and other metabolic reactions highly depend on temperatures. However, the effects of
high temperatures and drought are confounding therefore strategies to mitigate one can apply to
the other. The best vegetative growth of cowpea is possible with temperatures varying from 21 to
33°C, with higher temperatures causing earlier flowering and flower abscission which results to
poor pod set (Dugje et al., 2009). Night temperatures above 17°C can cause flower abscission in
some cultivars during flowering (Dugje et al., 2009).
2.6.2 Rainfall
Cowpeas naturally have some tolerance to droughts, a factor which has been improved by the
development of early maturity varieties which avoids drought for the purposes of seed
production (Dugje et al., 2009). Cowpeas perform well in areas with rainfall range is between
500-1200 mm/year. The development of extra-early and early maturing cowpea varieties has
seen the crop thriving in areas getting rainfall is less than 500 mm/year (Dugje et al., 2009).
Proper development of cowpea is hampered by excessive rainfall during vegetative growth.
Hailstones are detrimental during the flowering period since the crop will lose its flowers leading
to 100% yield loss. Supplemental irrigation during the dry seasons is necessary to ensure that
seed production is optimized in addition to maximizing other physiological processes leading to
improved productivity.

10
2.6.3 Edaphic factors and fertilizer application of ALVs
Cowpeas and other ALVs quantitatively respond very well to added organic and inorganic
nutrients. However the crop can thrive to produce protein-rich vegetative material as well as seed
(Dugje et al., 2009).The application of NPK fertilizer in small quantities to cowpea has been
shown to be beneficial however, the response is genotype dependent (Abayomi et al, 2008).
Application of animal manures have been shown to significantly increase the number of leaves,
caused greater nodulation, produced higher number of pods per plant, yielded maximum number
of seeds per pod, greater 100-seed weight, higher yields and increased, seed quality compared to
chemical and non-fertilizer treatments (Shahardeen and Seran, 2013).
Cowpeas can be planted in soils that vary from sandy to clayey, but productivity is restricted by
water logged soils. Neutral soil pH is optimal for cowpea production however, they can grow in
acid soils where aluminium toxicity occurs (Dugje et al., 2009). In addition, the crop is also
highly adapted to marginal environments and depleted field conditions where other crops do not
perform well (D’Andrea et al., 2007).
2.6.4 Light intensity
Small holder farmers mostly practise intercropping when growing cowpeas and other ALVs
because of limited parcels of land. Intercropping directly affects light intensity to any shorter
crop in the intercrop. Varied results have been obtained as a result of intercropping cowpea with
various crops. In a study, it was found that corn intercropped with cowpea was far more effective
than mono-crop corn to produce higher dry matter yield and roughage for silage with better
quality (Geren et al., 2008). The situation works for maize because of nitrogen fixation but with
reduction in the productivity of the cowpea. Obadoni et al., (2009) indicated that dry matter yield
of cowpea varieties significantly decreased with increasing weed densities. Other parameters
affected by impaired light intensities are days to flowering, number of pods and yield.
2.7 Constraints of production and utilization of cowpeas
Growth and development of ALV production has been limited by several policy, production and
postharvest factors. According to Abukutsa (2010), there has been a continuous tendency of
neglect from consumers, breeders and educated population for the development and consumption
of these vegetables due to the introduction of exotic and more palatable vegetables. Although

11
there have been increased campaigns on the value of these vegetables, there is still inadequate
knowledge on nutrition and therapeutic properties.
There has been inadequate high quality seed to the industry as seeds are relied from untrained
farmer seeds. The few sold by formal seed providers are not pure and more than often contains a
mixture of genotypes and weeds. In addition, there is lack of enough technical and utilization
packages. The available technologies have shown low levels of adoption partly because of
socioeconomic aspects of the people.
Lack of awareness on postharvest technologies has hindered the expansion of the subsector to
meet the demand of the vast market. The produce tends to have a very short shelf life coupled
with poor post-harvest handling techniques. The occurrence of peaks and troughs in production
in addition to poor marketing strategies has led the industry to suffer devastating losses.
Production of most food crops such as grains, legumes and vegetables are largely dependent on
the seasonal and inter-annual change in rainfall (Awotoye et al., 2010). It is documented that the
response of cowpea yield to climate change vary from one geographical location to the other
(Ajetomobi et al., 2010) giving an indication that other factors such as soil and biological
systems play an important role in climate change response. Awotoye et al., (2010) also indicated
that a number factors both climatic and non-climatic interact which confounds the effects of
rainfall amount and the crop yields. In general, it is indicated that there is a negative correlation
between climate change and cowpea productivity (Ajetomobi et al., 2010).
2.8Nutritional composition of ALVs
African leafy vegetables have provided food and nutritional security to various communities in
Africa. This has led them to acquire a significant portion of the traditional diets especially to
resource constrained households (Grubben and Denton, 2004; Schippers, 2000). Nair et al.,
(2013) and Aja et al., (2010) indicated that ALVs are essential in supplying the body with
minerals, vitamins and certain hormone precursors, proteins and calories. It has been indicated
that majority of ALVs are nutritionally superior to exotic vegetables (Nnamani et al., 2009;
Rachel, 2015). The factors that make them popular among resource constrained population
include their superiority in health benefits and affordability (Abukutsa, 2003). However, in the

12
recent years, ALVs have gained momentum among urban middle class and rich due to their
nutritional and health benefits (Chweya and Eyzaguirre, 1999).
2.8.1 Anti-oxidative activities of ALVs
Vitamins are key component on ALVs which are important in maintaining the body defence
system hence prevention of diseases (Abukutsa, 2003). Ascorbic acid is a potent antioxidant that
facilitates the transport and uptake of non-heme iron at the mucosa in addition to reduction of
folic acid intermediates and the synthesis of cortisol (Bender, 2009). Its deficiency includes
fragility to blood capillaries, gum decay and scurvy (Bender, 2009).Vitamin A is important for
normal vision, gene expression, growth and immune function through its ability in maintaining
and enhancing epithelial cell functions (Lukaski, 2004). Vitamin B complex helps in conversion
of carbohydrates to glucose for energy production. They are also important for healthy skin,
liver, eyes and hair in addition to enhancing proper functioning of the nervous system (Bender,
2009). On the other hand, vitamin E is a powerful antioxidant which helps to protect cells from
damage by free radicals such as hydrogen peroxides in addition to formation and normal function
of red blood cell and muscles (Lukaksi, 2004).
African leafy vegetable are rich in vitamins such as beta carotenes, vitamin B and C (Adéoti et
al., 2012). Nnamani et al., (2007) indicated that ALVs are important food, which are highly
beneficial for the maintenance of healthy body and prevention of diseases. The components
which form the protective agents include carotenes, ascorbic acid, riboflavin, folic acid
(Nnamani et al., 2007). On the other hand, George, (2003)stated that ALVs represent an
unquestionable natural pharmacy of minerals, vitamins and phytochemicals. A study on cowpea
leaves indicated that ascorbic acid and beta carotene content was 308 mg/100g and 33mg/100g
(Muchoki at al., 2007) while Njoroge et al., (2015) reported ascorbic acid levels of 91.0
mg/100g and beta carotene of 6.5mg/100g. On the other hand, Chikwendu et al., (2014) found
ascorbic acid content at 59.24mg/100g and beta carotene at 9.10mg/100g.
Abukutsa, (2010) indicated that ALVs contain non-nutrient compounds, preferably known as
phytochemicals that provide health benefits. One of the most important groups of
phytochemicals in ALVs is phenolics and flavonoids. Oboh and Akindahunsi, (2004) stated that
phenolics have potent anti-oxidative activity. However, the antioxidant activities of phenolics in
different vegetables markedly vary due to the differences in the phenolic compound structures

13
primarily related to their hydroxylation and methylation patterns (Meyer et al., 1998). A survey
conducted by Tumwet et al., (2014) gives an indication that most people in Kenya treasure the
medicinal properties of ALVs. It was suggested that the vegetables are consumed not only for
good nutrition but also for their association with various medicinal and immune boosting claims.
Adéoti et al., (2012) indicated that ALVs have been traditionally used as medicine to treat
several ailments because of the numerous phytochemicals they inherently possess. Some of the
health claims included anti-aging, ensuring smooth skin and boosting blood (Tumwet et al.,
2014). African leafy vegetable such as Celosia argentea L. possess mitotic inhibitory activities
which can be used in the development of drugs to prevent the uncontrolled proliferation of
cancer cells. In other cases, boiled amaranth leaves and roots have been traditionally used as
laxative, diuretic, anti-diabetic, antipyretic, anti-snake venom, anti-leprotic, anti-gonorrheal,
expectorant, to relieve breathing in acute bronchitis, anti-inflammatory, immuno-modulatory
activity, anti-androgenic activity and anti-helmintic properties (Alegbejo, 2013). In general,
regular consumption of vegetables is recommended for better health and management of chronic
diseases such as cardiovascular complications, diabetes and cancer (Thompson, 1993).
2.8.2 Minerals constituents of ALVs
Most ALVs are rich sources of minerals like calcium, iron and phosphorous (Nnamani et al.,
2007). Calcium is a constituent of bones and teeth and regulates nerve and muscle function.
Potassium is the principal cation in intracellular fluid and functions in acid base balance,
regulation of osmotic pressure, muscle contraction and Na+/K
+ ATPase (Murray et al.,
2000).Iron, on the other hand is essential in red blood cell formation (Chandra, 1990). Its
deficiency results in decrease in red blood cells hence anaemia. Too little iron in the diet could
cause poor absorption of iron by the body which can result to low blood pressure. Vegetable
cowpea diet like many other ALVs can by far alleviate the level of iron in the body hence proper
iron based metabolic functions are realized (Abukutsa, 2003). Zinc is an important trace element
in human nutrition and fulfils many biochemical functions in human metabolism (Chandra,
1990). It is the activation factor of several enzymes such as carboanhydrase, alkaline
phosphatase and other enzymes in nucleic acid synthesis. It stabilizes the structure of RNA,
DNA and the ribosomes, and influences hormone metabolism (Institute of Medicine, 2001). Zinc
deficiency leads to several disorders such as growth retardation, diarrhoea and interferences of
cerebral functions (Institute of Medicine, 2001). Manganese is necessary for proper function of
14
the reproductive organs. In addition, it promotes growth and development, cell function, bone
growth, healthy immune system and healthy nerves (Minerals Education Coalition, 2013).
Njoroge et al., (2015) found cowpea leaf iron and calcium content to be 10.8mg/100g and
174mg/100g respectively whereas Muchoki et al., (2007) indicated that the content is
64.4mg/100g and1736mg/100g respectively. Okonya and Maass (2014) on the other hand found
iron content of several cowpea accessions to range from 17.6 mg/100g to 38.7 mg/100g.
Chikwendu et al., (2014) found that iron, zinc, calcium, phosphorus contents of cowpea leaves
were 77.29, 12.91, 39.87 and 383.20 respectively in mg/100g. It has been reported that the
proportion of micro and macro nutrients is significant for both developed lines and local varieties
of cowpea in Tanzania (Mamiro et al., 2011). Therefore, research has shown that the leaves of
cowpea can substantially contribute to the dietary intake of calcium, iron and zinc which are
constantly required for proper development and functioning of the body. It has been noted that
the potassium content in many ALVs is good in the control of diuretic and hypertensive
complications, because it lowers arterial blood pressure (George, 2003). An ALV such as
Corchorus olitorius is usually recommended for pregnant women and nursing mothers in Nigeria
due to its richness in iron (Taiga et al., 2008).
2.8.3 Other macro-nutrients
African leafy vegetable are rich in fibres, carbohydrates and proteins (Adéoti et al., 2012).
Noonan and Savage, (1999) indicated that the fibre content of the vegetables contribute to the
feeling of satisfaction and prevents constipation as it assist the process of digestion. African leafy
vegetables contain proteins superior to those found in fruits although inferior to those found in
grains and legumes (George, 2003).
Crude protein content and crude fibre in cowpea leaves were found at 31.8% and 18.2%
respectively (Muchoki, 2007) whereas Kasangi et al., (2010) found crude protein and crude fibre
at 35.97% and 12.76% respectively. Njoroge et al., (2015) on the other hand found crude protein
and crude fibre of cowpea leaves at 6.8g/100g and 4.6g/100g respectively. Ano and Ubochi
(2008) found that the protein content of the cowpea leaves was comparable with the protein
content of the popular grain. However, it is noted that the total dietary fibre content of cowpea
leaves increases with leaf age (Nielsen et al., 1997).

15
2.8.4 Anti-nutrient content in ALVs
Consumption of leafy vegetables provides health benefits but sometimes may turn out to be the
cause of certain health problems because of presence of anti-nutrients such as tannins oxalates,
phitates, nitrates, saponins, cyanide and protease inhibitors (Teutonico and Knorr, 1984; Ndidi et
al., 2014). In has been noted that the nitrates accumulate on the leaves rather than on the seeds
(Alegbejo, 2013). Presence of such anti-nutrients may compromise digestion and absorption of
vital nutrients (Uusiku et al., 2010). Such inherent toxic factors or anti nutritional components in
ALVs has been a major obstacle in exploiting the full benefits of their nutritional value
(Akindahunsi and Salawu, 2005). African leafy vegetables that have been found to have anti-
nutrient include shear butter leaves, amaranth leaves, cowpea leaves and Ethiopian kale
(Muchoki et al., 2010; Abimedi et al., 2009; Getachew et al., 2013; Yekeen et al., 2013).
However, it has been noted that the quantity and fraction of anti-nutrients are dependent on the
crop in question (Ilelaboye et al., 2013).
Phytate inhibits the functions of some digestive enzymes (Siegenberg et al., 1991). Many anti-
nutrient substances can reduce the amount of non-heme iron that is absorbed by the body.
Thompson, (1993) also indicated that higher intake of ILVs with considerable amounts of anti-
nutrients such as tannins, phytates and oxalates may impair bioavailability of nutrients and
minerals or directly cause illnesses or fatality such as haemolysis, with ultimate occurrence of
death when there is excessive ingestion of lectins.
To counter the effects of the anti-nutrients, several methods have been proposed. Getachew et
al., (2013) proposed that bulk consumption of monotype edible plant part in one meal should be
discouraged. Several methods of cooking and blanching have been shown to reduce the anti-
nutrient contents to levels that can be tolerated by monogastric digestive system (Fasuyi, 2006;
Ilelaboye, et al., 2013; Getachew et al., 2013). On the other hand, adequate toxicological
screening has been proposed to ensure safety of their consumption (Yekeen et al., 2013).
2.9 Post-harvest losses of cowpeas and other ALVs
African leafy vegetables contain more 85% water (Muchoki et al., 2007). The high moisture
content deprive ALVs of long shelf life. Under room conditions, these vegetables lose water very
fast and may not last for 24 hours (Abukutsa, 2010). This adversely affects the visual quality
which is the major factor in attracting consumer appeal. According to Masarirambi et al., (2010)
16
post-harvest losses are estimated to contribute about 50% total losses in cowpea value chain.
However, figures between 10–40%, and as high as 50–70% have been reported (FAO-World
Bank, 2010). The high losses can be as a result of insufficient proper post-harvest knowledge,
inefficient or expensive technologies, poor handling and lack of prioritisation in research work.
Some of the measures which have been proposed include value addition and optimisation of
postharvest technologies (Chavasit et al., 2002).
2.10 Post-harvest management
To achieve nutrition security especially in developing countries, measures to deal with the high
postharvest losses and extend the shelf life of the perishable ALVs should be initiated. Very few
small holder farmer friendly measures of curbing the postharvest losses and extending shelf life
have been evaluated. However, the evaluated ones could be ineffective or expensive to the
resource constrained farmer.
Among the measures to curb post-harvest losses is value addition (Affognona et al., 2014).
According to Mibei et al., (2011), value addition techniques have a great effect on the mineral
composition and quality of ALVs. Traditional sun drying of the ALVs results to a significant loss
of the nutrients such as vitamin C, B and beta-carotene. According to Zoro et al., (2015), sun
drying leads to a loss of vitamin C and beta carotene of between 58.41-100% and 62.64-100%
respectively. Coupled with losses that occur during cooking (Mibei et al., 2011; Kawashima and
Soares, 2003), the situation could result to consumption of nutrient poor, fibre rich vegetables.
On the other hand, fermentation has been evaluated as another means of value addition. Unlike
sun drying, the method is effective in reducing the losses of vitamins but technicality makes it
difficult for farmers (Wafula et al., 2015). According to Muchoki et al., (2007), fermentation
coupled with solar drying is effective in managing post-harvest losses and extending the shelf
life of cowpea leaves. It is indicated that beta carotene and ascorbic acid were retained at 91%
and 15% respectively and by the end of three months retention had reduced to between 23-52%
for beta carotene and 4-7% for ascorbic acid.On a positive note, a study evaluating the effect of
blanching on the nutritive value of vegetable found that the loss of nutritive components
including sugars, vitamins B1, B2, and C were minimal when blanching is done at 100 °C for 10
min (Jae-Yeun et al., 2003). Solar drying has been modified to improve the retention capacity of
vitamins in ALVs. Solar drying has been found effective in preservation of nutrients in ALVs but

17
in most cases, it has not been evaluated alone but in combination with other measures such as
blanching and fermentation (Muchoki et al., 2007; Njoroge et al., 2015).
Other measures to enhance the fresh shelf life of ALVs have been proposed. According to
Kariuki, (2014), evaporative coolers are effective in improving the shelf life of fresh ALVs up to
one week. Other evaporative coolers include pot coolers and brick coolers. Modified atmosphere
packaging has been used in the past to improve the shelf life of fresh products. It has been used
to lengthen the shelf life of fruits such as Mangoes, passion fruits among others (Kirakou et al.,
2014; Yumbya et al., 2014). However, this technology has not been evaluated on ALVs.
2.11Sensory properties of AIVs
Sensory analysis has been defined as a scientific discipline used to evoke, measure, analyse and
interpret reactions to those characteristics of food and materials as they are perceived by the
senses of sight, smell, taste and touch (Stone et al., 2012). Abimedi et al.,(2009) noted that the
palatability of most ALVs depends on handling when prepared as vegetable or soup. In a study
to determine the effects of value addition on sensory analysis by Nyambakaa et al.,(2004) it was
found that aroma, texture and appearance influenced the choice and characteristics of fresh, sun-
dried and solar-dried cowpea samples. The research established that the solar dried products do
not differ in colour and tenderness from the fresh leaves, unlike sun-dried leaves which differed
principally in appearance from the rest of the products.
Limited research has so far been conducted to ascertain the level of palatability of most ALVs.
However local cowpea accessions have been claimed by farmers in the coastal region of Kenya
to be more palatable (KARI, 2010). It has been noted that, farmers sometimes complain that
improved varieties have excessively bitter or less bitter taste than the local accessions or even
incidences of tough leaves which reduces its acceptability (Rowland, 1992)

18
CHAPTER THREE
3.0 EVALUATION OF NUTRITIONAL QUALITY ATTRIBUTES OF SELECTED
SUPERIOR LOCAL LEAFY COWPEA ACCESSIONS AND AN IMPROVED VARIETY
3.1. ABSTRACT
Cowpea is one of the major ALVs produced and consumed widely at the Coast and Western
regions as a dual purpose crop (grain and leaf). Although local cowpea accessions are preferred
by farmers and consumers, there are still many challenges encountered. There is lack of
sufficient information on nutrients and micro-nutrient densities. The development of nutrient
knowledge among the local accessions can unlock the potential of the crop to combat nutrient
deficiencies.The objective of this study was to evaluate and compare nutritional attributes of
local cowpea accessions with an improved variety.
Four local cowpea accessions and one improved variety were planted in The University of
Nairobi, field station during the short rains from October to December 2014 and long rains from
March to May 2015. The cowpea leaves were randomly sampled from the experimental plots.
One accession was chosen for post-harvest treatments. The treatments were,solar drying without
blanching, blanching in pure water and solar drying, blanching in salty water and solar drying
and fresh leaves as control. The samples were then analysed for selected proximate constituents,
vitamins, minerals, anti-nutrients and sensory characteristics in The University of Nairobi and
Jomo Kenyatta University of Agriculture and Technology laboratories.
Betacarotene content of M66 which is the improved variety was relatively lower at
29.71mg/100g compared to the local accessions; Katsetse had beta carotene content of
33.65mg/100g, Mnyenze 35.31mg/100g, Sura Mbaya 36.4mg/100g, Usimpe Mtu Mdogo
32.74mg/100g and Mumias-Tsimg'oli at 35.92mg/100g in season 1. On the other hand, M66 had
a lower ascorbic acid content of 192.8mg/100g compared to Mnyenze at 214.7mg/100g, Sura
Mbaya at 201.6mg/100g, Usimpe Mtu Mdogo at 213.1mg/100g and Mumias-Tsimg’oli at
204.4mg/100g but higher than Katsetse with 191mg/100g in season 1. M66 had the highest total
phenolic content at 4744 GAE mg/100g compared to Katsetse at 4058GAE mg/100g, Mnyenze
at 4588GAE mg/100g, Sura Mbaya at 4664GAE mg/100g, Usimpe Mtu Mdogo at 4000GAE
mg/100g and Mumias-Tsimg’oli with 4102GAE mg/100g. The iron content of M66 was lower at
499.7PPM compared to Katsetse at 730.2PPM, Mnyenze at 1034.3PPM, Sura Mbaya at
598.3PPM and Mumias-Tsimg’oli at 564.6PPM but higher than Usimpe Mtu Mdogo at

19
395.9PPM.The results of the present study indicated that evaluated local cowpea accessions were
comparable with each other but slightly superior to the improved variety developed by KALRO.
KEYWORDS: Cowpea accessions; nutritional quality
3.2. INTRODUCTION
Nutrition deficiency is a phenomenon that has affected children and lactating mothers in Kenya
and other sub-Saharan African countries for a long time (Mibei et al., 2011). In Kenya alone, it is
estimated that 35% of children under the age of five years are stunted, 4% are severely
underweight, 6% are wasted and 10% of infants are born with a low birth weight (UNICEF,
2009). A part from redressing these challenges, adoption, consumption and intensification of
research on African leafy vegetables can reduce the intensity of malnutrition because of its
inexpensive rich nutritional contents (Hallensleben et al., 2009; Mwajumwa et al., 1991; Irungu
et al., 2007; Smith and Eyzaguirre, 2007). Therefore, ALVs can become an indispensable tool
when it comes to reducing the prevalence of malnutrition among resource-constrained
households.
Cowpea (Vigna unguiculata) forms a major diet to household in Eastern and Southern Africa
both as grain and leaf (Ahenkora et al., 1998). In Kenya, it is ranked the third most important
indigenous vegetable (HCD, 2014). The popularity in Kenya is as a result of the accompanying
nutritional benefits (Rachel, 2015). Cowpea leaves have been incorporated into a variety of
dishes in the country. Young leaves and shoot tips are harvested either wholly by uprooting or by
removing harvestable leaves at a time (Ohler et al., 1996; Saidi et al., 2010).
There is a great diversity of cowpeas in Kenya. In Mombasa and Kilifi Counties alone, 32 local
accessions of were identified (Hutchinson et al., 2016). Most of these local accessions are
popular with farmers who cite superior palatability and taste (KARI, 2010). Although popular,
these local accessions have received little attention in research, more so on evaluation of their
nutritional quality attributes. The diversity could be holding important nutritional superiority that
could unlock improvement in consumption, management of nutrition and food security in Kenya.
Therefore to realize that, more local accessions of cowpeas should be evaluated for their
nutritional quality and differences. It has been noted that research work has concentrated on
improved varieties and some few local accessions (Mamiro et al., 2011). However, a lot of
variation on the results has been noted. For instance Mamiro et al., (2011) indicated that cowpeas

20
crude protein ranges from 18 to 25%, while Okonya and Maass (2014) reported protein content
of between 29.4 to 34.3%; Ono et al., (1996) indicated that the crude protein content of cowpea
leaves was 43%. On the other hand, results of ascorbic acid content of cowpea leaves have seen a
variation of between 33.5mg/100g to 308 mg/100g (Muchoki et al., 2007; Ahenkora et al., 1998;
Njoroge et al., 2015).
In this study, local cowpea accessions which have been tested for superiority in agronomic traits
(Hutchinson et al., 2016) were subjected to nutritional evaluations. The objective of the study
was to evaluate and compare the quality attributes of five local cowpea accessions and an
improved variety.
3.3.MATERIALS AND METHODS
3.3.1. Cowpea accessions under study
Four local cowpea accessions; mnyenze, usimpe mtu mdogo, katsetse and sura mbaya were
collected from Mombasa and Kilifi Counties, one local accession ‘Tsimg’oli’ from Butere-
Mumias (cream coloured seeds) and one improved variety Machakos 66 (M66) from KARLO,
Industrial Crops Research Institute, Mtwapa. The four local accessions from Mombasa and Kilifi
Counties had been evaluated for yield and response to agronomic traits and were found to be
superior (Hutchinson et al., 2016).The improved variety was chosen because of its popularity
and the fact that it is a dual purpose (KALRO, 2008).
3.3.2. Site description
The experiment was conducted at the University of Nairobi field station, Kabete Campus during
the short rain being season 1 (October to December 2014) and long rains being season 2 (March
to May 2015). The field is located in about 15 km to the West of Nairobi city and lies at Latitude
10 15′S and Longitude 36
0 44′E, and at altitude of 1820 m above sea level. Kabete has a bimodal
distribution of rainfall, with long rains from early March to late May and the short rains from
October to December, (Opijah et al., 2007). The locality receives an annual rainfall of 1,060 mm
(Onyango et al., 2011). The climate is typically sub humid with minimum and maximum means
temperatures of 13.70C and 24
0C, respectively. The soils in Kabete are predominantly red humic
nitisols containing 60-80% clay and are characterized as deep, well drained, dark reddish-brown
to dark brown clay (Michieka, 1977; Sombroek et al., 1982).

21
3.3.3. Experimental set up and preparation of cowpea leaves
The experiment was conducted using a Randomized Complete Block Design with three blocks.
Tenders leaves of the cowpea accessions were sampled in the morning in each experimental plot,
seven weeks after planting because at this stage, production for dual purpose cowpea is at its
optimal point (Inaizumi et al., 1999). The leaves were mixed well and packed in airtight plastic
containers. The packed leaves were taken to Jomo Kenyatta University of Agriculture and
Technology, Food Science laboratory within 2 hours in a cool box and stored in a deep freezer at
-180C before analysis.
The following parameters were analyzed:
3.3.4. Moisture content
Moisture content was determined according to Association of Official Analytical Chemists
(A.O.A.C) methods (A.O.A.C, 1990). Moisture dishes were placed in an oven until dry and
transferred to a desiccator and their weight recorded (W0). Five grams of the fresh sample was
weighed and transferred to the dry moisture dishes and weighed (W1). The samples were
transferred to a heated oven at 1050C for 3 hours. This time coincides with the time when a
constant weight is achieved. The fresh samples and the dish are then weighed after cooling in a
desiccator (W2).
The results were calculated and expressed as a percentage from the following formula;
%𝑀𝐶 =(𝑊1 − 𝑊2)
(𝑊2 − 𝑊0)∗ 100%
3.3.5. Ash
Moisture content was determined according to Association of Official Analytical Chemists
(A.O.A.C) methods (A.O.A.C, 1990). A clean dry crucible was weighed (W0). Five grams of the
fresh sample was weighed and put in the crucible and the total weight taken as (W1). The
samples in the crucibles were incinerated on a mantle (charring) until it turned black
(carbonisation) and no smoke was being produced. The charred sample was transferred to a
furnace at 5500C for 3 hours. The samples were allowed to cool in a desiccator and their weight
measured (W2).

22
The ash content was determined in percentage as follows;
%𝐴𝑠ℎ =(𝑊2 − 𝑊0)
(𝑊1 − 𝑊0)∗ 100%
3.3.6. Minerals
Minerals were analysed according to A.O.A.C. methods (A.O.A.C. 1990). Five grams of the
sample was charred in the oven for 30 minutes then put in a muffle furnace at 550°C for 3 hours
to ash. The ash was allowed to cool and diluted with 10ml of 1N hydrochloric acid. The mixture
was then filtered and diluted with 100 mL of distilled water. The absorbance of the solution was
read using atomic absorption spectrophy. Macro elements; potassium and calcium and micro
elements; iron, zinc and manganese were analysed.
3.3.7. Crude protein content
Crude protein content was determined using the semi micro Kjeldal method (A.O.A.C. 1990).
Two grams of sample was weighed into a digestion flask together with a combined catalyst of 5
grams potassium sulphate, 0.5 g of copper sulphate and 15 mL of sulphuric acid. The mixture
was heated in a fume hood till the digest colour turned blue signifying the end of the digestion
process. The digest was cooled, transferred to 100 mL volumetric flask and topped up to the
mark with deionized water. A blank digestion with the catalyst was also made. Ten mL of diluted
digest was transferred into the distilling flask and washed with distilled water. Fifteen mL of
40% NaOH was added and washed with distilled water. Distillation was done to a volume of
about 60 mL. Distillate was titrated using 0.02 N HCL to an orange colour of the mixed
indicator, which signified the end point.
%Nitrogen = (V1- V2) * N * F * 100/ (V * 100/S)
Where: V1 is the titre for sample in mL, V2 is titre for blank in mL; N= normality of standard
HCL (0.02); F= factor of standard HCL solution; V= volume of diluted digest taken for
distillation (10 mL); S= weight of sample taken for distillation (1 g);
% protein= %nitrogen* protein factor (6.25)
3.3.8. Crude fibre
Crude fibre was determined using Weende method involving acid hydrolysis (Van-Soest and
McQueen, 1973). Five grams of the sample was weighed (W0). Two hundred millilitre of 1.25%
sulphuric acid was added to the sample and boiled for 1 hour. The sample was filtered through a

23
glass wool and the residue boiled in 1.25% sodium hydroxide for 1 hour. The residue was then
filtered and washed with hot water, 1.25% hydrochloric acid, alcohol, petroleum ether and
diethyl ether. The residue was dried in a desiccator for 30 minutes, weighed (W1) and transferred
to a furnace at 5500C for 1 hour and weighed (W2).
Crude fibre was calculated and expressed as a percentage as follows;
𝐶𝑟𝑢𝑑𝑒 𝑓𝑖𝑏𝑟𝑒 =𝑊1 − 𝑊2
𝑊0∗ 100%
3.3.9. Beta carotenes
Beta carotene content was analysed using column chromatography and UV Spectrophotometry;
using acetone and petroleum ether extraction method as described by Rodriguez-Amaya and
Kimura, (2004). Two grams of fresh sample was weighed, chopped finely and placed in a mortar
with 10 mL of acetone. The sample was thoroughly ground and the acetone extract transferred
into 100 mL volumetric flask. The residue was extracted again with 10 mL acetone and the
extract added to the contents of the volumetric flask. The extraction with acetone continued until
the residue gave no colour. The combined extract was made to a volume of 100 mL with
acetone. Twenty five millilitres of the extract was evaporated to dryness using a rotary
evaporator. The residue was then dissolved in 10 mL petroleum ether and the solution introduced
into a chromatographic column which was eluted with petroleum ether and beta carotene
collected in a flask. The beta carotene elute was made to a volume of 25 mL with petroleum
ether and the absorbance read at 440 nm in a UV-Vis spectrophotometer (Shimadzu model UV –
1601 PC, Kyoto, Japan). Beta carotene standards were prepared to make a calibration curve
which was used to calculate the beta carotene content.
3.3.10. Ascorbic acid
The ascorbic acid content in the samples was determined by HPLC method according to Vikram
et al., (2005). Two grams of sample was weighed and extracted with 0.8% metaphosphoric acid.
The solution was made to 20 mL of juice and centrifuged at 10000 rpm for 10 minutes at 40C.
The supernatant was filtered and diluted with 10 mL of 0.8% metaphosphoric acid. The mixture
was then passed through 0.45 µm syringe filter and 20 µL injected into the HPLC machine.
Different concentrations of ascorbic acid standards were made to make a calibration curve.
HPLC analysis was done using Shimdzu UV-VIS detector at a wavelength of 266 nm. The

24
HPLC conditions were as follows; Mobile phase: 0.8% metaphosphoric acid, Column: C18,
Oven temperature: 250C, Flow rate: 1.0 mL/min, injection volume: 20µL.
3.3.11. Nitrates
The nitrate content in the test samples was determined by the calorimetric method using salicylic
acid according to Cataldo et al., (1975). Five hundred milligrams of fresh sample was weighed
and put in a test tube and 10 mL of hot (90-950C) distilled water added. The closed tubes were
placed in a water bath at 800C for 30 minutes and shaken. The samples were then cooled and
centrifuged at 4500 rpm for 10 minutes. The supernatant was decanted and the extract weighed.
Chlorophyll in leaf extract was removed by adding 0.5g magnesium carbonate (MgCO3) and
centrifuged again at 4500 rpm for 10 minutes. An aliquot of 0.2 ml of the filtrate was pippeted
into a 50 ml beaker and 0.8 ml of 5% (w/v) salicylic acid in sulphuric acid was added and mixed
thoroughly. The mixture was then allowed to stand for 20 minutes at ambient temperatures.
Nineteen millilitres of 2N sodium hydroxide was added and the mixture allowed to cool for 30
minutes. The absorbance was read at 410 nm against a common blank using UV-Vis
spectrophotometer (Shimadzu model UV – 1601 PC, Kyoto, Japan). The nitrate content was
determined from a standard curve and expressed in mg/100 g.
3.3.12. Oxalates
Analysis was done using HPLC method as suggested by Yu et al., (2002). Five hundred
milligrams of the fresh sample was homogenized in 5 mL of 0.5N HCL. The homogenate was
heated at 800C for 10 minutes with intermittent shaking. To the homogenate, distilled water was
added up to a volume of 25 mL. The solution was centrifuged at 10000 rpm for 10 minutes.
About 1 mL of supernatant was passed through a micro filter (0.45µm) before HPLC analysis.
Standards were prepared at varying concentrations for quantification. HPLC analysis was done
using Shimadzu UV-VIS detector.Condition of HPLC; Mobile phase: 0.01 N H2SO4, Column:
C18, Oven temperature: 250C, Flow rate: was 0.6 mL min
-1.
3.3.13. Total phenolic content
Five grams of the fresh sample was crushed and weighed into a 250 mL conical flask and about
50 mL methanol added. The flask was closed securely using parafilm and covered with
aluminum foil. The samples were put in a shaker and shaken for about 3 hours. They were then
kept in the dark and left to extract for 72 hours. Thereafter, the samples were filtered through

25
Whatman No. 4 filter paper and the filtrate concentrated to dryness using a rotary evaporator,
then re-dissolved in 12.5 mL of methanol and kept frozen until analysis.
Total Phenolics content was estimated by a calorimetric assay based on the procedure by Escarpa
and Gonzalez (2001). A 100 µL aliquot of the extracted sample was added to 500 µL of 0.2N
Folin-Ciocalteu reagent and 6 mL of distilled water. After mixing the content for 1 minute, 4 mL
of saturated sodium carbonate (Na2CO3)was added. Samples were left to stand at room
temperature for 90 minutes and absorbance measurements taken at 725 nm using a UV-VIS 1800
Shimadzu spectrophotometer (Shimadzu, Kyoto, Japan). Gallic acid was used as a reference
standard and the results expressed as milligram Gallic acid equivalents (mg GAE) per 100 g
extract in dry weight basis.
3.3.14. Sensory evaluation
Sensory analyses were performed on the fresh vegetables. The vegetable samples were evaluated
for general appearance (colour), aroma, texture, tenderness, taste/flavour, mouthfeel and overall
acceptabilityby untrained panelists, familiar with the taste of cooked cowpea leaves. The
evaluation was based on a standard seven point hedonic scale (where 1 = dislike extremely and 7
= like extremely).The sampled vegetables were boiled in a stainless steel pot for 25 minutes till
the leaves were tender. 500g of the fresh samples were boiled in 1.5 litre water with 12g salt
(Kensalt, Salt Manufacturers Kenya Ltd). The samples were then removed and excess water
drained. The vegetables were not fried to avoid change in the sensory parameters by additional
ingredients. The vegetables were then served to the panelists. The samples were served hot with
an accompaniment for ugali (a maize meal paste) as it is consumed locally. The samples served
had been coded with 4-digit random number to maintain panellist neutrality. Mineral water was
given to the panellists to rinse their mouths after every sample. The sensory panellists were
familiar with cowpea recipe and consumption. In seasons 1 the panellists were 31 and in season
2 they were 30. The panellists were chosen among university students aged between 21 and 26
years. Women consisted of about 70% of the total panellists.
3.3.15. Statistical analysis
Data was subjected to Analysis of Variance (ANOVA) and means separated by Fisher's Least
Significant Difference (LSD) at P ≤ 0.05 using Genstat statistical package, 15th
edition.

26
3.4.RESULTS
3.4.1. Proximate analysis
There was significant difference (p<0.05) in the moisture content of the accessions with usimpe
mtu mdogo recording the highest value with 86.85% and katsetse the least with 85.9% in the 1st
season but in the second season M66 had the least moisture content at 86.1%. The moisture
content was used to convert the other parameters to dry weight basis. Although there was
significant difference (p<0.05) among the treatments in the ash content in both the seasons, there
was no trend observed. In season 1 and season 2, Machakos 66 recorded the highest percentage
of crude fibre at 16.85% and 17.12%, respectively, as compared to the local accessions.
Mnyenze recorded the least crude fibre content at 15% and 15.32% for seasons 1 and 2,
respectively. In both seasons, usimpe mtu mdogo and M66 recorded the least percentage crude
protein content compared to the other accessions at 31.44 for season 1 and 31.12 for season 2
and at 31.7% and 31.37%, respectively. On the other hand, Mumias-tsimg'oli recorded the
highest percentage crude protein content at 36.16% for season 1 and 36.06% for season 2 as
shown in tables 2 and 3 below.
Table 2: Selected proximate content of fresh cowpea leaves expressed in dry matter basis,
Season 1.
Accession/Variety
Proximate contents (%)
Moisture content Ash Crude fibre Crude Protein
Content
Katsetse 85.9±0.01e 11.61±0.23
bc 16.33±0.10
ab 33.34±0.17
d
Mnyenze 86.67b 12.84±0.31
a 15±0.36
c 34.43±0.23
c
Sura Mbaya 86.57±0.04c 12.41±0.16a 15.81±0.43bc
35.51±0.23b
Usimpe Mtu
Mdogo 86.85±0.01a 11.6±0.24c 16.23±0.30
ab 31.44±0.12e
Mumias-Tsimg’oli 86.53±0.05c 12.33±0.21
ab 16.55±0.06
ab 36.16±0.09
a
Machakos 66 86.01d 12.13±0.23
abc 16.85±0.32a 31.7±0.13e
Means 86.422 12.152 16.13 33.762
LSD (5%) 0.0854 0.7245 0.909 0.52
*All values are mean ± standard error of the mean (n=3). Means with different letters within a
column are significantly different (P < 0.05).

27
Table 3: Selected proximate content of fresh cowpea leaves expressed in dry matter basis, season
2.
Accession/Variety
Proximate contents (%)
Moisture content Ash Crude fibre Crude Protein
Content
Katsetse 86.67±0.10bc
11.29±0.14b 16.4±0.12
bc 33.31±0.13
d
Mnyenze 86.53±0.02c 12.38±0.14
a 15.32±0.27
d 34.49±0.14
c
Sura Mbaya 86.79±0.04b 12.33±0.35a 15.99±0.10
c 35.53±0.13
b
Usimpe Mtu
Mdogo 86.94a 11.86±0.21
ab 15.95±0.11
c 31.12±0.12
e
Mumias-Tsimg’oli 86.3±0.02d 12.27±0.15
a 16.75±0.14
ab 36.06±0.20
a
Machakos 66 86.1±0.01e 11.25±0.16
b 17.12±0.25
a 31.37±0.11
e
Means 86.553 11.898 16.255 33.646
LSD (5%) 0.1429 0.6302 0.5521 0.4358
*All values are mean ± standard error of the mean (n=3). Means with different letters within a
column are significantly different (P < 0.05).
3.4.2. Beta carotene, ascorbic acid and total phenols
There was significance difference among the accessions in both the seasons but a clear trend was
not observed. In season 1, Machakos 66 recorded the least β-carotene content at 29.71mg/100g
compared to the local accessions whereas Mumias-tsimg'oli, mnyenze and sura mbaya had the
highest β-carotene content at 35.92, 35.31, 36.4 mg/100g. In season 2, Mumias-tsimg'oli had the
least β-carotene content at 30.8 mg/100g whereas mnyenze and sura mbaya had the highest
values at 36.55 and 36.32mg/100g respectively. Ascorbic acid varied considerably in both the
seasons. However katsetse and Machakos 66 were consistently the least in ascorbic acid content
at 191 and 192.8mg/100g for season 1 and 200 and 192.9mg/100g for season 2 respectively. In
season 1, mnyenze recorded the highest ascorbic acid content at 214.7mg/100g while in season 2
it was usimpe mtu mdogo at 213.8mg/100g. In season 1, usimpe mtu mdogo had the least total
phenolic content with 4000 GAE mg/100g whereas Machakos 66 had the highest at 4744 GAE
mg/100g. In season 2, Mumias-tsimg'oli recorded the lowest total phenolic content at 3206 GAE
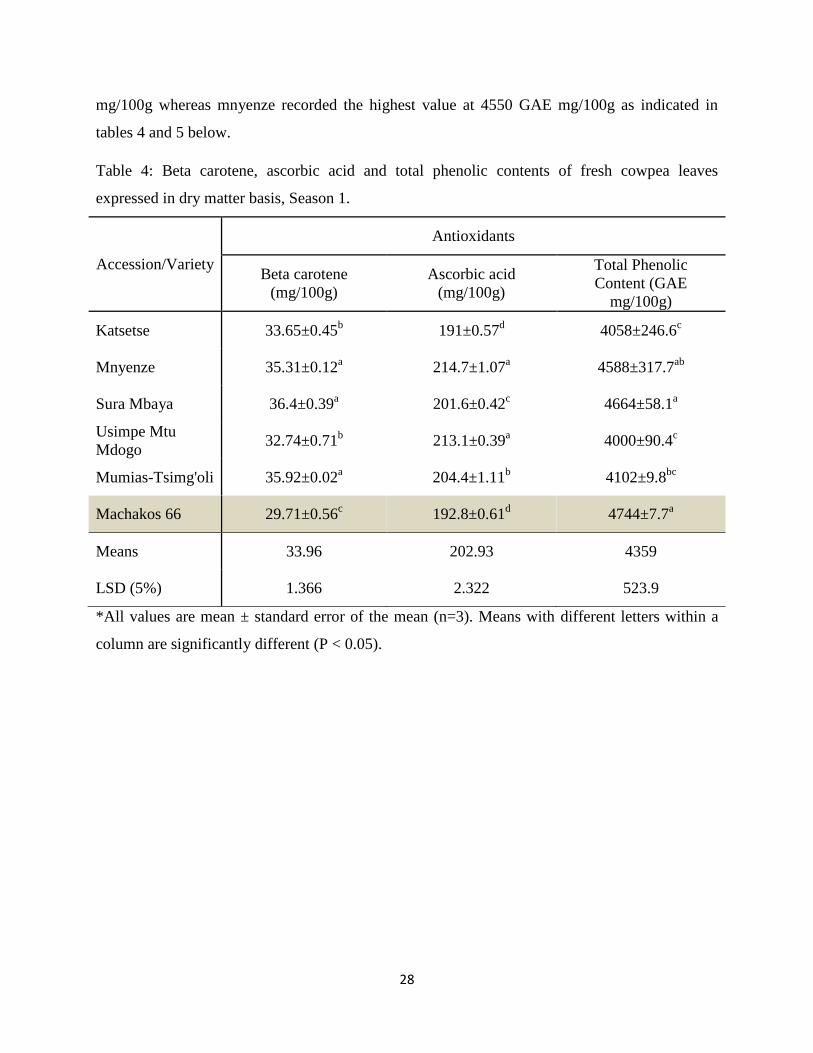
28
mg/100g whereas mnyenze recorded the highest value at 4550 GAE mg/100g as indicated in
tables 4 and 5 below.
Table 4: Beta carotene, ascorbic acid and total phenolic contents of fresh cowpea leaves
expressed in dry matter basis, Season 1.
Accession/Variety
Antioxidants
Beta carotene
(mg/100g)
Ascorbic acid
(mg/100g)
Total Phenolic
Content (GAE
mg/100g)
Katsetse 33.65±0.45b 191±0.57
d 4058±246.6
c
Mnyenze 35.31±0.12a 214.7±1.07
a 4588±317.7
ab
Sura Mbaya 36.4±0.39a 201.6±0.42
c 4664±58.1
a
Usimpe Mtu
Mdogo 32.74±0.71
b 213.1±0.39
a 4000±90.4
c
Mumias-Tsimg'oli 35.92±0.02a 204.4±1.11
b 4102±9.8
bc
Machakos 66 29.71±0.56c 192.8±0.61
d 4744±7.7
a
Means 33.96 202.93 4359
LSD (5%) 1.366 2.322 523.9
*All values are mean ± standard error of the mean (n=3). Means with different letters within a
column are significantly different (P < 0.05).

29
Table 5: Beta carotene, ascorbic acid and total phenolic contents of fresh cowpea leaves
expressed in dry matter basis, Season 2.
Accession/Variety
Parameters
Beta carotene
(mg/100g)
Ascorbic acid
(mg/100g)
Total Phenolic
Content (GAE
mg/100g)
Katsetse 32.76±0.78bc
200±1.11e 3803±23.06
d
Mnyenze 36.55±0.01a 211.7±0.55
b 4550±69.47
b
Sura Mbaya 36.32±0.67a 206.9±0.52
c 4715±6.05
a
Usimpe Mtu
Mdogo 31.45±0.37
cd 213.8±0.60
a 3895±79.98
cd
Mumias-Tsimg'oli 30.8±0.29d 204.4±0.43
d 3206±7.33
e
Machakos 66 33.43±0.26b 192.9±0.53
f 3964±61.73
c
Means 33.55 204.96 4022
LSD (5%) 1.454 2.039 157.4
*All values are mean ± standard error of the mean (n=3). Means with different letters within a
column are significantly different (P < 0.05).
3.4.3. Mineral elements
All the minerals in both seasons changed considerably. All the minerals analyzed were not
significantly different (P<0.05). Mnyenze recorded the highest calcium and iron content at
34764ppm and 1034.3ppm respectively. Usimpe mtu mdogo recorded the lowest calcium content
at 17066ppm. The highest potassium level was recorded in sura mbaya at 34204ppm, calcium at
34764 in mnyenze, iron at 730.2ppm in katsetse, zinc at 169.8ppm in katsetse and manganese at
719.8ppm in sura mbaya for season 1. These accessions also showed the same trend in season 2
but with slightly different values as shown in tables 6 and 7.

30
Table 6: Selected mineral element content of fresh cowpea leaves expressed in dry matter basis,
Season 1.
Accession/Variety
Mineral contents (PPM)
K Ca Fe Zn Mn
Katsetse 24484±2694 27496±593b 730.2±60
ab 169.8±37.98 693.6±27.81
Mnyenze 28322±2600 34764±2273a 1034.3±148.6
a 97.2±11.79 541.1±111.58
Sura mbaya 34204±1497 26048±1392b 598.3±116.5
b 152.3±19.9 719.8±78.57
Usimpe Mtu
Mdogo 26814±2264 17066±1149
c 395.9±65.3
b 131.9±20.85 491.5±93.83
Mumias-Tsimg’oli 24683±1565 24665±3158b 564.6±158.3
b 79.9±11.51 403.7±97.74
Machakos 66 26113±2483 21407±2194bc
499.7±52.2b 130.9±17.79 569.1±80.83
a
Means 27436 25241 637 127 570
LSD (5%) 6889.9 6106.4 335.8 67.29 264.7
*All values are mean ± standard error of the mean (n=3). Means with different letters within a
column are significantly different (P < 0.05).
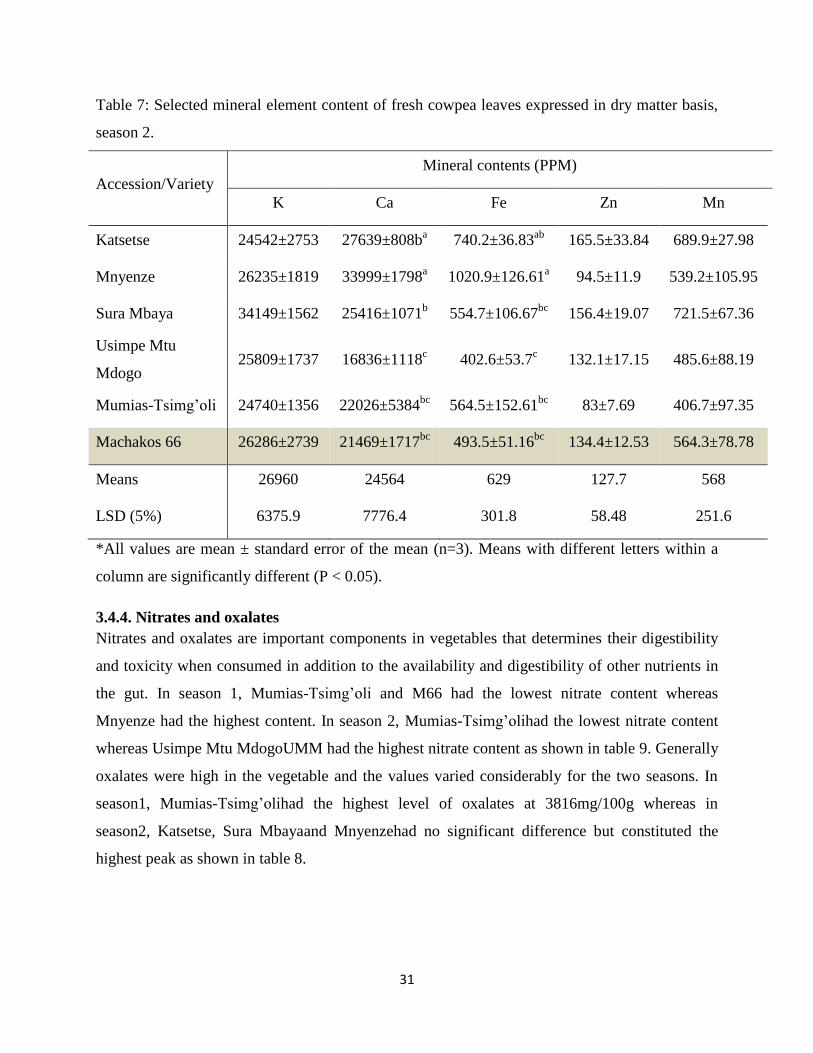
31
Table 7: Selected mineral element content of fresh cowpea leaves expressed in dry matter basis,
season 2.
Accession/Variety
Mineral contents (PPM)
K Ca Fe Zn Mn
Katsetse 24542±2753 27639±808ba 740.2±36.83
ab 165.5±33.84 689.9±27.98
Mnyenze 26235±1819 33999±1798a 1020.9±126.61
a 94.5±11.9 539.2±105.95
Sura Mbaya 34149±1562 25416±1071b 554.7±106.67
bc 156.4±19.07 721.5±67.36
Usimpe Mtu
Mdogo 25809±1737 16836±1118
c 402.6±53.7
c 132.1±17.15 485.6±88.19
Mumias-Tsimg’oli 24740±1356 22026±5384bc
564.5±152.61bc
83±7.69 406.7±97.35
Machakos 66 26286±2739 21469±1717bc
493.5±51.16bc
134.4±12.53 564.3±78.78
Means 26960 24564 629 127.7 568
LSD (5%) 6375.9 7776.4 301.8 58.48 251.6
*All values are mean ± standard error of the mean (n=3). Means with different letters within a
column are significantly different (P < 0.05).
3.4.4. Nitrates and oxalates
Nitrates and oxalates are important components in vegetables that determines their digestibility
and toxicity when consumed in addition to the availability and digestibility of other nutrients in
the gut. In season 1, Mumias-Tsimg’oli and M66 had the lowest nitrate content whereas
Mnyenze had the highest content. In season 2, Mumias-Tsimg’olihad the lowest nitrate content
whereas Usimpe Mtu MdogoUMM had the highest nitrate content as shown in table 9. Generally
oxalates were high in the vegetable and the values varied considerably for the two seasons. In
season1, Mumias-Tsimg’olihad the highest level of oxalates at 3816mg/100g whereas in
season2, Katsetse, Sura Mbayaand Mnyenzehad no significant difference but constituted the
highest peak as shown in table 8.

32
Table 8: Levels of selected anti-nutrients of fresh cowpea leaves expressed in dry matter basis.
Accession/
Variety
Parameters and seasons
Nitrates Oxalates
Seasons 1 2 1 2
Katsetse 77.28±0.67b 78.39±0.17
d 3392±46.84
c 3505±17.4
a
Mnyenze 83.76±0.25a 83.6±0.39
b 3659±62.37
b 3459±34.64
a
Sura Mbaya 82.81±0.19a 81.39±0.54
c 3395±37.97
c 3400±48.86
a
Usimpe Mtu
Mdogo 84.6±0.72
a 88.11±0.05
a 3426±24.39
c 3279±43.17
b
Mumias-Tsimg’oli 73.31±0.18c 72.57±0.23
f 3816±30.99
a 3100±27.2
c
Machakos 66 74.26±1.06c 76.58±0.21
e 3317±50.98
c 3163±52.2
bc
Means 79.34 80.11 3501 3318
LSD (5%) 1.875 0.949 135.9 120.8
*All values are mean ± standard error of the mean (n=3). Means with different letters within a
column are significantly different (P < 0.05).
3.4.5. Sensory evaluation
The sensory parameters evaluated included; appearance, aroma, texture, taste/flavor, mouth-feel
and general acceptability. Generally, all the accessions were moderately accepted in both the
seasons. In season 1, Mnyenze was best rated at an average of 4.71 and Machakos 66 the least
with a rating of 3.52. In season 2 katstse recorded the highest rating of 5.85 and Machakos 66 the
least with a rating of 3.29. M66 generally was rated inferior to the local accessions as shown in
tables 9 and 10.

33
Table 9: Hedonic scores for sensory quality attributes of fresh cowpea leaves, season 1.
Accession/
Variety
Sensory quality attributes (7 point hedonic scale)
Appearance Aroma Texture Tenderness Taste Mouth feel Overall
acceptability
Katsetse 4.95 4.86 4.81 4.52 4.52 4.48 4.52
Mnyenze 4.76 4.81 4.95 5.24 3.14 4.57 4.71
Sura Mbaya 4.19 3.76 3.76 4.43 3.52 3.95 4.24
Usimpe Mtu
Mdogo 4.67 4.76 4.33 3.76 4.14 4.19 4.43
Mumias-
Tsimg’oli 4.33 4.52 4.43 4.52 4.76 4.43 4.52
Machakos 66 3.86 4.05 3.76 3.71 3.14 3.38 3.52
Mean 4.46 4.46 4.34 4.37 3.87 4.17 4.33
LSD (5%) 0.748 0.726 0.78 0.863 0.839 0.832 0.873
*The values in the table represent scores on a 7-point hedonic scale (1 = dislike extremely), 2 =
(dislike very much), 3 = (dislike moderately), 4 = (neither like nor dislike), 5 = (like moderately),
6= (like very much) and 7= (Like extremely).

34
Table 10: Hedonic scores for sensory quality attributes of fresh cowpea leaves, season 2.
Accession/
Variety
Sensory quality attributes (7 point hedonic scale)
Appearance Aroma Texture Tenderness Taste Mouth
feel
Overall
acceptability
Katsetse 5.52 5.52 5.52 5.57 6.1 5.76 5.85
Mnyenze 4.67 4.95 4.43 4.52 5.33 4.86 4.9
Sura Mbaya 4.9 5.05 4.71 4.86 4.76 4.86 5.05
Usimpe Mtu
Mdogo 5.33 5.14 5.62 5.24 5.38 5.05 5.71
Mumias-
Tsimg’oli 4.76 5.1 4.86 4.95 4.76 4.62 4.86
Machakos 66 4.33 3.38 3.33 3.52 3.38 3.38 3.29
Mean 4.92 4.86 4.75 4.78 4.95 4.75 4.94
LSD (5%) 0.836 0.794 0.855 0.884 0.885 0.916 0.824
*The values in the table represent scores on a 7-point hedonic scale (1 = dislike extremely), 2 =
(dislike very much), 3 = (dislike moderately), 4 = (neither like nor dislike), 5 = (like moderately),
6= (like very much) and 7= (Like extremely).
3.5.DISCUSSION
The highest amount of crude proteins, crude fibre and ash was 36.16%, 17.12% and 12.84%
respectively. These results were comparable with results obtained from Muchoki et al., (2007)
which indicated that crude protein, crude fibre and total ash were 31.8%, 18.2% and 12.1%,
respectively. Okonya and Maass (2014); and Kasangi et al., (2010) also recorded results which
were comparable to the present results. However, the results from the present study differed from
the results obtained from Njoroge et al., (2015) and Chikwendu et al., (2014) which indicated
that the protein content was 6.8% and crude fibre at around 4.2%. The difference in the protein
content can be as a result of environmental factors, age of the leaves, availability of assimilates
and the ability of individual varieties to develop a symbiotic relationship with the nitrogen-fixing
bacteria in root nodules (Ono et al., 1996; Angessa, 2006). The accessions contain appreciable
constituents of proteins and crude fibre which makes it ideal for consumption especially in
supplying roughage and affordable proteins. There was no significant difference in the ash
35
content, however crude fibre and crude protein showed significant differences. Crude protein
content of M66 was inferior compared to the local accessions at 31.7% whereas its crude fibre
content was superior at 16.85%.
Vitamins are important components in human diets especially in boosting immunity and
scavenging for radicals (Bender, 2009). All the local cowpea accessions and the improved
variety generally had high amounts of ascorbic acid and beta-carotenes ranging between 191 to
213.8 mg/100g and 29.71 to 36.55 mg/100g respectively. These results were comparable with
results from Muchoki et al., (2007) which recorded ascorbic acid and beta-carotene at
308mg/100g and 33mg/100g, respectively. The results however, differed from the results from
Chikwendu et al., (2014) which recorded ascorbic acid and beta- carotene at 59.24mg/100g and
9.10mg/100g respectively and Njoroge et al., (2015) who found ascorbic acid at 91.0mg/100g
and beta-carotene at 6.5mg/100g. The improved variety was found to be inferior in beta carotene
and ascorbic acid.
Phenolics are phytochemicals which do not have direct nutritional benefits but act as strong
antioxidants (Oboh and Akindahunsi, 2004; Chikwendu et al., 2014; Preet and Punia, 2000;
Islam et al., 2002). Ishiguro et al., (2004) stated that polyphenols have many physiological
functions such as cancer-fighting properties. However, some researchers have categorized them
as anti-nutrients (Muchoki et al., 2010). In this present research, sura mbaya had the highest total
phenolic content at 4715 GAE mg/100g.
Minerals are important as they are used in many metabolic activities (Institute of Medicine,
2001). Generally, there was no significant difference in the content of minerals in the present
study. However, calcium and iron showed some relative differences. Mnyenze had the highest
calcium and iron content. The mineral contents of M66 were comparable to the local accessions
except for calcium and iron.
Anti-nutrients determine the bioavailability and digestibility of some mineral elements in the gut.
The leaves of the cowpeas assessed had unusually high values of oxalate (3100 to 3816ppm)
compared to Muchoki et al., (2010) at 1889mg/100g and Chikwendu et al., (2014) at 4.59%.
According to (Akwaowo et al., 2000) high oxalate levels may constitute human poisons. Oxalic
acid also forms an insoluble salt with the essential nutrient such as calcium, iron and zinc thus
inhibiting their absorption (Hodgkinson, 1997; Bothwell and Chalton, 1982). However, proper

36
cooking significantly reduces total oxalate content (Akwaowo et al., 2000). Leafy vegetables are
the major source of nitrates entering the human system. All the cowpea accessions had a
moderate nitrate content of between 72.57 to 83.76 mg/100g which were lower compared to
Muchoki et al., (2010) at 771mg/100g. M66 had the lowest nitrate content but comparable with
that of Mumias-Tsimg’oli. The oxalate contents of M66 was the lowest but comparable to
usimpe mtu mdogo.
It has been noted that local cowpea accessions are preferred by farmers because of superior taste
and palatability (KARI, 2010). It has also been noted that, farmers sometimes complain that
improved varieties have excessively bitter or less bitter taste than the local accessions or even
incidences of tough leaves which reduces its acceptability (Rowland, 1992). In the present study,
it was found that sensory attributes of M66 were inferior compared to the local accessions.
Katsetse, Mnyenze and Mumias-Tsimg’oli were superior in sensory attributes.
3.6.CONCLUSION
Local cowpea accessions were found to be superior to the improved variety in beta carotene,
ascorbic acid, crude proteins and acceptance by consumers. However, the improved variety was
superior in total phenolic content and crude fibre. The local accessions can be encouraged and
promoted for you by consumers because of their nutritional properties.
Seasonal variation in nutritional status showed no difference because of sufficient rainfall and
almost constant temperatures for the two seasons.

37
CHAPTER FOUR
4.0 EFFICACY OF POST-HARVEST TREATMENTS IN MAINTAINING THE
QUALITY ATTRIBUTES OF COWPEA LEAVES
4.1. ABSTRACT
African indigenous vegetables are an excellent low cost source of nutrients in diets. Their
availability is constrained by seasonal peaks and lows and high post-harvest losses as a result of
perishability. To counter the post-harvest losses, appropriate postharvest technologies to extend
the shelf life while preserving nutrient quality should be tested. The objective of this study was
to evaluate the effect of blanching, solar drying and modified atmosphere packaging on the
quality attributes and shelf life of cowpeas leaves. Local cowpea accessions and an improved
variety were planted in The University of Nairobi, field station during the short rains from
October to December 2014 and long rains from March to May 2015. One accession was chosen
for post-harvest treatments. One batch of cowpea leaves was subjected to post-harvest
dehydrating treatments; solar drying without blanching, blanching in pure water and solar drying,
blanching in salty water and solar drying and fresh leaves as control.The samples that were
blanched involved dipping the vegetables in boiling water for 2 minutes followed by immersion
in cold water at 80C for 2 minutes before solar drying. Another batch was subjected to Modified
Atmosphere Packaging (MAP) treatments; Extend® bag, ordinary polythene bag and unpackaged
control. The samples were then analysed for selected proximate constituents, vitamins, minerals,
anti-nutrients, sensory characteristics, colour change during processing and packaging,
cumulative water loss and wilting in The University of Nairobi and Jomo Kenyatta University of
Agriculture and Technology laboratories. It was found that blanching and solar drying had little
effect on most proximate and mineral elements. However, vitamin and total phenolic contents
were the most affected. Solar drying without blanching recorded the highest vitamin retention
levels at 68.02% for beta carotene and 68.39% for ascorbic acid whereas blanching in pure water
and solar drying and blanching in salty water and solar drying recorded a retention level of
55.58% and 52.78% for beta carotene, respectively and 21.08% and 20.24% for ascorbic acid,
respectively. In addition, solar drying without blanching recorded the highest retention of total
phenolic content at 149.91%. Blanching in pure water and solar drying and blanching in salty
water and solar drying recorded retention levels of 62.58% and 65.79% of total phenolic content,
respectively. On the other hand, solar drying without blanching, blanching in pure water and
solar drying and blanching in salty water and solar drying recorded losses of 5.87%, 10.77% and

38
11.17% of oxalates and 37.22%, 69.98% and 58.7% of nitrates, respectively. The end stages of
the samples which were unpackaged, packaged in ordinary polythene bag and Extend® bag under
room conditions was 1 day, 4 days and 6 days, respectively. By the end stage control, ordinary
polythene bag and Extend® bag had lost 28.84%, 0.93% and 3.27% cumulative weight for season
1 and 23.84%, 0.89% and 2.31% for season 2, respectively. Colour deterioration in hue angles
for control, ordinary polythene bag and Extend®
packaging polythene film reduced to 149.20,
152.80
and 152.120 respectively from 153.23
0 in season 1. Solar drying without blanching was
found to be effective in maintaining the quality attributes of cowpeas. In addition, MAP was
found to be effective in preserving quality of fresh cowpea leaves and improving shelf life.
Therefore MAP and solar drying without blanching are simple and convenient technologies for
preserving cowpea nutrients and improving shelf life.
KEYWORDS: Cowpea accessions; dehydration; MAP; nutritional quality
4.2. INTRODUCTION
African indigenous vegetables have played an immeasurable role in African nutritional
requirements for decades (Smith and Eyzaguirre, 2007). The passage of culture together with
preservation of sources of food from one generation to the next demonstrates the role these
vegetables played in traditional food systems. That notwithstanding, these vegetables have
grown to become strong economic and social pillar in recent years (Mwaura et al., 2013) since
the growth of the venture has benefited mainly women who have become financially uplifted
hence maintaining descent families. The situation has been notable in the rural areas where these
vegetables are produced and consumed in large quantities (Maundu, 1997). The concept has
spilled to the middle and upper class citizens in most parts of the country (Irungu et al., 2007)
because of the scientific evidence suggesting that the vegetables are superior nutritionally. These
vegetables have also been documented to counteracting emerging lifestyle diseases and disorders
(Habwe et al., 2008; Smith and Eyzaguirre, 2007; Abukutsa, 2003; Kimiywe et al., 2007).
Despite these positive aspects, notable anti-nutrient contents have been discussed (Muchoki et
al., 2010; Chikwendu et al 2014; Ajala, 2009).
In Kenya there are hundreds of ALVs grown or found in the wild (Irungu et al., 2007; Otieno et
al., 2009). According to HCD report (2014), cowpea (Vigna unguiculata) is ranked as the 3rd
most important vegetable among the African indigenous vegetables in production and
consumption at 22% preceded by Solanum spp at 27% and Cleome spp at 23%.

39
The potential of cowpea leaves has not been maximized due to agronomic challenges and to a
greater extent, postharvest handling limitations (Affognona et al., 2014). It is estimated that
postharvest losses contribute to about 50% (Masarirambi et al., 2010) total losses in cowpea
value chain. However, figures between 10–40%, and as high as 50–70% are regularly reported
(FAO-World Bank, 2010). The losses are expressed as estimates since cowpea like the other
African indigenous vegetables, has not been comprehensively documented due to its informal
marketing channels and small scale production over a vast area. According to Affognona et al.,
(2014), the real magnitude of postharvest losses is not clearly known because of the inadequacies
of loss assessment methodologies available. The high postharvest losses lead to wasted resources
invested in production. One factor that aggravates the post-harvest loss situation to the high
postharvest losses is the seasonality characterizing production of cowpeas, such that gluts are
achieved during the wet season and scarcity during the dry season (Abukutsa et al., 2006;
Chavasit et al., 2002). To alleviate food and nutrition security in Kenyan population especially
among the rural and the resource constrained population, the estimated postharvest losses should
be reduced to the bare minimum (FAO-World Bank, 2010). However, there are other underlying
economic problems such as poor transport network and distribution systems which contribute to
postharvest losses (Shiundu and Oniang’o, 2007).
Water loss in fresh vegetables is a major cause of deterioration because it results in both
quantitative and qualitative losses. Quantitatively, vegetables lose their saleable weight due to
transpiration losses. This is the major cause of deterioration since cowpeas and other vegetables
have a large surface area to volume ratio (Mampholo et al., 2015). Furthermore, cowpea leaves
contain about 90% water, a situation which deprives the vegetables long shelf life while fresh
(Muchoki et al., 2007). Under room temperatures and relative humidity, these vegetables lose
water drastically and may not last for 24 hours (Abukutsa, 2010). Qualitative losses include loss
in appearance due to shriveling, colour change, loss in textural and nutritional quality. A part
from water loss respiration is also a major cause of deterioration in vegetables because fresh
produce continue to respire after harvesting (Silva, 2010). Respiration induced losses can be
minimized by using appropriate technologies to reduce the respiration rate without harming the
quality of the product such as taste, texture and appearance. As a general rule, the rate of
respiration can be reduced by keeping the temperature low, having lower levels of oxygen in the
packaging atmosphere and increased levels of carbon dioxide. However, note should be taken to
40
avoid anaerobic respiration as a result of too low oxygen which results to unwanted tastes and
odours hence loss of quality (Karaçay and Ayhan, 2009).
To reduce the postharvest losses, other methods such as improving and lengthening shelf life and
optimization of production have been proposed (Chavasit et al., 2002). Some of the methods that
should be employed include value addition, packaging and streamlining supply and marketing
systems. Some of the technologies aim at long term lengthening shelf life through dehydration
while others improve the shelf life of fresh leaves.
Drying as a means of dehydration has been the most common form of postharvest preservation in
traditional systems to supplement indigenous vegetables during the dry seasons (Fellows, 2009).
This was attributed to the ease in carrying out and managing the processes which didn’t require
specialized skills. Dehydration is achieved through several techniques including solar drying,
shade drying, open air drying and oven drying. However, whichever method used, the amount of
minerals and nutrients is reduced (Gupta et al., 2013; Muchoki et al., 2007; Frias et al., 2010).
The extent of reduction is dependent on the specific technique used. For instance, the sun drying
technique has been documented to lead to a greater loss in vitamins than shade drying and solar
drying (Muchoki et al., 2007; Ndawula et al., 2004). Apart from volatilization and vaporization,
blanching has been cited as one of the cause of the high loss in minerals and vitamins in withered
vegetables and fruits due to leaching and effects of heat on chemical degradation (Muchoki et
al., 2007, Tannenbaum, 1976). Optimization of blanching and dehydration methods can lead to
establishment of cost effective practice in postharvest management of cowpea leaves that leads
to quality products.
On the other hand, post-harvest technologies that reduce water loss, respiration, ethylene
production and improve shelf life of fresh produce have been applied to reduce post-harvest
losses (Kader, 1995). These technologies include cold temperature storage, controlled
atmosphere storage (CAS) and modified atmosphere packaging (MAP) among others. Although
limited scientific research has been published on the versatility of modified atmosphere
packaging in vegetables, extensive work has been done on fruits. It has been shown that the
procedure is simple, affordable and effective in preserving fresh quality of fruits (Githiga, 2012;
Kirakou et al., 2014; Yumbya et al., 2014).

41
Recent advances in the design and manufacture of polymeric films with a wide range of gas
permeability characteristics have stimulated the creation of MAP with flexible film packages.
Additionally, incorporation of various absorbers in the polyfilm lining (for O2, CO2, C2H4 and
water vapor) has increased the efficacy of the packages. An example of innovative MAP
products is the Extend® which was introduced product in the Kenyan market by Amiran Kenya.
According to the manufacturers, the film was designed specifically for leafy vegetables. The bag
is expected to extend leafy vegetables shelf life and marketing period, ultimately reducing the
postharvest losses by slowing down water loss and other deteriorative factors. Since the product
is new in the market, no published work has been done its effect on vegetables, more so on
ALVs.
Success of post-harvest technologies ensures near continuous availability of cowpea vegetables
and other African leafy vegetables throughout the year regardless of production seasonality,
improved nutrition status and income (Adebooye and Opadode, 2004). Reduction in the losses
will ultimately benefit consumers as well because of stable product prices and continuous
availability. The objective of the study was to evaluate the efficacy of two blanching techniques
and solar drying and modified atmosphere packaging in maintaining the physical and nutritional
quality of dehydrated and fresh cowpea leaves.
4.3. MATERIALS AND METHODS
One local cowpea accession (sura mbaya), superior in terms of consumer acceptability and yield,
was grown at the University of Nairobi Field Station for two seasons. Short rains being season 1
(October to December 2014) and long rains being season 2 (March to May 2015). The leaves
were harvested seven weeks after planting because at this stage, production for dual purpose of
cowpea is at its optimal point (Inaizumi et al., 1999).
The harvested vegetables were separated into four samples which were subjected to treatments;
Solar drying without blanching,
Blanching in pure water and solar drying,
Blanching in salty water and solar drying and
Control - freshly harvested leaves.

42
The salt content used was 10% of the weight of the vegetable and a ratio of 1:4 (vegetable to
water) w/v basis. The leaves were blanched for 2 minutes in boiling water followed by
immersion in cold water at 80C water for 2 minutes. The leaves were then dehydrated in a solar
drier until they became dry to the feel. The leaves were then sealed in air tight polythene bags
before analysis.
On the other hand, samples of approximately 250g of fresh cowpea leaves were sorted out,
foreign matter and inconsumable leaves removed. The fresh samples were then packaged in the
Extend® bag and commercial ordinary bag and the control left on a perforated tray in the
laboratory under room conditions. The Extend® bag has been custom made for packaging
vegetables and was introduced by Amiran as an alternative to the ordinary packaging polythene
bags. Each treatment was replicated three times. Parameter measurements were recorded on a
daily basis because of the highly perishable nature of the leaves. The experiment was conducted
for two seasons at the university of Nairobi botany laboratory. Season 1 was conducted after the
short rains while season 2 was conducted after the long rains following the cropping seasons of
the planted cowpeas. The mean temperatures and relative humidity were 280C and 52% for
season 1 respectively and 250C and 58% for season 2 respectively.
4.4. PARAMETERS ANALYSED
Moisture content, ash content, mineral elements, crude protein content, crude fibre, beta
carotene, ascorbic acid, total phenolic content, nitrates and oxalates were analysed as described
in chapter three (3.3.4 to 3.3.13). However, the weight of the samples was reduced by 80%
because of the loss of moisture during solar drying.
Other parameters analysed include;
4.4.1. Sensory evaluation
Sensory analyses were performed on the dried and the fresh vegetables. The vegetable samples
were evaluated for general appearance (colour), aroma, texture, tenderness, taste/flavour, mouth
feel and general acceptability using untrained panelists, familiar with the taste of cooked cowpea
leaves. The evaluation was based on a standard seven point hedonic scale (where 1 = dislike
extremely and 7 = like extremely). Twenty eight grams for the dried samples which are
equivalent to 250g of fresh sample were boiled in a stainless steel pot for 32 minutes till the
leaves were tender. The samples were then removed, excess water drained and fried using the

43
following procedure. Forty grams of finely chopped onions were weighed into an aluminum pot
with 25 mL vegetable cooking oil (Rina vegetable cooking oil, Kapa Oil Refineries Ltd, Kenya).
The pot was heated until the onions turned golden brown then 95g of finely chopped tomatoes
were added. Six grams of salt (Kensalt, Salt Manufacturers Kenya Ltd) was also added. When a
paste of the ingredients had formed, the drained sample was added and thoroughly mixed and
allowed to simmer for 10 minutes. The vegetables were served hot to the panelists with an
accompaniment for ugali (a maize meal paste) as it is consumed locally.The samples served had
been coded with 4-digit random number to maintain panellist neutrality. Mineral water was given
to the panellists to rinse their mouths after every sample. The number of panellists involved in
the study was 29 for season1 and 31 for season 2 familiar with cowpea recipes and consumption.
The panellists were chosen among university students aged between 21 and 26 years. Women
consisted of about 70% of the total panellists.
4.4.2. Colour change evaluation
Leaf colour was measured when fresh, after blanching and after drying to determine the effect of
processing on the colour of the product. The color of the leaf surface was measured using a
potable color meter that was calibrated with a white and black standard tile. The L*, a* and b*
coordinates were recorded and, a* and b* values converted to hue angle (H). The dried samples
were dipped in hot water for two minutes before the color is measured to allow rehydration.
Hue angle (H) = arctan (b/a) (for +a and +b values)
= arctan (b/a) + 180 (for -a and +b values)
= arctan (b/a) + 180 (for -a and –b values)

44
Hue angle distribution is as shown below;
Figure 1: Hue angle distribution (in degrees).
Courtesy (www.huevaluechroma.com/012.php)
4.4.3. Cumulative weight loss (percentage)
Weight was measured using a digital weighing balance. The results were calculated and
expressed as follows;
Percentage cumulative weight loss = (𝐼𝑛𝑖𝑡𝑖𝑎𝑙 𝑤𝑒𝑖𝑔ℎ𝑡−𝑓𝑖𝑛𝑎𝑙 𝑤𝑒𝑖𝑔ℎ𝑡)
𝐼𝑛𝑖𝑡𝑖𝑎𝑙 𝑤𝑒𝑖𝑔ℎ𝑡× 100%
4.4.4. Wilting
Wilting was measured using a wilting index on a hedonic scale ranging between 1 and 7.
(1=extremely dry 2=dry 3=moderately dry 4=neither dry nor fresh 5=moderately fresh 6=fresh
and 7=extremely fresh)
4.4.5. Statistical analysis
Data was subjected to Analysis of Variance (ANOVA) and means separated by Fisher's Least
Significant Difference (LSD) at P ≤ 0.05 using GenStat statistical package, 15th
edition.
4.5. RESULTS
4.5.1. Proximate analysis
Moisture content, ash, crude fibre and crude proteins were analysed. There was no significant
difference (p<0.05) in ash content for the four treatments; however, crude fibre and crude protein
content showed some varied levels of significance (p<0.05). Fresh leaves consistently recorded
the highest contents of crude fibre and protein at 15.81% and 35.51% for season 1 and 15.99%
and 35.53% for season 2, respectively closely followed by solar drying without blanching,
blanching in pure water and solar drying and blanching in salty water and solar drying in that

45
order. However, there was no consistency in significance for the samples blanched in pure water
and solar dried and blanched in salty water and solar dried as shown in tables 11 and 12. The
moisture content was used to express the contents in dry matter basis.
Table 11: Levels of selected proximate of fresh and processed cowpea leaves expressed in dry
matter basis, Season 1.
Treatments
Proximate contents (%)
Moisture
Content Ash Crude fibre
Crude Protein
Content
Fresh leaves 86.57±0.03a 12.41±0.16 15.81±0.43
a 35.51±0.23
a
Solar drying without
blanching 12.07±0.10
b 12.01±0.12 15.89±0.18
a 35.02±0.05
b
Blanching in pure
water and solar drying 11.69±0.46
b 11.52±0.26 14.70±0.18
b 31.86±0.12
c
Blanching in salty
water and solar drying 11.92±0.25
b 11.87±0.25 13.69±0.35
c 30.94±0.05
d
Means 30.56 11.95 15.02 33.334
LSD (5%) 0.875 0.674 0.992 0.4327
*All values are mean ± standard error of the mean (n=3). Means with different letters within a
column are significantly different (P < 0.05).

46
Table 12: Levels of selected proximate of fresh and processed cowpea leaves expressed in dry
matter basis, Season 2.
Treatments
Proximate contents (%)
Moisture
Content Ash Crude fibre
Crude Protein
Content
Fresh leaves 86.79±0.04a 12.33±0.35 15.99±0.10
a 35.53±0.13
a
Solar drying without
blanching 10.98±0.12
c 12.00±0.18 16.05±0.14
a 34.93±0.16
b
Blanching in pure
water and solar drying 11.92±0.17
b 11.61±0.27 14.35±0.6
ab 31.75±0.21
a
Blanching in salty
water and solar drying 12.01±0.27
b 11.87±0.12 13.72±0.28
b 30.95±0.10
d
Means 30.423 11.95 15.02 33.288
LSD (5%) 0.5601 0.801 1.135 0.5074
*All values are mean ± standard error of the mean (n=3). Means with different letters within a
column are significantly different (P < 0.05).
4.5.2. Beta carotene, ascorbic acid and total phenols
Two water soluble vitamins (beta carotene and ascorbic acid) present in large quantities in
vegetables were chosen together with total phenolic content, a phytochemical important for its
antioxidant activity. Generally, there was very high significance difference (p<0.05) between the
fresh sample and the dehydrated ones, whether blanched or not. In addition, solar dried without
blanching sample recorded the highest vitamin retention levels at 68.02% for beta carotene and
68.39% for ascorbic acid unlike blanched in pure water and solar dried sample at 55.58% for
beta carotene and 21.08% for ascorbic acid and blanched in salty water and solar dried sample at
52.78% β_carotene and 20.24% ascorbic acid. On the other hand, solar dried without blanching
sample recorded the highest retention total phenolic content at 149.91% which surpassed the
fresh sample by around 49.91%. Blanched in pure water and solar dried sample and blanched in
salty water and solar dried sample recorded retention levels of 62.58% and 65.79% of total
phenolic content respectively as shown in tables 12 and 14.

47
Table 13: Levels of beta carotene, ascorbic acid and total phenolic content of fresh and processed
cowpea leaves expressed in dry matter basis, season 1.
Treatments
Antioxidants
Beta carotene
(mg/100g)
Ascorbic acid
(mg/100g)
Total Phenolic
Content (GAE
mg/100g)
Fresh leaves 36.4±0.39a 201.6±0.42
a 4664±58.07
b
Solar drying without
blanching 24.76±0.03b 137.9±0.31
b 6974±101.32
a
Blanching in pure
water and solar drying 20.23±0.07
c 42.5±1.17
c 2911±105.84
c
Blanching in salty
water and solar drying 19.21±0.04
d 40.8±0.30
c 3061±118.17
c
Means 25.152 105.7 4402
LSD (5%) 0.6476 2.149 321.2
*All values are mean ± standard error of the mean (n=3). Means with different letters within a
column are significantly different (P < 0.05).
Table 14: Levels of beta carotene, ascorbic acid and total phenolic content of fresh and processed
cowpea leaves expressed in dry matter basis, season 2.
Treatments
Antioxidants
Beta carotene
(mg/100g)
Ascorbic acid
(mg/100g)
Total Phenolic
Content (GAE
mg/100g)
Fresh leaves 36.32±0.66a 206.9±0.52
a 4715±6.05
b
Solar drying without
blanching 24.83±0.02b 137.2±0.32
b 6716±130.56
a
Blanching in pure
water and solar drying 20.35±0.22c 41±0.13
c 2724±119.98
c
Blanching in salty
water and solar drying 19.47±0.01
c 40.1±0.24
c 2972±43.91
c
Means 25.24 106.3 4282
LSD (5%) 1.136 1.09 298
*All values are mean ± standard error of the mean (n=3). Means with different letters within a
column are significantly different (P < 0.05).

48
4.5.3. Mineral elements
Although mineral elements were lost during processing, the losses were not significantly
different (p<0.05) among all the treatments as shown in tables 15 and 16. However, high
amounts of the minerals were generally reported in the vegetable. The highest amounts of
minerals were present in the fresh sample at 34204ppm, 26048ppm, 598.3ppm, 152.3ppm and
719.8ppm for potassium, calcium, iron, zinc and manganese respectively for season 1.
Table 15: Levels of selected mineral elements of fresh and processed cowpea leaves expressed in
dry matter basis, season 1.
Treatments
Mineral contents (PPM)
Potassium Calcium Iron Zinc Manganese
Fresh leaves 34204±1497 26048±1392 598.3±116.5 152.3±19.9 719.8±78.57
Solar drying without
blanching 33717±1595 25105±908 584.2±114.7 144.5±21.33 710.7±76.2
Blanching in pure
water and solar drying 32317±1790 24671±853 576.9±115.7 139.6±20.66 702.1±75.84
Blanching in salty
water and solar drying 32039±1698 24345±872 563.2±111.1 137±18.16 697.8±74.68
Means 33069 25042 581 143 708
LSD (5%) 5376.9 3362.2 373.4 65.4 248.9
*All values are mean ± standard error of the mean (n=3). Means with different letters within a
column are significantly different (P < 0.05).

49
Table 16: Levels of selected mineral elements of fresh and processed cowpea leaves expressed in
dry matter basis, season 2.
Treatments Mineral contents (PPM)
Potassium Calcium Iron Zinc Manganese
Fresh leaves 34149±1562 25416±1071 554.7±106.7 156.4±19.07 721.5±67.36
Solar drying without
blanching 33577±1428 25010±1024 549.7±105.5 151.2±18.1 713.8±68.24
Blanching in pure
water and solar drying 32871±1374 24636±1201 542.4±104.4 144.8±17.65 706.6±66.15
Blanching in salty
water and solar drying 32018±1937 24547±1174 537±101.9 142.7±17.57 702.2±65.68
Means 34154 24903 546 148.8 711
LSD (5%) 5186.8 3650.9 341.2 59.06 218.1
*All values are mean ± standard error of the mean (n=3). Means with different letters within a
column are significantly different (P < 0.05).
4.5.4. Nitrates and oxalates
Nitrates and oxalates are important components in vegetables that determine the digestibility and
toxicity of vegetables when consumed. Anti-nutrients also influence the availability and
digestibility of other nutrients in the gut. Oxalates were found to be higher in the vegetable and
among the treatments. For instance fresh sample had an average of 3400mg/100g oxalates in dry
weight basis. Solar drying without blanching, blanching in pure water and solar drying and
blanching in salty water and solar drying recorded average loss oxalates of 5.87%, 10.77% and
11.17%, respectively. The highest amount of nitrate content was found in fresh leaves, season 1
at 82.81 mg/100g dry weight basis. Solar dried without blanching, blanched in pure water and
solar dried, blanched in salty water and solar dried samples recorded the biggest loss of 37.22%,
69.98% and 58.7% respectively between the seasons as shown in table 17.
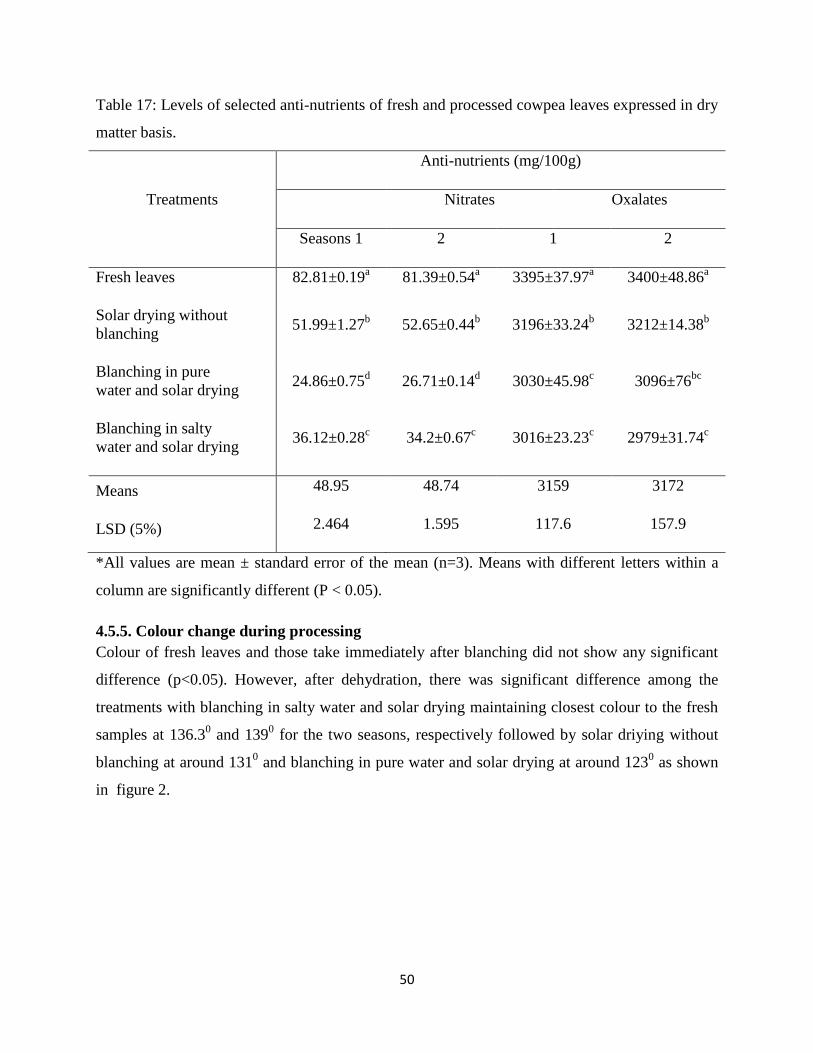
50
Table 17: Levels of selected anti-nutrients of fresh and processed cowpea leaves expressed in dry
matter basis.
Treatments
Anti-nutrients (mg/100g)
Nitrates Oxalates
Seasons 1 2 1 2
Fresh leaves 82.81±0.19a 81.39±0.54
a 3395±37.97
a 3400±48.86
a
Solar drying without
blanching 51.99±1.27
b 52.65±0.44
b 3196±33.24
b 3212±14.38
b
Blanching in pure
water and solar drying 24.86±0.75
d 26.71±0.14
d 3030±45.98
c 3096±76
bc
Blanching in salty
water and solar drying 36.12±0.28
c 34.2±0.67
c 3016±23.23
c 2979±31.74
c
Means 48.95 48.74 3159 3172
LSD (5%) 2.464 1.595 117.6 157.9
*All values are mean ± standard error of the mean (n=3). Means with different letters within a
column are significantly different (P < 0.05).
4.5.5. Colour change during processing
Colour of fresh leaves and those take immediately after blanching did not show any significant
difference (p<0.05). However, after dehydration, there was significant difference among the
treatments with blanching in salty water and solar drying maintaining closest colour to the fresh
samples at 136.30 and 139
0 for the two seasons, respectively followed by solar driying without
blanching at around 1310 and blanching in pure water and solar drying at around 123
0 as shown
in figure 2.

51
Figure 2: changes in colour (hue angle) of fresh, blanched and dehydrated cowpea leaves
expressed in degrees for season 1 an 2.
*All values are mean ± standard error of the mean (n=3). Means with different letters within a
column are significantly different (P < 0.05).
4.5.6. Sensory quality analysis
The sensory parameters evaluated included; general appearance/colour, aroma, texture,
taste/flavor, mouth-feel and general acceptability. During both the seasons, fresh samples were
recorded the highest average rating at 6.4 for season 1 and 6.2 for season 2 followed by solar
dried without blanching at 5 for season 1 and 5.2 for season 2. Blanching in pure water and solar
dryingrecorded a rating of 4.4 for season 1 and 4.6 for season 2 and blanching in salty water and
solar dryingat 3.2 for season 1 and 3.4 for season 2 as shown tables 18 and 19.
0
20
40
60
80
100
120
140
160
180
FRESH AFTERBLANCHING
AFTERDRYING
Hu
e a
ngl
es
(de
gre
es)
Colour change season 1
Solar drying without blanching
Blanching in pure water and solar drying
Blanching in salty water and solar drying
0
20
40
60
80
100
120
140
160
180
FRESH AFTERBLANCHING
AFTERDRYING
Hu
e a
ngl
es
(de
gre
es)
Colour change season 2
Solar drying without blanchingBlanching in pure water and solar dryingBlanching in salty water and solar drying

52
Table 18: Hedonic scores for sensory quality attributes of fresh and processed cowpea leaves,
season 1.
Treatments
Sensory attributes
Appearance Aroma Texture Tenderness Taste Mouth
feel
Overall
acceptability
Fresh leaves 5.6 5.4 5.2 6.4 6.2 6.2 6.4
Solar drying
without
blanching
5 5.4 4.4 5 5 4.6 5
Blanching in pure
water and solar
drying
5.6 5.2 3.8 4 4.2 4 4.4
Blanching in salty
water and solar
drying
4.2 3 3.2 3.4 4 3.2 3.2
Mean 5.1 4.75 4.15 4.7 4.85 4.5 4.75
LSD (5%) 1.87 1.87 2.36 2.28 2.16 2.29 2.1
*The values in the table represent scores on a 7-point hedonic scale (1 = dislike extremely), 2 =
(dislike very much), 3 = (dislike moderately), 4 = (neither like nor dislike), 5 = (like moderately),
6= (like very much) and 7= (Like extremely).

53
Table 19: Hedonic scores for sensory quality attributes of fresh and processed cowpea leaves,
Season 2.
Treatments
Sensory attributes
Appearance Aroma Texture Tenderness Taste Mouth
feel
Overall
acceptability
Fresh leaves 6 5.8 5 6.2 6.4 6 6.2
Solar drying
without
blanching
5.2 5.2 4.8 4.8 5.2 4.6 5.2
Blanching in pure
water and solar
drying
5.4 5.4 3.8 4.2 4 4.2 4.6
Blanching in salty
water and solar
drying
4.4 3.2 3 3.2 4.4 3.4 3.4
Mean 5.25 4.9 4.15 4.6 5 4.55 4.85
LSD (5%) 1.91 1.89 2.21 2.19 2.18 2.23 1.96
*The values in the table represent scores on a 7-point hedonic scale (1 = dislike extremely), 2 =
(dislike very much), 3 = (dislike moderately), 4 = (neither like nor dislike), 5 = (like moderately),
6= (like very much) and 7= (Like extremely).
4.5.7. Cumulative weight loss
All the treatments led to weight loss with time but the extent at which they were losing weight
differed. The control reached the end stage at day 1, ordinary polythene bag at day 4 and
Extend® bag at day 6 after packaging for both seasons. At each end stage, control, ordinary
polythene bag and Extend® bag had led to cumulative weight losses of 28.84%, 0.93% and
3.27% for season 1 and 23.84%, 0.89% and 2.31% for season 2, respectively as shown in figure
3.

54
Figure 3: Percentage Cumulative weight loss of cowpea leaves packaged in Extend® bag and
ordinary polythene bag and control season 1 and 2.
4.5.8. Wilting
All the treatments led to deterioration in the hedonic scale over packaging and/or storage time.
The control reached the end stage at day 1, ordinary polythene bag at day 4 and Extend® bag at
day 6 after packaging for both seasons. Since this was a subjective measurement, the behaviour
of the treatments for the two seasons was the same. At each end stage, leaves in control, ordinary
polythene bag and Extend® bag had deteriorated to 1, 7 and 6 in the hedonic scale as shownin
figure 4.
Figure 4: Wilting indices of cowpea leaves packaged in Extend® bag and ordinary polythene bag
and control season 1 and 2.
0
5
10
15
20
25
30
35
1 2 3 4 5 6
Per
cen
t m
ois
ture
loss
Days after packaging
Percentage moisure loss for season 1
control ordinary bag Extend
0
5
10
15
20
25
30
35
1 2 3 4 5 6
Per
cen
t m
ois
ture
loss
Days after packaging
Percentage moisture loss for season 2
control ordinary bag Extend
0
2
4
6
8
1 2 3 4 5 6
Hed
on
ic s
cale
Days after packaging
Wilting index seaon 1
control ordinary bag Extend
0
2
4
6
8
1 2 3 4 5 6
Hed
on
ic s
cale
Days after packaging
Wilting index season 2
control ordinary bag Extend

55
4.5.9. Colour change of fresh cowpea leaves in MAP
The modified atmosphere packaging treatments showed small change in colour in both seasons.
At end stages, sample in the ordinary polythene bag, Extend® bag and control reduced colour to
152.890, 152.12
0 and 149.2
0, respectively from 153.23
0in season 1. In the season 2, ordinary
polythene bag, Extend®
and control samples had reduced colour to 150.790,150.32
0and
149.820from 151.11
0, respectively as shown in figure 5. The end stages for control, ordinary
polythene bag and Extend® was 1, 4 and 6, respectively.
Figure 5: Colour change of cowpea leaves packaged in Extend® bag and ordinary polythene bag
and control season 1 and 2.
4.6. DISCUSSION
The richness of foodstuff is measured by the quantities of nutrients it has. The higher the nutrient
content the more it’s considered high quality. The results obtained for crude proteins, crude fibre
and total ash in this study were in the same range with results from Muchoki, et al., (2007),
Chikwendu, et al., 2014 and Kasangi, et al., (2010). The significant losses (p<0.05) in crude
proteins for the solar dried and blanched samples can be as a result of leaching of water soluble
protein contents and denaturation of heat sensitive proteins. Njoroge, et al., (2015) suggested that
the slight loss in crude protein was probably due to loss of water soluble nitrogen-containing
compounds in the African indigenous vegetables such as free amino acids, nucleic acids,
nucleotides during blanching. This is evident because the blanched samples had the highest loss
in crude protein content as compared to the non-blanched samples. Crude protein content was
146
147
148
149
150
151
152
153
154
155
1 2 3 4 5 6
Leaf
hu
e an
gle
Days after packaging
Colour change for season 1
control ordinary bag Extend
146
147
148
149
150
151
152
153
154
155
1 2 3 4 5 6
Leaf
hu
e an
gle
Days after packaging
Colour change for season 2
control ordinary bag Extend

56
least for blanching in salty water and solar dryingat 30.95% and highest for the fresh samples at
35.53%. Although total ash slightly varied among the treatments, there was no significant
differences (p<0.05). This could be as a result of minimal loss in mineral elements which
constitute the ash content. On the other hand, crude fibre showed significant differences (p<0.05)
among the treatments with fresh samples having the highest percentage of crude fibre content
and blanched in salty water and solar dried samples the least. The blanched samples recorded
some losses in crude fibre which could be as a result of losses of the water soluble components
of the crude fibre.
Water soluble vitamins are very important in human metabolic functioning. They are important
in improving immunity and supporting physiological processes and scavenging for free radicals
(Gareth et al., 1998 and FAO, 1995). ß-carotene is the principal precursor of vitamin A, which is
involved in vision, cell differentiation, synthesis of glycoproteins, mucus secretion from the
epithelial cells, and overall growth and development of bones (Guerra-Vargas et al., 2001).
Relatively high levels of beta carotene and ascorbic acid were recorded in the vegetable,
however losses as a result of processing were significant (p<0.05) from the fresh leaves. Solar
drying without blanching, blanching in pure water and solar drying, blanching in salty water and
solar dryingretained an average of 68.02%, 55.58% and 52.78% for β_carotene and 68.39%,
21.08% and 20.24% for ascorbic acid, respectively relative to the fresh leaves. Aruna et al.,
(1999) explained the loss of beta carotene to be due to non-oxidative changes involving cis-trans
isomerization, epoxide formation or heat degradation of tissues or oxidative changes on exposure
to light and oxygen. The losses in beta carotene and ascorbic acid compared well with results
from Singh et al., (2003), Oboh and Akindahunsi, (2004) and Gupta et al., (2013). Gupta et al.,
(2008) explained that ascorbic acid is liable to heat, sensitive to light, oxygen and oxidizing
agents. The extent of loss of beta carotene was low compared to that of ascorbic acid because of
the insolubility of beta carotene in water. The loss in ascorbic acid could have resulted from
leaching during blanching, effects of the processing temperatures or due to enzymatic and
chemical degradation. Negi and Roy (2000) came to a conclusion that during blanching, vitamin
losses are as a result of thermal degradation, diffusion and leaching.
African indigenous vegetables have been documented to contain substantial amounts of
phytochemicals (Habwe et al., 2008; Smith and Eyzaguirre, 2007; FAO, 1995; Abukutsa, 2003).

57
Like vitamins, Phenolics have been found to have strong antioxidant activity. Meyer et al.,
(1998) stated that the antioxidant activities of phenolics in different vegetables markedly vary
due to the differences in the phenolic compound structures primarily related to their
hydroxylation and methylation patterns. Total phenolic content in the treatment which was solar
dried without blanching increased by 149.9% for season 1 and 142.2% for season 2. This can be
attributed to concentration of phenolics in the dehydrated vegetable (Zoro et al., 2015). The
increase in the phenolic content of the dehydrated leaves was comparable with results from Oboh
and Akindahunsi, (2004) and Zoro et al., (2015). On the other hand blanched samples recorded a
significant decrease (p<0.05) in phenolic content from the fresh and the solar dried without
blanching samples. Blanched in pure water and solar dried samples recorded a retention capacity
of 37.4% whereas blanched in salty water and solar dried samples recorded a decrease of 34.2%.
The loss can be attributed to diffusion and leaching (Negi and Roy 2000). Amic et al., 2003
indicated that consumption of dried powdered leafy vegetables could be advantageous for lower
cellular ageing process in human body because phenolics are known for their antioxidant and
scavenging properties
Macro and micro nutrients are important constituents of vegetables. Although there was a
decrease in all the mineral contents analyzed from processing, the losses were not significantly
different (p<0.05) from the fresh vegetables. This can be attributed to the fact that mineral
elements are embedded in the cell structures, of which are hard to be removed hence lowered
solubility in water.
Most plant species contain nutritional stress factors also known as anti-nutrients that increase the
loss of essential nutrients from the body. Their presence interferes with the metabolism of
absorbed essential nutrients. The common anti-nutrients in vegetables include nitrates and
nitrites, oxalates, cyanogenic glycosides, glucosinolates, tannins and saponins (Teutonico and
Knorr 1984). In this research, there was significant differences (p<0.05) in nitrate and oxalate
contents among the treatments. Generally, the fresh sample exhibited the highest levels of both
anti-nutrients followed by the solar drying without blanching sample, blanching in salty water
and solar drying and blanching in pure water and solar drying. These results were consistent with
the results from (Muchoki et al., 2010). The oxalate content in the blanched samples did not

58
show any significant differences (p<0.05). The loss in the anti-nutrients can be as a result of
leaching and volatilization since both are water soluble.
Colour is the first physical impression that determines the acceptability of a product to
consumers. Processing is thought to interfere with colour property either positively or negatively
depending on the treatment. In this case, colour change was tracked from the fresh vegetables,
after blanching and after dehydration as explained in the procedure. Chlorophyll is the major
component contributing to the green colour in cowpeas and other green leaves. There was no
significant difference (p<0.05) in colour between the fresh and blanched samples. However,
there were significant differences (p<0.05) between the first two stages (fresh sample and
blanched sample) and the last stage (dehydrated sample). The colour of the vegetables changed
from dark green (151-1550) for the fresh and blanched samples to pale green at 131.5
0, 124.6
0
and 139.20 for fresh leaves, solar drying without blanching, blanching in pure water and solar
drying and blanching in salty water and solar drying, respectively. The slight loss in colour can
be attributed to the loss in chlorophyll content because leaching and chlorophyll forming
pheophytins being broken down (Rodoni et al., 1997).
Processing of any food whether through dehydration or blanching is expected to produce some
changes in the sensory qualities of the product. Bunger et al., (2003) stated that use of salts
during blanching modifies the sensory characteristics improving colour, increasing external
crispness and internal softness. Fresh leaves scored the highest average score of all the sensory
attributes in the hedonic scale followed by solar dried leaves, leaves blanched in pure water and
solar dried and leaves blanched in salty water and solar dried.
Cowpea leaves subjected to modified atmosphere packaging exhibited varied post-harvest
characteristics. The end stage of the cowpea leaves in control, ordinary polythene bag and
Extend® bag were reached at 1, 4 and 6 days. Although the leaves in ordinary polythene bag and
Extend® bag remained fresh past 10 days after packaging, the 4
th and 6
th day respectively was
chosen because of the start of anaerobic respiration which resulted to bad odours. The increased
post-harvest longevity as a result of modified atmosphere packaging was caused primarily by
reduced rate of water loss from the leaf tissue. The polyfilm creates a barrier between the internal
and external the environment therefore developing a modified internal atmosphere with elevated
CO2, reduced O2 and increased relative humidity (Kader et al., 1989; Batu and Thompson,
1996). The elevated relative humidity leads to a significant reduction in water loss and therefore

59
reducing weight loss in addition to slowing wilting and green colour loss. The permeability in
MAP films determines the rate at which water vapour and gases move between the internal and
external environment to achieve equilibrium.
In other research works, high CO2, low O2 and high relative humidity conditions created by
modified atmosphere packaging have been reported to lead to reduction in weight loss,
respiration rate, ethylene production and sensitivity, as well as retard changes related to the
ripening process in fruits (Díaz-Mula et al., 2011, Kirakou et al., 2014; Yumbya et al., 2014).
However limited scientific work has been documented on the effect on vegetables.
4.7. CONCLUSION
Value addition through dehydration led to reduced nutrient contents especially ascorbic acid and
beta carotene. The loss of the other nutrient elements a part from the vitamins was minimal.
However, the results of the study indicate that solar drying without blanching was the better
option for preserving quality and increasing shelf life of cowpea vegetable. This is because, the
loss of ascorbic acid and beta carotene is generally minimal compared to the other techniques
which in addition had high rating by the sensory panelists, high phenolic content which has a
strong anti-oxidative activity and simplicity of the process.
On the other hand modified atmosphere packaging was found effective in increasing the shelf
life of fresh cowpea vegetables. Extend® bag extended shelf life and maintained cowpea leaf
quality for 6 days because of better permeability unlike ordinary polythene bag which lead to
anaerobic respiration by the 4th
day. Weight loss and deterioration in modified atmosphere
packaging is significantly reduced due to the ability of polymeric films to prevent diffusion of
water vapor from the package by creating saturation in the package with water vapor pressure
hence reducing transpiration induced water loss from the tissues.

60
CHAPTER FIVE
5.0. OVERALL CONCLUSION AND RECOMMENDATION
Cowpea leaves are rich sources of proteins, fibre, beta carotene, ascorbic acid, antioxidants and
minerals like potassium, calcium, iron, zinc and manganese. Though they are underutilized,
cowpea leaves nutritive value can nourish the ever increasing human population. In this study, all
the local accessions were found to be superior to the improved variety.It was also found that
value addition through dehydration leads to loss of nutrients. However, the loss of the nutrients is
dependent on the techniques used. It was concluded that solar drying without blanching is the
effective in preserving quality and improving the shelf life of cowpea vegetable. This is because,
the loss of ascorbic acid and beta carotene is generally minimal compared to the other techniques
which in addition had high rating by the sensory panelists. It was also found that losses of other
nutrient elements a part from vitamins was minimal in dehydration. On the other hand, modified
atmosphere packaging was found effective in improving the shelf life of fresh cowpea leaves
because of increased humidity in the package.
More studies should be done on the effects of edaphic factors and fertilizer application on the
nutritional and physical quality of cowpea leaves.
61
7.0. REFERENCES
A.O.A.C. (1990). Official Methods of Analysis, 15th edition, Association of Official Analytical
Chemists, Washington D.C., 739, 1250-1255.
Abayomi Y. A., Ajibada T. V., Sammuel O. F. and Sa’adudeen B. F. (2008). Response of
cowpea (Vigna unguiculata (L.)Walp genotypes to Nitrogen Fertilizer (NPK) application in
Southern Guinea Savanna Zone Nigeria). Asian Journal of Plant Sciences, 7(2): 170-176.
Abimedi T. A., Oyedepo J. A., Oluwadare I. and Agbotoba M. O. (2009). Nutrient content and
anti-nutritional factors in shea butter (Butryospermum parkii) leaves. African Journal of
Biotechnology, 8(21): 5888-5890
Abukutsa M. O. (2003). Unexploited potential of indigenous African vegetables in Western
Kenya. Maseno Journal of Education, Arts and Science 4 (2): 103-122.
Abukutsa M. O. (2007). The diversity of cultivated African leafy vegetables in three
communities in western Kenya. African Journal of Food Agriculture Nutrition and Development,
7(3): 1-15
Abukutsa M. O. (2010). African indigenous vegetables in Kenya: Strategic Repositioning in the
Horticultural Sector. JKUAT Nairobi, Kenya.ISBN 9966-923-31-4.
Abukutsa M. O., Tushabomwe K. C., Mwai W., Onyango G. M. and Macha E. S., (2005).
Diversity of African indigenous vegetables with nutrition and economic potential in the Lake
Victoria region. Internet source date obtained on 2nd
January 2014
Abukutsa M. O., Tushaboomwe K., Onyango J. C. and Macha, S. E. (2006). Improved
community land use for sustainable production and utilization of African indigenous vegetables
in the Lake Victoria region. In: Proceedings of the Fifth Workshop on Sustainable Horticultural
Production in the Tropics, 23rd-26th November 2005, ARC, Egerton University, pp. 167 -179.
Njoro: Egerton University.
Adebooye O. C. and Opadode J. T. (2004). Status of Conservation of the Indigenous Leaf
Vegetables and Fruits of Africa. Ile-Ife, Nigeria: Obafemi Awolowo University.
62
Adéoti K., Dansi A., Ahoton L., Vodouhè R., Ahohuendo B. C., Rival A. and Sanni A. (2012).
Agromorphological characterization of Sesamum radiatum (Schum. and Thonn.), a neglected
and underutilized species of traditional leafy vegetable of great importance in Benin. African
Journal of Agricultural Research, 7(24): 3569-3578.
Affognona H., Mutungia C., Sangingac P. and Borgemeistera C. (2014). Unpacking Postharvest
Losses in Sub-Saharan Africa: A Meta-Analysis. World Development, 66: 49-68.
Ahenkora K., Adu D. H. K. and Agyeman A. (1998). Selected nutritional components and
sensory attributes of cowpea (Vigna unguiculata L.Walp) leaves. Plant Foods for Human
Nutrition, 52: 221-229.
Aja P. M, Okaka A. N. C., Onu P. N., Ibiam U. and Urako A. J. (2010). Phytochemical
composition of Talinum triangulare (Water Leaf) Leaves.Pakistan Journalof Nutrition, 9(6):
527-530.
Ajala L. (2009). The Effect of Boiling on the Nutrients and Anti-Nutrients in Two non-
Conventional Vegetables, Pakistan Journal of Nutrition 8(9): 1430-1433.
Ajetomobi J. and Abiodun A. (2010). Climate change impacts on cowpea productivity in
Nigeria. African journal of food, agriculture, nutrition and development, 10(3): 2258-2271
Akindahunsi A. A. and Salawu S.O. (2005). Phytochemical screening and nutrient-antinutrient
composition of selected tropical green leafy vegetables. African Journal of biotechnology, 4:
497-501
Akwaowo E. U., Ndon B. A. and Etuk E. U. (2000). Minerals and anti-nutrients in fluted
pumpkin (Telfaria occidentalis Hook F.). Food Chem. 70:235-240.
Alegbejo J. O. (2013). Nutritional value and utilization of amaranthus (amaranthus spp.)-a
review. Bayero Journal of Pure and Applied Sciences, 6(1): 136-143
Amic D., Davidovic-Amic D., Beslo D. and Trinajstic N. (2003). Structure-radical scavenging
activity relationship of flavonoids.Croatia Chemistry Acta. 76: 55-61

63
Angessa T. T. (2006). Towards improved vegetable use and conservation of cowpea and lablab:
Agronomic and participatory evaluation in Northern Tanzania and genetic diversity study. PhD
thesis, CuvillierVerlag, Göttingen, Germany.
Ano A. O. and Ubochi C. I. (2008). Nutrient composition of climbing and prostrate vegetable
cowpea accessions. African Journal of Biotechnology, 7(20): 3795-3798
Aruna K., Vimala V., Dhanalakshmi K. and Reddy V. (1999). Physio-chemical changes during
storage of Papaya fruit (Carica papaya L.). Journal of Food Science and Technology, 36: 428-
433.
AVRDC, (2010). Annual Highlights.http://avrdc.org/download/publications/annual-
reports/2010%20annual%20highlights.pdf. Accessed on 02/09/2016.
Awotoye O. O. and Olaniran J. M. (2010). Effects of temporal changes in climate variables on
crop production in tropical sub-humid South-western Nigeria. African Journal of Environmental
Science and Technology, 4(8): 500-505
Batu A. and Thompson K. (1996). Effects of modified atmosphere packaging on postharvest
qualities of pink tomatoes. International Journal of Agriculture and Forestry, 22: 362-375.
Bender D. A. (2009). Nutritional Biochemistry of the Vitamins, 2nd
edition, 2009, Cambridge
University Press, New York, 362-371
Bothwell T. H. and Chalton R. W. (1982). Nutritional Aspects of Iron Deficiency. In:
Biochemistry and Physiology of Iron. (Eds.): P Saltman and J Hegenauer. Elsevier/ Holland
Biomedical Press. New York. 1982: Pp. 749.
Bunger A., Moyano P. and Rioseco V. (2003). Nacl soaking treatment for improving the quality
of French-fried potatoes. Food Res. Int. 36(2):161-166.
Cataldo D. A., Haroom M., Schrader L. E. and Young V. L. (1975). Rapid colorimetric
determination of nitrate in plant tissues by nitration of salicylic acid. Comm. Soil Sci. Plant Anal.
6(1):71-80.
Chandra R. K. (1990). Micronutrients and Immune functions: An overview. Ann. New York
Acad. Sci. 587: 9 16.
64
Chavasit V., Pisaphab R., Sungpuag P., Jittinandana S. and Wasantwisut E. (2002).Changes in β-
carotene and vitamin A contents of vitamin A-rich foods in Thailand during preservation and
storage. Journal of Food Science, 67: 375-379.
Chikwendu J. N., Igbatim A.C. and Obizoba I.C. (2014). Chemical composition of processed
cowpea tender leaves and husks. International Journal of Scientific and Research Publications,
4(5): 1-5.
Chweya, J. A. and Eyzaguirre, P. B. (EDs) (1999). The Biodiversity of Traditional Leafy
Vegetables. International Plant Genetic Resources Institute, Rome Italy.
Coulibaly S., Pasquet R. S., Papa R. and Gepts P. (2002). AFLP Analysis of the Phenetic
Organization and Genetic Diversity of Vigna unguiculata L. Walp. Reveals Extensive Gene
Flow Between Wild and Domesticated Types.Theoretical and AppliedGenetics, 104: 358-66.
Craufurd P. Q., Summerfield R. J., Ellis R. H. and Roberts E. H. (1997). Photoperiod,
temperature and the growth and development of cowpea (Vigna unguiculata). In: Singh BB,
Mohan Raj DR, Dashiell KE, Jackai LEN (eds) Advances in Cowpea Research. Co-publication
of International Institute of Tropical Agriculture (IITA) and Japan International Research Center
for Agricultural Sciences (JIRCAS). Sayce, Devon, UK, 75–86
D’Andrea A. C., Kahlheber S., Logan A. L. and Watson D. J. (2007). Early domesticated
cowpea (Vigna unguiculata) from Central Ghana. Antiquity, 81: 686–698
Díaz-Mula H. M., Martínez-Romero D. S., Castillo S. and Serrano M. (2011). Modified
atmosphere packaging of yellow and purple plum cultivar, effect on organoleptic quality.
Postharvest Biology Technology, 61: 103-109
Dugje I.Y., Omoigui L.O., Ekeleme F., Kamara A.Y. and Ajeigbe H. 2009.Farmers’ Guide to
Cowpea Production in West Africa. International Institute of Tropical Agriculture, Ibadan,
Nigeria.www.iita.org accessed on 13/05/2015
Economic Survey 2014. Kenya National Bureau of Statistics. Nairobi Kenya.
http://www.knbs.or.keaccessed on 13/05/2015

65
Economic Survey Report Highlights. (2014). Ministry of Devolution and Planning Nairobi,
Kenya.
Economic Survey Report Highlights. (2015). Ministry of Devolution and Planning Nairobi,
Kenya.
EPC-(2014).http://epckenya.org/index.php?option=com_content&task=view&id=68&Itemid=79
accessed on 18/05/2015
Escarpa A. and González M.C. (2001). Approach to the content of total extractable phenolic
compounds from different food samples by comparison of chromatographic and
spectrophotometric methods. Analytica Chimica Acta. 427:119-127.
Etsey A. N., Sakyi D. E., Sefa D. S., Afoakwa E. O., Tano K. D. and Annor G.A. (2007).
Effects of cowpea fortification and the level of ripeness of plantain on the nutritive value of
plantain based snack foods. African Journal of Biotechnology, 6(6): 799-802
FAO. (1995). Fruits and vegetables processing FAO Agricultural services Bulletin 119. Food
and Agricultural Organization of the United Nations, Rome, Italy.
FAO. (1997). Agriculture, food and nutrition for Africa. A resource food for teachers of
agriculture. Rome, Italy. pp 229-278.
FAO-World Bank (2010). Reducing post-harvest losses in grain supply chains in Africa. Report
of FAO–World Bank workshop held from 18–19th March, 2010 in Rome, Italy. 120p.
Fasuyi A. O. (2006). Nutritional potentials of some tropical vegetable leaf meals: chemical
characterization and functional properties. African Journal of Biotechnology, 5(1): 049-053.
Fellows P. J. (2009). Food Processing Technology: Principles and Practice. Third edition. CRC
Press, Boca Raton, Boston, New York, Washington, DC and Woodhead Publishing Limited,
Oxford, Cambridge, New Delhi.
Frias J., Peñas E., Ullate M. and Vidal-Valverde C. (2010). Influence of drying by convective air
dryer or power ultrasound on the vitamin C and β-carotene content of carrots. J. Agric. Food
Chem. 58(19):10539-10544.

66
Gareth L., Gisela O. and Rui M. (1998). Productions of a carotenoid-rich product by alginate
entrapment and fluid-bed drying of Dunaliella salina. Journal of Science Food Agric. 76: 298-
302.
George P. M. (2003). Encyclopaedia of foods. Volume 1. Humane Press; Washington. p. 526.
Geren H., Avcioglu R., Soya H. and Kir B. (2008). Intercropping of corn with cowpea and bean:
Biomass yield and silage quality. African Journal of Biotechnology, 7(22): 4100-4104
Getachew A. G., Asfaw Z., Singh V., Woldu Z., Baidu-Forson J. J. and Bhattacharya S. (2013).
Dietary values of wild and semi-wild edible plants in southern Ethiopia. African journal of food,
agriculture, nutrition and development, 13(2): 7485-7503
Githiga R. W. (2012). Effect of 1-Methylcyclopropene and Activebag packaging on the
postharvest characteristics of mango fruit (Mangifera indica L) cultivar Tommy Atkins.Master
of Science Thesis. University of Nairobi, Kenya.
Grubben, G. J. H. and Denton, O. A. (Eds) (2004). Plant Resources of Tropical Africa 2, PROTA
Foundation, Wageningen, Netherlands/ Backhuys Publishers, Leiden, Netherlands/ CTA,
Wageningen, Netherlands. 2004.
Guerra-Vargas M., Jaramillo-Flores M. E., Dorantes-Alvarez L. and Hernandez-Sanchez H.
(2001). Carotenoid retention in canned pickled jalapeno peppers and carrots as affected by
sodium chloride, acetic acid and pasteurization, J. Food Sci. 66:620-625.
Gupta S., Gowri B. S., Lakshmi A. J. and Prakash J. (2013). Retention of nutrients in green leafy
vegetables on dehydration. J. Food Sci. Technol. 50(5): 918-925.
Gupta S., Lakshmi A. J. and Prakash J. (2008). Effect of different blanching treatments on
ascorbic acid retention in green leafy vegetables.Natural product radiance. 7(2):111-116.
Habwe F. O., MSc Walingo K.M. and Abukutsa M. O. (2008). Food Processing and Preparation
Technologies for Sustainable Utilization of African Indigenous Vegetables for Nutrition Security
and Wealth Creation in Kenya. Chapter 13, Using Food Science and Technology to Improve
Nutrition and Promote National Development, Robertson, G.L. & Lupien, J.R.
(Eds),©International Union of Food Science & Technology.

67
Hallensleben M., Polreich S., Heller J. and Maass B. L. (2009). Assessment of the importance
and utilization of cowpea (Vigna unguiculata L. Walp.) as leafy vegetable in small-scale farm
households in Tanzania-East Africa.Conference on International Research on Food Security,
Natural Resource Management and Rural Development. University of Hamburg Tropentag,
October 6-8.
HCD Annual Report (2014). Provisional Horticulture Data.http://agricultureauthority.go.ke/hcd
accessed on 17/01/2016
Hodgkinson A. (1977). Oxalic Acid in Biology and Medicine. Academic Press, London.
Hutchinson M. J., Muniu F. K., Ambuko J., Mwakangalu., Mwang’ombe M. A. W., Okello J. J.
and Olubayo F. (2016). Effect of Cattle Manure and Calcium Ammonium Nitrogen on Growth
and Leaf Yield of Local Cowpea Accessions in Coastal Kenya. International Journal of Plant &
Soil Science 12(3): 1-12, 2016; Article No. IJPSS. 27699. ISSN: 2320-7035.
SCIENCEDOMAIN International. www.sciencedomain.org
Ilelaboye N. O. A., Amoo I. A. and Pikuda O. O. (2013). Effect of cooking methods on mineral
and anti-nutrient composition of some green leafy vegetables. Archives of Applied Science
Research, 5(3):254-260
Imungi J. K. and Potter N. N. (1983). Nutrient Contents of Raw and Cooked Cowpea Leaves.
Journal of food Science, 48(4): 1252-1254.
Inaizumi H., Singh B. B., Sanginga P. C., Manyong V. M. and Adesina A. A. (1999). Adoption
and impact of dry-season dual-purpose cowpea in the semiarid zones of Nigeria. International
Institute of Tropical Agriculture. http://impact.cgiar.org/sites/default/files/pdf/223.pdf. Accessed
12/11/2016.
Institute of medicine, (2001). Dietary reference intake for vitamin A, vitamin K, arsenic, boron,
chromium, copper, iodine, iron, manganese, molybdenum, nickel, silicon, vanadium and zinc.
https://www.iom.edu/Reports/2001/ Accessed 18/06/2015
Irungu C., Mburu J., Maundu P, M Grum and Hoescle Z.I. (2007). Analysis of Markets for
African Leafy Vegetables within Nairobi and its Environs and Implications for On-farm

68
Conservation of Biodiversity. A consultancy report for Global Facilitation Unit for Underutilised
Species, Rome, Italy.
Ishiguro K., Toyama J., Islam S., Yoshimoto M. and Kumagai T. (2004). Suioh, a new sweet
potato cultivar for utilization in vegetable greens. Acta Horticulturae 637:339-345.
Islam M. J., Haque M. Z., Majunder U. K., Haque M. M. and Hossain M. F. (2002). Growth and
yield potential of nine genotypes of sweet potato. Pak. J. Biol. Sci. 5:537-538.
Jae-Yeun S., Gil-Hwan A. and Chul-Jai K. (2003). Color, texture, nutrient contents, and sensory
values of vegetable soybeans [Glycine max (L.) Merrill] as affected by blanching. Food
Chemistry, 81(1): 69-74
Kader A. A. (1995). Regulation of fruit physiology by controlled/ modified
atmospheres.ActaHorticulturae. 398: 59–70.
Kader A. A., Zagory D. and Kerbel E. L. (1989). Modified atmosphere of fruits and vegetables.
Critical reviews in food science and nutrition, 28(1): 1-30
KALRO, (2008). Growing cow peas in dry
areas.http://www.kalro.org/fileadmin/publications/brochuresII/Growing_cow_peas_in_dry_areas
.pdf accessed on 25/12/2015
Karaçay E. and Ayhan Z. (2009). Sensory Evaluation of Minimally Processed Grapefruit
Segments Packaged under Modified Atmosphere. Journal of Agricultural Sciences. 16: 129-138
KARI, (2010).National Report.
Kariuki P. (2014). Our charcoal cooler keeps produce fresh. Daily Nation
newspaper.http://www.nation.co.ke/business/seedsofgold/Our-charcoal-cooler-keeps-produce-
fresh-/-/2301238/2397960/-/119pv5mz/-/index.html. Accessed on 29/07/2016
Kasangi D. M., Shitandi A. A., Shalo P. L. and Mbugua S. K. (2010). Effect of spontaneous
fermentation of cowpea leaves (Vigna unguiculata) on proximate composition, mineral content,
chlorophyll content and beta-carotene content. International Food Research Journal 17: 721-732.
Kawashima L. M. and Soares L. M. V. (2003). A fractionation study of mineral elements in raw
and cooked leaf vegetables consumed in southern Brazil.Alim.Nutr., Araraquara, 14(1): 9-16

69
Kenya Economic Report. (2013). Kenya Institute for Public Policy Research and Analysis.
Nairobi, Kenya. http://www.kippra.org accessed on 02/03/2016
Kimiywe J., Waudo, J. and Mbithe D. (2007). Utilization and medicinal value of indigenous
leafy vegetables consumed in urban and peri-urban Nairobi. African journal of food, agriculture,
nutrition and development, 7(3 & 4): 27-34.
Kirakou P. S. and Ambuko J. (2014). Effect of Modified Atmosphere Packaging (MAP) on
postharvest shelf life of sweet yellow passion fruit (Passiflora ligularis). International
conference on building a new generation of agricultural scientists. December, 1-5th
, 2014, Kenya.
Lambot C. (2002). Industrial potential of cowpea, in C.A. Fatokun, S.A. Tarawali, P.M. Singh,
P.M. Kormawa & M. Tarmo (ed.) Challenges and opportunities for enhancing sustainable
cowpea production: 367-75. Ibadan: International Institute of Tropical Agriculture.
Lukaski C. H. (2004). Vitamin and Mineral Status: Effect on Physical Performance. Nutrition
Research Centre, Grand Forks, North Dakota, USA.20: 632 644. Nutrition 20(7-8):632-644.
Mamiro P. S., Mbwaga A. M., Mamiro D. P., Mwanri A. W. and Kinabo J. L. (2011).
Nutritional quality and utilization of local and improved cowpea varieties in some regions in
Tanzania. African journal of food, agriculture, nutrition and development, 11 (1): 4490-4506
Mampholo B. M., Sivakumara D. and Thompsona K. A. (2015). Maintaining overall quality of
fresh traditional leafy vegetables of Southern Africa during the postharvest chain. Food Reviews
International, pp. 1-17.http://dx.doi.org/10.1080/87559129.2015.1094817
Masarirambi M. T., Mavuso V., Songwe V. D., Nkambule T. P. and Mhazo, N. (2010).
Indigenous post-harvest handling and processing of traditional vegetables in Swaziland: A
review. African Journal of Agricultural Research, 5(24): 3333-3341
Maundu P. M. (1997). The status of traditional vegetable utilization in Kenya. In: Proceedings of
the IPGRI International workshop on Genetic Resources of Traditional Vegetables in Africa.
Conservation and Use. ICRAF-HQ, Nairobi: IPGRI, 1997.

70
Meyer A. S., Donovan J. L., Pearson D. A., Waterhouse A. L. and Frankel E. N. (1998). Fruit
hydroxycinnamic acids inhibit human low-density lipoprotein oxidation in vitro. J Agric Food
Chem. 46:1783-1787.
Mibei E. K., Ojijo N. K. O., Karanja S. M. and Kinyua J. K. (2011). Compositional attributes of
the leaves of some indigenous African leafy vegetables commonly consumed in Kenya. Annals.
Food Science and Technology, 12(2): 146-154.
Michieka D. O. (1977). Kenya Soil Survey. Soil of the valley bottoms of Kabete Vererinary
laboratories. Ministry of Agriculture, National Agricultural Labarotories.
http://library.wur.nl/isric/fulltext/isricu_i00006418_001.pdf. Accessed on 28/07/2016
Minerals Education Coalition (2013). Elements comprising the body.The Role of Minerals and
Elements in Life Processes.
http://www.mineralseducationcoalition.org/pdfs/Minerals_ElementsNutrition.pdf. Accessed on
15/06/15
Muchoki C. N., Imungi J. K. and Lamuka P. O. (2007). Changes in beta-carotene, ascorbic acid
and sensory properties in fermented, solar-dried and stored cowpea leaf vegetables. African
journal of food, agriculture, nutrition and development. 7(3): 1-21.
Muchoki C. N., Lamuka P. O. and Imungi J. K. (2010). Reduction of nitrates, oxalates and
phenols in fermented solar-dried stored cowpea (Vigna unguiculata L.) leaf vegetables. African
Journal of Food, Agriculture, Nutrition and Development, 10(11): 4398-4412.
Murray R. K., Granner D. K., Mayes P. A. and Rodwell V. W. (2000). Harper’s Biochemistry,
25th
Ed. McGraw-Hill, Health Profession Division, USA.
Mwajumwa L., Kahangi E. and Imungi J. K. (1991). The prevalence and nutritional value of
some Kenyan indigenous leafy vegetables from three locations of Machakos district. Ecology of
food and nutrition, 26:275-284.
Mwaura S. N., Muluvi A. S. and Mathenge M. K. (2013). African Leafy Vegetables and
Household Wellbeing in Kenya: A Disaggregation by Gender. Paper presented at the 4th

71
International Conference of the African Association of Agricultural Economists, September 22-
25, 2013, Hammamet, Tunisia.
Nair A. G., Pradeesh S, Devi C. M., Mini I. and Swapna T. S. (2013). Diplaziumesculentum: A
Wild Nutrient- Rich Leafy Vegetable from Western Ghats. Prospects in Bioscience, 1: 293-301.
Ndawula J., Kabasa J. D. and Byaruhanga Y. B. (2004).Alterations in fruit and vegetable β-
carotene and vitamin C content caused by open-sun drying, visqueen-covered and polyethylene-
covered solar-dryers. Afr Health Sci. 4(2): 125-130.
Ndidi U. S., Ndidi C. U., Olagunju A., Muhammad A., Billy F. G. and Okpe O. (2014).
Proximate, Antinutrients and Mineral Composition of Raw and Processed (Boiled and Roasted)
Sphenostylis stenocarpa Seeds from Southern Kaduna, Northwest Nigeria. ISRN Nutrition, 1-9.
http://dx.doi.org/10.1155/2014/280837. Accessed on 2/08/2016
Negi P. S. and Roy S. K. (2000). Effect of blanching and drying methods on β_carotene, ascorbic
acid and chlorophyll retention of leafy vegetables. Lebensm Wiss Technol. 33:295-298.
Ng N. Q. and Marechal R. (1985). Cowpea Taxonomy, origin and germplasm. In Singh S. R and
K. O. Rachie (EDs) Cowpea research, production and utilization. John Wiley and Sons,
Chichester, UK.11-21.
Nielsen S. S., Ohler T. A. and Mitchell C. A. (1997). Cowpea leaves for human consumption:
production, utilization, and nutrient composition. In: Singh BB,Mohan Raj DR, Dashiell KE,
Jackai LEN (EDs), Advances in cowpea research. Ibadan: Copublication of International
Institute of Tropical Agriculture (IITA) and Japan International Research Center for Agriculture
Sciences (JIRCAS), pp 326–332.
Njoroge E. W., Matofari J. W., Mulwa R. M.S. and Anyango J. O. (2015). Effects of blanching
time/temperature combination coupled with solar-drying on the nutritional and microbial quality
of indigenous leafy vegetables in Kenya. African Journal of Food Science and Technology.
6(7):209-219.
Nnamani C. V., Oselebe H. O. and Okporie E. O. (2007). Ethnobotany of Indigenous Leafy
Vegetables of Izzi Clan, in Ebonyi State, Nigeria. In: Proceeding of 20th Annual National
Conference of Biotechnology Society of Nigeria. Abakaliki, November 14th -17th, 111-114.

72
Nnamani C. V., Oselebe H.O. and Agbatutu A. (2009). Assessment of nutritional values of three
underutilized indigenous leafy vegetables of Ebonyi State, Nigeria. African Journal of
Biotechnology, 8 (9): 2321-2324.
Noonan S. C. and Savage G. P. (1999). Oxalate content of foods and its effect on humans. Asia
Pactific J. Clin.Nutr. 67: 64-74.
Nuhu Y. and Mukhtar F. B. (2013). Screening of some cowpea genotypes for photosensitivity.
Bayero Journal of Pure and Applied Sciences, 6(2): 31-34
Nyambakaa H. and Ryleyb J. (2004). Multivariate analysis of the sensory changes in the
dehydrated cowpea leaves. Talanta, 64(1): 23-29
Obadoni B. O., Mensah J. K. and Ikem L. O. (2009). Varietal response of four cowpea cultivars
(Vigna unguiculata L. Walp) to different densities of guineagrass (Panicum maximum). African
Journal of Biotechnology, 8(20): 5275-5279
Oboh G. and Akindahunsi A. A. (2004). Change in the ascorbic acid, total phenol and
antioxidant activity of sun-dried commonly consumed green leafy vegetables in Nigeria. Nutr
Health. 18(1):29-36.
Ohler T. A., Nielsen S. S. and Mitchell C. A. (1996). Varying plant density and harvest time to
optimize cowpea leaf yield and nutrient content. HortScience, 31(2):193-197.
Okonya J. S. and Maass B. L. (2014). Protein and iron composition of cowpea leaves: an
evaluation of six cowpea varieties grown in eastern Africa. African journal of food, agriculture,
nutrition and development, Vol 14(5): 9329-9340.
Ono K., Terashima I. and Watanabe A. (1996). Interaction between nitrogen of plant and
nitrogen content in the old leaves. Plant Cell Physiology, 37(8):1083-1089.
Onyango J. W., Miriti J. M., Nganyi W. E. A. and Wamuogo J. W. (2011). Assessment of
rainfall variability and its implication on agriculture in two locations in kenya.
https://www.researchgate.net/profile/Joab_Wamari2/publication/260115325_Assessment_of_rai
nfall_variability_and_its_implication_on_agriculture_in_two_locations_in_Kenya/links/0046352
f9de874c893000000 accessed on 28/07/2016.

73
Opijah F. J., Mukabana J. R and Ng’ang’a J. K. (2007). Rainfall distribution over Nairobi area. J.
Kenya Meteorol. Soc. 1(1), 3-13.
Otieno D. J., Omiti J., Nyanamba T. and McCullough E. (2009). Market participation by
vegetable farmers in Kenya: A comparison of rural and peri-urban areas. African Journal of
Agricultural Research, 4 (5): 451-460.
Oyeleke O. A., Morton I. D. and Bender A. E. (1985). The use of cowpeas (Vigna unguiculata)
in improving a popular Nigerian weaning food. British Journal of Nutrition, (54): 343-347
Padolosi S. and Ng N. Q. (1997). Origin, taxonomy and morphology of Vigna unguiculata
(L.)Walp. In Singh B.B., D.R. Mohan Raja, K.E. Dashiell and L.E.N Jackai (eds) 1997.
Advances in Cowpea research. Co-publication of International Institute of Tropical Agriculture
(IITA) and Japan International Research Centre for Agricultural Sciences (JIRCAS).IITA.
Ibadan, Nigeria
Pant K. C, Chandal K. P.S. and Joshi B. S. (1982). Analysis of diversity in Indian cowpea
genetic resources. Sabrao Journal, 14: 102-111.
Preet K. and Punia D. (2000). Proximate composition, phytic acid, polyphenols and digestibility
(in vitro) of four brown cowpea varieties. Int. J. Food Sci. Nutr. 51(3):189-1893.
Rachel C. (2015). The rise of Africa’s super vegetables; Long overlooked in parts of Africa,
indigenous greens are now capturing attention for their nutritional and environmental benefits.
Nature, 522(7555): 146-148.
Rodoni S., Mühlecker W., Anderl M., Kräutler B., Moser D., Thomas H., Matile P. and
Hörtensteiner S. (1997). Chlorophyll breakdown in senescent chloroplasts: cleavage of
pheophorbide a in two enzymetic steps. Plant Physiol. 115: 669-676.
Rodriguez-Amaya and Kimura (2004). D.B. Rodriguez-Amaya, M. Kimura HarvestPlus
handbook for carotenoids analysis (first Ed.) IFPRI and CIAT, Washington, DC and Cali (2004)
(Chapter 2) pp. 58.
Rowland J. R. J. (1992). Grain legumes. In: Rowland JRJ (ed), Dryland farming in Africa.
Basingstoke, London: Macmillan, pp 260–284.

74
Saidi M., Itulya F. M., Aguyoh J. and Ngouajio M. (2010). Leaf Harvesting Time and Frequency
Affect Vegetative and Grain Yield of Cowpea. Agronomy Journal 102(3) 827-833.
Shippers R. R. (2000). African Indigenous Vegetables: An overview of the cultivated species.
University of Greenwich, Natural Resources Institute, London, UK 222 pp. ISBN 0 85954 515 6.
https://www.gov.uk/dfid-research-outputs/african-indigenous-vegetables-an-overview-of-the-
cultivated-species. Accessed 10/10/2016.
Senga K. P., Opota O. D., Tamba V. A., Tona L. G., Kambu K. O., Covaci A, Apers S. P. L. and
Cimanga K. (2013). Chemical composition and nutritive value study of the seed oil of
Adenanthera pavonina L. (Fabaceae) growing in Democratic Republic of Congo. International
journalof Pharmtech Research, 5(1): 205-216.
Shahardeen R. N. M and Sera T. H. (2013). Impact of animal manure EM-bokashi on seed yield
of and quality of vegetable cowpea (Vignaunguiculata L.). Bngladesh Journal of Scientific and
Industrial Research, 48(1): 33-38
Shiundu K. M. and Oniang’o R. (2007). Marketing African leafy vegetables, challenges and
opportunities in the Kenyan context. African Journal of Food Agriculture Nutrition and
Development, 17: 4-12.
Siegenberg D., Baynes R. D., Bothwell T. H., Macfarlane B. J., Lamparelli R. D., Car N. G.,
MacPhail P., Schmidt U., Tal A. and Mayet F. (1991). Ascorbic acid prevents the dose-
dependent inhibitory effects of polyphenols and phytates on nonheme-iron absorption. The
American Journal of Clinical Nutrition, 53: 537-41.
Silva E. (2010). Respiration and Ethylene and their Relationship to Postharvest
Handling.http://articles.extension.org/pages/18354/respiration-and-ethylene-and-their-
relationship-to-postharvest-handling accessed on 23/12/2015
Singh G., Kawatra A., Sehgal S. and Pragati. (2003). Effect of storage on nutritional composition
of selected dehydrated green leafy vegetable, herb and carrot powders. Plant Foods for Human
Nutrition. 58(3):1-9.

75
Smith F. I. and Eyzaguirre P. (2007). African leafy vegetables: their role in the World Health
Organization's global fruit and vegetables initiative. African Journal of Food Agriculture
Nutrition and Development. 7(3): 631-632.
Sombroek W. G., Graun H. M. and Van der Pouw. (1982). Exploratory soil survey. Report No.
E1. Ministry of Agriculture, Nairobi, Kenya.
Stone H., Bleibaum R. N. and Thomas H. A. (2012). Sensory evaluation practises fourth edition.
Elsevier Inc. London UK. ISBN: 9780123820877
Taiga A., Suleiman M. N., Aina D. O., Sule W. F. and Alege C. O. (2008). Proximate analysis of
some dry season vegetables in Anyigba, Kogi State, Nigeria.Afri. J. Biotechnol. 7(10): 1588-
1590.
Tannenbaum S. R. (1976). Vitamins and Minerals. In: Principles of Food Science, Part I-Food
Chemistry. Comm.54, dept. agric. Res.
Teutonico R. and Knorr D. (1984). Plant Tissue Culture: Food Applications and the Potential
Reduction of Nutritional Stress Factors. Food Technology Journal, 38(2): 120-126.
Thompson L. U. (1993). Potential health benefits and problems associated with anti-nutrients in
foods. Food Res Int. 26: 131-149.
Timko M. P., Ehlers J. D. and Roberts P. A. (2007). Genome Mapping and Molecular Breeding
in Plants, Volume 3 Pulses, Sugar and Tuber Crops C. Kole (Ed.) Chapter 3 Cowpea. ©
Springer-Verlag Berlin Heidelberg 2007.
Tshovhote N. J., Nesamvuni A. E., Raphulu T. and Gous R. M. (2003). The chemical
composition, energy and amino acid digestibility of cowpeas used in poultry nutrition. South
African Journal of Animal Science, 33(1): 65-69.
Tumwet T. N., Kang’ethe E. K., Kogi-Makau W. and Mwangi A. M. (2014). Diversity and
immune boosting claims of some African indigenous leafy vegetables in western Kenya. African
journal of food, agriculture, nutrition and development, 14(1): 8529-8544.
UNICEF. (2009). State of the World’s Children.
http://www.unicef.org/sowc09/report/report.php. Accessed on 29/07/2016
76
Uusiku N. P., André O. Kwaku G. D., Megan J. B. and Mieke F. (2010). Nutritional value of
leafy vegetables of sub-Saharan Africa and their potential contribution to human health: J. Food
Composition Analy. 23: 499-509.
Van-Soest P. J. and McQueen R. W. (1973). The Chemistry of estimation of fibre. Proc. Nutr.
SOC. 32(2): 12-14.
Vikram V. B., Ramesh M. N. and Prapulla S. G. (2005). Thermal degradation kinetics of
nutrients in orange juice heated by electromagnetic and conventional methods. Journal of food
engineering, 69:31-40.
Wafula E. N., Franz C. M. A. P., Rohn S., Huch M., Mathara J. M., Trierweiler B. and Becker B.
(2015). Fermentation of African Leafy Vegetables to Lower Post-Harvest Losses, Maintain
Quality and Increase Product Safety. Management of land use systems for enhanced food
security: conflicts, controversies and resolutions. Tropentag, September 16-18, 2015, Berlin,
Germany. http://www.tropentag.de/2015/abstracts/links/Huch_CXjcV85f.pdf. Accesses
12/12/2016
Wien H. C. and Summerfield R. J. (1980). Adaptation of cowpeas in West Africa: Effects of
photoperiod and temperature responses in cultivars of diverse origin. In R.J. Summerfield and
A.H. Bunting (EDs) Advances in Legume science. HMSO, London 405-417.
Yekeen T. A., Akintaro O. I., Akinboro A. and Azeez M. A. (2013). Evaluation of cytogenotoxic
and nutrient composition of three commonly consumed vegetables in south- western Nigeria.
African journal of food, agriculture, nutrition and development, 13(2): 7452-7466.
Yu L., Peng X. X., Yang C., Liu Y. H. and Fan Y. P. (2002). Determination of oxalic acid in
plant tissue and root exudates by reversed phase high performance liquid chromatography.
Chinese Journal of Analytical Chemistry, 30: 1119-1122.
Yumbya P., Ambuko P. J., Shibairo S. and Owino.W.O. (2014). Effect of Modified Atmosphere
Packaging on the Shelf Life and Postharvest Quality of Purple Passion Fruit (Passiflora edulis
Sims). Journal of Postharvest Technology, 2(1): 025-036

77
Zoro A. F., Zoué L. T., Adom N. J. and Niamké S. L. (2015). Effect of sun drying on nutritive
and antioxidant properties of leafy vegetables consumed in western Côte D’Ivoire.African
Journal of Science and Research, (4)5: 24-31.

78
8.0. APPENDICES
Appendix 1: Sensory evaluation form
NAME…………………………………….…………………GENDER (M/F)……………………
You are provided with coded samples of cowpea accessions. Please rate the samples (1-6)
according to the scale provided below by filling in the table against each sample attribute.
1. Dislike extremely (worst)
2. Dislike very much
3. Dislike moderately
4. Neither like nor dislike
5. Like moderately
6. Like very much
7. Like extremely
ACCESSION COMPARISON
Sample
ID
General
appearance
Aroma Texture Tenderness Taste/flavour Mouth
feel
General
acceptability
XA0.260
XA0.990
XA0.773
XA0.791
XA0.198
XA0.570
Additional comments

79
………………………………………………………………………………………………………
………………………………………………………………………………………………………
………………………………………………………………………………………………………
………………………………………………………………………………………………………
…………
Appendix 2: Analysis of Variance (ANOVA) table for the effect of processing cowpea
leaves on crude protein content, season 1.
Source of variation d.f. s.s. m.s. v.r. F pr.
Treatment 3 46.35743 15.45248 292.61 <.001
Residual 8 0.42247 0.05281
Total 11 46.77989
Appendix 3: Analysis of Variance (ANOVA) table for the effect of processing cowpea
leaves on crude protein content, season 2.
Source of variation d.f. s.s. m.s. v.r. F pr.
Treatment 3 46.61643 15.53881 213.96 <.001
Residual 8 0.58100 0.07262
Total 11 47.19743
Appendix 4: Analysis of Variance (ANOVA) table for the effect of processing cowpea
leaves on beta carotene content, season 1.
Source of variation d.f. s.s. m.s. v.r. F pr.
Sample_ID 3 558.6216 186.2072 1574.03 <.001
Residual 8 0.9464 0.1183
Total 11 559.5680
Appendix 5: Analysis of Variance (ANOVA) table for the effect of processing cowpea
leaves on beta carotene content, season 2.

80
Source of variation d.f. s.s. m.s. v.r. F pr.
Sample_ID 3 540.8534 180.2845 495.22 <.001
Residual 8 2.9124 0.3641
Total 11 543.7658
Appendix 6: Analysis of Variance (ANOVA) table for the effect of processing cowpea
leaves on ascorbic acid content, season 1.
Source of variation d.f. s.s. m.s. v.r. F pr.
Sample_ID 3 55322.134 18440.711 14158.21 <.001
Residual 8 10.420 1.302
Total 11 55332.554
Appendix 7: Analysis of Variance (ANOVA) table for the effect of processing cowpea
leaves on ascorbic acid content, season 2.
Source of variation d.f. s.s. m.s. v.r. F pr.
Sample_ID 3 59135.4795 19711.8265 58812.01 <.001
Residual 8 2.6813 0.3352
Total 11 59138.1609
Appendix 8: Analysis of Variance (ANOVA) table for the effect of processing cowpea
leaves on total phenolic content, season 1.
Source of variation d.f. s.s. m.s. v.r. F pr.
Sample_ID 3 32111026. 10703675. 367.77 <.001
Residual 8 232832. 29104.
Total 11 32343858.
Appendix 9: Analysis of Variance (ANOVA) table for the effect of processing cowpea
leaves on total phenolic content, season 2.

81
Source of variation d.f. s.s. m.s. v.r. F pr.
Sample_ID 3 30765080. 10255027. 409.31 <.001
Residual 8 200433. 25054.
Total 11 30965514.
Appendix 10: Analysis of Variance (ANOVA) table for the effect of processing cowpea
leaves on oxalates, season 1.
Source of variation d.f. s.s. m.s. v.r. F pr.
Sample_ID 3 283230. 94410. 24.20 <.001
Residual 8 31205. 3901.
Total 11 314435.
Appendix 11: Analysis of Variance (ANOVA) table for the effect of processing cowpea
leaves on oxalates, season 2.
Source of variation d.f. s.s. m.s. v.r. F pr.
Sample_ID 3 289742. 96581. 13.73 0.002
Residual 8 56266. 7033.
Total 11 346008.
Appendix 12: Analysis of Variance (ANOVA) table for the effect of processing cowpea
leaves on calcium, season 1.
Source of variation d.f. s.s. m.s. v.r. F pr.
Sample_ID 3 4919955. 1639985. 0.51 0.684
Residual 8 25509647. 3188706.
Total 11 30429602.
Appendix 13: Analysis of Variance (ANOVA) table for the effect of processing cowpea
leaves on calcium, season 2.

82
Source of variation d.f. s.s. m.s. v.r. F pr.
Sample_ID 3 1417311. 472437. 0.13 0.942
Residual 8 30078389. 3759799.
Total 11 31495701.
Appendix 14: Analysis of Variance (ANOVA) table for the effect of processing cowpea
leaves on iron, season 1.
Source of variation d.f. s.s. m.s. v.r. F pr.
Sample_ID 3 1932. 644. 0.02 0.997
Residual 8 314592. 39324.
Total 11 316524.
Appendix 15: Analysis of Variance (ANOVA) table for the effect of processing cowpea
leaves on iron, season 2.
Source of variation d.f. s.s. m.s. v.r. F pr.
Sample_ID 3 551. 184. 0.01 0.999
Residual 8 262720. 32840.
Total 11 263271.
Appendix 16: Analysis of Variance (ANOVA) table for crude fibre on cowpea accessions,
season 1.
Source of variation d.f. s.s. m.s. v.r. F pr.
Sample 5 6.3748 1.2750 4.89 0.011
Residual 12 3.1307 0.2609
Total 17 9.5055
Appendix 17: Analysis of Variance (ANOVA) table for crude fibre on cowpea accessions,
season 2.

83
Source of variation d.f. s.s. m.s. v.r. F pr.
Sample 5 6.14938 1.22988 12.77 <.001
Residual 12 1.15567 0.09631
Total 17 7.30505
Appendix 18: Analysis of Variance (ANOVA) table for ascorbic acid content on cowpea
accessions, season 1.
Source of variation d.f. s.s. m.s. v.r. F pr.
Sample 5 1467.831 293.566 172.38 <.001
Residual 12 20.436 1.703
Total 17 1488.267
Appendix 19: Analysis of Variance (ANOVA) table for ascorbic acid content on cowpea
accessions, season 2.
Source of variation d.f. s.s. m.s. v.r. F pr.
Sample 5 891.695 178.339 135.74 <.001
Residual 12 15.766 1.314
Total 17 907.461
Appendix 20: Analysis of Variance (ANOVA) table for nitrate content on cowpea
accessions, season 1.
Source of variation d.f. s.s. m.s. v.r. F pr.
Sample 5 376.986 75.397 67.91 <.001
Residual 12 13.324 1.110
Total 17 390.310
Appendix 21: Analysis of Variance (ANOVA) table for nitrate content on cowpea
accessions, season 2.

84
Source of variation d.f. s.s. m.s. v.r. F pr.
Sample 5 450.3920 90.0784 316.86 <.001
Residual 12 3.4114 0.2843
Total 17 453.8034
Appendix 22: Analysis of Variance (ANOVA) table for manganese content on cowpea
accessions, season 1.
Source of variation d.f. s.s. m.s. v.r. F pr.
Sample 5 217046. 43409. 1.96 0.157
Residual 12 265730. 22144.
Total 17 482777.
Appendix 23: Analysis of Variance (ANOVA) table for manganese content on cowpea
accessions, season 2.
Source of variation d.f. s.s. m.s. v.r. F pr.
Sample 5 216244. 43249. 2.16 0.127
Residual 12 240039. 20003.
Total 17 456283.