Embed Size (px)
Citation preview
ECONOMIC COST EVALUATION OF SELECTED VEGETABLE POST-HARVEST
LOSSES IN BABATI DISTRICT TANZANIA
MARIA ALOYCE MTUI
A thesis Submitted to the Graduate School in Partial Fulfilment of the Requirements
for the Award of a Masters of Science Degree in Agricultural Economics of Egerton
University
EGERTON UNIVERSITY
NOVEMBER, 2017

ii
DECLARATION AND RECOMMENDATION
Declaration
I declare that this thesis is my original work and has not been submitted for an award of any
degree in any other University.
Signature: __________________ Date: ______________
Maria Aloyce Mtui
KM15/13521/14
Recommendation
This thesis has been prepared under our supervision and submitted with our approval as
University Supervisors.
Signature: __________________ Date: ______________
Prof. Patience M. Mshenga, PhD
Department of Agricultural Economics and Agribusiness Management, Egerton University
Signature: __________________ Date: ______________
Dr. Victor Afari-Sefa, PhD
Agricultural Economics and Global Theme Leader – Consumption World Vegetable Center,
Benin, Mali

iii
COPYRIGHT
©2017 Maria Aloyce Mtui
Whole or no part of this thesis may be reproduced, transmitted or stored in any form or means
such as electronic, mechanical or photocopying including recording or any information
storage and retrieval system, or translated in any language, without prior written permission
of the author or Egerton University on that behalf.
All Rights Reserved

iv
DEDICATION
I dedicate this research work to my blessed and ever supportive family, my husband Makolo
Christopher Ludosha, son Ignatius Makolo Ludosha, daughter Janeth Makolo Ludosha and
other family members.

v
ACKNOWLEDGEMENT
I give special thanks and glory to God for His favour, grace and guidance throughout my
academic journey and life in general. Indeed, God has been good to me and His love endures
forever.
I highly appreciate Egerton University through the department of Agricultural Economics and
Agribusiness Management (AGEC/AGBM) for offering me an opportunity to undertake
Masters of Science Degree in Agricultural Economics and for providing a conducive learning
environment to me and my colleagues.
Special thanks goes to USAID through iAGRI-Tanzania and, the Regional Universities
Forum for Capacity Building in Agriculture (RUFORUM) for fully funding of my Masters
studies. Also, I would like to thank Africa-RISING Eastern and Southern Africa project for
funding my research.
Special thanks goes to USAID through iAGRI-Tanzania and, the Regional Universities
Forum for Capacity Building in Agriculture (RUFORUM) for fully funding of my Masters
studies. Also, I would like to thank Africa-RISING Eastern and Southern Africa project for
funding my research.
I am forever grateful to my research supervisors, Prof. Patience Mshenga and Dr. Victor
Afari-Sefa. They have offered me quality guidance, as professionals and mentors, straight
from when the research idea was conceptualized to its completion. I have the confidence to
approach them now and in future; as I know that they will be available and willing to support
me. I am also gratefully for the support I got from Dr. Justus Ochieng from World Vegetable
Centre (WorldVeg) in Arusha Tanzania.
My profound gratitude also goes to Mrs. Inviolate Dominick, a Research Assistant at the
World Vegetable Centre and the staff of Babati District Agriculture, Irrigation and Livestock
Cooperatives Office (DAICO). My sincere appreciation also goes to farmers, wholesalers,
retailers and enumerators for their willingness to participate and support which contributed
immensely in getting quality data and research findings.
Lastly and not the least, special thanks go to my lovely family, friends and colleagues, for
sharing with me useful ideas during my period of study and research work.

vi
ABSTRACT
Vegetables remain an important source of nutrients in many parts of the world as they contain
essential micronutrients, vitamins, antioxidants, and other health-related phytochemicals.
They complement staple-based diets. Economically, vegetable production and marketing has
a potential of high profit, employment, income generation and increasing commercialisation
of the rural areas. However, vegetables are highly perishable and as such most actors in the
vegetable value chain incur high post-harvest losses. In Tanzania, research on vegetable post-
harvest losses is limited, yet post-harvest loss reduction may substantially contribute to
higher returns leading to improving quality of lives of farmers and other actors in the supply
chain. The study quantified the economic post-harvest losses of African egg-plant, amaranth
and tomatoes along the supply chain, determined the principal causal factors contributing to
selected vegetable postharvest losses and the factors influencingthe choice of post-harvest
handling practices and techniques. A multi-stage sampling design was adopted for the
ultimate selection of 200 vegetable farmers, 50 retailers and 50 wholesalers in Babati district.
Descriptive statistics was used to determine the economic post-harvest losses of African
eggplant, Amaranth and Tomato. The log-linear regression model was used to determine the
principal causal factors contributing to vegetables post-harvest losses and multivariate probit
model was used to determine factors that influence farmers’ choice of post-harvest handling
techniques and practices. Results showed that farm level vegetable post-harvest losses were
higher compared to retail and wholesale market levels. This study found that economic
postharvest losses incurred per individual per season for Egg-plant were TZS 408,800, TZS
111,650 and TZS 255,000; Amaranth TZS 181,500, TZS 23,650 and TZS 16,800 and
Tomatoes TZS 918,500, TZS 237,000 and TZS 182,100 for farmers, retailers and wholesalers
respectively. Field pests and diseases, delays in harvesting or selling and poor storage
conditions were the principal causal factors contributing to vegetable postharvest losses along
the supply chain. Lastly quantity harvested, education level and access to extension services
had significant (p<0.1) positive influence on choice of post-harvest handling techniques while
household income and farm-size had significant (p<0.1) negative influence. As a result, there
is a need for equipped storage facilities, training on vegetable postharvest handling and
marketing, and promotion of simple and cost-effective postharvest technologies among the
supply chain actors.

vii
TABLE OF CONTENTS
DECLARATION AND RECOMMENDATION ..................................................................ii
COPYRIGHT ..........................................................................................................................iii
DEDICATION.........................................................................................................................iv
ACKNOWLEDGEMENT.......................................................................................................v
ABSTRACT .............................................................................................................................vi
LIST OF TABLES ...................................................................................................................x
LIST OF FIGURES ................................................................................................................xi
LIST OF ABBREVIATIONS AND ACRONYMS .............................................................xii
CHAPTER ONE ......................................................................................................................1
INTRODUCTION....................................................................................................................1
1.1 Background information .................................................................................................. 1
1.2 Statement of the problem ................................................................................................. 4
1.3 Objective of the study ...................................................................................................... 4
1.3.1 General objective ....................................................................................................... 4
1.3.2 Specific objectives ..................................................................................................... 4
1.4 Research questions ........................................................................................................... 5
1.5 Justification and significance of the study ....................................................................... 5
1.6 Scope and limitation of the study ..................................................................................... 5
CHAPTER TWO .....................................................................................................................8
LITERATURE REVIEW .......................................................................................................8
2.1 Introduction ...................................................................................................................... 8
2.2 Importance of vegetables and vegetable farming............................................................. 8
2.3 Causes of post-harvest vegetable losses along the vegetable supply chain ..................... 9
2.4 Estimation of the quantity and value of post-harvest losses .......................................... 11
2.5 Post-harvest handling techniques used to minimize post-harvest vegetable losses ....... 14
2.6 Theoretical and Conceptual Framework of the Study.................................................... 15

viii
2.6.1 Profit maximization Theory..................................................................................... 15
2.6.2 Conceptual Framework............................................................................................ 17
CHAPTER THREE ...............................................................................................................19
METHODOLOGY ................................................................................................................19
3.1 Introduction .................................................................................................................... 19
3.2 Study area ....................................................................................................................... 19
3.3 Sampling procedure........................................................................................................ 21
3.4 Sample size..................................................................................................................... 21
3.5 Data collection................................................................................................................ 22
3.6 Data analysis .................................................................................................................. 22
3.6.1 Quantification of economic post-harvest losses of Tomatoes, African egg-plant and
Amaranth. ......................................................................................................................... 22
3.6.2 Determining the principal causal factors contributing to post-harvest losses along
the vegetables supply chain. ............................................................................................. 23
3.6.3 Determining the factors influencing farmer’s choice of post-harvest handling
practices and techniques. .................................................................................................. 25
CHAPTER FOUR..................................................................................................................27
RESULTS AND DISCUSSION ............................................................................................27
4.1 Introduction .................................................................................................................... 27
4.2 Demographic and Socio-economic Characteristics of Vegetable Farmers .................... 27
4.3 Vegetable production and utilization ............................................................................. 31
4.4 Institutional and Market Characteristics in Vegetable Farming..................................... 32
4.5 The quantification of vegetable post-harvest losses....................................................... 34
4.5.1 The economic quantification of African egg-plant post-harvest losses................... 34
4.5.2 The economic quantification of amaranth post-harvest losses ................................ 37
4.5.3 The economic quantification of tomatoes post-harvest losses ................................ 39
4.6 Principal causal factors contributing to selected vegetable post-harvest losses............. 41
4.6.1 Principal causal factors contributing to post-harvest losses in African eggplant .... 41
ix
4.6.2 Principal causal factors contributing to post-harvest losses of Amaranth ............... 43
4.6.3 Principal causal factors contributing to post-harvest losses of tomatoes ................ 45
4.7 Factors influencing farmers’ choice of post-harvest handling practices and techniques
for African eggplant, amaranth and tomato ......................................................................... 47
CHAPTER FIVE ...................................................................................................................52
SUMMARY, CONCLUSIONS AND RECOMMENDATIONS .......................................52
5.1 Summary ........................................................................................................................ 52
5.2 Conclusion...................................................................................................................... 52
5.3 Recommendations .......................................................................................................... 52
5.4 Suggestions for further research..................................................................................... 53
REFERENCES.......................................................................................................................54
APPENDIX .............................................................................................................................63
Questionnaires ...................................................................................................................... 63

x
LIST OF TABLES
Table 1: Description of variables used in multiple linear regression....................................... 24
Table 2: Description of variables to be used in Multivariate Probit Model............................. 26
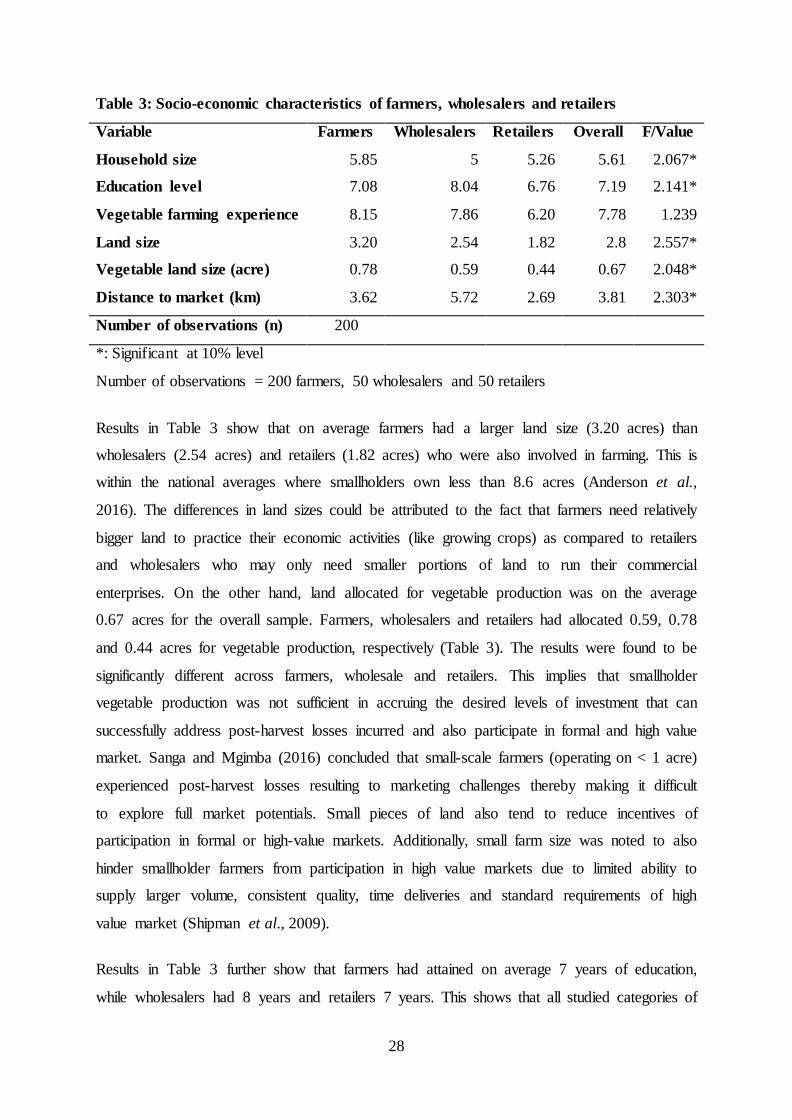
Table 3: Socio-economic characteristics of farmers, wholesalers and retailers ...................... 28
Table 4: Socio-economic characteristics (in percentages) of farmers, wholesalers and retailers
involved in vegetable farming.................................................................................................. 30
Table 5: Vegetable produced in percent and its utilization along the supply chain ................ 31
Table 6: Marketing and market access characteristics (in percentages) of farmers, wholesalers
and retailers involved in vegetable farming ............................................................................. 32
Table 7: The average amount (Kilogrammes) of African eggplant lost in the last season (year
2015/2016) and the cause of such losses ................................................................................. 36
Table 8: The average amount (Kilogrammes) of amaranth lost in the last season (year
2015/2016) and the cause of such losses ................................................................................. 38
Table 9: The average amount (Kilogrammes) of tomatoes lost the last season (year
2015/2016) and the cause of such losses ................................................................................. 40
Table 10: Principal causal factors contributing to post-harvest losses of African Eggplant ... 42
Table 11: Principal causal factors contributing to Amaranth post-harvest losses ................... 44
Table 12: Principal causal factors contributing to post-harvest losses in Tomato.................. 46
Table 13: Factors influencing farmers choice of post-harvest handling technique and practice
for African eggplant, amaranth and tomato ............................................................................. 48

xi
LIST OF FIGURES
Figure 1: Variables affecting post-harvest losses in vegetables ............................................. 18
Figure 2: A map of Babati District .......................................................................................... 20

xii
LIST OF ABBREVIATIONS AND ACRONYMS
Africa RISING Africa Research in Sustainable Intensification for the Next Generation
FAO Food and Agriculture Organization
GDP Gross Domestic Product
HODECT Horticultural Development Council of Tanzania
IFAD International Fund for Agricultural Development
Kg Kilogrammes
Km Kilometre
MAFC Ministry of Agriculture, Food Security and Cooperatives, Tanzania
MMA Match Maker Associates Limited
PHL Post-Harvest Losses
SME Small and Medium Scale Enterprise
TAHA Tanzania Horticultural Association
TZS Tanzania Shillings
URT United Republic of Tanzania
USAID United State Agency for International Development
1
CHAPTER ONE
INTRODUCTION
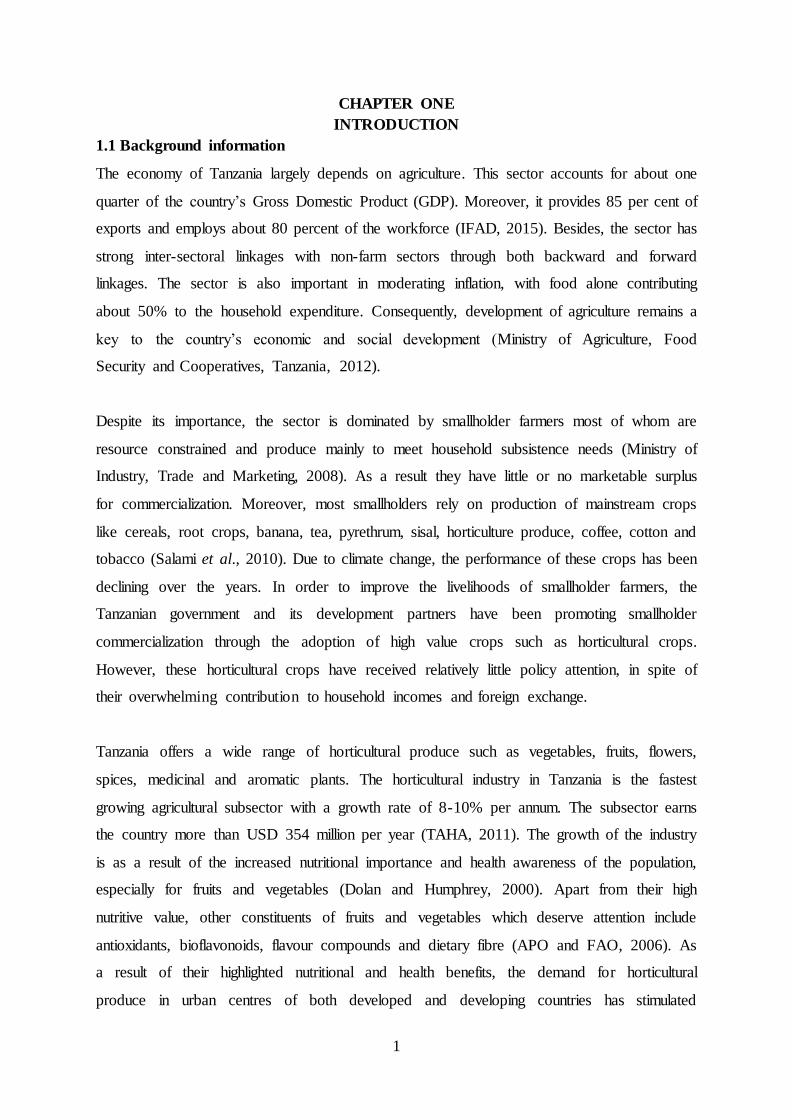
1.1 Background information
The economy of Tanzania largely depends on agriculture. This sector accounts for about one
quarter of the country’s Gross Domestic Product (GDP). Moreover, it provides 85 per cent of
exports and employs about 80 percent of the workforce (IFAD, 2015). Besides, the sector has
strong inter-sectoral linkages with non-farm sectors through both backward and forward
linkages. The sector is also important in moderating inflation, with food alone contributing
about 50% to the household expenditure. Consequently, development of agriculture remains a
key to the country’s economic and social development (Ministry of Agriculture, Food
Security and Cooperatives, Tanzania, 2012).
Despite its importance, the sector is dominated by smallholder farmers most of whom are
resource constrained and produce mainly to meet household subsistence needs (Ministry of
Industry, Trade and Marketing, 2008). As a result they have little or no marketable surplus
for commercialization. Moreover, most smallholders rely on production of mainstream crops
like cereals, root crops, banana, tea, pyrethrum, sisal, horticulture produce, coffee, cotton and
tobacco (Salami et al., 2010). Due to climate change, the performance of these crops has been
declining over the years. In order to improve the livelihoods of smallholder farmers, the
Tanzanian government and its development partners have been promoting smallholder
commercialization through the adoption of high value crops such as horticultural crops.
However, these horticultural crops have received relatively little policy attention, in spite of
their overwhelming contribution to household incomes and foreign exchange.
Tanzania offers a wide range of horticultural produce such as vegetables, fruits, flowers,
spices, medicinal and aromatic plants. The horticultural industry in Tanzania is the fastest
growing agricultural subsector with a growth rate of 8-10% per annum. The subsector earns
the country more than USD 354 million per year (TAHA, 2011). The growth of the industry
is as a result of the increased nutritional importance and health awareness of the population,
especially for fruits and vegetables (Dolan and Humphrey, 2000). Apart from their high
nutritive value, other constituents of fruits and vegetables which deserve attention include
antioxidants, bioflavonoids, flavour compounds and dietary fibre (APO and FAO, 2006). As
a result of their highlighted nutritional and health benefits, the demand for horticultural
produce in urban centres of both developed and developing countries has stimulated

2
increased production by smallholder producers in developing countries (FAO, 2003).
Consequently, Tanzania’s level of production of fresh vegetables is increasing and there is
still enormous production potential.
The country produces different types of vegetables such as edible roots, stems and leaves.
Vegetables cultivated in Tanzania are either indigenous or standard (exotic) type. Typical
indigenous vegetables produced by most farmers include African eggplant (Solanuma
ethiopicum), African nightshade (Solanum americanum), Amaranth (Amaranthus spp),
Bambara groundnut (Vigna subterranean), vegetable cowpea (Vigna unguiculata), Okra
(Abelmoschus esculentus) and Pumpkin (Cucurbita pepo) (Weinberger and Msuya, 2004).
Standard (exotic) vegetables include tomato (Solanum lycopersicum), cabbage (Brassica
oleracea var. capitata), carrot (Daucuscarota subsp. Sativus), sweet pepper (Capsicum
annuum), broccoli (Brassica oleracea var. italica), zucchini (Cucurbita pepo var. cylindrica),
lettuce (Lactuca sativa), cauliflower (Brassica oleracea var. botrytis) (MMA, 2008).
In Tanzania, most vegetables are grown on a small scale despite the fact that horticultural
crops present an alternative for farmers with too small cultivatable land to provide adequate
field income from field crops. Besides vegetable crops grow faster and generate higher
earnings per unit area in comparison to field crops (Zoss, 2009). Due to their higher earning
potential, they present an alternative for farmers with too small cultivable land to provide
adequate income from field crops (Mhango et al., 2014; Keller, 2004). Following this, Africa
RISING program funded by United States Agency for International Development (USAID)
came up with an initiative of integrating vegetables into maize-based systems for improved
nutrition and income of smallholder householder farmers. This initiative was implemented in
Babati District of Manyara region, Tanzania.
The sustainable integration of vegetables into maize-based farming systems of Babati was
aimed at enabling populations of semi-arid areas of Tanzania to capture nutritional and
economic benefits. This is important as 90% of Babati district’s population live in rural areas
and depends on rain fed agriculture for their livelihood (Africa RISING, 2013). Africa
RISING action research actively integrated and demonstrated vegetable farming and
marketing practices so as to improve nutrition, health and economic outcomes in order to
reduce the vulnerability of indigenous populations of the district. The project introduced
innovations that promote farm household dietary diversity, while diversifying household

3
income through high farm gate earnings accrued from target vegetable crops (that is,
amaranth, tomato, and African eggplant).
Despite the importance of this initiative, vegetable production still faces the challenge of high
post-harvest losses. Vegetables are highly perishable having 90 to 95% moisture content and
have relatively short shelf life compared to most staple crops (Masabni et al., 2009). The
perishable nature of most vegetables leads to high post-harvest losses along the supply chain.
Post-harvest losses in vegetables vary widely from commodity to commodity, place to place
and become more complex depending on the marketing system. Post-harvest losses have a
negative impact on the economic benefit derived from vegetable production (Weinberger and
Acedo, 2009). These losses are higher in developing countries due to limited knowledge,
skills, technologies, techniques and facilities for produce handling and processing.
Globally, more than thirty percent of all food that is produced is lost and/or wasted
through inefficiencies in the food supply chain (Porter and Reay, 2015). In the developing
world, the bulk of losses occur in the early stages of the supply chain, particularly,
during harvesting and distribution (Stephen and Reay, 2015). Sub-Sahara Africa
experiences losses between thirty to eighty percent of their perishable foods (fruits,
vegetables, root crops) before consumption (Kitinoja, 2013). In contrast, in the developed
world, this wastage is centred on the last stage in the supply chain, that is, the end-consumer
throwing away food that is purchased but not eaten. Food losses and waste have a negative
impact on the environment since they represent a waste of production factors and energy
resources, and contribute to greenhouse gas emissions (Segre et al., 2014).
Reducing post-harvest losses through application of appropriate post-harvest technologies
improves incomes of farmers and marketers. It also makes diversification into vegetable
production less risky and creates rural employment. Post-harvest technologies creates
income generation opportunities through value-addition activities since post-harvest
enterprises enhance productivity and competitiveness of vegetable industries, increases
opportunities for export and sustains economic growth (Jaffee and Gordon, 1993).
Minimizing post-harvest losses of already produced food is more sustainable than increasing
production to compensate for these losses as it has high internal rates of return, effect on
poverty, food security, health and sustainable use of resources.

4
1.2 Statement of the problem
The growing importance of vegetables offers an opportunity to many smallholders to improve
their livelihood. Africa RISING action research actively integrates and demonstrates
vegetable farming and marketing practices to nutrition, health and economic outcomes
in order to reduce the vulnerability of indigenous populations in Babati district. As a
result, many smallholders in Babati have integrated vegetables in their farming systems.
Despite the growing importance of vegetable production and marketing, many smallholders
and actors along the supply chain do not accrue sufficient returns due to high post-harvest
losses. This is as a result of the perishable nature of vegetables that leads to a considerable
gap between the gross production and net availability of vegetables with a large quantity
being lost through post-harvest losses. Moreover, most smallholder farmers have inadequate
knowledge on vegetable handling techniques. In Tanzania, researches on post-harvest losses
are limited, yet reducing post-harvest-losses can substantially contribute to improved
livelihoods of many farmers. In addition, there is a scarcity of information on the
quantification of economic costs of vegetables along the supply chain which this study aims
to address.
1.3 Objective of the study
1.3.1 General objective
The general objective of this study was to contribute to enhancing livelihoods of farmers in
Babati district, Tanzania through reduction of vegetable post-harvest losses.
1.3.2 Specific objectives
The specific objectives of the study are:
1. To quantify the economic post-harvest losses of tomatoes, African egg-plant and
amaranth along the supply chain in Babati District of Manyara region of Tanzania.
2. To determine the principal causal factors contributing to vegetable post-harvest losses
along the supply chain in Babati District of Manyara region of Tanzania.
3. To determine the factors influencing farmers choice of post-harvest handling practices
and techniques in Babati District of Manyara region of Tanzania.

5
1.4 Research questions
1. What economic losses (volume and value) of tomatoes, African eggplant and amaranth
are incurred due to post-harvest losses along the supply chain?
2. What are principal causal factors contributing to post-harvest losses of tomatoes, African
eggplant and amaranth along the supply chain?
3. What are the factors influencing the choice of vegetable post-harvest handling practices
and techniques in Babati District?
1.5 Justification and significance of the study
Vegetable production has the potential to contribute to the reduction of food insecurity and
poverty by increasing household income and food availability (Ochieng et al., 2016).
Reducing post-harvest losses for fresh produce has been seen as an important part of
sustainable agricultural development efforts meant to increase food availability (Kader,
2005). Reducing post-harvest losses of vegetables improves local food and nutritional
security, increases rural income, contributes to the increasing global food demand and
increases resource use efficiency.
Therefore, the study aimed at quantifying vegetable post-harvest losses within the vegetable
supply chain. Additionally, the study determined the driving factors of post-harvest losses
within the vegetable supply chain and offered suggestions that can help enhance awareness
creation of economic costs associated with current vegetable post-harvest losses as well as
recommendations for solving the identified causes of the observed losses. These findings
would be useful for farmers, researchers, investors, policy makers and government in
formulating appropriate decisions, policies, institutions and determining the key areas of
intervention in solving the problem of post-harvest vegetable losses.
1.6 Scope and limitation of the study
This study was restricted to analysis and documentation of economic cost quantification of
African eggplant, amaranth and tomato postharvest losses in Babati District of Tanzania.
Vegetable post-harvest losses include physical (quantity) and economic (quality) losses. The
physical losses include weight and volume losses of downgraded produce while economic
losses cover the produce that is unfit for human consumption. Although there are many
species of vegetables, this study was only focused on Tomato, African eggplant and

6
Amaranth cultivated at the area of study under the framework of the Africa Research in
Sustainable Intensification for the next Generation (Africa RISING) project being
implemented by the International Institute of Tropical Agriculture (IITA) and World
Vegetable Centre and other partners. The selection of the three vegetables was based on
increasing the diversity of crops in farmer fields by including micro-nutrients rich vegetables
to increase dietary diversity. The study focussed on farmers, wholesalers and retailers
involved in vegetable farming and selling during August 2015 to February 2016 season.

7
1.6 Operational definition of terms
Indigenous vegetables - refers to a crop species or varieties genuinely native to Babati
District, Tanzania or to a crop introduced into the region where over a period of time it has
evolved, although the species may not be native
Standard vegetables - are those non-traditional crops which are not part of the customary
diet of the local population and grown primarily for their high cash value and export
potential.
Vegetable post-harvest losses - are a measurable reduction in vegetable quantity and quality
which leads to the vegetable being regarded as unfit for human consumption and reduce
households’ nutrition and income security.
Quantity losses - are edible mass of vegetables lost due to apparent damage or spoilage.
Supply chain - refers to the range of activities performed to a product necessary to move the
commodity from point of production to a point of consumption.
Household - A person or group of persons who reside in the same homestead/compound but
not necessarily in the same dwelling unit, have same cooking arrangements, and are
answerable to the same household head.
Smallholder - This study will consider smallholder farmers as those harvesting less than 5
tonnes of vegetable per season.
Retailer - A person that sells goods to the public in relatively small quantities for use or
consumption rather than for resale.
Wholesaler - A farmer who buys vegetable from other farmers and bulks it for resale
typically to retailers.

8
CHAPTER TWO
LITERATURE REVIEW
2.1 Introduction
This chapter reviews the literature on vegetable farming and its importance in improving the
livelihoods of smallholder farmers of Babati district. The chapter also explores the principal
causes of post-harvest vegetable losses along the supply chain as well as the factors
influencing the choice of post-harvest handling techniques. A discussion on the theoretical
and conceptual framework is also provided.
2.2 Importance of vegetables and vegetable farming
Vegetables remain an important source of nutrients in many parts of the world and offer
advantages over dietary supplements because of low cost and wide availability (Kader, 2010).
They contain essential micronutrients, vitamins, antioxidants, and other health-related
phytochemicals that supplement staple-based diets (Afari-Sefa et al., 2012). Due to their
nutritional aspects, vegetables have captured the international spotlight in an unprecedented
way, as persistent global hunger and under nutrition has underscored the need for urgent
action (Afari-Sefa et al., 2016). Vegetables like amaranth (Amaranthus spp.) and African
eggplant (S. aethiopicum, S. anguivi and S. macrocarpon) have been shown to be rich in
micronutrients such as iron, zinc, pro-vitamin A (Weinberger and Msuya, 2004).
These vegetables are gaining importance in local and global supply chains, generating
revenue from export and increasing consumption in the local market (Aramyan et al., 2014).
Currently, smallholder farmers are finding production of vegetables as profitable in both rural
and urban settings (Afari-Sefa et al., 2012). Vegetable production in Eastern and Southern
Africa has the potential to be highly profitable, provide employment opportunities, generate
income and increase commercialization of the rural sector (Weinberger and Lumpkin, 2007).
To realize this potential, farmers and other supply chain actors must improve the
competitiveness of vegetable production and marketing to increase market share and profits.
This requires public sector, development and policy upgrade efforts to improve
competitiveness of the vegetable sector. Moreover, this has led to emerging private seed
supply sector whereby new, improved, nutrient-dense indigenous and standard vegetable
varieties are being released.

9
2.3 Causes of post-harvest vegetable losses along the vegetable supply chain
Post-harvest loss in terms of value and consumer quality attributes can occur at any stage
between harvest and consumption (Abbas et al., 2014). The major physiological, physical and
environmental causes of post-harvest losses are high crop perishability, mechanical damage,
excessive exposure to high temperature, relative humidity and rain. Other causes are
contamination by spoilage fungal and bacteria; invasion by birds, rodents, insects and other
pests; and inappropriate handling, storage and processing techniques (World Bank, FAO and
NRI, 2011). Moreover, losses may be aggravated by poor infrastructure, harvesting methods,
post-harvest handling procedures, distribution, sales and marketing policies (World Bank et
al., 2011).
Poor handling, unsuitable packaging and improper packing during transportation are the
cause of bruising, cutting, breaking, impact wounding, and other forms of injury in fresh
fruits and vegetables (APO and FAO, 2006; Choudhury et al., 2004). Mechanical injury can
be internal such as rotting inside the vegetable and not visible from outside. This leads to
spoilage of produce since its physiology is compromised. Also mechanical injury can be
external such as cuts and bruising that pave way for infections by pathogens and insects
which may lead to diseases (Sarpong et al., 2011).
Post-harvest losses in vegetables differ along the supply chain. Farmer’s losses are due to
high disease incidence and hot weather during harvest. While middlemen experience loss due
to oversupply of vegetables and failure to sell all produce as well as damage during
transportation. Similarly, retailers consider failure to sell all produce as a major reason for
loss, in addition to poor quality of purchased produce (Weinberger et al., 2008). A study on
knowledge and losses of fruits in Bagamoyo Tanzania found that mechanical injury,
transportation loss and microbial damage were the main post-harvest losses along the supply
chain (Kereth et al., 2013). Also other factors such as packaging materials, sunlight, hygienic
conditions and duration of selling the produce were also observed (Kereth et al., 2013).
The environmental conditions under which produce is stored have a major effect on the
storability as well as the quality of the produce. Temperature, relative humidity and moisture
as well as solar radiation are but a few of the environmental characteristics that affect post-
harvest losses (Egyir et al., 2011). However, high cost of using adequate storage devices
deters farmers from using them hence leading to high post-harvest losses (Egyir et al., 2011).

10
As a result inadequate storage facilities at producing or marketing centres leave the
produce to natural causes of losses such as decay by organisms, respiration,
transpiration and other biochemical reactions (Sudheer and Indira, 2007).
Cold chain failure in many developing countries are due to unreliability of power supply, lack
of proper maintenance, inefficiency utilization of cold storage and refrigerated transport
facilities (Kader, 2010). Small and Medium Enterprise Competitiveness Facility (SCF)
(2008), reported that horticulture post-harvest losses in Tanzania, especially for tomatoes,
ranges from about 30 to 50 percent due to poor handling during transport and storage. This is
similar to post-harvest losses experienced in India where about 30 percent of the fruits and
vegetables grown get wasted annually due to gaps in the cold chain such as poor
infrastructure, insufficient cold storage capacity, unavailability of cold storages in close
proximity to farms and poor transportation infrastructure (Maheshwar and Chanakwa, 2006).
Packing and packaging methods can greatly influence air flow rates around the commodity,
thereby affecting temperature and relative humidity management of produce while in storage
or in transit (Kader and Rosa, 2004). A study on post-harvest handling techniques of fruits in
Bagamoyo Tanzania found that most of farmers pack their fruits in plastic sacks, wooden
bamboo basket and in wooden crates due to that they are cheap and mostly available (Kereth
et al., 2013). Use of different types of sacks does not protect the fruits from mechanical
damage due to large congestion and high heat which in turn accelerates mechanical damage
and microbial attack (Kereth et al., 2013; Kader and Rolle, 2004).
Transport losses are usually caused by unsuitable transport containers, poor roads as well as
lack of feeder roads, methods of loading and arrangement of produce in vehicle (Egyir et al.,
2011). Mechanical injuries during transportation occur during loading, unloading, stacking
operations or from shocks and vibration during transportation (Prussia et al., 2009).
Therefore, this study adopted loss assessment methodologies that included; quantifying the
level of production through commodity system assessment method by identifying the most
important causal factors contributing to post-harvest losses and adopting a supply chain
approach by understanding how much of the initial produce reaches the particular step of the
value chain. Also consideration of the interaction of the various loss agents at the particular
level in the supply chain was taken.

11
2.4 Estimation of the quantity and value of post-harvest losses
Post-harvest losses in horticultural crops can be either quantitative or qualitative. Qualitative
losses (such as loss of caloric and nutritive value, loss of acceptability by consumers, and loss
of edibility) are more difficult to assess than quantitative losses of fresh fruit and
vegetable crops. While reduction of quantitative losses is a higher priority than
qualitative losses in developing countries, the opposite is true in developed countries
where consumer dissatisfaction with produce quality results in a greater percentage of
the total post-harvest losses (Kader, 2005). Calculation of these losses are related to
improper temperature management and the post-harvest handling chain which includes all
steps between harvesting and consumption such as sorting, cleaning, packing, cooling,
storage, transport and processing (Kitinoja and Al Hassan, 2012).
Generally, there are no universally accepted methods for evaluating post-harvest losses
of fresh produce (Egyir et al., 2008). Currently there is no agreed methodology for consistent
measurement of post-harvest food losses due to differences in social, economic,
environmental and political differences among different regions (Aulakh and Regmi, 2013).
Most of the studies in the last three decades have focused only on the storage stage of the
supply chain, ignoring other important stages which also contribute to post-harvest losses.
Ignoring other important stages like harvesting, transportation and processing which also
contribute to overall post-harvest losses represent gap in the estimation procedure which
needs to be addressed for more reliable future estimates. The stages of post-harvest handling
and length of supply chain depend on the perishability and physical properties of a crop
(Aulakh and Regmi, 2013). African Post-harvest Losses Information System (APHLIS)
provides a valuable framework for estimating post-harvest losses in South and East Africa
but the framework is mainly restricted to the large grain borer infestation and to seven major
crops (Rembold et al., 2011).
Commodity system analysis enables the identification of different steps that occur from
production to marketing of the product. It consists of pre-harvest and post-harvest operation
where by post-harvest operations give general representation of supply chain (Aulakh et al.,
2013). The post-harvest aspect of the commodity system gives the general representation of
the commodity’s supply chain and can therefore be a useful approach to aid holistic
assessment of post-harvest losses. The use of systematic analysis of the production and post-
harvest handling of each commodity provides logical first step towards identifying sources of

12
losses and post-harvest solutions (Kader, 2005). The purpose of using commodity system
approach is to de-categorize all activities in the post-harvest system (post-harvest handling
and marketing) of the commodity under observation into their smallest bit and then directly
measure their contribution in the overall losses observed (Kamarulzaman et al., 2014).
Critical stages approach which is similar approach to commodity system was used by Aulakh
et al. (2013) through identifying critical factors responsible for post-harvest losses at each
stage of food supply chain and their contribution to the total post-harvest losses. Both
qualitative and quantitative losses along the supply chain start at the time of harvest to its
consumption due to waste or inadvertent losses along the supply chain. Factors that
contribute to post-harvest losses range from mechanization of practices, processing, weather
conditions, production practices, management decisions, transportation facilities, grading,
infrastructure, consumer preferences and availability of financial markets. The losses along
supply chain incurred at each step vary depending upon the organization and technologies
used in the food supply chain (Aulakh et al., 2013).
The study by Affognon (2015) provided critical and comprehensive review for synthesis of
the evidence on the nature, magnitude, costs, and value of current post-harvest losses of
various groups of commodities along the supply chain in Sub-Saharan Africa. The study was
based on a comparative analysis across commodities (that is: cereals, pulses, fruits, roots and
tubers, vegetables, animal products, and oil crops), value chains and different contexts in six
African countries (Benin, Ghana, Kenya, Malawi, Mozambique and Tanzania). The study
used the meta-analysis approach of consolidating available evidence form many studies
conducted in the past. It identified gaps in post-harvest losses assessment and mitigation, and
their implications to the studied value chains.
According to a study done in Lao on tomato, yard long bean, cucumber and chill by Genova
et al. (2006), the estimation of post-harvest losses at famers’ level was quantified and
calculated as a percentage based on total harvested quantity. Whereas, post-harvest losses for
collectors, whole sellers and retailers was estimated as the difference between the quantity
purchased and quantity sold in relation to total quantity purchased. The value of loss
experienced was the actual loss in kilograms multiplied by the average selling price.

13
Another study on post-harvest losses in supply chain for vegetables (chilli pepper and
tomato) in Vietnam by Weinberger (2006) collected monthly observations for collectors,
wholesalers and retailers for an entire year. Post-harvest losses at the farm level was
quantified and calculated as a percentage based on total harvested quantity. For collectors,
wholesalers and retailers, loss was estimated as the difference between quantity purchased
and quantity sold in relation to total quantity purchased. To obtain the value of post-harvest
losses experienced, actual loss in kilogram (kg) was multiplied with the average selling price.
Amartey (2013) conducted a study on post-harvest estimation of selected vegetable crops in
Ghana. The value of the quantity of post-harvest losses was calculated as the product of the
average estimated quantity lost and the unit price.
Another study conducted in Karnataka on post-harvest losses in food grains at different
stages of their handling assessed the extent and magnitude of losses and identified the factors
responsible for such losses. Information about post-harvest losses was obtained from the
farmers during operations; harvesting, threshing, cleaning/winnowing, and drying. The
information on losses was collected from the farmers, market intermediaries, storage and
transit. The total post-harvest losses were estimated as a sum of all these losses. Multiple
linear regression model was used to examine the factors affecting post-harvest losses at farm
level in food grains (Basavaraja et al., 2007).
Ahmed et al. (2015) quantified the post-harvest losses of Kinnow (citrus fruit) at various
stages of the supply chain. The study estimated post-harvest losses in Kinnow at farm,
wholesale market and retail levels. To estimate the losses of Kinnow descriptive statistics
were used and double log form regression at three different levels (farm, wholesale market
and retail levels) was employed to determine the major determinants of citrus post-harvest
losses.
Aulakh et al. (2013) adopted a functional approach by identifying critical factors responsible
for post-harvest losses at each stage of the food supply chain. According to Aulakh et al.
(2013) total post-harvest losses was equal to sum of post-harvest losses at each stage of the
food supply chain represented as:

14
Total post-harvest losses =ΣSi =Σf (Xi) .................................................................................(i)
Where:
Si denotes the losses at each critical stage (harvesting, food storage, processing, packaging
and sales) of food supply chain.
Xi stands for the factors affecting losses (moisture, weather, pest/diseases, infrastructure, size
of operation, level of mechanization, quality management, operator characteristic and access
to capital) at each stage, and i represent critical stages from harvesting to sales.
Based on the reviewed literature, this study will use commodity system in identifying critical
factors responsible for vegetable post-harvest losses at each stage of supply chain and their
contribution to the total vegetable post-harvest losses.
2.5 Post-harvest handling techniques used to minimize post-harvest vegetable losses
Most of the factors that contribute to post-harvest losses are known. As much as different
technologies have been developed to reduce these losses, they have not been widely
implemented particularly among the smallholders. This is due to a myriad of factors
including inadequate marketing systems, transportation facilities, government regulations and
legislations, unavailability of needed tools and equipment, lack of information and poor
maintenance (Kader, 2005). In most cases, solutions to existing problems in the post-harvest
handling system require use of available information and application of available
technologies at the appropriate time and overcoming the socio-economic constrictions is
essential in reducing post-harvest food losses.
However, the choices of post-harvest handling techniques are affected by several factors. For
example farmers’ choice of storage techniques is influenced by quantity of grain stored,
education, gender of the farmer, capital invested and price of grains (Okoruwa et al., 2009).
Using a probit model, a study on factors influencing choice of pesticides used by grain
farmers in Southwest Nigeria found that age of household head, education, farming
experience, price of grains and quantity of grains consumed were significant factors that
influences the choice of pesticides. Furthermore, Okoruwa et al. (2009) found that the choice
of pesticide used by farmers was influenced by quantity of grains harvested, cost of pesticide
and investment cost. Conteh et al. (2015) concluded that education level, household size, and
type of grain grown positively influenced adoption of grain storage technologies while mode

15
of acquisition of farmlands and farming systems had negative influence on the adoption of
the technologies.
Temperature management is the most effective tool for extending the shelf life of fresh
horticultural commodities (FAO, 2004). But high cost of using adequate storage devices
deters farmers from using them hence leading to high post-harvest losses (Egyir et al. 2011).
The use of cold chain for perishable foods product during the post-harvest steps such as
harvest, collection, packing, processing, storage, transport and marketing is widely used in
developed countries and can be highly cost effective compared to increasing production
(Kitinoja, 2013). Poor infrastructure for storage, processing and marketing in many countries
of the region contributes to a high proportion of post-harvest losses which average between
10 and 40 percent. Major infrastructural limitations also continue to impose severe
constraints to domestic distribution as well as to the export of horticultural produce (APO,
2006). A study by Mwebaze and Mugisha (2011) in Uganda found out that farmers prefer
local post-harvest reduction methods instead of government improved post-harvest
technologies because producers do not know whether the benefits of the latter will surpass the
cost.
2.6 Theoretical and Conceptual Framework of the Study
2.6.1 Profit maximization Theory
Unlike growing of major food crops among smallholder farmers in Africa, commercial
orientation in horticultural crops like flowers, fruits and vegetables grown takes precedence
over food self-sufficiency. This is because most of these crops are grown mainly for sale.
Therefore, profit maximization theory would better explain losses associated with vegetable
farming compared to utility maximization theory.
Post-harvest losses are often economic rather than complete physical loss as it has been
assumed to be the case (Affognon, 2015). Reducing post-harvest loss increases yield and
profitability to farmers. Farmers will minimize post-harvest losses (PHL) when they have
financial motivations to do so (Hodges et al. 2011). However, most of rural farmers are faced
with high opportunity costs of capital and liquidity constraints due to competing demands for
limited cash resources (Affognon, 2015). Therefore, PHL mitigation plays an important role
on farmers’ decisions based on diversification and supply responses to risk in agricultural
production.

16
This study models farmer’s problem using a standard microeconomic structure (see for
example Varian 2010) with focus on vegetable post-harvest losses. Consider a competitive
firm (farmer) with the production function of two inputs X1 and X2. Where by X1 is the input
to vegetable PHL mitigation and X2 are all inputs to vegetable production. In the short-run
2X is fixed.
iiXXfY ............................................................................).........21
Consider the short-run profit maximization problem behaviour
iiiXWXWPY ......................................................................................2211
Where )( 21 XXfY
W1 Cost of post-harvest loss mitigation such as sorting, grading, cooling, packaging, storage
and transporting.
W2- Cost of all inputs used in vegetable production.
This expression can be solved for Y to express output as a function of X1 as shown in
equation iv:
ivXp
wX
pw
pY ....................................................** 1
12
2
Where 21
2
1
* Xp
wp
depicts the Y intercept. 1
1
pw
is the slope of profit line
(π), which is the marginal product of post-harvest losses mitigation. Focusing on price of
vegetables, farmers receive greater benefits from loss mitigation when vegetable prices rise
and lower benefits when prices fall. Thus the farmers accept vegetable post-harvest loss
because the costs to mitigate loss are greater than the benefits.
Substituting constraint (v) into objective function below:
vXWXWXXPf ..............................................................................)( 221121
The inputs demand ),( 211
*
1 XXPXX whereby *
1X the vector of input that maximizes profit
is given P, X1and 2X .
The condition for the optimal choice of input factor X1:
If *
1X is the profit-maximizing choice of factor X1, then the output price multiplied by the
marginal product of factor X1 should equal the price of factor X1.
viWXXpMP .............................................................................................),( 12*
11

17
If the value of marginal product exceeds its cost, then profits can be increased by increasing
input X1. If the value of marginal product is less than its cost, then profits can be increased by
decreasing the level of input X1. This means that at a profit maximizing choice of inputs and
outputs, the value of the marginal product, ),( 2*
11 XXpMP should equal the factor price, W1.
2.6.2 Conceptual Framework
This study is conceptualized based on literature review and Commodity System Assessment
Method (CSAM) (Neese et al., 2013). After the harvesting activity vegetables are moved
from the point of production (farm) to point of consumption. Vegetables are moved along the
supply chain through different supply chain actors such as farmers, collectors, processors,
whole sellers and retailers. Different activities associated with moving the vegetables are
performed by supply chain actors and they include harvesting, sorting and grading,
packaging, transporting and storage. Vegetable losses can occur at any point along the supply
chain and to any supply chain actor. The causes of post-harvest vegetable losses at each
activity undertaken on a produce are more or less similar. Post-harvest vegetable losses along
the supply chain are attributed to harvesting method (mechanical or not mechanical), time of
harvesting, loading/off-loading, packaging, packing during transportation (grates, bags),
mode of transportation (refrigerated/not refrigerated), storage (refrigerated or not
refrigerated) and contamination (washing). Different measures such as shade, maturity
indices, use of improved containers, sorting/grading, solar drying and hand-washing/hygiene
can be undertaken to reduce the magnitude of losses. Reducing the magnitude of post-harvest
losses in vegetables provides incentive to producers and consumers in form of nutrition,
health and economic benefits.

18
Figure 1: Variables affecting post-harvest losses in vegetables
Production Consumption
Supply chain actors’
characteristics, (age, gender,
education level,
household size, income, farm
size, experience)
Improved
livelihood
Post-harvest handling
techniques and practices
(Shade, maturity indices,
sorting/grading, hand-
washing/hygiene and
cooling)
Post-harvest handling
activities (harvesting,
sorting, packaging,
transporting, storage)
Increase or
decrease in post-
harvest losses
Increase or decrease
in revenue (price
and quantity)
Value chains of vegetables (Farmers, Wholesalers, Retailers)
19
CHAPTER THREE
METHODOLOGY
3.1 Introduction
This chapter presents the research methods that were used in collecting and analysing data
from vegetable farmers in Babati district, Manyara region, Tanzania. It begins with a
description of the study area, followed by an explanation of the sampling technique and the
sample size from which data was collected. The section on data collection methods explains
the tools that were used for data collection and the variables that were measured for the
empirical analysis. The analytical framework is based on empirical models giving a
justification for selecting particular models.
3.2 Study area
This study was conducted in Babati district, Manyara region, Tanzania. Babati district is
situated in Northern Zone of Tanzania, and located between latitude 3º and 4º south and the
longitude 35º and 36º. The region was chosen because of its potential in vegetable farming.
Babati district consists of four divisions, 21 wards and 82 villages. The population of Babati
district in 2012 was 405,500 (312,392 for Babati District Council and 93,108 for Babati
Town Council) (URT, 2013). The periodic growth rate for the district was about three
percent per year between 2002 and 2012. An agricultural survey conducted by the United
Republic of Tanzania through the ministry of agriculture in 2007/08 revealed 63,816
agricultural households, of which fifteen percent were female-headed (URT, 2012).

20
Figure 2: A map of Babati District

21
3.3 Sampling procedure
A multi-stage sampling design was adopted for the ultimate selection of vegetable farmers.
First stage Babati district from Manyara region was purposively selected based the agro
climate, maize based system and population and livestock density. Second stage, five villages
(Matufa, Seloto, Berma, Galapo and Babati town) were purposively selected based on their
vegetable production, constraints and opportunities. The number of smallholder vegetable
farmers was sampled from each village using stratified sampling. The selected farmers were
those who had integrated vegetables into maize based system under Africa RISING action
research.
3.4 Sample size
The desired sample size for farmers was determined using a formula by Kothari (2004).
viie
pqZn .........................................................................................................
2
2
Where by n =Sample size, p = 0.5 (expected proportion of vegetable farmers under Africa
RISING action research), q = (1-0.5) = 0.5, Z = 1.96 at 95% confidence level and e =7%
(allowable margin of error).
The sample size for farmers was;
)(..........................................................................................196)07.0(
5.05.0)96.1(2
2
1 viiixx
n
Where;
n2 =Sample size for wholesalers/retailers, p=0.1 (10% is the expected proportion of vegetable
wholesalers and retailers), q=(1-0.1)=0.9, Z=1.96 at 95% confidence level and e =8%
(allowable margin of error).
Wholesalers and retailers were chosen purposively across all the target villages.
The sample size for wholesalers and retailers was as shown in equation ix.
)(..........................................................................................54)08.0(
9.01.0)96.1(2
2
2 ixxx
n

22
3.5 Data collection
Data for this study was collected using structured questionnaires. In order to get data for loss
estimates this study adopted loss assessment methodologies that included; quantifying the
level of production, identifying the most important causal factors contributing to post-harvest
losses and adopting a supply chain approach by understanding how much of the initial
produce reaches the particular step of the value chain. Consideration was also given to the
interaction of the various loss agents at the particular level in the supply chain. The target
farmer households were 196 according to the computed sample size however a total of 200
questionnaires were administered to respondent farmers and since they were complete and
with the right information they were all considered for the analysis. Additionally, structured
questionnaire was used to collect data from 50 wholesalers and 50 retailers.
3.6 Data analysis
To achieve the objectives of this study, the collected data was cleaned, organized and
analysed using IBM Statistical Package for Social Sciences (SPSS) Statistics version 20 and
Stata version 12 SE for windows. Specifically, descriptive statistics and inferential statistics
were employed to analyse data and address the study objectives.
3.6.1 Quantification of economic post-harvest losses of Tomatoes, African egg-plant and
Amaranth.
Descriptive statistics such as averages, frequencies, percentages and standard deviations were
used to determine the economic post-harvest losses of African eggplant, amaranth and
tomato. African eggplant, amaranth and tomato post-harvest losses at farm level were
quantified and calculated as kilograms based on total harvest. For wholesalers and retailers
post-harvest losses were estimated as the difference between quantity purchased and quantity
sold in relation to total quantity purchased. However, wholesalers and retailers post-harvest
losses estimates were generalized as the total percentage share of the post-harvest loss by
season. To estimate the value of post-harvest losses of African eggplant amaranth and
tomato; the average quantity of post-harvest losses obtained was multiplied by average price
of the vegetables.

23
3.6.2 Determining the principal causal factors contributing to post-harvest losses along
the vegetables supply chain.
The log-linear Regression Model was used to determine the principal causal factors
contributing to post-harvest losses along the vegetables supply chain in Babati district. The
model was specified at farm level, wholesalers and retailers. Quantity of post-harvest losses
was used as the dependent variable to farmers, wholesalers and retailers.
At farmers:
)........(....................
&exp
514413312
2111109876
543210
xDDD
DDdFieldpLoadnDistmrkFarm
FarmsizeHHsizeEducAgeGenderLnY
At wholesalers:
)........(....................
&exp
514413312
2111109876
543210
xiDDD
DDdFieldpLoadnDistmrkFarm
FarmsizeHHsizeEducAgeGenderLnY
At retailers:
)........(....................
&exp
514413312
2111109876
543210
xiiDDD
DDdFieldpLoadnDistmrkFarm
FarmsizeHHsizeEducAgeGenderLnY

24
Table 1: Description of variables used in multiple linear regression
Code
Variable
Variable Variable
type
Unit of measurement Expected
sign
Dependent variables
Y Quantity of vegetable
post-harvest losses at
farm level, wholesale
and retail
Continuous Kilogram +
Independent variables
Gender Gender of the
household head
Dummy 1=Male, 0=Female +/-
Age Age of the household
head
Continuous Years +
Educ Education level Continuous Years +
HHsize Household size Continuous Number of persons +
Farmsize Farm size allocated
for vegetable farming
Continuous Acre +/-
Farmexp Vegetable farming
experience
Continuous Years +
Distmrk Distance to the
market
Continuous `Kilometre +/-
Loadn Loading/off loading Continuous Kilogrammes +/-
FieldP&D Pest and diseases Continuous Kilogrammes +/-
Ptime Picking time Dummy D1 = 0 picked in
Evening D1 = 1 picked
in Morning,
+/-
Harmethod Harvesting method Dummy D2 = 0 harvested
manually D2 = 1 With
scissor
+/-
Storage Storage condition Dummy D3 = 0 normal
temperature D3 = 1
controlled temp.
+/-
Packing Packaging materials
during transportation
Nominal D4 =0 plastic bag
D4 =1 Bamboo basket
D4 = 2 Wooden create
D4 = 3 Plastic create
+/-
Transmode Mode of
transportation (type
of transportation
used)
Nominal D5 = 0 Head,
D5 =1 Cart
D5 =2 Car
+/-
Natroad Nature/type of the
road
Nominal D6= 0 Weather road,
D6=1 Murram,
D6= 2 Tarmac
+/-
ε = Disturbance term, β0is Constant term
β1, β2, β3, β4, β5,β6 are the coefficients of estimates in the model
25
3.6.3 Determining the factors influencing farmer’s choice of post-harvest handling
practices and techniques.
Multivariate Probit Model was used to analyse the factors that influence farmers’ choice of
post-harvest handling techniques and practices. In a single statistical model, information on
farmers’ choice of post-harvest handling techniques and practices does not alter the
likelihood of a farmer’s choice of another post-harvest handling technique and practice. The
use of particular post-harvest handling practice and technique is choice based, in that a
household could opt to use a combination of practices based on the perceived benefit that can
be derived from it. Farmers’ can also use more than two post-harvest handling techniques and
practices. For instance, a farmer could combine shade and maturity indices or improved
containers and sorting/grading or solar drying and cooling.
Probit and Logit models are commonly used to model decisions which involve two complete
mutually exclusive alternatives (Gujarati, 2007). However choice decisions are not bound
between two alternatives. The selection of post-harvest techniques is such where Probit and
Logit models may not be so helpful in analysis. In such cases, advanced models like
multinomial Probit and Logit can be used. Multinomial Logit is an appropriate technique
especially when the dependent variable categories are not ordered (Gujarati, 2007). Joseph
(2010) further explains that Multinomial Logit (MNL) model is similar to the Binary Logit
model, except that the dependent variable in this case will have multiple discrete outcomes.
In addition the technique of MNL can be used to study nominal categories in which the
regressands are unordered or unranked unlike the ordinal Logit models that models only
ordered response categorical variables (Gujarati, 2007).
However, the choices of post-harvest handling techniques and practices are not mutually
exclusive as a farmer may use more than one post-harvest handling technique and practice at
the same time and therefore the random error component of post-harvest handling technique
and practice may be correlated. The shortfall of this technique is that all multinomial
replications of the multivariate choice system have the problem in interpreting the influence
of dependent variables on the original separate post-harvest techniques. Therefore
multivariate probit model seemed to be the best model for this objective because it allows
possible contemporaneous correlation in the choice to use the combination of post-harvest
handling technique and practices simultaneously.

26
The Multivariate model adopted is characterized by a set of n binary dependent variables Yi
such that
---------------------------------------------- (xiii)
Where x is a vector of explanatory variables, β1,β2, …, βn are conformable parameter vectors,
and the random error terms ,, 2, … n are distributed as multivariate normal distribution
with mean of zero, unitary variance and a contemporaneous correlation matrix.
Table 2: Description of variables to be used in Multivariate Probit Model
Code
Variable
Variable Variable
type
Unit of measurement Expected
sign
Dependent variables
Matind Maturity indices Dummy 1=Yes 0=No +/-
Shade Shade Dummy 1=Yes 0=No +/-
Sortin Sorting/grading Dummy 1=Yes 0=No +/-
Washing Washing Dummy 1=Yes 0=No +/-
Cooling Cooling Dummy 1=Yes 0=No +/-
Independent variables
Gender Gender of the
household head
Dummy 1=Male, 0=Female +/-
Age Age of the household
head
Continuous Years +
EducL Education level Continuous Years +
HHsize Household size Continuous Number of persons +
Farmsize Farm size allocated
for vegetable farming
Continuous Acre +/-
Fexper Vegetable farming
experience
Continuous Years +
Distmrk Distance to the market Continuous Kilometre +/-
Vegqnty Quantity of vegetable
harvested/bought
Continuous Kilogram +/-
Vprice Price of vegetables Continuous Value in TZS +
HH. income Household income Continuous Value in TZS +
Extension Extension services on
post-harvest handling
Dummy 1=Yes 0=No +
Transaset Ownership of
transportation asset
Dummy 1=Yes 0=No +
Natroad Nature /type of the
road
Dummy 1=Yes 0=No +/-

27
CHAPTER FOUR
RESULTS AND DISCUSSION
4.1 Introduction
The chapter begins with a description of the socioeconomic characteristics of the sampled
households in relation to vegetable farming. The quantification of economic post-harvest
losses of African egg-plant, amaranth and tomatoes are discussed. This is followed by an
assessment of the determinants and discussion of the principal causal factors contributing to
vegetable post-harvest losses. Lastly factors influencing farmers’ choice of post-harvest
handling practices and techniques are determined.
4.2 Demographic and Socio-economic Characteristics of Vegetable Farmers
This section provides an analysis of the demographic and socio-economic characteristics of
the sampled 200 farm households, 50 wholesalers and 50 retailers from five villages Galapo,
Babati town, Matufa, Bermi and Seloto of Babati district in Manyara region.
Results show that the average household size of vegetable farmers was 6 members compared
to that of wholesaler and retailer based households whose average was 5 members. The
results on household size were significantly different at 10% significance level (Table 3).
These household sizes are higher than majority of agricultural households in the country
which have 4 to 5 members (Anderson et al., 2016). The bigger household size for farmers
could be due to the need of family labour for on-farm labour since vegetable farming is
comparatively more labour intensive than trading in vegetables. Household size is quite
important for vegetable farming and agricultural production in general than for off-farm
occupations at the community level at large. Thus, having a substantial number of people
within a household helps with on-farm family labour and this can substantially affect
household cash flows. Alene et al. (2008) noted that household size could explain the family
labour supply for production activities and household composition levels. This is also
consistent with work done by Tufa et al. (2014) who found out that the average household
size in Ethiopia’s farming households was 6; however, it had significant negative influence
on commercialization of horticultural crops due to the increased need to meet food
requirements for the household. Similar findings were reported by Ansah and Tetteh (2016)
who found out that larger household had more incidences of yam post-harvest losses and
lower quality of stored food in Ghana. However, Ansah and Tetteh (2016) argue that this
argument was counterintuitive since it was expected that larger households should have more
labour to handle post-harvest handling activities.
28
Table 3: Socio-economic characteristics of farmers, wholesalers and retailers
Variable Farmers Wholesalers Retailers Overall F/Value
Household size 5.85 5 5.26 5.61 2.067*
Education level 7.08 8.04 6.76 7.19 2.141*
Vegetable farming experience 8.15 7.86 6.20 7.78 1.239
Land size 3.20 2.54 1.82 2.8 2.557*
Vegetable land size (acre) 0.78 0.59 0.44 0.67 2.048*
Distance to market (km) 3.62 5.72 2.69 3.81 2.303*
Number of observations (n) 200
*: Significant at 10% level
Number of observations = 200 farmers, 50 wholesalers and 50 retailers
Results in Table 3 show that on average farmers had a larger land size (3.20 acres) than
wholesalers (2.54 acres) and retailers (1.82 acres) who were also involved in farming. This is
within the national averages where smallholders own less than 8.6 acres (Anderson et al.,
2016). The differences in land sizes could be attributed to the fact that farmers need relatively
bigger land to practice their economic activities (like growing crops) as compared to retailers
and wholesalers who may only need smaller portions of land to run their commercial
enterprises. On the other hand, land allocated for vegetable production was on the average
0.67 acres for the overall sample. Farmers, wholesalers and retailers had allocated 0.59, 0.78
and 0.44 acres for vegetable production, respectively (Table 3). The results were found to be
significantly different across farmers, wholesale and retailers. This implies that smallholder
vegetable production was not sufficient in accruing the desired levels of investment that can
successfully address post-harvest losses incurred and also participate in formal and high value
market. Sanga and Mgimba (2016) concluded that small-scale farmers (operating on < 1 acre)
experienced post-harvest losses resulting to marketing challenges thereby making it difficult
to explore full market potentials. Small pieces of land also tend to reduce incentives of
participation in formal or high-value markets. Additionally, small farm size was noted to also
hinder smallholder farmers from participation in high value markets due to limited ability to
supply larger volume, consistent quality, time deliveries and standard requirements of high
value market (Shipman et al., 2009).
Results in Table 3 further show that farmers had attained on average 7 years of education,
while wholesalers had 8 years and retailers 7 years. This shows that all studied categories of

29
agents involved in vegetable production and marketing had attained primary education
showed by an average 7 years of schooling. However, about 4% of sampled population had
not attended school at all. A probable explanation for this could be that literate farmers more
likely to adopt new technologies and crops, can be trained easily and improve on their farm
production and post-harvest handling practices for higher yields, minimizing losses and profit
maximization. Literate farmers are likely to adopt new technologies than farmers without
formal education thereby increasing their productivity and net farm returns (Botlhoko and
Oladele, 2013).
In terms of experience in vegetable farming, the results indicate that the respondents had an
average 7.78 years of experience in vegetable farming. This shows that most farmers in the
study area ventured into vegetable farming less than 10 years ago. This shows that
commercial vegetable farming was relatively a new venture among farmers in Tanzania.
These results are similar to those observed by Adepoju (2014) who found out that majority of
horticultural farmers in Osun State in Nigeria had less than 10 years of farming experience.
Sanga and Mgimba (2016) also found that 78.9% of their sampled farmers have less than 20
years’ experience in farming.
Farmers sell their vegetable produce to markets where the average distance to the markets is
3.62 kilometres. On the other hand, wholesalers sell their vegetable produce to markets where
the average distance to the markets is 5.72. Retailers outsource vegetables for selling at an
average distance of 2.69 kilometres and sell them along roadsides and nearby centres. The
difference in distance to nearest market was found to be statistically significant across
farmers, wholesalers and retailers. The plausible explanation for this could be that farms need
to be near local markets where they sell most of their produce due to inability to process their
vegetable produce in order to reduce post-harvest losses and lack of capital to access distant
markets for higher profit margin. Additionally, retailers are also relatively nearer the markets
because they source their merchandise in small quantities from farmers in the locality to cut
on transport cost unlike wholesalers who can buy in bulk from distant suppliers. Good
physical infrastructure such as good roads is therefore a prerequisite to market access.
Table 4 shows a comparison of categorical socio-economic characteristics of smallholder
farmers who are involved in vegetable farming. The socio-economic characteristics discussed
here are gender and age of the household head.

30
Table 4: Socio-economic characteristics (in percentages) of farmers, wholesalers and
retailers involved in vegetable farming
Variable Category Farmers’ Wholesalers Retailers Overall 2
Household
members age
between 18-
60 years
2.83 2.46 2.72 2.75 0.739
Gender of
household
head
Female 16 18 48 21 25.573***
Male 84 82 52 79
***: Significant at 1% level
Number of respondents = 200 farmers, 50 wholesalers and 50 retailers
Households’ members who were aged between 18-60 years were on average 3 members for
farmers’ and retailers’ households and 2 members at wholesalers’ households as indicated in
Table 4. This could be because age was an important feature in vegetable production and
marketing because the activities involved in its production to marketing are fairly tedious and
labour intensive in nature. All sampled households in this study used family labour in
vegetable farming. These results are consistent with those of Covarrubias (2012) who found
that households consist of an average of 5.4 members, 2.5 of which are of working age,
defined as being from 15 to 60 years old.
Further results in Table 4 show that, 79 percent of the sampled households were male headed
while 21 percent were female headed households. In relation to wholesalers, 82 percent of the
households were male headed households while female headed households were 18 percent.
Unlike for farmers and wholesalers where male headed households were majority, the results
were relatively equal in number of male and female headed households for the retailers where
52% were male and 48% were female. This implies that retail business was not a preserve of
either gender; both males and females have commercial orientation when it comes to retailing
agricultural products. The Chi-square computation showed a statistically significant
difference across gender and involvement in vegetable farming at 1 percent level across the
three groups. This is an indication that most agricultural households are male headed and
majority of the people who control resources in the households are male. This shows that
men were relatively playing a bigger role in managing agricultural enterprises and farm
business decision making; however, women’s supporting role cannot be overlooked. Adoco
and Levine (2005) argue that where both men and women are involved in household decision

31
making, men possess higher authority to use, sell and control many other factors of
agricultural production as compared to women.
4.3 Vegetable production and utilization
Different varieties of vegetables were being cultivated in Babati which include African
eggplant, tomatoes, cabbages, onions, Chinese cabbages, spinach, eggplant, carrots, okra and
chillies. It was also noted that indigenous vegetables (IVs) such as Amaranth, African
nightshade, pumpkin leaves and cowpeas leaves were also grown and consumed in Babati.
Results show that for the sampled households’, farmers produce about 3.8 tonnes of tomatoes
per acre per season. The farmers sell their vegetables produce mainly to traders who come to
the farm and occasionally farmers who are nearer to urban markets take vegetable straight to
the markets. African Eggplant, Amaranth and Tomatoes are consumed in small quantities at
household level (less than 6%) because vegetables are mainly added to food to give it a good
taste and are rarely used as main sauce (Table 5).
Table 5: Vegetable produced in percent and its utilization along the supply chain
Crop Utilization Farm level Wholesaler Retail
Sold 73 72 51
African Egg-plant Food. 6 2 4
Other purpose 5 7 4
Lost 16 19 41
Sold 52 62 58
Amaranth Food. 3 3 6
Other purpose 14 28 24
Lost 31 7 12
Sold 49 53 46
Tomatoes Food. 3 3 4
Other purpose 17 18 10
Lost 31 26 40
Number of respondents = 200 farmers, 50 wholesalers and 50 retailers

32
4.4 Institutional and Market Characteristics in Vegetable Farming
The institutional and market characteristics analysed were: mode of transportation, nature or
type of the road, packaging materials and storage condition. Different modes of transportation
were used to transport vegetables to the market such as head, bicycle, motorbike, ox cart, car
and truck (Table 6).
Table 6: Marketing and market access characteristics (in percentages) of farmers,
wholesalers and retailers involved in vegetable farming
Variable Category Farmers’ Wholesalers Retailers Overa
ll
2
Mode of
transportation
used
Head 9 8 20 10.7 7.415
Bicycle 28 26 24 27 3.611
Motorcycle 25.5 40 46 31.3 12.041***
Oxcart 3 2 0 2 4.765
Car 7.5 16.6 2 8 9.874**
Truck 1 2 0 1 4.072
26 5 8 20
Nature/type of
the road
Weather 53 64 82 58
21.872*** Murram 21 4 4 16
Tarmac 26 32 14 26
Packaging
materials
Plastic bag 10 14 10 12 31.283***
Bamboo basket 5 4 16 8
Wooden crates 55 72 55 60
plastic crates 5 0 2 6
Polythine bag 6 0 10 6
19 10 7 8
Storage
condition
Normal
temperature
99 94 94 96 6.283
Controlled
temperature 1 6 6 4
***, **: Significant at 1%; and 5% level, respectively
Number of respondents = 200 farmers, 50 wholesalers and 50 retailers
Farmers used bicycles and motorbikes more in transporting their vegetables. From the results
28% of the respondents used bicycles to transport vegetables to the market while 25 percent
used motor cycles (Table 6). On the other hand, 26% of the wholesalers transported
vegetables using bicycles while 40% used motor cycles. For the retailers, 20% transported
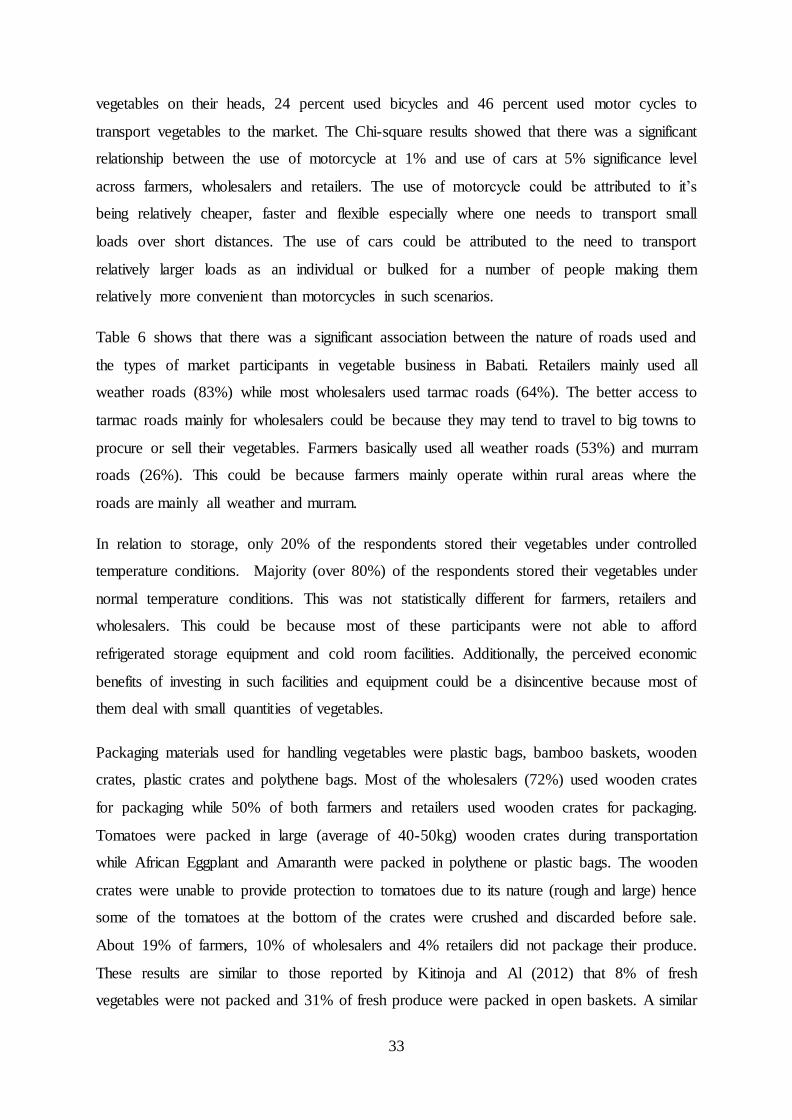
33
vegetables on their heads, 24 percent used bicycles and 46 percent used motor cycles to
transport vegetables to the market. The Chi-square results showed that there was a significant
relationship between the use of motorcycle at 1% and use of cars at 5% significance level
across farmers, wholesalers and retailers. The use of motorcycle could be attributed to it’s
being relatively cheaper, faster and flexible especially where one needs to transport small
loads over short distances. The use of cars could be attributed to the need to transport
relatively larger loads as an individual or bulked for a number of people making them
relatively more convenient than motorcycles in such scenarios.
Table 6 shows that there was a significant association between the nature of roads used and
the types of market participants in vegetable business in Babati. Retailers mainly used all
weather roads (83%) while most wholesalers used tarmac roads (64%). The better access to
tarmac roads mainly for wholesalers could be because they may tend to travel to big towns to
procure or sell their vegetables. Farmers basically used all weather roads (53%) and murram
roads (26%). This could be because farmers mainly operate within rural areas where the
roads are mainly all weather and murram.
In relation to storage, only 20% of the respondents stored their vegetables under controlled
temperature conditions. Majority (over 80%) of the respondents stored their vegetables under
normal temperature conditions. This was not statistically different for farmers, retailers and
wholesalers. This could be because most of these participants were not able to afford
refrigerated storage equipment and cold room facilities. Additionally, the perceived economic
benefits of investing in such facilities and equipment could be a disincentive because most of
them deal with small quantities of vegetables.
Packaging materials used for handling vegetables were plastic bags, bamboo baskets, wooden
crates, plastic crates and polythene bags. Most of the wholesalers (72%) used wooden crates
for packaging while 50% of both farmers and retailers used wooden crates for packaging.
Tomatoes were packed in large (average of 40-50kg) wooden crates during transportation
while African Eggplant and Amaranth were packed in polythene or plastic bags. The wooden
crates were unable to provide protection to tomatoes due to its nature (rough and large) hence
some of the tomatoes at the bottom of the crates were crushed and discarded before sale.
About 19% of farmers, 10% of wholesalers and 4% retailers did not package their produce.
These results are similar to those reported by Kitinoja and Al (2012) that 8% of fresh
vegetables were not packed and 31% of fresh produce were packed in open baskets. A similar
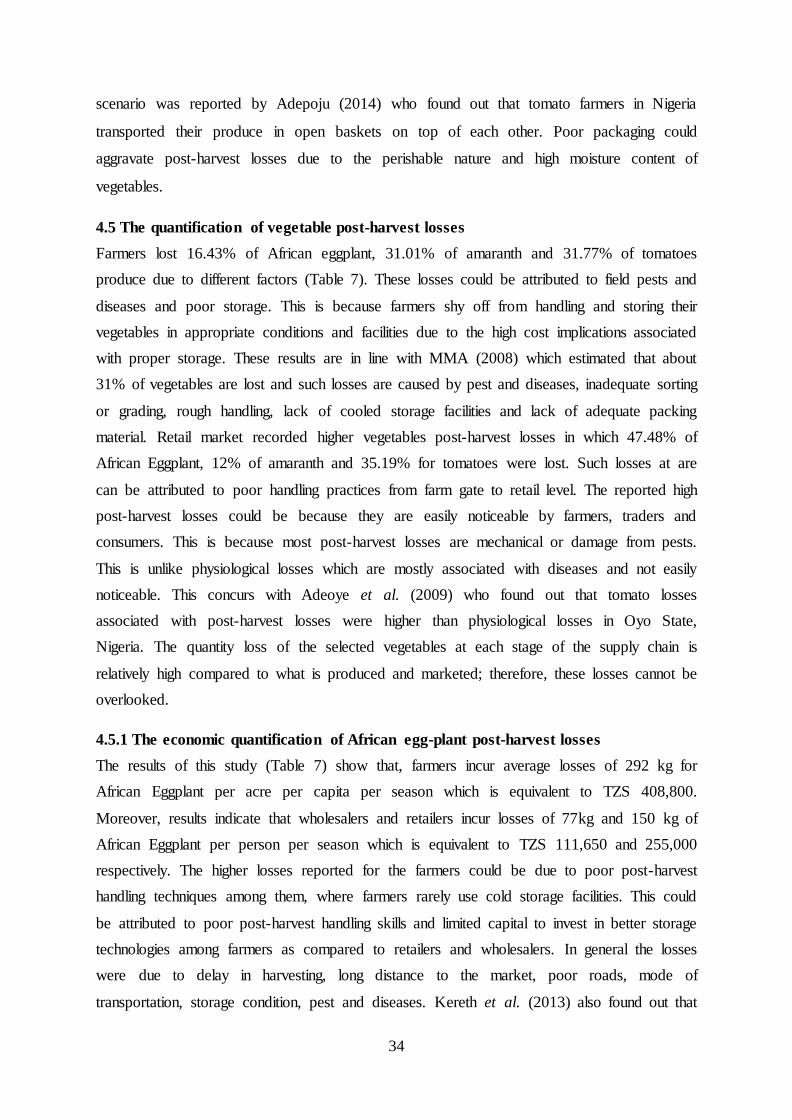
34
scenario was reported by Adepoju (2014) who found out that tomato farmers in Nigeria
transported their produce in open baskets on top of each other. Poor packaging could
aggravate post-harvest losses due to the perishable nature and high moisture content of
vegetables.
4.5 The quantification of vegetable post-harvest losses
Farmers lost 16.43% of African eggplant, 31.01% of amaranth and 31.77% of tomatoes
produce due to different factors (Table 7). These losses could be attributed to field pests and
diseases and poor storage. This is because farmers shy off from handling and storing their
vegetables in appropriate conditions and facilities due to the high cost implications associated
with proper storage. These results are in line with MMA (2008) which estimated that about
31% of vegetables are lost and such losses are caused by pest and diseases, inadequate sorting
or grading, rough handling, lack of cooled storage facilities and lack of adequate packing
material. Retail market recorded higher vegetables post-harvest losses in which 47.48% of
African Eggplant, 12% of amaranth and 35.19% for tomatoes were lost. Such losses at are
can be attributed to poor handling practices from farm gate to retail level. The reported high
post-harvest losses could be because they are easily noticeable by farmers, traders and
consumers. This is because most post-harvest losses are mechanical or damage from pests.
This is unlike physiological losses which are mostly associated with diseases and not easily
noticeable. This concurs with Adeoye et al. (2009) who found out that tomato losses
associated with post-harvest losses were higher than physiological losses in Oyo State,
Nigeria. The quantity loss of the selected vegetables at each stage of the supply chain is
relatively high compared to what is produced and marketed; therefore, these losses cannot be
overlooked.
4.5.1 The economic quantification of African egg-plant post-harvest losses
The results of this study (Table 7) show that, farmers incur average losses of 292 kg for
African Eggplant per acre per capita per season which is equivalent to TZS 408,800.
Moreover, results indicate that wholesalers and retailers incur losses of 77kg and 150 kg of
African Eggplant per person per season which is equivalent to TZS 111,650 and 255,000
respectively. The higher losses reported for the farmers could be due to poor post-harvest
handling techniques among them, where farmers rarely use cold storage facilities. This could
be attributed to poor post-harvest handling skills and limited capital to invest in better storage
technologies among farmers as compared to retailers and wholesalers. In general the losses
were due to delay in harvesting, long distance to the market, poor roads, mode of
transportation, storage condition, pest and diseases. Kereth et al. (2013) also found out that
35
rotting (microbial) and poor transportation infrastructure in Bagamoyo, Tanzania accounted
for the largest cause of post-harvest losses for horticultural products like fruits. The transport
losses in Bagamoyo were attributed by delays in delivery and mechanical damages of fruits
during transit. Wholesalers do not incur storage losses in African Eggplant as they transfer
the risk to retailers.

36
Table 7: The average amount (Kilogrammes) of African eggplant lost in the last season (year 2015/2016) and the cause of such losses
Farmers Wholesalers Retailers
Quantity
(kg)
Percent Value
(TZS)
Quantity
(kg)
Percent Value
(TZS)
Quantity
(kg)
Percent Value
(TZS)
Delay in Harvesting 102 34.93 142,800 27 35.06 39,150 30 19.51 45,000
Distance to the market 14 4.79 19,600 - - - - - -
Poor road 14 4.79 19,600 5 6.49 7,250 10 5.49 15,000
Mode of transportation 17 5.82 23,800 - - - - - -
Pest and diseases 100 34.25 140,000 45 58.44 65,250 90 60.98 135,000
Storage condition 46 15.75 64,400 - - - 20 14.02 30,000
Total 292 100.00 408,800 77 100.00 111,650 150 100.00 255,000
Note: Number of respondents = 200 farmers, 50 wholesalers and 50 retailers
Average price = TZS 1,400 farmers, TZS 1,450 wholesalers and TZS 1,500 retailers

37
4.5.2 The economic quantification of amaranth post-harvest losses
The results of this study (Table 8) show that on average, farmers incur losses of 363 kg of
Amaranth per acre per person which is equivalent to TZS 181,500. Also it was found that
wholesalers and retailers incur losses of 43 kg and 28 kg of Amaranth per season which is
equivalent to TZS 23,650 and 16,800 respectively. These losses are attributed to different
factors such as harvesting method, delay in harvesting, loading or off-loading, poor storage
condition, pest and diseases. During marketing, harvested Amaranth is stored by spreading on
polythene or plastic bags (viroba) in order to prevent it from contacting moisture from the
ground and in some cases amaranth is exposed to the cold at night. It was observed that
retailers lack storage facilities with controlled temperature which leads to lower market value
for the stored amaranth.
Most Amaranth traders sell it in an unpackaged form or in tied bundles which if not sold
quickly reduces its shelf-life. Adepoju (2014) also argued that with poor storage facilities,
poor packaging and inefficient mode of transportation, post-harvest losses in vegetables are
inevitable. For example, the market value of a bunch of leafy greens which is wilted is only
half of its original price (Kitinoja, 2010). Post-harvest losses in leaf vegetables are estimated
to be more than 30% and are generally caused by poor handling and storage condition
(Nyaura et al., 2014). An increase in temperature leads to water loss and respiration rates
increase, which leads to decline in quality of fresh produce and its market value.

38
Table 8: The average amount (Kilogrammes) of amaranth lost in the last season (year 2015/2016) and the cause of such losses
Farmers Wholesalers Retailers
Quantity
(kg)
Percent Value
(TZS)
Quantity
(kg)
Percent Value
(TZS)
Quantity
(kg)
Percent Value
(TZS)
Harvesting method 25 6.89 12,500 - - - - - -
Delay in Harvesting 229 63.09 114,500 35 81.40 19,250 7 25.00 4,200
Loading/Off loading 68 18.73 34,000 - - - - - -
Pest and diseases 25 6.89 12,500 8 18.60 4,400 14 50.00 8,400
Storage condition 15 4.13 7,500 - - - 7 25.00 4,200
Total 363 100.00 181,500 43 100.00 23,650 28 100.00 16,800
Note: Number of respondents = 200 farmers, 50 wholesalers and 50 retailers
Average price = TZS 500 farmers, TZS 550 wholesalers and TZS 600 retailers
39
4.5.3 The economic quantification of tomatoes post-harvest losses
Cultivation and selling of tomatoes is more dominant compared to other vegetables in the
study area. The study found out that 80% of farmers cultivated tomatoes while 88% and 96%
of wholesalers and retailers sold tomatoes (Table 9). Compared to African eggplant and
amaranth, tomato is one of the vegetables most susceptible to post-harvest losses. In relation
to post-harvest losses, the results show that about 1.8 tonnes of tomatoes were lost per acre
per season per person which is equivalent to TZS 918,500. Additionally, it was found that
about 0.4 and 0.5 tonnes are lost by wholesalers and retailers per capita per season and these
losses were equivalent to TZS 237,000 and TZS 468,000 at wholesale and at retail level. This
concurs with the findings by Sharma and Singh (2011) who found that vegetable post-harvest
losses were highest among farmers.
The losses were attributed to different factors such as poor harvesting method, delay in
harvesting, damages during loading or off-loading, long distance to the market, poor road
infrastructures, mode of transportation, storage condition, poor packaging materials, pest and
diseases. The results further show that delay in harvesting, pests and diseases were the major
contributing factors of postharvest losses at all levels of the supply chain. This is also in line
with the findings of Adepoju (2014) who concluded that lack of storage facilities, poor
transport networks and long distances to the markets magnified tomato post-harvest losses
faced by farmers in Osun State, Nigeria. Similar findings were reported by Adeoye et al.
(2009) who found that mechanical damages, physiological and pathological as being the
major causes of tomato losses in Oyo State, Nigeria.
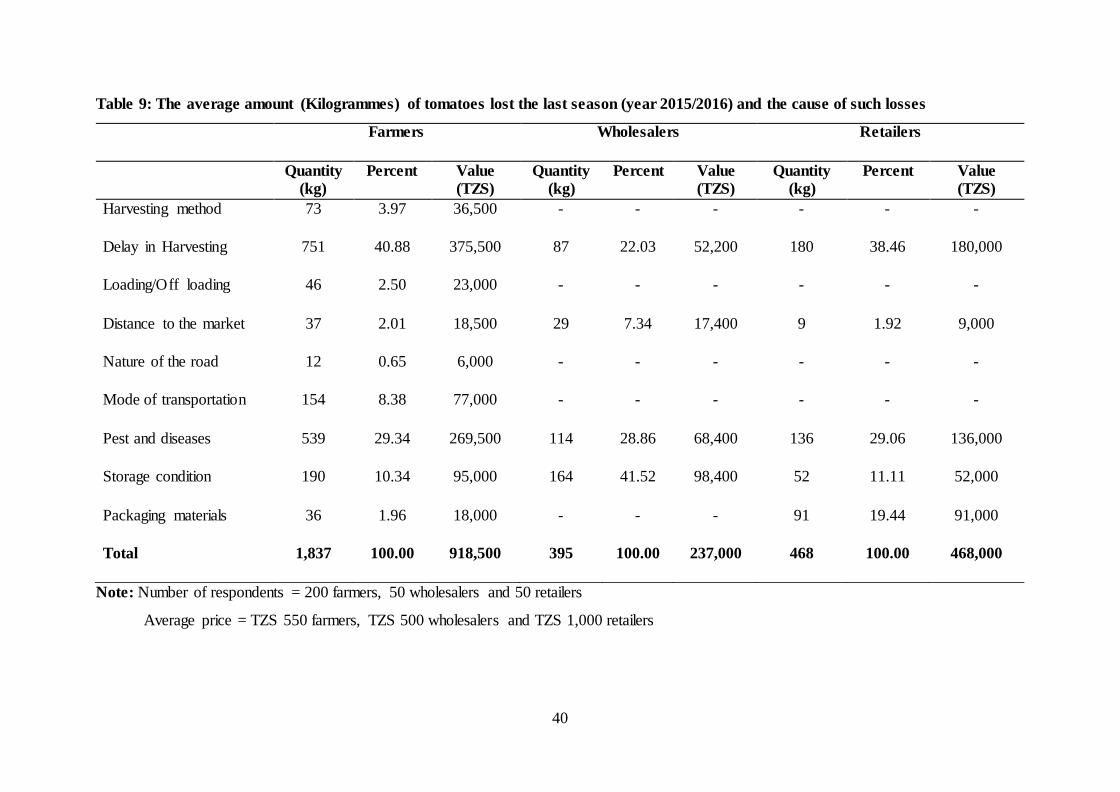
40
Table 9: The average amount (Kilogrammes) of tomatoes lost the last season (year 2015/2016) and the cause of such losses
Farmers Wholesalers Retailers
Quantity
(kg)
Percent Value
(TZS)
Quantity
(kg)
Percent Value
(TZS)
Quantity
(kg)
Percent Value
(TZS)
Harvesting method 73 3.97 36,500 - - - - - -
Delay in Harvesting 751 40.88 375,500 87 22.03 52,200 180 38.46 180,000
Loading/Off loading 46 2.50 23,000 - - - - - -
Distance to the market 37 2.01 18,500 29 7.34 17,400 9 1.92 9,000
Nature of the road 12 0.65 6,000 - - - - - -
Mode of transportation 154 8.38 77,000 - - - - - -
Pest and diseases 539 29.34 269,500 114 28.86 68,400 136 29.06 136,000
Storage condition 190 10.34 95,000 164 41.52 98,400 52 11.11 52,000
Packaging materials 36 1.96 18,000 - - - 91 19.44 91,000
Total 1,837 100.00 918,500 395 100.00 237,000 468 100.00 468,000
Note: Number of respondents = 200 farmers, 50 wholesalers and 50 retailers
Average price = TZS 550 farmers, TZS 500 wholesalers and TZS 1,000 retailers

41
The results of this study are also in line with Yeole and Curran (2016) who found that post-
harvest losses of tomatoes are due to lack of low cost cold storage facilities and improper
packaging techniques at farm level. Additionally, at farm level the post-harvest losses were
also due to mechanical damage to the produce during harvesting, packaging and
transportation. The main problem that was seen at the farm level was that farmers used
wooden crates for packaging and then transporting it to the nearest market to sell it directly to
consumers. These wooden crates had sharp edges as well as improper ventilation leading to
further post-harvest losses.
4.6 Principal causal factors contributing to selected vegetable post-harvest losses
The principle causal factors of African eggplant, amaranth and tomato post-harvest losses at
farm level, wholesale and retail was analysed using Log linear regression. The analysis was
done in different regression models for farmers, wholesalers and retailers. The dependent
variable in each of the regression models was the posited post-harvest loss expressed in
kilogrammes and converted to its monetary value (TZS) equivalent by multiplying the
quantity with the average market price. The value was logged and expressed as LnAfrPHL in
the model.
).......(&mod
exp
121110987
6543210
xivPackmatStorageDPTransRoadtypDistmrk
LoadingDharvHarvetnmFarmsizeFarmEduLnAfrPHL
The independent variables specified in the regression model include: education level of the
farmer, vegetable farming experience, farm size allocated for vegetable production, method
of harvesting, delay in harvesting, loading or off-loading, distance to the market, road nature
of the road, mode of transportation, pest and diseases, storage condition and packaging. The
model fit results for the three types of vegetables are as shown in Table 10, Table 11 and
Table 12.
4.6.1 Principal causal factors contributing to post-harvest losses in African eggplant
Pest and diseases is one of the principle causal factors leading to high post-harvest losses for
African eggplant for wholesalers, retailers and farmers at 1% significance level (Table 10).
Outbreak of pest and diseases increases post-harvest losses by 3, 6 and 7 percent per season
to farmers, wholesalers and retailers respectively. This shows that retailers and wholesalers
face significantly higher losses on African Eggplant compared to farmers. This could be

42
because most of the responsible pests and diseases attacking the vegetables during storage.
Therefore, this affects farmers to a lesser extent as most of them tend to sell immediately
after harvest leaving wholesalers and retailers to store for longer periods before selling to
their customers. Phomopsis blight was common in the last season in which it affected fruits
of eggplant, which began as sunken spots that eventually enlarged and became soft and
spongy. Pests and diseases could also magnify the losses as some remained active from when
the plant is still in farm until long after harvesting.
Table 10: Principal causal factors contributing to post-harvest losses of African
Eggplant
Farmers Wholesalers Retailers
LnAfrEPHL Coef. Std.
Err.
Coef. Std.
Err.
Coef. Std. Err.
Education 0.010 0.038 0.062 0.055 0.057 0.077
Experience -0.016* 0.011 0.000 0.019 -0.010 0.014
HH size 0.023 0.028 0.000 0.000 -0.001 0.000
Farm size 0.266 0.191 0.623*** 0.213 -0.142 0.374
Delay in harvesting /
selling
0.022*** 0.002 0.054*** 0.008 0.092*** 0.012
Distance to the market 0.004 0.011 0.006 0.015 0.044 0.057
Nature of the road 0.215 0.174 -0.076 0.269 - -
Mode of transportation 0.003 0.005 -0.061 0.274 0.123 0.220
Pest and diseases 0.031*** 0.003 0.059*** 0.009 0.069*** 0.007
Storage condition 0.208 0.242 -0.145 0.476 - -
Packaging materials 0.000 0.000 0.196 0.272 0.032 0.099
_constant -0.001 0.442 -0.335 0.780 -0.160 0.594
Farmers: Prob>F=0.000 R-square=0.6316 Adj R-square=0.61 N=200
Wholesalers: Prob>F=0.000 R-square=0.8388 Adj R-square=0.7921 N=50
Retailers: Prob>F=0.000 R-square=0.8914 Adj R-square=0.8523 N=50
***, *: Significant at 1% and 10% level, respectively
Delay in harvesting was another principle causal factor contributing to African Eggplant post-
harvest losses to farmers, wholesalers and retailers at 1% significance level (Table 10).
Losses attributed to delay in harvesting were least at farm level at about 2 percent per season
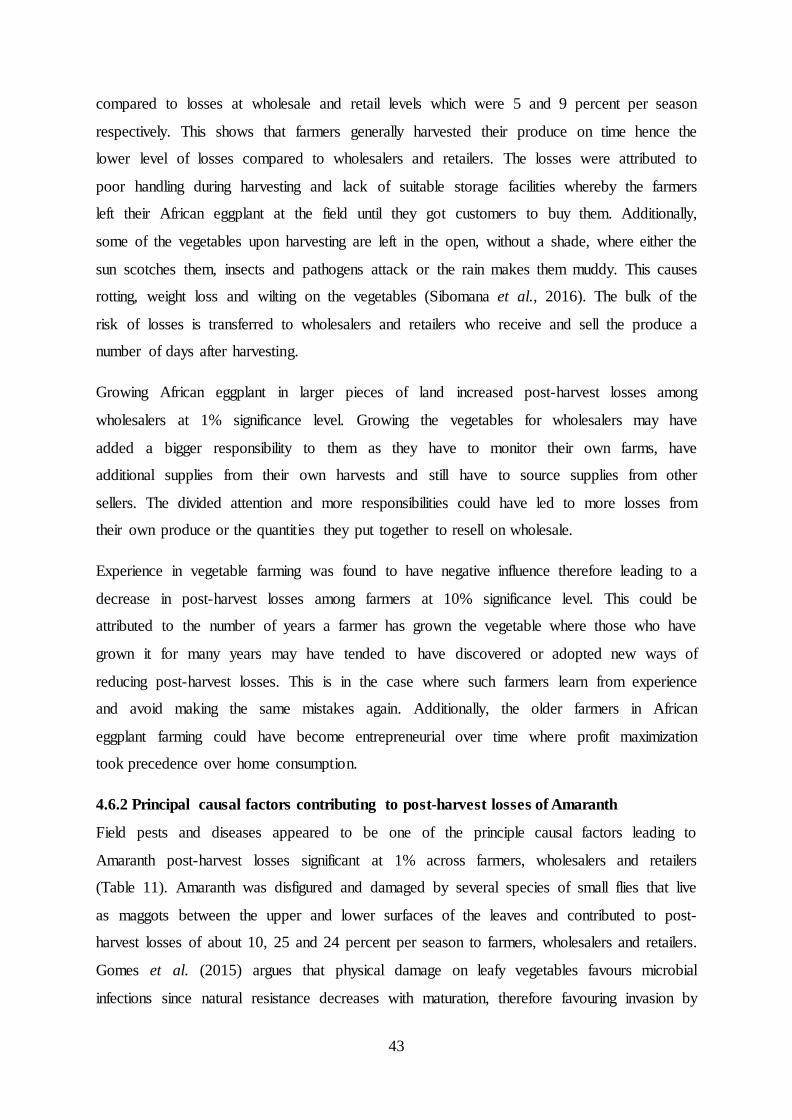
43
compared to losses at wholesale and retail levels which were 5 and 9 percent per season
respectively. This shows that farmers generally harvested their produce on time hence the
lower level of losses compared to wholesalers and retailers. The losses were attributed to
poor handling during harvesting and lack of suitable storage facilities whereby the farmers
left their African eggplant at the field until they got customers to buy them. Additionally,
some of the vegetables upon harvesting are left in the open, without a shade, where either the
sun scotches them, insects and pathogens attack or the rain makes them muddy. This causes
rotting, weight loss and wilting on the vegetables (Sibomana et al., 2016). The bulk of the
risk of losses is transferred to wholesalers and retailers who receive and sell the produce a
number of days after harvesting.
Growing African eggplant in larger pieces of land increased post-harvest losses among
wholesalers at 1% significance level. Growing the vegetables for wholesalers may have
added a bigger responsibility to them as they have to monitor their own farms, have
additional supplies from their own harvests and still have to source supplies from other
sellers. The divided attention and more responsibilities could have led to more losses from
their own produce or the quantities they put together to resell on wholesale.
Experience in vegetable farming was found to have negative influence therefore leading to a
decrease in post-harvest losses among farmers at 10% significance level. This could be
attributed to the number of years a farmer has grown the vegetable where those who have
grown it for many years may have tended to have discovered or adopted new ways of
reducing post-harvest losses. This is in the case where such farmers learn from experience
and avoid making the same mistakes again. Additionally, the older farmers in African
eggplant farming could have become entrepreneurial over time where profit maximization
took precedence over home consumption.
4.6.2 Principal causal factors contributing to post-harvest losses of Amaranth
Field pests and diseases appeared to be one of the principle causal factors leading to
Amaranth post-harvest losses significant at 1% across farmers, wholesalers and retailers
(Table 11). Amaranth was disfigured and damaged by several species of small flies that live
as maggots between the upper and lower surfaces of the leaves and contributed to post-
harvest losses of about 10, 25 and 24 percent per season to farmers, wholesalers and retailers.
Gomes et al. (2015) argues that physical damage on leafy vegetables favours microbial
infections since natural resistance decreases with maturation, therefore favouring invasion by

44
pathogens. The infected amaranth leaves thereafter become unattractive and unfit for human
consumption.
Table 11: Principal causal factors contributing to Amaranth post-harvest losses
Farmers Wholesalers Retailers
LnAmaPHL Coef. Std. Err. Coef. Std. Err. Coef. Std.
Err.
Education 0.022 0.032 -0.021 0.036 -0.035 0.055
Experience -0.007* 0.009 0.000 0.010 0.021 0.010
HH size -0.002 0.024 0.000 0.000 0.000 0.000
Farm size -0.203 0.165 0.130 0.113 0.064 0.261
Harvesting method -0.056 0.137 - - - -
Delay in harvesting/
selling
0.014*** 0.001 0.067*** 0.007 0.276* 0.138
Loading/Off loading -0.390 0.944 - - - -
Distance to the market -0.017 0.009 -0.002 0.008 -0.017 0.038
Nature of the road -0.228 0.148 0.008 0.159 - -
Mode of transportation -0.003 0.004 0.120 0.157 -0.227 0.158
Pest and diseases 0.108*** 0.013 0.252*** 0.029 0.241*** 0.028
Storage condition -0.032 0.208 -0.187 0.276 - -
Packaging materials 0.000 0.000 0.031 0.155 0.028 0.072
_constant 0.667** 0.378 0.285 0.479 0.251 0.447
Farmers: Prob>F=0.000 R-square=0.8029 Adj R-square=0.7458 N=200
Wholesalers: Prob>F=0.000 R-square=0.8646 Adj R-square=0.8254 N=50
Retailers: Prob>F=0.000 R-square=0.8172 Adj R-square=0.7514 N=50
***, **, *: Significant at 1%; 5% and 10% level, respectively
Delay in harvesting was also the other principle causal factor contributing to amaranth post-
harvest losses significant at 1% for farmers. Delay in harvesting contributed to losses of
about 1 percent per season at farm level. The losses were attributed to lack of cropping
calendar and poor timing of the market. Delays in harvesting led to moisture loss and wilting
of the vegetables leading to loss in quality while still in the field. On the other hand, delay in
selling was also a principle causal factor contributing to amaranth post-harvest losses
significant at 1% for wholesalers and 10% for retailers (Table 11). Delay in selling

45
contributed to losses of about 7 and 3 percent for wholesale and retail respectively. These
losses may be attributed to incidences where the sellers had to store the vegetables for a few
days before selling.
4.6.3 Principal causal factors contributing to post-harvest losses of tomatoes
Pest and diseases is the one of the principle causal factor leading to high post-harvest losses
significant at 1% to farmers and wholesalers and 5% to retailers (Table 12). Outbreak of pest
especial tomato leave miner (Tuta absoluta) increases post-harvest losses by 3, 1 and 8
percent per season to farmers, wholesalers and retailers respectively. Tomato leaf miner can
cause 50-100% yield reduction on tomato crops and its presence may also limit the export of
the product to several destinations (Koppert, 2009). This concurs with Kereth et al. (2013)
who found out that microbial (pest and diseases) significantly influenced post-harvest losses
especially during marketing of tomatoes.
Delay in harvesting was also another principle causal factor contributing to Tomato post-
harvest losses significant at 1% at farm level. Delay in harvesting contributed to losses of
about 3 percent per season per farmer. The delays in harvesting could be because farmers
tend to look for markets when the crop is already mature and therefore it ends up being
delayed further in the farm before harvest. At times, some farmers also tend to sell their crop
before maturity to tap into an immediate market demand or due to urgent need for cash.
Given that maturity at harvest is one of the most important factors that determine shelf life
and final vegetable quality. In a study of the tomato supply chain in Ethiopia Emana et al.
(2017) also found significant tomato losses being associated with delays in harvesting. This
concurs with Sharma and Singh (2011) who also concluded that tomatoes picked too early or
too late in their season are more susceptible to post-harvest physiological disorders leading to
irregular ripening and poor quality.
Higher losses are often associated with higher amount of harvest resulting from relative
bigger land size under production. As a result farmers with relatively bigger plots were more
likely to get more losses of about 46.09 kg per acre.

46
Table 12: Principal causal factors contributing to post-harvest losses in Tomato
Farmers Wholesalers Retailers
lnTomPHL Coef. Std.
Err.
Coef. Std.
Err.
Coef. Std. Err.
Education 0.028 0.066 -0.067 0.103 0.035 0.178
Experience 0.011 0.018 -0.021 0.036 -0.019 0.036
HH size -0.008 0.050 0.000 0.001 -0.001 0.001
Farm size 0.133 0.332 0.010 0.354 1.454 0.865
Harvesting method -0.133 0.287 - - - -
Delay in harvesting 0.03*** 0.001 0.005 0.007 0.008 0.006
Loading/Off loading -0.017 0.034 - - - -
Distance to the market 0.031 0.019 0.041 0.027 -0.046 0.130
Nature of the road -0.434 0.311 -0.711 0.513 - -
Mode of transportation -0.009 0.008 0.637 0.510 0.502 0.652
Pest and diseases 0.03*** 0.000 0.012*** 0.003 0.08** 0.003
Storage condition 0.718* 0.435 -1.226 0.925 - -
Packaging materials 0.000 0.000 0.270 0.509 0.215 0.247
_cons 2.590*** 0.801 4.102 1.468 1.960 1.402
Farmers: Prob>F=0.000 R-square=0.4425 Adj R-square=0.4036 N=200
Wholesalers: Prob>F=0.000 R-square=0.5836 Adj R-square=0.4631 N=50
Retailers: Prob>F=0.0027 R-square=0.5930 Adj R-square=0.4465 N=50
***, **, *: Significant at 1%; 5% and 10% level, respectively
Lack of storage facilities to control temperature on matured tomatoes increases tomatoes
post-harvest losses among farmers at 1% significance level. This could be because tomatoes
have a short shelf life at room temperature and worse if the temperature is higher. Lack of
awareness among farmers about the right temperatures to store tomatoes could also be a
contributing factor. In a review of post-harvest losses in tomatoes in Sub-Saharan Africa
(SSA) Sibomana et al. (2016) concluded that lack of awareness on required quality standards
aggravated post-harvest losses especially among smallholder farmers. Additionally, farmers,
retailers and wholesalers mostly used wooded crates for transport and storage during
marketing of tomatoes. Such crates could be rough and with spikes that pierce the tomatoes
causing physical damage to the tomatoes while also creating entry points for pathogens which

47
further damage the tomatoes. The damage while in the crates was aggravated where the
tomatoes were transported using motorbikes on rough roads. This shook the tomatoes and
scratched them further on the rough internal surface of the wooded boxes used during transit.
To sum up, tomatoes had the highest post-harvest losses (18370kg) compared to African egg-
plant (395kg) and amaranth (468kg). This could be attributed to its delicate coat cover, high
water content, short shelf-life and poor handling during transport and marketing. Similar
findings were reported by Sharma and Singh (2011) where tomatoes were reported to have
the highest post-harvest losses compared to other vegetables like capsicum, French beans,
cabbages, onions, potato and chilly in Uttarakhand, India. Pest and diseases, and delays in
harvesting accounted for the greatest post-harvest losses in the studied vegetables. This
concurs with Gomes et al.(2015) and Emana et al. (2017) who also concluded that pest and
diseases aggravated post-harvest losses in vegetables and fruits which occurred during
transportation, storage and marketing.
4.7 Factors influencing farmers’ choice of post-harvest handling practices and
techniques for African eggplant, amaranth and tomato
Table 13 presents results of the Multivariate Probit Model on the factors influencing farmers’
choice of post-harvest handling techniques and practices. The dependent variable used was
farmers’ post-harvest handling techniques which was categorical in nature. The categories of
these techniques were: maturity indices, shade, sorting or grading, washing or hygiene and
cooling. The independent variables used in the model were age (years), education levels
(years), farming experience in vegetable production (years), farm size allocated to vegetable
cultivation (acres), quantity of vegetable harvested (kg), household income, vegetable price,
access to extension services on post-harvest losses, household size. The Wald Chi-square
value of 98.89 (P<0.01) showed that the likelihood ratio statistics are significant suggesting
that predicators included in the model were capable of jointly predicting and explaining
choice of post-harvest handling techniques and practice.
48
Table 13: Factors influencing farmers choice of post-harvest handling technique and practice for African eggplant, amaranth and
tomato
Maturity Indices Shade Sorting Washing/Hygiene Cooling
Coef. Std. Err. Coef. Std. Err. Coef. Std. Err. Coef. Std. Err. Coef. Std. Err.
Age -0.008 0.051 0.037 0.044 0.045 0.045 0.096 0.036 -0.026 0.047
Education Level 0.000 0.054 0.013** 0.045 0.030 0.043 -0.047 0.046 -0.093** 0.043
Experience -0.005 0.016 -0.005 0.015 0.012 0.014 0.018 0.015 0.005 0.014
Farm size 0.207 0.269 0.376* 0.220 0.499** 0.230 0.241 0.207 -0.235 0.243
Harvest Egg plant 0.000 0.000 0.000 0.000 0.000 0.000 0.000 0.000 0.000* 0.000
Harvest Amaranth 0.001* 0.000 0.000 0.000 0.001* 0.000 0.001* 0.000 0.001* 0.000
Harvest Tomato 0.001* 0.000 0.000 0.000 0.000 0.000 0.001* 0.000 0.000 0.000
Ln HH. income -0.252** 0.128 -0.355*** 0.099 -0.193** 0.090 -0.345*** 0.100 0.257** 0.116
HH. Size 0.016 0.040 -0.018 0.038 0.065 0.037 -0.047 0.031 0.035 0.036
Age square 0.000 0.001 0.000 0.001 0.000 0.001 -0.001 0.000 0.000 0.001
Extension 0.515** 0.218 0.395** 0.181 0.424** 0.177 0.304* 0.184 0.099 0.206
Constant 3.390* 1.764 3.237** 1.318 0.472 1.315 2.663* 1.414 -2.863* 1.708
Note: ***, **, *: Significant at 1%; 5% and 10% level, respectively
Multivariate probit (SML, # draws = 5); Number of respondent. = 200; Wald chi2(55) = 98.89;
Log likelihood = -364.19776; Prob > chi2 = 0.0003; Prob > chi2 = 0.0000

49
An increase in the level of education by one year reduces the probability of choosing cooling
as a post-harvest handling technique by 9.3% at 5% significance level. However, an increase
in the level of education by one year increases the probability of choosing shade as a post-
harvest handling technique by 1.3% at 5% significance level. This differs from an earlier
study by Okoruwa et al. (2009) who found out that a percentage increase in years of
education increased the odds of using local and modern storage techniques in post-harvest
produce management. The difference in findings could be because cooling requires higher
capital costs like freezers or refrigerated containers as compared to storing the vegetables
under shades. Therefore, even more educated farmers in Babati District opted to go for
shades due to the higher financial implications associated with cooling.
Increase in farm size by one acre increases the probability of adopting washing or hygiene as
a post-harvest handling technique and practice by 37.6% at 10% significance level. On the
other hand, one acre increase in farm size increases the probability of choosing sorting as a
post-harvest handling technique by 49.9% at 5% significance level. The possible explanation
for this could be because quantity harvested and variable cost increases with land size under
cultivation. Therefore, a farmer would prefer to minimize post-harvest losses in order to earn
more revenue. For a relatively larger land size under cultivation of a given vegetable, the
harvester would have to sort, collect and provide shade for the heaps of produce within and
outside the farm. This translates to more labour costs to handle more vegetables.
Quantity of vegetable harvested is also a significant determinant of the choice of post-harvest
handling techniques and practices. Increase in quantity of African eggplant, amaranth and
tomato harvested by one Kg increased the probability of adopting maturity indices, sorting or
grading, washing or hygiene and cooling by about 0.1% at 1% significance level. The results
reflect the important role quantities harvested plays in influencing farmers’ adoption
decisions. As quantities harvested increase, farmers increase the diversity of post-harvest
handling techniques they chose to adopt to preserve their produce. This shows that farmers
prefer to spread risks rather than relying on only one option especially when larger amounts
of returns from their vegetable or other agricultural enterprises are involved. The results
concur with the findings of Okoruwa et al. (2009) that increase in quantity of stored produce
had significant and positive influence on farmers’ choice of local storage techniques like
local cribs, platform, rhombus, roof and fireplace and semi-modern storage techniques like
ventilated cribs and improved rhombus in South-West Nigeria.

50
Decrease in the level of household income by one TZS reduced the probability adopting of
maturity indices by 25.2%, shade by 35.5% and washing or hygiene by 19.3% post-harvest
handling techniques and practices at 5%, 1% and 1% significance levels respectively. The
results imply that maturity indices, shade and washing or hygiene are more common among
the low income earners. This implies that as income increases the farmers tend to shift to
other advanced practices like cooling, sorting and grading which they consider more effective
even though they have to spend more money on these practices. This is in line with Ali
(2012) who concluded that more income and use of credit influenced farmers to adopt
modern post-harvest handling techniques in vegetable value chain. Kiaya (2014) argues that
harvesting and storage hygiene is a simple practice with minor financial implications for
smallholder farmers with limited post-harvest handling options to choose from due to
financial constraints. Similarly, Muzari et al. (2012) concluded that farmers’ and other actors
in agricultural marketing chains income levels influence adoption of agricultural technologies
since most technologies require money to adopt and they divert a considerable amount of
income from other important household activities.
The results indicate that increase in farmers’ access to extension services increased the
probability of adopting maturity indices, shade and sorting as post-harvest handling techniques
and practices by 51.5%, 39.5% and 42.4% respectively at 5% significance level while
probability of adopting washing or hygiene increased by 30.4% at 10% significance level.
This implies that, for farmers to choose either to adopt maturity indices, shade, sorting or to
wash their after harvesting and storage of their produce, they require appropriate training to
acquire the right skills and regular reminding of the importance of doing so. Mariano et al.
(2012) underscore the importance of extension by concluding that extension related variables
like attendance to trainings, access to extension workers and participation in on-farm
demonstrations had the highest impact on technology adoption in agricultural related
activities.
Generally, this study concurs with Kiaya (2014) that there are a number of different
technologies that that can easily be adopted by farmers and market participants to reduce
post-harvest losses. Post-harvest handling techniques such as maturity indices to identify
proper harvesting time, improved containers to protect produce from damage during handling
and transportation, use of shade and sorting or grading to enhance the shelf-life and market
value were generally practiced locally. In line with the finding, Kiaya (2014) recommended

51
handling, packaging and transportation practices that reduce mechanical damage and enhance
shelf-life of fruits and vegetables. Sanitation and maintaining good hygiene was practiced
during harvesting and storage to maintain produce quality. This concurs with Waliyar et al.
(2015) who recommended field and storage sanitation as a good agricultural practice.
This study found out that decision of washing vegetables was influenced by household
income, land size allocated for vegetable production, access to extension services and
quantity of vegetables harvested. On the other hand, the choice of using shades was
influenced by education level of the farmer, household income and quantity of vegetables
harvested. The choice maturity indices were influenced by household income and quantity of
vegetables harvested. Moreover, the choice of cooling during storage was influenced by
education level of the farmer and quantity harvested while sorting or grading is only
influenced by the quantity harvested.
The results underscore the complementarity of diverse post-harvest handling techniques and
practices used by farmers and actors in food supply chains. They also suggest diversification
practices common among smallholder farmers mainly as a measure to spread risks and lower
costs. Beckles (2012) noted that farmers and other actors in vegetable marketing chains
choose a given post-harvest handling technique mainly to reduce losses and lengthen shelf-
life and not necessary to improve taste. Oparinde et al. (2016) also adds that farmers choose a
particular pot-harvest handling technique based on its efficiency and ability to enhance a
crop’s shelf-life. Similarly, the post-harvest handling choices identified in Babati, Tanzania
were mainly helped reduce vegetable losses and lengthen shelf-life.

52
CHAPTER FIVE
SUMMARY, CONCLUSIONS AND RECOMMENDATIONS
5.1 Summary
Post-harvest losses in selected vegetables were estimated to constitute up to 40% of the
harvest. The economic postharvest losses incurred per individual per season for Egg-plant
were TZS 408,800, TZS 111,650 and TZS 255,000; Amaranth TZS 181,500, TZS 23,650
and TZS 16,800 and Tomatoes TZS 918,500, TZS 237,000 and TZS 182,100 for farmers,
retailers and wholesalers respectively. These losses are not only significant but also troubling
to the vegetable supply chain actors. Given low output from smallholder farmers, the losses
tend to exacerbate the problem of low agro-incomes. Generally, post-harvest loses were
linked to a weak commercial orientation especially among the farmers whose marketable
surplus was little. Additionally, there was a low use of appropriate storage facilities across the
vegetable supply chain.
5.2 Conclusion
1. Retailers recorded higher proportion of vegetables post-harvest losses compared to
farmers and wholesalers.
2. The post-harvest losses were significantly intensified by delays in harvesting, pest and
diseases at farm level. While delay in selling and field pest were the significant causes of
vegetable post-harvest losses at retail and wholesale levels.
3. Quantity harvested, education level and access to extension services had significant
positive influence on choice of post-harvest handling techniques while household income
and farm-size had significant negative influence.
5.3 Recommendations
1. Facilitate access to equipped storage facilities among the supply chain actors.
2. There is need for training to farmers on timely harvesting, and field pest and diseases
control measures.
3. Promote simple and cost-effective postharvest technologies among the supply chain
actors in order to enhance adoption among the traders and smallholder farmers who are
resource constrained and also lack relevant formal education.
53
5.4 Suggestions for further research
This study only focused on African eggplant, amaranth and tomatoes at farm level, wholesale
and retail despite the fact that there are many species of vegetables and several other
marketing nodes. Further studies can be conducted on other vegetables and marketing nodes
not covered in this research. Future studies can also consider cost-benefit analysis of the
existing post-harvest technologies through determining cost effectiveness and scale-
appropriateness at each locale and crop.

54
REFERENCES
Abass A. B., Ndunguru G., Mamiro P., Alenkhe B., Mlingi N. and Bekunda M. (2014). Post-
harvest food losses in a maize-based farming system of Semi-arid Savannah area of
Tanzania. Journal of Stored Products Research, 57, 49–57.
Adeoye, I. B., Odeleye, O. M., Babalola, S. O., and Afolayan, S. O. (2009). Economic
Analysis of Tomato Losses in Ibadan Metropolis, Oyo State, Nigeria. African
Journal of Basic & Applied Sciences, 1(5-6), 87-92.
Adepoju A. O. (2014). Post-harvest losses and welfare of tomato farmers in Ogbomosho,
Osun state, Nigeria. Journal of Stored Products and Post-harvest Research, 5 (2), 8-
13.
Afari-Sefa, V., Rajendran, S., Kessy, R. F., Karanja, D. K., Musebe, R., Samali, S., and
Makaranga, M. (2016). Impact of nutritional perceptions of traditional African
vegetables on farm household production decisions: a case study of smallholders in
Tanzania. Experimental Agriculture, 52(2), 300-313.
Afari-Sefa, V., Tenkouano, A., Ojiewo, C. O., Keatinge, J. D. H. and Hughes, J. d’A. (2012).
Vegetable breeding in Africa: constraints, complexity and contributions toward
achieving food and nutritional security. Food Security, 4(1), 115–127.
Affognon H., Mutungi, B. C., Sanginga P. and Borgemeister A, D. C., (2015). Unpacking
Post-harvest losses in Sub-Saharan Africa: A Meta-Analysis. World Development,
66, 49–68.
Ahmed U. I., Ying L., Mushtaq K. and Bashir M. K. (2015). An econometric estimation of
post-harvest losses of Kinnow in Pakistan, International Journal of Economics,
Commerce and Management, United Kingdom III (5).
Ali, J. (2012). Factors Influencing Adoption of Post-harvest Practices in Vegetables.
International Journal of Vegetable Science, 18(1).
Anderson, J., Marita, C. and Musiime, D. (2016). National Survey and Segmentation of
Smallholder Households in Tanzania: Understanding Their Demand for Financial,
Agricultural, and Digital Solutions. Consultative Group to Assist to the Poor
[CGAP].

55
Ansah, I. G. and Tetteh, B. K. (2016). Determinants of Yam Post-harvest Management in the
Zabzugu District of Northern Ghana. Advances in Agriculture, 2016.
APO and FAO (2006). Post-harvest management of fruits and vegetables in the Asia-Pacific
region. Available online at: http://www.apo-tokyo.org/00e-books/AG-18_Post-
harvest/AG-18_Post-harvest.pdf Accessed May 29, 2015.
Aramyan L. H. and Gogh J. B. (2014). Reducing post-harvest food losses in developing
economies by using a Network of Excellence as an intervention tool, A paper
presented at 2014 IFAMA and CCA Food and Agribusiness World Forum ‘People
Feed the World’ in Cape Town, South Africa.
Aulakh A., Regmi A., Fulton J. and Alexander C. (2013). Estimating Post-Harvest Food
Losses: Developing a Consistent Global Estimation Framework, Selected Poster
prepared for presentation at the Agricultural & Applied Economics Association’s
2013 AAEA & CAES Joint Annual Meeting, Washington, DC.
Bachmann J. and Earles R. (2000). Post-harvest Handling of Fruits And Vegetables,
Appropriate Technology Transfer for Rural Areas.
Bartz, J. A. and Brecht, J. K. (2002).Post-harvest physiology and pathology of vegetables, 2nd
ed. Marcel Dekker, New York.
Basavaraja, H., Mahajanashetti S. B. and Udagatti N. C. (2007). Economic Analysis of Post-
harvest Losses in Food Grains in India: A Case Study of Karnataka. Agricultural
Economics Research Review, 20, 117-126.
Beckles, D. M. (2012). Factors affecting the post-harvest soluble solids and sugar content of
tomato (Solanum lycopersicum L.) fruit. Post-harvest Biology and Technology,
63(1), 129-140.
Botlhoko, G. J. and Oladele O. I. (2013). Factors Affecting Farmers Participation in
Agricultural projects in Ngaka Modiri Molema District North West Province, South
Africa. Journal of Human Ecology, 41(3), 201-206.
Chivenge P., Mabhaudhi T., Modi A. T. and Mafongoya P., (2015). The Potential Role of
Neglected and Under-utilized Crop Species as Future Crops under Water Scarce
56
Conditions in Sub-Saharan Africa. International Journal of Environmental Research
and Public Health ISSN 1660-4601.
Conteh, A. M., Yan, X. and Moiwo, P. J. (2015). The determinants of grain storage
technology adoption in Sierra Leone. Cahiers Agricultures, 24, 47-55.
Covarrubias K., Nsiima L. and Zezza A. (2012). Livestock and livelihoods in rural Tanzania
A descriptive analysis of the 2009 National Panel Survey, Joint paper of the World
Bank, FAO, AU-IBAR, ILRI and the Tanzania Ministry of Livestock and Fisheries
Development with support from the Gates Foundation. Available online at:
http://siteresources.worldbank.org/INTSURAGRI/Resources/7420178129425903827
6/Livestock_Livelihoods_Tanzania.pdf Accessed July 6, 2016
Dolan, C. and Humphrey, J. (2000). Governance and Trade in Fresh Vegetables: The Impact
of UK Supermarkets on the African Horticulture Industry. Journal of Development
Studies, 37(2), 147-176.
Egyir I., Sarpong D. B. and Obeng-Ofori D. (2011). Final report of M & E System for Post-
harvest Losses, Policy Planning, Monitoring and Evaluation Directorate, Ministry Of
food and Agriculture, Ghana.
Emana, B., Afari-Sefa, V., Nenguwo, N., Ayana, A., Kebede, D. and Mohammed, H. (2017).
Characterization of pre- and post-harvest losses of tomato supply chain in Ethiopia.
Agriculture & Food Security, 6(3).
FAO. (2003). Rise of Supermarkets across Africa Threatens Small Farmers: Opportunities
and Challenges in a Changing Market, website accessed May 27, 2015.
FAO. (2011). Global food losses and food waste, FAO, Rome.
FAO. (2015). The economic lives of smallholder farmers: An analysis based on household
data from nine countries. Rome: Food and Agriculture Organization of the United
Nations.
Gomes, A. A., Queiroz, M. V. and Pereira, O. L. (2015). Mycofumigation for the Biological
Control of Post-Harvest Diseases in Fruits and Vegetables: A Review. Austin Journal
of Biotechnology & Bioengineering, 2(4).

57
Hillbur P. (2013). The Africa RISING research sites in Tanzania Opportunities and
challenges to sustainable intensification and institutional innovation. International
Institute of Tropical Agriculture (IITA). Available online at: http://www.africa-
rising.net/ Accessed July 15, 2016.
Hodges, R. J., Buzby, J. C. and Bennett, B. (2011). Post-harvest losses and waste in
developed and less developed countries: opportunities to improve resource use.
Journal of Agricultural Science, 149, 37–45.
Humble S. and Reneby A. (2014). Post-harvest losses in fruit supply chains – A case study of
mango and avocado in Ethiopia. Swedish University of Agricultural sciences.
Published Thesis.
IFAD (2015). Investing in rural people in the United Republic of Tanzania, Available online
at: http://www.ifad.org/operations/projects/regions/pf/factsheets/tanzania. Accessed
January 29, 2016.
Jaffee, S. and Gordon, P. (1993). Exporting High-Value Food Commodities.
Jaffee, S. and Morton, J. (1995). Marketing Africa’s high value foods: Comparative
experiences of an emergent private sector. World Bank.
Kader, A. A., and Rolle, R. S. (2004). The role of post-harvest management in assuring the
quality and safety of horticultural produce (Vol. 152). Food & Agriculture Org..
Kader, A. A. (2005). Increasing food availability by reducing post-harvest losses of fresh
produce. Acta Horticulturae, 682, 2169-2176.
Kader, A. A. (2010). Handling of horticultural perishables in developing vs. developed
countries. Acta Horticulturae, 877, 121–126.
Kamarulzaman N. H., Kwami J. and Kenobi M. (2014). Conceptual Framework for
Estimating Post-harvest Losses in Food Supply Chains: the Case of Plantain Fruits in
Nigeria. International Journal of Business and Economics Research. Special Issue:
Supply Chain Management: Its Theory and Applications. 3 (6-1), 31-37.
Keller G. B. (2004). African nightshade, eggplant, spider flower et al. production and
consumption of traditional vegetables in Tanzania from the farmer’s point of view.
58
Kereth, G. A., Lyimo, M., Mbwana, H. A., Mong, R. J. and Ruhembe, C. C. (2013).
Assessment of Post-harvest Handling Practices: Knowledge and Losses of Fruits in
Bagamoyo District of Tanzania. Food Science and Quality Management, 11.
Kiaya, V. (2014). Technical paper on Post-Harvest Losses: Post-Harvest Losses and
Strategies to Reduce Them. Action Contre la Faim (ACF).
Kitinoja L. (2013). Use of cold chains for reducing food losses in developing countries The
Post-harvest Education Foundation (PEF) White Paper No. 13-03.
Kitinoja L. and AlHassan H.Y. (2012), Identification of Appropriate Post-harvest
Technologies for Small Scale Horticultural Farmers and Marketers in Sub-Saharan
Africa and South Asia – Part 1. Post-harvest Losses and Quality Assessments, Acta
Horticulturae, 934.
Kitinoja, L. (2013). Reducing Food Losses and Waste: Post-harvest Workshop in Tanzania.
The Post-harvest Education Foundation Project. Available online at:
http://www.indiegogo.com/projects/reducing-food-losses-waste-post-harvest-
workshop-in-tanzania. Accessed May 20, 2015.
Lam N. D. (2002). Post-harvest research and development in Vietnam, raining and
International Cooperation Division, Viet Nam Institute of Agricultural Engineering
and Post-Harvest Technology.
Löfstrand, F. (2005). Conservation Agriculture in Babati District, Tanzania. Impact of
conservation agriculture for small scale farmers and methods for increasing soil
fertility. Thesis 145:2005, Department of Soil Science, SLU, Uppsala, Sweden.
Maheshwar, C. and Chanakya, T. S. (2006). Post-harvest losses due to gaps in cold chain in
India - a solution. Acta Horticulturae, 712, 777-783.
Mariano, M. J., Villano, R., and Fleming, E. (2012). Factors influencing farmers’ adoption of
modern rice technologies and good management practices in the Philippines.
Agricultural Systems, 110, 41–53.
59
Mashindano O., Kazi V., Mashauri S. and Baregu S. (2013). Taping Export Opportunities for
Horticulture Products in Tanzania: Do We Have Supporting Policies and Institutional
Frameworks?, ICBE-RF Research Report N0. 65/13.
Ministry of Agriculture Food Security and Cooperatives (2012). Integrated Policy Approach
to Commercializing Smallholder Maize Production, FAO, Regional Workshop,
Nairobi, Kenya.
Ministry of Industry, Trade and Marketing (2008). Agricultural Market Policy, Dar Es
Salaam.
MMA (2008). High Value and Fresh Vegetables for Local Market Sub-Sector Analysis.
Tanzania, Study commissioned by small and medium enterprise competitiveness
facility.
Montenegro L. V., Puig A. B. and Coque J. M. A. (2014). Multi-Criteria Methodology: AHP
and Fuzzy Logic in the Selection of Post-Harvest Technology for Smallholder Cocoa
Production. International Food and Agribusiness Management Review, 17(2).
Muzari, W., Gatsi, W., and Muvhunzi, S. (2012). The Impacts of Technology Adoption on
Smallholder Agricultural Productivity in Sub-Saharan Africa: A Review. Journal of
Sustainable Development, 5(8).
Mwebaze, P., and Mugisha, J. (2011). Adoption, utilization and economic impacts of
improved post-harvest technologies in maize production in Kapchorwa District,
Uganda. International Journal of Post-harvest Technology and Innovation, 2(3),
301–327.
Ochieng, J., Afari-Sefa, V., Karanja, D., Kessy, R., Rajendran, S. and Samali, S. (2016). How
promoting consumption of traditional African vegetables affects household nutrition
security in Tanzania. Renewable Agriculture and Food Systems, 1-11.
Okoruwa, V. O., Ojo, O. A., Akintola, C. M., Ologhobo, A. D., and Ewete, F. K. (2009).
Post-harvest grain management storage techniques and pesticides use by farmers in
South-West Nigeria.Journal of Economics and Rural Development, 18(1), 53-72.

60
Oparinde, L. O., Otitoju, M. A., and Olarinre, A. A. (2016). Post-harvest Storage Losses in
Rice: A Study of Ekiti State, Nigeria. Journal of Scientific Research & Reports,
12(4), 1-9.
Porter S. D. and Reay D. S. (2015). Addressing food supply chain and consumption
inefficiencies: potential for climate change mitigation, Springer-Verlag Berlin
Heidelberg.
Rembold, F., Hodgex, R., Bernard, M., Knipchild , H., and Leo, O. (2011). The African Post-
harvest Losses Information System (APHLIS). Luxemburg: JRC Scientific and
Technical Reports.
Robinson, D. S. (1990). Food biochemistry and nutritional value. Longman scientific and
technical publisher, New York. USA.
Salami A., Kamara, A. B., and Brixiova Z. (2010). Smallholder Agriculture in East Africa:
Trends, Constraints and Opportunities, Working Papers Series N° 105 African
Development Bank, Tunis, Tunisia.
Sanga A. and Mgimba C. (2016). An Analysis of constraints that affect Smallholder Farmers
in the Marketing of Tomatoes in Mbeya Urban and Peri-urban, Tanzania. Imperial
journal of Interdisciplinary Research. 2. Available online at:
http://www.onlinejournal.in/ Accessed June 7, 2016
Segrè A., Falasconi L., Politano A. and Vittuari M. (2014). Global Initiative on Food Loss
and Waste Reduction, FAO, Rome.
Sharma, G., and Singh, S. P. (2011). Economic Analysis of Post-harvest Losses in Marketing
of Vegetables in Uttarakhand. Agricultural Economics Research Review, 24, 309-
315.
Sibomana, M. S., Workneh, T. S. and Audain, K. (2016). A review of post-harvest handling
and losses in the fresh tomato supply chain: a focus on Sub-Saharan Africa. Food
Science, 8, 389–404.
Small and Medium Enterprise Competitiveness Facility [SCF]. (2008). Fresh Fruit &
Vegetable Sub Sector / Value Chain Analysis Tanzania. SCF.

61
Sudheer K.P. and Indira V. (2007). Post-Harvest Technology of Horticultural Crops,
Horticulture Science Serie, NewYork 7.
Tanzania Horticultural Association (2011). Horticulture Value chain in Tanzania. Available
online at: www.fao.org/horticulture/Tanzania Accessed July 10, 2016.
Tenkouano A. (2014). What went right? Factors Underlying Farmer Adoption of Improved
Vegetable, AVRDC The World Vegetable Center. Available online at:
www.avrdc.org Accessed July 13, 2016.
Tufa, A., Bekele, A., and Zemedu, L. (2014).Determinants of smallholder commercialization
of horticultural crops in Gemechis District, West Hararghe Zone, Ethiopia African
Journal of Agricultural Research, 9(3), 310-319.
Verma L. R. and Joshi V. K. (2000). Post-harvest Technology of Fruits and Vegetables:
Handling, Processing, Fermentation, and Waste Management, Volume 2. Indus
Publishing.
Waliyar, F., Osiru, M., Ntare, B. R., Kumar, V. K., Sudini, H., Traore, A., et al. (2015). Post-
harvest management of aflatoxin contamination in groundnut. World Mycotoxin
Journal, 8(2), 245-252.
Weighberger, K., Genova II, C. and Acedo, A. (2008). Quantifying post-harvest loss in
vegetable along the supply chain in Vietman, Cambodia and Laos, International
Journal of Post-harvest Technology and Innovation, 1(3), 288-297.
Weinberger K. and Lumpkin T. A. (2007). Diversification into Horticulture and Poverty
reduction: A research Agenda. World Development 35(8).
Weinberger, K. and J. Msuya. (2004). Indigenous vegetables in Tanzania: Significance
and Prospects. Technical Bulletin No. 31.Shanhua: AVRDC.
Weinberger, K. and Acedo, A.L. Jr. (2009). Development and diffusion of vegetable post-
harvest and processing technologies in the Greater Mekong Subregion of Asia.
Presented in FAO-IAAE Workshop on Innovative Policies and Institutions to
Support Agro-industries Development, Beijing, China.

62
World Bank, FAO and NRI. (2011). Missing Food: the Case of Post-harvest Grain Losses in
Sub-Saharan Africa Economic Sector Work Report No. 60371-AFR World Bank,
Washington, DC.
Yeole S. and Curran T. P. (2016), Investigation Of Post-Harvest Losses In The Tomato
Supply Chain In The Nashik District Of India,UCD School of Biosystems and Food
Engineering, University College Dublin, Belfield, Dublin 4 Ireland.
Zoss M. (2009). Vegetable value chains in Northern Tanzania: Modes of governance,
collective action and facilitators’ interventions, Agri-Environmental and Agri-Food
Economic Group, ETH Zurich.

63
APPENDIX
Questionnaires
QUESTIONNAIRE FOR ECONOMIC COST QUANTIFICATION OF SELECTED
VEGETABLES POSTHARVEST LOSSES IN BABATI DISTRICT TANZANIA
(farmers)
Questionnaire Number
Enumerator name: ___________________________ Date: ________________________________
A1 Name of the respondent:
A2 Tel. no:
A3 District: BABATI
A4 Town/Village: ____________ Gallapo = 1; Matufa = 2; Bermi = 3;
Seloto = 4
A5 Sex of household head? _____ Female = 0; Male = 1
A6
Type of the household ____
1=Nuclear, 2=Extended, 3=
Polygamous,
4=De jure female headed (widow,
never married, divorced),
5=De facto female headed
(husband
absent),
6= not yet married males;
999= Do not know/Missing
A7
A8
A9
A10
A11
Demographic data respondent:
Position of respondent: _________
Sex: ______
Age (years): ______
Educational Level (years): ________
Farming Experience in Veg. Production (years) ______
1= H/Head ; 2= Wife;
3= Child; 4=Relative
0 = Female 1 = Male;
A12
Marital Status _______
1= Married 2 = Single 3 =
Divorced 4 = Separated
5.Widowed

64
A13
Major Occupation ______
1= Farming 2=Salaried
Employee 3= Hired worker
A14
A15
A16
A17
A18
If there is a partner in the household, fill out:
Position of respondent: _________
Sex: ______
Age (years): ______
Educational Level (years): ________
Farming Experience in Veg. Production (years) _____
1= H/Head ; 2= Wife;
3= Child; 4=Relative
0 = Female 1 = Male;
A19 Marital Status _______ 1= Married 2 = Single
3 = Divorced 4 = Separated
A20
Major Occupation ______
1= Farming 2=Salaried
Employee 3= Hired worker
A21
A22
A23
A25
What is the household size and gender composition?
Total: _____
Men (adult): ______
Women (Adult): ______
Children (under 18) ______
A26
A27
A28
What is the household’s age structure?
0 – under 18 years: _______
18 - 60 years: _______
Above 60: ________
A29
A30
A31
What is the household’s average income category per
month?
Total: ______
Husband: ______
Wife: _______
Other: _______
(if other please specify): …………………….
B: VEGETABLE PRODUCTION AND FARMING DECISION
1= Making Profits
2 = Support the family;

65
B1
What is your major objective in vegetable production?
(tick the appropriate one): _____
3 = Reduce risk of hunger;
4 = As a way of life;
5 = Have no other option (could
abandon farming) ;
6 = Others
999 = I don’t know/missing
If other, please specify: _______________________
B2 What is your total land endowment? _________acres. 999 = I don’t know/missing
B3 What farm size allocated to vegetable cultivation?
______acres.
999 = I don’t know/missing
B4 How is that land owned? _________ 1= Owned ; 2= Rented ;
3=Borrowed; 999 =I don’t
know/Missing
B5
B6
B7
B8
B9
B10
B11
B12
B13
Who in the household decides on;
Land use decision? ___________
Production decision? ___________________
Produces the vegetable? (actively works on farm)___
Income from vegetable production? _____________
Utilisation of vegetable produce? ____________
How the vegetable produce is stored? __________
How the vegetable produce is marketed? _________
In charge of the timing of the marketing? _________
Carrying out the actual selling of produce? ________
1 = Husband;
2 = Wife;
3= Both (Husband and Wife)
4 = Husband, Wife and Children
999 = I don’t know/ Missing
B14
B15
B16
B17
What is the division of responsibility in African
Eggplant; Production: ___________
Other, please specify:___________
Harvesting: ___________
Other, please specify: __________
Post-harvest handling: ____________
Other, please specify: ___________
Marketing: ___________
Other, please specify: __________
1 = Husband;
2 = Wife;
3= Both
4 = Others
999 = I don’t know/ Missing
B18
What is the division of responsibility in Amaranth;
Production: ___________

66
B19
B20
B21
Other, please specify:___________
Harvesting: ___________
Other, please specify: __________
Post-harvest handling: ____________
Other, please specify: ___________
Marketing: ___________
Other, please specify: __________
1 = Husband;
2 = Wife;
3= Both
4 = Other
999 = I don’t know/ Missing
B22
B23
B24
B25
What is the division of responsibility in Tomatoes;
Production: ___________
Other, please specify:___________
Harvesting: ___________
Other, please specify: __________
Post-harvest handling: ____________
Other, please specify: ___________
Marketing: ___________
Other, please specify: __________
1 = Husband;
2 = Wife;
3= Both
4 = Other
999 = I don’t know/ Missing
B26
B27
B28
Does the household have the access of extension
services in vegetable:
Production: ________
Post-harvest handling: _______
Marketing: _______
0 = No 1 = Yes
B29
B30
B31
Who in the household have the access to extension
services in vegetable
Production: _____________
Post-harvest handling: _______________
Marketing: _______________
1 = Husband; 2 = Wife
3 = Both (Husband and Wife)
4 = Relatives
999 = I don’t know/ Missing
B32
B33
B34
What type of seed did you plant at the last season?
African Eggplant: _____________
Amaranth: ____________
Tomatoes: ____________
1 = Improved; 2 = Not improved
B35
B36
B37
How much (in average) did you harvest per
season?
African Eggplant; ___________Kg
Amaranth; ________________Kg
Tomatoes; ______________Kg
B38
B39
B40
How much did you sell per season?
African Eggplant; ___________Kg
Amaranth; ________________Kg
Tomatoes; ______________Kg

67
B41
B42
B43
How many (Kg) of vegetable produce used
as a food?
African Eggplant:______________
Amaranths: ______________
Tomatoes: _______________
B44
B45
B46
What % used as food?
African
Eggplant:______________%
Amaranths: _____________%
Tomatoes: ______________%
B47
B48
B49
How many Kg of vegetable produce used for
other purposes?
African Eggplant:___________________
Amaranths: ____________________
Tomatoes: _______________
B50
B51
B52
What % used for other purposes?
African
Eggplant:______________%
Amaranths: _____________%
Tomatoes: ______________%
B53
B54
B55
How do you harvest your produce?
African Eggplant; __________
Amaranth; ___________
Tomatoes; ___________
1 = Harvested manual
2 = Harvested with scissor
3= Knife
B56 Do you harvest all vegetable at the one time?
______________
0 = No 1 = Yes
B57
B58
B59
B60
B61
B62
B63
B64
B65
B66
B67
B68
B69
B70
B71
What is/are the factors contributing to
post-harvest losses in vegetables? 0 =
No 1 = Yes
Education level: _________
Experience in Veg. farming: ________
Farm size: _____________________
Harvesting method: _____________
Time of harvesting: _____________
Loading/Off-loading: ___________
Distance to the market: __________
Nature of the road: _____________
Mode of transportation: _________
Contamination: _______________
Storage condition: _____________
Packaging materials: ___________
Financial Constraints: _____________
Labor Constraints: _____________
Gender of the responsible person:
____________
B72
B73
B74
B75
B76
B77
B78
B79
B80
B81
B82
B83
B84
B85
B86
If Yes/No;
Give reason
________________________________
_________________________________
_________________________________
_________________________________
_________________________________
_________________________________
_________________________________
_________________________________
________________________________
_________________________________
_________________________________
_________________________________
_________________________________
_________________________________
_________________________________

68
B87
B88
B89
B90
B91
B92
B93
B94
B95
How much is lost (African Eggplanta0
due to the following reason?
Harvesting method: ____________Kg
Time of harvesting: ____________Kg
Loading/Off-loading: ___________Kg
Distance to the market: __________Kg
Nature of the road: _____________Kg
Mode of transportation: _________Kg
Contamination: _______________Kg
Storage condition: _____________Kg
Packaging materials: ___________Kg
B96
B97
B98
B99
B100
B101
B102
B103
B104
Value of the loss in Tsh
____________________________
____________________________
____________________________
____________________________
____________________________
____________________________
____________________________
____________________________
____________________________
B105
B106
B107
B108
B109
B110
B111
B112
B113
How much is lost (Amaranth) due to
the following reason?
Harvesting method: ___________Kg
Time of harvesting: ___________Kg
Loading/Off-loading: __________Kg
Distance to the market: _________Kg
Nature of the road: ____________Kg
Mode of transportation: ________Kg
Contamination: ______________Kg
Storage condition: ____________Kg
Packaging materials: __________Kg
B114
B115
B116
B117
B118
B119
B120
B121
B122
Value of the loss in Tsh
____________________________
____________________________
____________________________
____________________________
____________________________
____________________________
____________________________
____________________________
____________________________
B123
B124
B125
B126
B127
B128
B129
B130
B131
How much is lost (Tomatoes) due to
the following reason?
Harvesting method: ___________Kg
Time of harvesting: ___________Kg
Loading/Off-loading: __________Kg
Distance to the market: ________Kg
Nature of the road: ____________Kg
Mode of transportation: ________Kg
Contamination: ______________Kg
Storage condition: ____________Kg
Packaging materials: __________Kg
B132
B133
B134
B135
B136
B137
B138
B139
B140
Value of the loss in Tsh
____________________________
____________________________
____________________________
____________________________
____________________________
____________________________
____________________________
____________________________
____________________________
C: VEGETABLE MARKETING
C1 Do you sell your vegetable produce 0 = No 1 = Yes

69
C2 If No to qn C1: Give reasons
____________________________________________________________________
___________________________________________________________________
If Yes to C1; Which market outlet do you mostly sell
your vegetables during low season?
C3
C4
C5
African Eggplant: ____________
Amaranth: ___________
Tomatoes: ___________
1 = Farm gate;
2 = Whole sellers;
3 = Retailer
If Yes to C1; Which market outlet do you mostly sell
your vegetables during low season?
C6
C7
C8
African Eggplant: _____________
Amaranth: ________________
Tomatoes: ________________
1 = Farm gate;
2 = Whole sellers;
3 = Retailer
C12 Do you transport your vegetables to the market? _______ 0 = No 1 = Yes
C13 How far is the nearest market where you sell your
vegetables? _____________Km
C14
C15
C16
C17
C18
Does the household own the transportation
asset?
Bicycle: ______ 0 = No 1 = Yes
Motorbike: _____ 0 = No 1 = Yes
Ox cart: ________ 0 = No 1 = Yes
Car: _______ 0 = No 1 = Yes
Truck: ______ 0 = No 1 = Yes
C19
C20
C21
C22
C23
Who in the household have the
access to the asset?
1 = Husband; 2 = Wife; 3 = Both
Bicycle: _______
Motorbike: _____
Ox cart: ________
Car: _________
Truck: ___________
What type of transport mode do you mostly use during
transportation of vegetable produce?
C24
C25
C26
C27
C28
C29
Head: __________
Bicycle: __________
Motorbike: __________
Ox cart: __________
Car: _______________
Truck: _____________
0 = No 1 = Yes
0 = No 1 = Yes
0 = No 1 = Yes
0 = No 1 = Yes
0 = No 1 = Yes
0 = No 1 = Yes
C30
C31
C32
What is the cost of transportation of transportation?
Head; ___________________________Tsh
Bicycle: _________________________ Tsh
Motorbike: _______________________Tsh

70
C33
C34
C35
Ox cart: __________________________Tsh
Car: _____________________________Tsh
Truck: ___________________________Tsh
C36 Why do you use that particular mode? _____________ 1 = No alternative;
2 = Cheap;
3 = To carry more;
4 = Faster
999=I don’t know
C37 What is the nature/type of the road? ________________ 0 = Weather road; 1 = Murram;
2 = Tarmac; 3 = Other
C38 Do you pack your produce during transportation? 0 = No 1 = Yes
C39 If NO to question C29: Give reason
___________________________________________________________________________
C40 If YES in C29: What are the packaging materials?
__________
Other; Specify _______________________________
0 = Plastic bag:
1 = Bamboo basket;
2 = Wooden create;
3 = Plastic create;
999 = I don’t know/Missing
C41 Do you store your produce during the marketing process?
_______
0 = No 1 = Yes
C42 If yes to question C32; What is the storage
condition?__________
0= Normal temp; 1 = controlled
temp
C43
C44
C45
How do you store your produces?
African Eggplant: ____________________________
Amaranth: __________________________________
Tomatoes: __________________________________
C46
C47
C48
How long do you store your vegetable before selling?
African Eggplant: _____________ days
Amaranth: ________________days
Tomatoes: ________________days
C49
C50
C51
How long can the vegetables be stored with the
acceptable quality?
African Eggplant: _____________ days
Amaranth: ________________days
Tomatoes: ________________days

71
C52
C53
C54
Do you sort/grade vegetables?
African Eggplant _____________
Amaranth: ________________
Tomatoes: ________________
0 = No 1 = Yes
0 = No 1 = Yes
0 = No 1 = Yes
C55 Does the price differ from different grades? _________ 0 = No 1 = Yes
C56 Do you incur any cost from vegetable storage? ______ 0 = No 1 = Yes
C57
C58
C59
If Yes to question C49; How much per day?
African Eggplant: _____________Tsh
Amaranth: ___________________Tsh
Tomatoes: ____________________Tsh
C60 Do you sell your vegetable individual? ___________ 0 = No 1 = Yes
C61
If Yes C54; Give reason __________
1 = You don’t sell at the same
time;
2 = You don’t sell at the same
market;
3 = You have conflict
4= They will degrade your
produce
5 = Few customers
6 = Quantity is small
999 = I don’t know/Missing
C62 Do you sell your vegetables in a group? ____________ 0 = No 1 = Yes
C63 If Yes C56: Give reason
______________________________________________
______________________________________________
1 = It lower the cost
2 = It increases bargaining power
3 = Share market information
999 = I don’t know/ Missing
C64 Do you always find market for all your vegetables?
______________
0 = No 1 = Yes
If NO to C58: What happens to unsold vegetables?
C65
C66
C67
Lose to spoilage: ______________
Eat (Family and friends): _______________
Used as animal (livestock) feeds: ______________
0 = No 1 = Yes
0 = No 1 = Yes
0 = No 1 = Yes
C68 Do you experience problems in marketing your
vegetables?
0 = No 1 = Yes
If Yes to C63: What problems do you encounter?
C69 Poor roads: ____________ 0 = No 1 = Yes

72
C70 High transport costs: _________________ 0 = No 1 = Yes
C71 Low prices: ________________ 0 = No 1 = Yes
C72 Low demand: ___________________ 0 = No 1 = Yes
C73 Poor storage facilities: ___________________ 0 = No 1 = Yes
C74 Lack of markets: _______________________ 0 = No 1 = Yes
C75 High spoilage rate of vegetables: __________________ 0 = No 1 = Yes
C76 High processing costs: ________________________ 0 = No 1 = Yes
C77 Lack of market information: ____________________ 0 = No 1 = Yes
C78 High local taxes (road taxes and market dues): ________ 0 = No 1 = Yes
C79 Unorganized farmers: _________________________ 0 = No 1 = Yes
C78 Thieves: _________________________ 0 = No 1 = Yes
D: POST-HARVEST HANDLING PRACTICE AND TECHNIQUE
D1 Do you use any post-harvest handling practice and technique?
_____________
0 = No 1 = Yes
D2 If No to D1; Give reason
___________________________________________________
If Yes to D1;What are post-harvest handling practice and
technique do you use in African Eggplant?
D3
D4
D5
D6
D7
D8
D9
Maturity indices: ___________________
Shade: ____________________
Sorting/grading: _________________
Use of improved containers: ______________
Washing/hygiene: ________________
Solar drying: _____________
Cooling: _________________
Others: __________________
0 = No 1 = Yes
0 = No 1 = Yes
0 = No 1 = Yes
0 = No 1 = Yes
0 = No 1 = Yes
0 = No 1 = Yes
0 = No 1 = Yes
0 = No 1 = Yes
If Yes to D1;What are post-harvest handling practice and
technique do you use in Amaranth?
D10
D11
D12
D13
D14
D15
D16
Maturity indices: ___________________
Shade: ____________________
Sorting/grading: _________________
Use of improved containers: ______________
Washing/hygiene: ________________
Solar drying: _____________
Cooling: _________________
0 = No 1 = Yes
0 = No 1 = Yes
0 = No 1 = Yes
0 = No 1 = Yes
0 = No 1 = Yes
0 = No 1 = Yes
0 = No 1 = Yes

73
Others: __________________ 0 = No 1 = Yes
If Yes to D1;What are post-harvest handling practice and
technique do you use in Tomatoes?
D17
D18
D19
D20
D21
D22
D23
Maturity indices: ___________________
Shade: ____________________
Sorting/grading: _________________
Use of improved containers: ______________
Washing/hygiene: ________________
Solar drying: _____________
Cooling: _________________
Others: __________________
0 = No 1 = Yes
0 = No 1 = Yes
0 = No 1 = Yes
0 = No 1 = Yes
0 = No 1 = Yes
0 = No 1 = Yes
0 = No 1 = Yes
0 = No 1 = Yes
D24
D25
D26
D27
Does the choice of using maturity indices influenced by the
following?
Quantity of vegetable harvested: ____________
Farming experience: ____________
Investment cost: _____________
Price of vegetables: ___________
Others: __________
0 = No 1 = Yes
0 = No 1 = Yes
0 = No 1 = Yes
0 = No 1 = Yes
0 = No 1 = Yes
D28
D29
D30
D31
Does the choice of using shade influenced by the following?
Quantity of vegetable harvested: ____________
Farming experience: ____________
Investment cost: _____________
Price of vegetables: ___________
Others: __________
0 = No 1 = Yes
0 = No 1 = Yes
0 = No 1 = Yes
0 = No 1 = Yes
0 = No 1 = Yes
D32
D33
D34
D35
Does the choice of sorting/grading influenced by the following?
Quantity of vegetable harvested: ____________
Farming experience: ____________
Investment cost: _____________
Price of vegetables: ___________
Others: __________
0 = No 1 = Yes
0 = No 1 = Yes
0 = No 1 = Yes
0 = No 1 = Yes
0 = No 1 = Yes
D36
D37
D38
D39
Does the choice of using improve container/creates influenced by
the following?
Quantity of vegetable harvested: ____________
Farming experience: ____________
Investment cost: _____________
Price of vegetables: ___________
0 = No 1 = Yes
0 = No 1 = Yes
0 = No 1 = Yes
0 = No 1 = Yes
0 = No 1 = Yes

74
Others: __________
D40
D41
D42
D43
Does the choice of washing/hygiene influenced by the following?
Quantity of vegetable harvested: ____________
Farming experience: ____________
Investment cost: _____________
Price of vegetables: ___________
Others: __________
0 = No 1 = Yes
0 = No 1 = Yes
0 = No 1 = Yes
0 = No 1 = Yes
0 = No 1 = Yes
D44
D45
D46
D47
Does the choice of drying influenced by the following?
Quantity of vegetable harvested: ____________
Farming experience: ____________
Investment cost: _____________
Price of vegetables: ___________
Others: __________
0 = No 1 = Yes
0 = No 1 = Yes
0 = No 1 = Yes
0 = No 1 = Yes
0 = No 1 = Yes
D48
D49
D50
D51
Does the choice of cooling influenced by the following?
Quantity of vegetable harvested: ____________
Farming experience: ____________
Investment cost: _____________
Price of vegetables: ___________
Others: __________
0 = No 1 = Yes
0 = No 1 = Yes
0 = No 1 = Yes
0 = No 1 = Yes
0 = No 1 = Yes
D52
Is vegetable production/sale a viable business? 0 = No 1 = Yes
D53 What do you think is/are the greatest problem in vegetable production
_______________________________________________________________________
D54 What do you think could be improved in the vegetable production and marketing?
___________________________________________________________________________
D55 What do you think could be done to reduce vegetable post-harvest losses?
__________________________________________________________________________
QUESTIONNAIRE FOR ECONOMIC COST QUANTIFICATION OF SELECTED
VEGETABLES POSTHARVEST LOSSES IN BABATI DISTRICT TANZANIA
(Retailers/wholesalers’)
Questionnaire Number
Enumerator name: ________________ Date: ________________________________

75
A1 Name of the respondent: ________________________________________________
A2 Tel. no: ________________________________________________
A3 District: BABATI
A4 Town/Village: ____________ Gallapo = 1; Matufa = 2; Bermi = 3; Seloto
= 4
A5 Sex of the respondent? _____ Female = 0; Male = 1
A6
A7
A8
A9
A10
Demographic data respondent:
Position of respondent: _________
Sex: ______
Age (years): ______
Educational Level (years): ________
Farming Experience in Veg. Production (years)
__________
1= H/Head ; 2= Wife;
3= Child; 4=Relative
0 = Female 1 = Male
A11
Marital Status _______
1= Married 2 = Single 3 = Divorced
4 = Separated 5.Widowed
A12
Major Occupation ______
1= Farming 2=Salaried Employee
3= Hired worker
A13
A14
A15
A16
What is the household size and gender
composition?
Total: _____
Men (adult): ______
Women (Adult): ______
Children (under 18) ______
A17
A18
A19
What is the household’s age structure?
0 – under 18 years: _______
18 - 60 years: _______
Above 60: ________
A20
A21
A22
A23
What is the household’s average income category
per month?
Total: ______
Husband: ______
Wife: _______
Other: _______
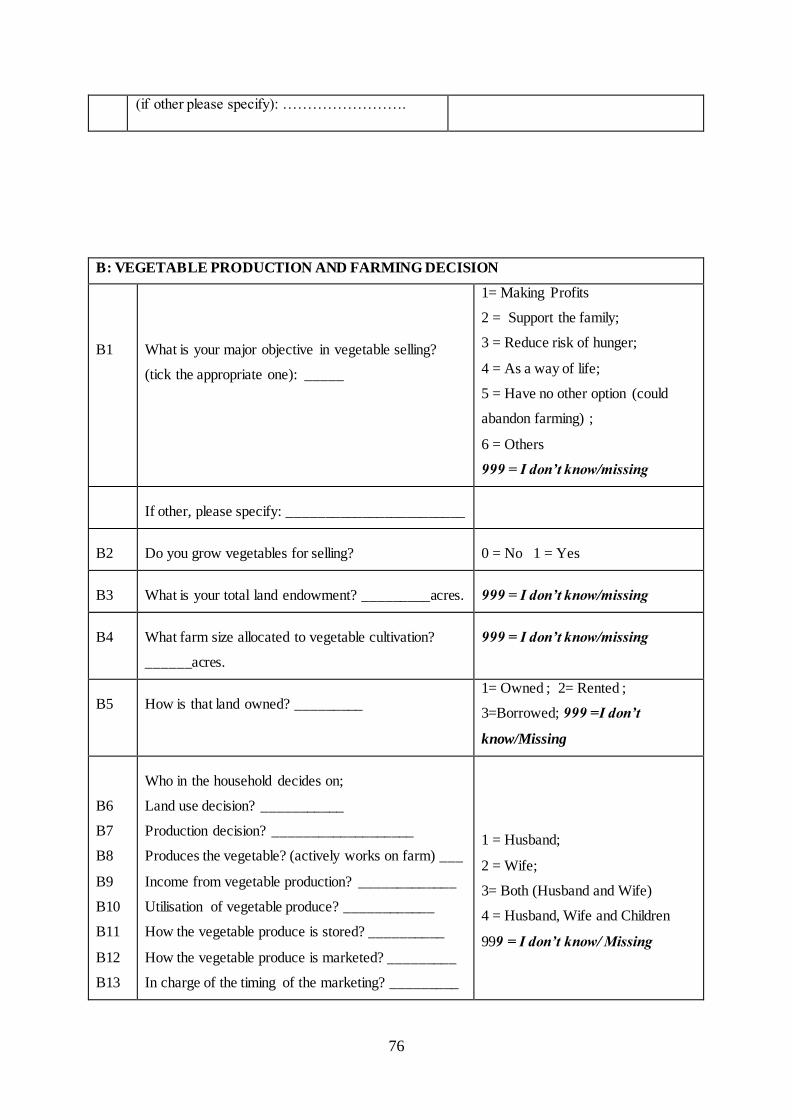
76
(if other please specify): …………………….
B: VEGETABLE PRODUCTION AND FARMING DECISION
B1
What is your major objective in vegetable selling?
(tick the appropriate one): _____
1= Making Profits
2 = Support the family;
3 = Reduce risk of hunger;
4 = As a way of life;
5 = Have no other option (could
abandon farming) ;
6 = Others
999 = I don’t know/missing
If other, please specify: ________________________
B2 Do you grow vegetables for selling? 0 = No 1 = Yes
B3 What is your total land endowment? _________acres. 999 = I don’t know/missing
B4 What farm size allocated to vegetable cultivation?
______acres.
999 = I don’t know/missing
B5 How is that land owned? _________ 1= Owned ; 2= Rented ;
3=Borrowed; 999 =I don’t
know/Missing
B6
B7
B8
B9
B10
B11
B12
B13
Who in the household decides on;
Land use decision? ___________
Production decision? ___________________
Produces the vegetable? (actively works on farm) ___
Income from vegetable production? _____________
Utilisation of vegetable produce? ____________
How the vegetable produce is stored? __________
How the vegetable produce is marketed? _________
In charge of the timing of the marketing? _________
1 = Husband;
2 = Wife;
3= Both (Husband and Wife)
4 = Husband, Wife and Children
999 = I don’t know/ Missing

77
B14 Carrying out the actual selling of produce? _________
B15
B16
B17
How much did you buy per week?
African Eggplant; ___________Kg
Amaranth; ________________Kg
Tomatoes; ______________Kg
B16
B17
B18
How much did you sell per week?
African Eggplant; ___________Kg
Amaranth; ________________Kg
Tomatoes; ________________Kg
B19
B20
B21
B22
How many (Kg) of vegetable produce used
as a food?
African Eggplant:______________
Amaranths: ______________
Tomatoes: _______________
B23
B24
B25
What % used as food?
African
Eggplant:__________________%
Amaranths: ________________%
Tomatoes: _________________%
B26
B27
B28
How many Kg of vegetable produce used
for other purposes?
African Eggplant:___________________
Amaranths: ____________________
Tomatoes: _______________
B29
B30
B31
What % used for other purposes?
African
Eggplant:__________________%
Amaranths: ________________%
Tomatoes: _________________%
B31
B32
B33
B34
B35
B36
B37
B38
B39
B40
B41
B42
B43
B44
B45
What is/are the factors contributing
to post-harvest losses in vegetables?
0 = No 1 = Yes
Education level: _________
Experience in Veg. farming: _____
Farm size: ___________________
Harvesting method: ___________
Time of harvesting: ___________
Loading/Off-loading: ___________
Distance to the market: __________
Nature of the road: _____________
Mode of transportation: _________
Contamination: _______________
Storage condition: _____________
Packaging materials: ___________
Financial Constraints: ___________
Labor Constraints: _____________
Gender of the responsible person:
____________
B46
B47
B48
B49
B50
B51
B52
B53
B54
B55
B56
B57
B58
B59
B60
If Yes/No;
Give reason
______________________________________
_____________________________________
_____________________________________
____________________________________
______________________________________
______________________________________
______________________________________
______________________________________
______________________________________
______________________________________
______________________________________
______________________________________
______________________________________
______________________________________
______________________________________
B61
How much is lost (African Eggplanta0 due to
the following reason?
B70
Value of the loss in Tsh
____________________________

78
B62
B63
B64
B65
B66
B67
B68
B69
Harvesting method: ______________Kg
Time of harvesting: ______________Kg
Loading/Off-loading: _____________Kg
Distance to the market: ____________Kg
Nature of the road: _______________Kg
Mode of transportation: ___________Kg
Contamination: __________________Kg
Storage condition: ________________Kg
Packaging materials: ______________Kg
B71
B72
B73
B74
B75
B76
B77
B78
____________________________
____________________________
____________________________
____________________________
____________________________
____________________________
____________________________
____________________________
B79
B80
B81
B82
B83
B84
B85
B86
B87
How much is lost (Amaranth) due to the
following reason?
Harvesting method: _______________Kg
Time of harvesting: _______________Kg
Loading/Off-loading: ______________Kg
Distance to the market: _____________Kg
Nature of the road: ________________Kg
Mode of transportation: ____________Kg
Contamination: ___________________Kg
Storage condition: ________________Kg
Packaging materials: ______________Kg
B88
B89
B90
B91
B92
B93
B94
B95
B96
Value of the loss in Tsh
____________________________
____________________________
____________________________
____________________________
____________________________
____________________________
____________________________
____________________________
____________________________
B97
B98
B99
B100
B101
B102
B103
B104
B105
How much is lost (Tomatoes) due to the
following reason?
Harvesting method: ______________Kg
Time of harvesting: _______________Kg
Loading/Off-loading: ______________Kg
Distance to the market: ____________Kg
Nature of the road: ________________Kg
Mode of transportation: ____________Kg
Contamination: ___________________Kg
Storage condition: ________________Kg
Packaging materials: ______________Kg
B106
B107
B108
B109
B110
B111
B112
B113
B114
Value of the loss in Tsh
____________________________
____________________________
____________________________
____________________________
____________________________
____________________________
____________________________
____________________________
____________________________
C: VEGETABLE MARKETING
C1 Do you sell your vegetable produce 0 = No 1 = Yes
C2 If No to qn C1: Give reasons
___________________________________________________________
If Yes to C1; Which market outlet do you mostly sell

79
your vegetables during low season?
C3
C4
C5
African Eggplant: ____________
Amaranth: ___________
Tomatoes: ___________
1 = Farm gate;
2 = Whole sellers;
3 = Retailer
If Yes to C1; Which market outlet do you mostly sell
your vegetables during low season?
C6
C7
C8
African Eggplant: _____________
Amaranth: ________________
Tomatoes: ________________
1 = Farm gate;
2 = Whole sellers;
3 = Retailer
C9
C10
C11
In average how much do you sell per week?
African Eggplant: ________________Kg
Amaranth: ______________________Kg
Tomatoes: ______________________Kg
C12 Do you transport your vegetables to the market?
_________
0 = No 1 = Yes
C13 How far is the nearest market where you sell your
vegetables? _____________Km
C14
C15
C16
C17
C18
Does the household own the transportation
asset?
Bicycle: _____ 0 = No 1 = Yes
Motorbike: ___ 0 = No 1 = Yes
Ox cart: ______ 0 = No 1 = Yes
Car: _____ 0 = No 1 = Yes
Truck: ___ 0 = No 1 = Yes
C19
C20
C21
C22
C23
Who in the household have the access
to the asset?
1 = Husband; 2 = Wife; 3 = Both
Bicycle: _______
Motorbike: _____
Ox cart: ________
Car: _________
Truck: ___________
What type of transport mode do you mostly use during
transportation of vegetable produce?
C24
C25
C26
C27
C28
C29
Head: __________
Bicycle: __________
Motorbike: __________
Ox cart: __________
Car: _______________
Truck: _____________
0 = No 1 = Yes
0 = No 1 = Yes
0 = No 1 = Yes
0 = No 1 = Yes
0 = No 1 = Yes
0 = No 1 = Yes
C30
What is the cost of transportation of transportation?
Head; ___________________________Tsh

80
C31
C32
C33
C34
C35
Bicycle: _________________________ Tsh
Motorbike: _______________________Tsh
Ox cart: __________________________Tsh
Car: _____________________________Tsh
Truck: ___________________________Tsh
C36 Why do you use that particular mode? _____________ 1 = No alternative;
2 = Cheap;
3 = To carry more;
4 = Faster
999=I don’t know
C37 What is the nature/type of the road? ________________ 0 = Weather road; 1 = Morram;
2 = Tarmac; 3 = Other
C38 Do you pack your produce during transportation? 0 = No 1 = Yes
C39 If NO to question C29: Give reason:
C40 If YES in C29: What are the packaging materials?
__________
0 = Plastic bag:
1 = Bamboo basket;
2 = Wooden create;
3 = Plastic create;
999 = I don’t know/Missing
C41 Do you store your vegetables during the marketing
process? _______
0 = No 1 = Yes
C42 If yes to question C32; What is the storage
condition?__________
0= Normal temp; 1 = controlled
temp
C43
C44
C45
How do you store your produces?
African Eggplant: ___________________________
Amaranth: __________________________________
Tomatoes: _____________________________________
C46
C47
C48
How long do you store your vegetable before selling?
African Eggplant: _____________ days
Amaranth: ________________days
Tomatoes: ________________days
C49
How long can the vegetables be stored with the
acceptable quality?
African Eggplant: _____________ days

81
C50
C51
Amaranth: ________________days
Tomatoes: ________________days
C52
C53
C54
Do you sort/grade vegetables?
African Eggplant _____________
Amaranth: ________________
Tomatoes: ________________
0 = No 1 = Yes
0 = No 1 = Yes
0 = No 1 = Yes
C55 Does the price differ from different grades? ________ 0 = No 1 = Yes
C56 Do you incur any cost from vegetable storage? ______ 0 = No 1 = Yes
C57
C58
C59
If Yes to question C49; How much per day?
African Eggplant: _____________Tsh
Amaranth: ___________________Tsh
Tomatoes: ____________________Tsh
C60 Do you sell your vegetable individual? ___________ 0 = No 1 = Yes
C61
If Yes C54; Give reason __________
1 = You don’t sell at the same
time;
2 = You don’t sell at the same
market;
3 = You have conflict
4= They will degrade your
produce
5 = Few customers
6 = Quantity is small
999 = I don’t know/Missing
C62 Do you sell your vegetables in a group? ____________ 0 = No 1 = Yes
C63 If Yes C56: Give reason
______________________________________________
1 = It lower the cost
2 = It increases bargaining power
3 = Share market information
999 = I don’t know/ Missing
C64 Do you always find market for all your vegetables? ____ 0 = No 1 = Yes
If NO to C58: What happens to unsold vegetables?
C65
C66
C67
Lose to spoilage: ______________
Eat (Family and friends): _______________
Used as animal (livestock) feeds: ______________
0 = No 1 = Yes
0 = No 1 = Yes
0 = No 1 = Yes
C68 Do you experience problems in marketing your
vegetables?
0 = No 1 = Yes
If Yes to C63: What problems do you encounter?

82
C69 Poor roads: ____________ 0 = No 1 = Yes
C70 High transport costs: _________________ 0 = No 1 = Yes
C71 Low prices: ________________ 0 = No 1 = Yes
C72 Low demand: ___________________ 0 = No 1 = Yes
C73 Poor storage facilities: ___________________ 0 = No 1 = Yes
C74 Lack of markets: _______________________ 0 = No 1 = Yes
C75 High spoilage rate of vegetables: __________________ 0 = No 1 = Yes
C76 High processing costs: ________________________ 0 = No 1 = Yes
C77 Lack of market information: ____________________ 0 = No 1 = Yes
C78 High local taxes (road taxes and market dues): ________ 0 = No 1 = Yes
C79 Unorganized farmers: _________________________ 0 = No 1 = Yes
C78 Thieves: _________________________ 0 = No 1 = Yes
D: POST-HARVEST HANDLING PRACTICE AND TECHNIQUE
D1 Do you use any post-harvest handling practice and technique?
_____________
0 = No 1 = Yes
D2 If No to D1; Give reason
___________________________________
If Yes to D1; What are post-harvest handling practice and
technique do you use in African Eggplant?
D3
D4
D5
D6
D7
D8
D9
Maturity indices: ___________________
Shade: ____________________
Sorting/grading: _________________
Use of improved containers: ______________
Washing/hygiene: ________________
Solar drying: _____________
Cooling: _________________
Others: __________________
0 = No 1 = Yes
0 = No 1 = Yes
0 = No 1 = Yes
0 = No 1 = Yes
0 = No 1 = Yes
0 = No 1 = Yes
0 = No 1 = Yes
0 = No 1 = Yes
If Yes to D1;What are post-harvest handling practice and
technique do you use in Amaranth?
D10
D11
D12
D13
D14
D15
Maturity indices: ___________________
Shade: ____________________
Sorting/grading: _________________
Use of improved containers: ______________
Washing/hygiene: ________________
Solar drying: _____________
0 = No 1 = Yes
0 = No 1 = Yes
0 = No 1 = Yes
0 = No 1 = Yes
0 = No 1 = Yes
0 = No 1 = Yes

83
D16
Cooling: _________________
Others: __________________
0 = No 1 = Yes
0 = No 1 = Yes
If Yes to D1; What are post-harvest handling practice and
technique do you use in Tomatoes?
D17
D18
D19
D20
D21
D22
D23
Maturity indices: ___________________
Shade: ____________________
Sorting/grading: _________________
Use of improved containers: ______________
Washing/hygiene: ________________
Solar drying: _____________
Cooling: _________________
Others: __________________
0 = No 1 = Yes
0 = No 1 = Yes
0 = No 1 = Yes
0 = No 1 = Yes
0 = No 1 = Yes
0 = No 1 = Yes
0 = No 1 = Yes
0 = No 1 = Yes
D24
D25
D26
D27
Does the choice of using maturity indices influenced by the
following?
Quantity of vegetable harvested: ____________
Farming experience: ____________
Investment cost: _____________
Price of vegetables: ___________
Others: __________
0 = No 1 = Yes
0 = No 1 = Yes
0 = No 1 = Yes
0 = No 1 = Yes
0 = No 1 = Yes
D28
D29
D30
D31
Does the choice of using shade influenced by the following?
Quantity of vegetable harvested: ____________
Farming experience: ____________
Investment cost: _____________
Price of vegetables: ___________
Others: __________
0 = No 1 = Yes
0 = No 1 = Yes
0 = No 1 = Yes
0 = No 1 = Yes
0 = No 1 = Yes
D32
D33
D34
D35
Does the choice of sorting/grading influenced by the following?
Quantity of vegetable harvested: ____________
Farming experience: ____________
Investment cost: _____________
Price of vegetables: ___________
Others: __________
0 = No 1 = Yes
0 = No 1 = Yes
0 = No 1 = Yes
0 = No 1 = Yes
0 = No 1 = Yes
D36
D37
D38
Does the choice of using improve container/creates influenced by
the following?
Quantity of vegetable harvested: ____________
Farming experience: ____________
Investment cost: _____________
0 = No 1 = Yes
0 = No 1 = Yes
0 = No 1 = Yes
0 = No 1 = Yes

84
D39
Price of vegetables: ___________
Others: __________
0 = No 1 = Yes
D40
D41
D42
D43
Does the choice of washing/hygiene influenced by the following?
Quantity of vegetable harvested: ____________
Farming experience: ____________
Investment cost: _____________
Price of vegetables: ___________
Others: __________
0 = No 1 = Yes
0 = No 1 = Yes
0 = No 1 = Yes
0 = No 1 = Yes
0 = No 1 = Yes
D44
D45
D46
D47
Does the choice of drying influenced by the following?
Quantity of vegetable harvested: ____________
Farming experience: ____________
Investment cost: _____________
Price of vegetables: ___________
Others: __________
0 = No 1 = Yes
0 = No 1 = Yes
0 = No 1 = Yes
0 = No 1 = Yes
0 = No 1 = Yes
D48
D49
D50
D51
Does the choice of cooling influenced by the following?
Quantity of vegetable harvested: ____________
Farming experience: ____________
Investment cost: _____________
Price of vegetables: ___________
Others: __________
0 = No 1 = Yes
0 = No 1 = Yes
0 = No 1 = Yes
0 = No 1 = Yes
0 = No 1 = Yes
D52
Is vegetable production/sale a viable business? 0 = No 1 = Yes
D53 What do you think is/are the greatest problem in vegetable production
____________________________________________________________________________
D54 What do you think could be improved in the vegetable production and marketing?
____________________________________________________________________________
D55 What do you think could be done to reduce vegetable post-harvest losses?
____________________________________________________________________________
THANK YOU