Embed Size (px)
Citation preview

Canada’s Natural Resources – Now and for the Future
Evaluation of the GRACE-based Global Gravity Models in CanadaJianliang Huang and Marc Véronneau, Geodetic Survey Division, CCRS

Canada’s Natural Resources – Now and for the Future
Outline
1. Objectives2. Gravity Comparisons3. GPS-Leveling Comparisons4. Comparisons with Deflections of the Vertical5. Comparisons with Regional Geoid Models6. Summary

Canada’s Natural Resources – Now and for the Future
1. Objectives
To assess GRACE-based global gravity models, in particular EGM08, using surface gravity observations, GPS-levelling data, deflections of the vertical in Canada.
To examine the impact of EGM08 on the regional geoidmodelling by comparing it with Canadian Gravimetric Geoidmodels based on the remove-restore Stokes numerical integration.

Canada’s Natural Resources – Now and for the Future
2. Gravity Comparisons (1/6)- Gravity Stations
On land:215,862 (29%)
On sea & lake:455,464 (61%)
On ice:36,487 (5%)
Total: 742,062 (+7340)
Airborne:34,249 (5%)
Canada’s Natural Resources – Now and for the Future
2. Gravity Comparisons (2/6)- Data Types
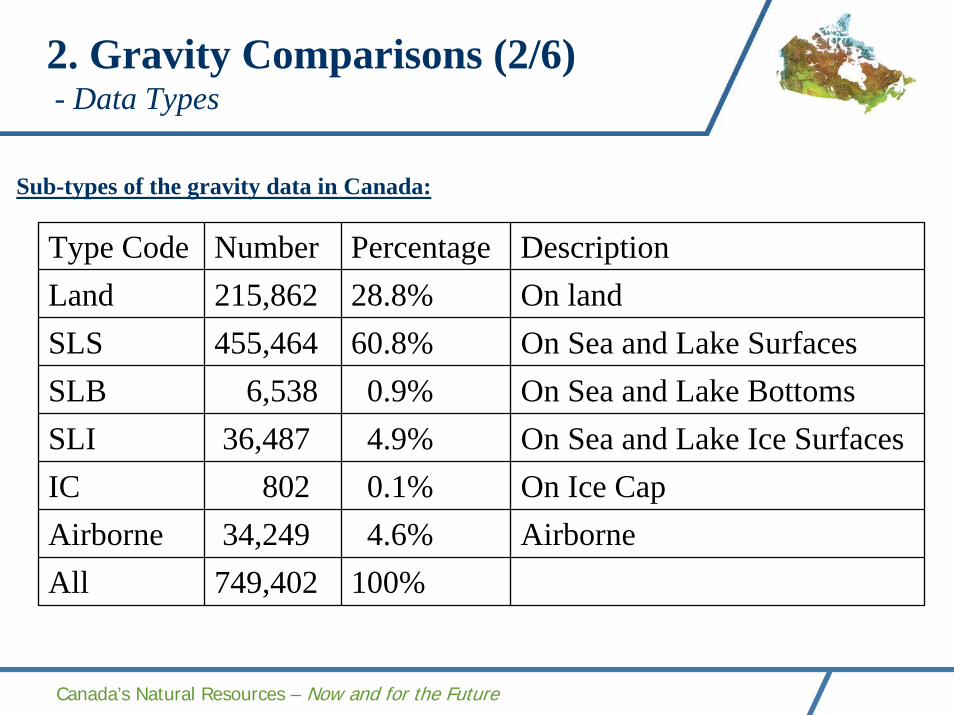
Sub-types of the gravity data in Canada:
Type Code Number Percentage DescriptionLand 215,862 28.8% On landSLS 455,464 60.8% On Sea and Lake SurfacesSLB 6,538 0.9% On Sea and Lake BottomsSLI 36,487 4.9% On Sea and Lake Ice SurfacesIC 802 0.1% On Ice CapAirborne 34,249 4.6% AirborneAll 749,402 100%

Canada’s Natural Resources – Now and for the Future
2. Gravity Comparisons (3/6)- Gravity data
Statistical description of the free-air gravity anomalies:
Data Code Min Max Mean StdDev R.M.S.
Land -183.62 393.31 -9.50 29.38 30.88
SLS -160.78 240.66 -6.09 35.80 36.31
SLB -102.70 102.16 -18.37 25.75 31.63
SLI -167.94 106.98 -23.13 30.03 37.91
IC -98.18 217.99 55.14 42.83 69.82
Airborne -100.49 54.110 -26.75 30.39 40.49
All -183.62 393.31 -8.89 34.00 35.14

Canada’s Natural Resources – Now and for the Future
2. Gravity Comparisons (4/6)- Observations - Predictions without Continuation
Data Code Model Min Max Mean StdDev RMSLand PGM07A
EGM08-177.41-178.09
114.89114.27
-1.65-1.70
13.3913.34
13.4913.45
SLS PGM07AEGM08
-202.10-203.91
48.5853.54
-1.20-1.15
4.784.61
4.934.76
SLB PGM07AEGM08
-43.08-44.10
28.7527.77
-0.77-0.68
4.004.17
4.084.22
SLI PGM07AEGM08
-80.92-88.63
49.9149.76
-0.50-0.57
4.474.15
4.504.19
IC PGM07AEGM08
-122.98-107.03
95.1995.01
-1.60-2.51
20.5820.27
20.6320.41
Airborne PGM07AEGM08
-23.44-23.06
39.3936.65
1.461.64
4.974.73
5.185.00
All PGM07AEGM08
-202.10-203.91
114.89114.27
-1.17-1.15
8.298.19
8.378.27
Canada’s Natural Resources – Now and for the Future
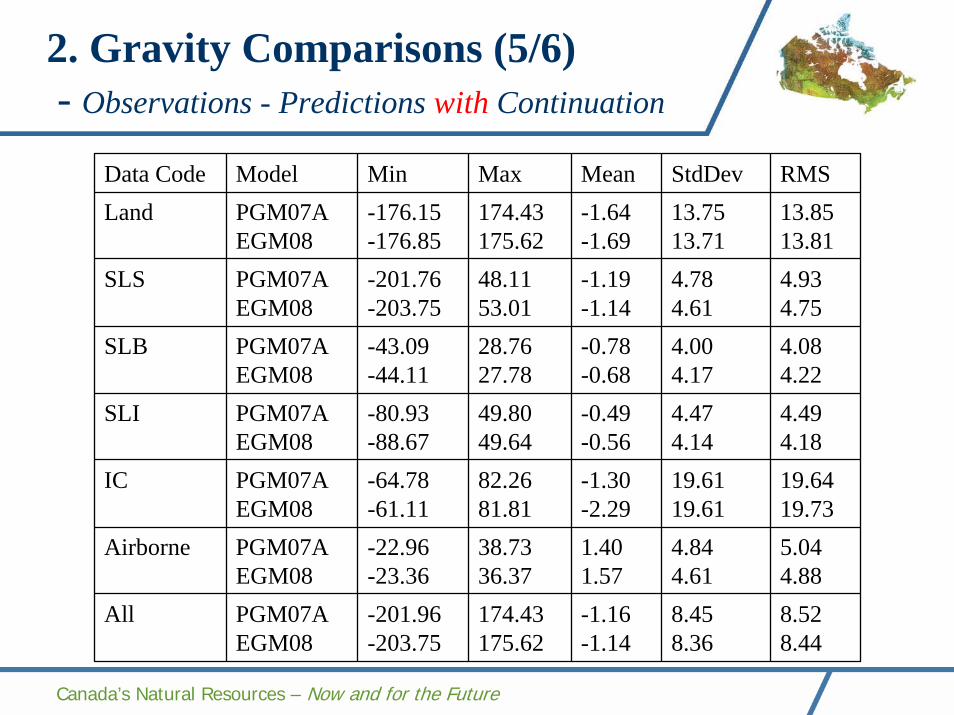
2. Gravity Comparisons (5/6)- Observations - Predictions with Continuation
Data Code Model Min Max Mean StdDev RMSLand PGM07A
EGM08-176.15-176.85
174.43175.62
-1.64-1.69
13.7513.71
13.8513.81
SLS PGM07AEGM08
-201.76-203.75
48.1153.01
-1.19-1.14
4.784.61
4.934.75
SLB PGM07AEGM08
-43.09-44.11
28.7627.78
-0.78-0.68
4.004.17
4.084.22
SLI PGM07AEGM08
-80.93-88.67
49.8049.64
-0.49-0.56
4.474.14
4.494.18
IC PGM07AEGM08
-64.78-61.11
82.2681.81
-1.30-2.29
19.6119.61
19.6419.73
Airborne PGM07AEGM08
-22.96-23.36
38.7336.37
1.401.57
4.844.61
5.044.88
All PGM07AEGM08
-201.96-203.75
174.43175.62
-1.16-1.14
8.458.36
8.528.44

Canada’s Natural Resources – Now and for the Future
2. Gravity Comparisons (6/6)- Differences vs. Elevation/Depth
Gravity anomaly differences vs. elevation over land (215,862 observations).
Gravity anomaly differences vs. depth over seas and lakes (455,464 observations).

Canada’s Natural Resources – Now and for the Future
3. GPS-Levelling Comparisons (1/4)- Principle and Computation
hHNH N =+=+ ζ0
Basic relation between h, H and N:
The geoid from a spherical harmonic model:
TB
n
mnmnmn
nee
nm
L
n
n
ee
eL
CPmSmJaa
GMGMC
ra
rGM
Wr
MGN
+⎟⎟
⎠
⎞
⎜⎜
⎝
⎛+⎟⎟
⎠
⎞⎜⎜⎝
⎛−⎟⎟
⎠
⎞⎜⎜⎝
⎛+
−=
∑∑== 020
00
)(sinsincos)( φλλγ
γδ
γδ
⎟⎠⎞
⎜⎝⎛ +−=
RHHGCTB 3
212
0
2
γρπ
'MMM −=δ 00 UWW −=δ

Canada’s Natural Resources – Now and for the Future
3. GPS-Levelling Comparisons (2/4)- GPS-Leveling Data
SNPRE32:(430 stations)
SN3307:(2579 stations)
-140 -130 -120 -110 -100 -90 -80 -700
5
10
15
20
σh (c
m)
Longitude (degree)
Ellipsoidal height
Canada’s Natural Resources – Now and for the Future
3. GPS-Levelling Comparisons (3/4)- Results
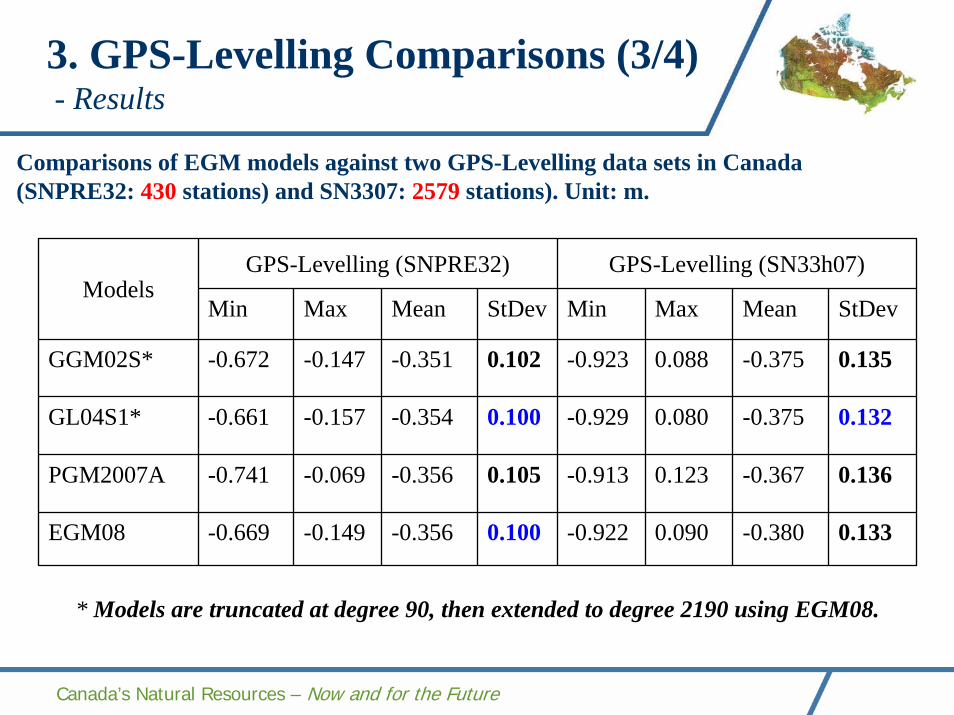
Comparisons of EGM models against two GPS-Levelling data sets in Canada (SNPRE32: 430 stations) and SN3307: 2579 stations). Unit: m.
GPS-Levelling (SNPRE32) GPS-Levelling (SN33h07)
Min Max Mean StDev Min Max Mean StDev
GGM02S* -0.672 -0.147 -0.351 0.102 -0.923 0.088 -0.375 0.135
GL04S1* -0.661 -0.157 -0.354 0.100 -0.929 0.080 -0.375 0.132
PGM2007A -0.741 -0.069 -0.356 0.105 -0.913 0.123 -0.367 0.136
EGM08 -0.669 -0.149 -0.356 0.100 -0.922 0.090 -0.380 0.133
Models
* Models are truncated at degree 90, then extended to degree 2190 using EGM08.

Canada’s Natural Resources – Now and for the Future
3. GPS-Levelling Comparisons (4/4)- h-H-N vs. Longitude
PGM2007A at 430 stations: PGM2007A at 2579 stations:
EGM08 at 430 stations: EGM08 at 2579 stations:

Canada’s Natural Resources – Now and for the Future
4. Comparisons with Deflections of the Vertical
939 stations: Deflections of the vertical in arc-second.Type Min Max Mean StdDev RMS
xi (N-S) -23.410 17.880 0.205 4.501 4.505
eta (E-W) -22.390 24.350 -0.232 6.137 6.142
Differences of East - West DfV (eta) in arc-second:
Differences of North - South DfV (xi) in arc-second:
Models Min Max Mean StdDev
PGM07A -12.364 9.946 -0.013 1.785
EGM08 -12.429 9.948 -0.014 1.760
Models Min Max Mean StdDev
PGM07A -12.839 14.944 0.203 2.111
EGM08 -12.814 15.266 0.197 2.101

Canada’s Natural Resources – Now and for the Future
5. Comparisons with Regional GeoidModels (1/6) – Canadian Geoid Models
1. Canadian Gravimetric Geoid 2005 (CGG05) is computed using the degree-banded remove-restore numerical Stokes integration. GGM02C (degree 2 to 200)+EGM96 (degree 201 to 360) is used to define the low degree components (degree 2 to 90) and the far-zone contribution (or so called the truncation error of the Stokes integration) of CGG05. It spans from 20°N-84°N and 10°W-170°W in the spacing of 2’ by 2’.
2. Preliminary Canadian Geoid 2008A (PCG08A) uses the same method as that of CGG05. EGM08 truncated at degree 360 is used instead of GGM02C and EGM96. The terrestrial gravity data has been updated in some regions.
Canada’s Natural Resources – Now and for the Future
5. Comparisons with Regional GeoidModels (2/6) – h-H-N, xi, and eta Tests
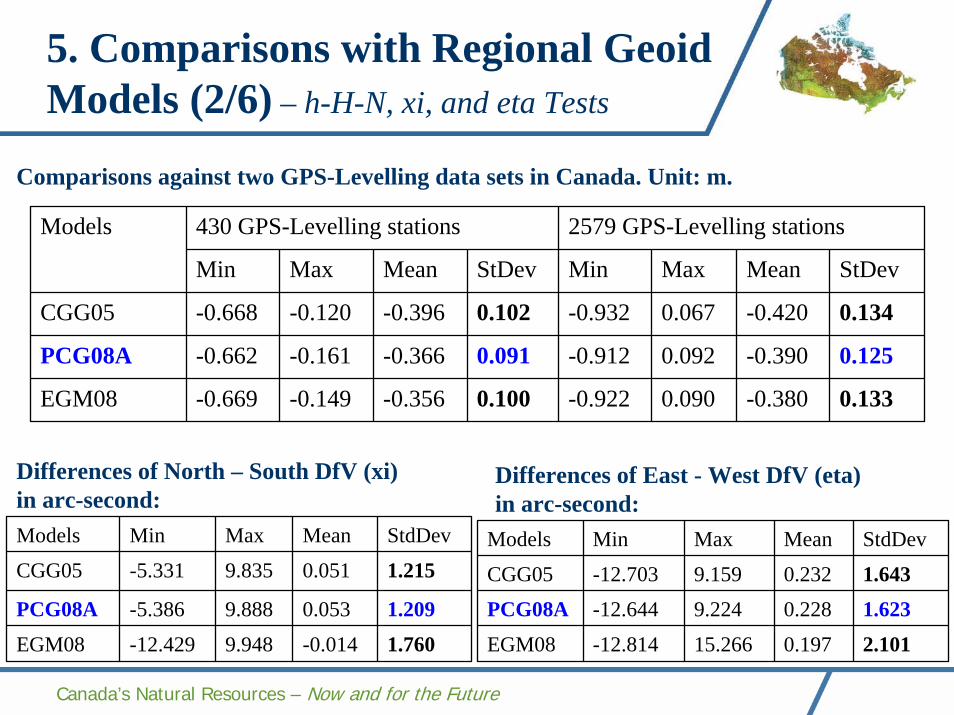
Comparisons against two GPS-Levelling data sets in Canada. Unit: m.
430 GPS-Levelling stations 2579 GPS-Levelling stations
Min Max Mean StDev Min Max Mean StDev
CGG05 -0.668 -0.120 -0.396 0.102 -0.932 0.067 -0.420 0.134
PCG08A -0.662 -0.161 -0.366 0.091 -0.912 0.092 -0.390 0.125
EGM08 -0.669 -0.149 -0.356 0.100 -0.922 0.090 -0.380 0.133
Models
1.760-0.0149.948-12.429EGM08
1.2090.0539.888-5.386PCG08A
1.2150.0519.835-5.331CGG05
StdDevMeanMaxMinModels
Differences of North – South DfV (xi) in arc-second:
2.1010.19715.266-12.814EGM08
1.6230.2289.224-12.644PCG08A
1.6430.2329.159-12.703CGG05
StdDevMeanMaxMinModels
Differences of East - West DfV (eta) in arc-second:

Canada’s Natural Resources – Now and for the Future
5. Comparisons with Regional GeoidModels (3/6) – h-H-N vs. Longitude
CGG05 at 430 stations: CGG05 at 2579 stations:
PCG08A at 430 stations: PCG08A at 2579 stations:
Canada’s Natural Resources – Now and for the Future
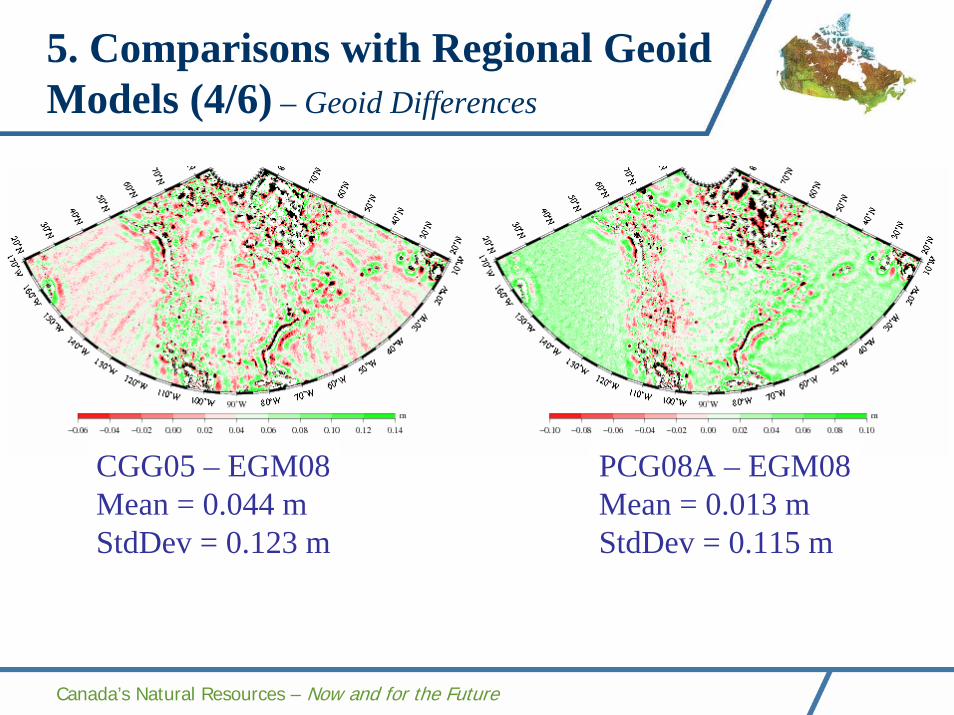
5. Comparisons with Regional GeoidModels (4/6) – Geoid Differences
PCG08A – EGM08Mean = 0.013 mStdDev = 0.115 m
CGG05 – EGM08Mean = 0.044 mStdDev = 0.123 m

Canada’s Natural Resources – Now and for the Future
5. Comparisons with Regional GeoidModels (5/6) – h-H-N vs. Elevation
EGM08:
PCG08A:
Canada’s Natural Resources – Now and for the Future
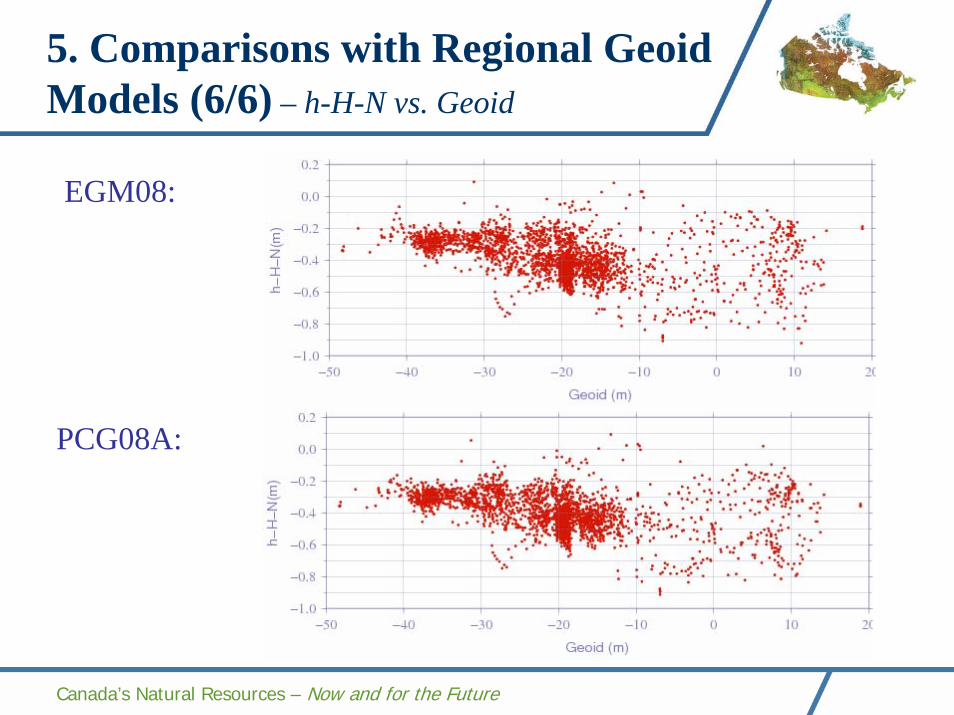
5. Comparisons with Regional GeoidModels (6/6) – h-H-N vs. Geoid
EGM08:
PCG08A:

Canada’s Natural Resources – Now and for the Future
6. Summary
1) The RMS of the differences between the EGM08-predicted gravity anomalies and the observed gravity anomalies is smaller than 5 mGal over seas and lakes in contrast to about 14 mGal over land in Canada. The RMS increases with increasing elevation with an evident trend over land, while the RMS decreases with increasing depth without an evident trend over seas and lakes.
2) The GPS-Leveling comparisons suggest that EGM08 models the geoid as accurate as, or even better than 10 cm in terms of RMS in Canada, and the latest releases of GRACE models show noteworthy improvement over the previous releases.
3) The comparisons with deflections of the vertical show the RMS of 1.8 arc-seconds in the north-south direction, and 2.1 arc-seconds in the east-west direction.
4) The comparison with CGG05 and PCG08A suggests that EGM08 contributes to the improvement of the Canadian geoid modeling.
5) The Canadian regional geoid model (PCG08A) performs better than EGM08 in terms of the comparisons with the GPS-leveling and the deflections of the vertical. The higher spatial resolution of the regional model is speculated as the major contributor to the better performance


![Time&variable gravity from GRACE: First resultsgeoid.colorado.edu/grace/docs/GRL-WahrSwenson2004.pdf2003 GRACE solution, and the static gravity field EGM96 [Lemoine et al., 1998] -](https://img.pdfslide.us/doc/110x75/6003cdbfe6f4526fff0dd2a1/timevariable-gravity-from-grace-first-2003-grace-solution-and-the-static.jpg)