Embed Size (px)
Citation preview
Technology Strategy Board
Evaluation of the Collaborative Research and Development Programmes
Final Report
A final report prepared by
PACEC for
the Technology Strategy Board
PACEC Public and Corporate
Economic Consultants
www.pacec.co.uk
49-53 Regent Street
Cambridge CB2 1AB
Tel: 01223 311649
Fax: 01223 362913
416 Linen Hall
162-168 Regent Street
London W1R 5TB
Tel: 020 7038 3571
Fax: 020 7038 3570
e-mail: [email protected]
September 2011
T11/069
PACEC Contents
Evaluation of the Collaborative Research and Development Programmes
Contents Executive Summary ........................................................................................................................ ii
X1 Aims of the evaluation ........................................................................................................ ii
X2 Rationale for CR&D ............................................................................................................ ii
X3 Evaluation methodology .....................................................................................................iii
X4 Progress Towards Aims and Objectives ........................................................................... iv
1 Introduction ............................................................................................................................. 1
1.1 Aims of the evaluation ........................................................................................................ 1
1.2 Rationale for CR&D ............................................................................................................ 2
1.3 Evaluation methodology ..................................................................................................... 4
1.4 Analysis of the research results ......................................................................................... 5
1.5 Structure of the report ........................................................................................................ 6
2 Characterisation of Projects ................................................................................................... 7
2.1 Introduction ......................................................................................................................... 7
2.2 Management information ................................................................................................... 7
3 Project Participants ............................................................................................................... 15
3.1 Project details ................................................................................................................... 15
3.2 Company background ...................................................................................................... 17
3.3 Further collaboration ........................................................................................................ 25
4 Objectives of Project Partners .............................................................................................. 26
5 Intermediate Changes to Attitudes and Behaviour ............................................................... 36
6 Business Performance and Economic Impacts .................................................................... 50
6.1 Business performance impacts ........................................................................................ 50
6.2 Economic impacts ............................................................................................................ 57
7 Wider Effects ........................................................................................................................ 63
7.1 Wider impacts on strategic partners ................................................................................. 63
7.2 Wider impacts of project partners .................................................................................... 63
8 Additionality of the projects ................................................................................................... 67
9 Assessment of the scheme .................................................................................................. 70
10 Key Findings ......................................................................................................................... 75
PACEC The Evaluation Team
Evaluation of the Collaborative Research and Development Programmes Page i
The Evaluation Team
This report has been prepared by PACEC on behalf of the Technology Strategy Board.
The PACEC project team included:
Rod Spires Project Director
Nic Boyns Project Manager
Matt Rooke Principal Consultant
Stephanie Wright Senior Consultant
Professor Alan Hughes, Director of the Centre for Business Research at the University of
Cambridge and Director of the Innovation Research Centre provided advice and assistance with
the analysis.
The Steering Group on the project included David Evans, Guy Ricketts, Julie Soutter and
Will Barton from the Technology Strategy Board, and Margaret Dennis from BIS.
Our thanks are extended to the technologists and other staff at the Technology Strategy Board,
the academic and business partners funded by CR&D grants and the wider stakeholders that
were consulted, including EPSRC, BIS, innovation and technology businesses and the Regional
Development Agencies (RDAs).
PACEC Executive Summary
Evaluation of the Collaborative Research and Development Programmes Page ii
Executive Summary
This executive summary sets out the aims of the evaluation and the conclusions
arising from the research reflecting these aims.
X1 Aims of the evaluation
X1.1 PACEC was commissioned by the Technology Strategy Board (TSB) in October 2010
to carry out an evaluation of the Collaborative Research and Development (CR&D)
Programme1. The aim of this evaluation is to assess the economic impact of CR&D,
its outputs, outcomes and economic impact, the wider benefits and the lessons that
can be learnt for developing similar programmes in the future. The specific aims of
the CR&D evaluation, in summary, are:
● To define a set of outcome metrics which provide a useful measure of the full benefits of the programme and are consistent with the Government’s expectations of Return on Investment (ROI) evaluation and targets
● To understand and quantify the direct and wider benefits that the programme has delivered from 2004 to 2011
● To ascertain the above at several layers of the hierarchy, including programme, project and sector levels through to partner types (i.e. businesses and academics) and national/international impacts
● To ascertain whether the potential impact has increased with the introduction of the challenge-led agenda to complement the technology inspired areas
● To ascertain whether an increase in support of smaller projects provides greater or lesser benefit
● To ascertain and quantify the benefits of using CR&D in conjunction with other instruments to deliver strategic and tactical objectives
● To ascertain the influence and impact of aligned partners and funding
● To ascertain the overall strategic value of CR&D in the role of the Technology Strategy Board and in support for innovation in the UK economy
● To identify and recommend where/how the CR&D can most effectively be used
X2 Rationale for CR&D
X2.1 CR&D forms part of a wider knowledge transfer and innovation support system and
within it brings together key partners from Higher Education Institutions (HEIs) and
businesses through their interaction focused on projects and the CR&D competitions
when held. The interactions are underpinned by the resources from other funders
including the Research Councils, the RDAs and other funding agencies and
government departments.
1 The team included Professor Anan Hughes, Director of the Centre for Business Research at the
University of Cambridge and Director of the Innovation Research Centre, who provided advice
and assisted with the analysis.
PACEC Executive Summary
Evaluation of the Collaborative Research and Development Programmes Page iii
X2.2 Within this context the aims of this group of CR&D projects, which have evolved since
its introduction in 2004, have been to:
● Encourage greater collaboration between businesses and academia
● Support projects which were likely to result in additional innovation, improve capability and had exploitation potential reflecting the business case.
X2.3 The market failure rationale is based on the premise that there is a funding gap owing
to the perceived risk and potential returns on R&D projects for businesses,
academics and financiers (potentially with excessive risk aversion) and a lack of
information on sources of finance coupled with a lack of understanding of business
capabilities to manage R&D and exploit it successfully.
X2.4 For the purposes of this evaluation the projects supported were grouped under two
headings – “enabling technology” and “market driven”. These corresponded to the
categories used by the then Department of Trade and Industry when the first projects
were started and, for the latter group, focus on particular sectors where projects
would be applied2.
X2.5 The enabling technologies are:
● Bioscience
● Electronics, Photonics and Electrical Systems
● High Value Manufacturing
● Information and Communications Technology
● Advanced Materials and Micro and Nanotechnologies
X2.6 The market application led sectors are:
● Creative Industries
● Environmental Sustainability
● Energy Generation and Supply
● Medicines and Healthcare
● Transport (Aerospace, Low Carbon Vehicles, Intelligent Transport Systems)
X3 Evaluation methodology
X3.1 In order to achieve the aims of the evaluation an integrated and customised research
programme was undertaken.
● An inception meeting. This was held to clarify the evaluation aims and the overall methodology, identify the background reports and the contact information for partners in projects and stakeholders.
2 This categorisation predates the Technology Strategy Board’s later focus on challenge led and
technology capability areas and there is little or no read across to the present categories used by
Technology Strategy Board.
PACEC Executive Summary
Evaluation of the Collaborative Research and Development Programmes Page iv
As part of the inception stage there were discussions with the Technology Strategy Board technologists who worked on the CR&D project appraisals and implementation
● A desk study, particularly focusing on the programme rationale and the management information for CR&D, focusing on the number of projects, the partners in each, the timing of awards and grant expenditure
● Interviews with wider stakeholders to help inform the design stage and their role in CR&D
● A survey and interviews with 336 CR&D participants for projects approved in the period 2004 to 2009 (i.e. achieved interviews with 259 businesses and 81 academics) that participated in 167 projects. There were follow-up interviews with partners in 30 projects
● Interviews with a comparison group of 205 CR&D unsupported bidders
X3.2 Analysis was undertaken using the PACEC in-house survey analysis system primarily
using an enhanced SPSS system. This consisted primarily of univariate analysis and
cross tabulations of data, which are shown as tables, charts and diagrams in the
report and the chapters which follow.
X4 Progress Towards Aims and Objectives
X4.1 This section draws on the results of the evaluation research to address the specific
aims of the evaluation set out above. Hence it marshals the evidence to answer the
questions.
To define a set of outcome metrics which provide a useful measure of the full benefits of the programme and are consistent with the Government’s expectations of Return on Investment (ROI) evaluation and targets.
● include economic measures such as Gross Value Added (GVA) and jobs, but also wider attitudinal, behavioural and spillover benefits including environmental and social benefits
● take into account the Green Book (HM Treasury’s guide to investment) and the original business case for CR&D
● assess additionality – i.e. the additional value of the Technology Strategy Board’s CR&D investment in relation to the outputs and behavioural changes
X4.2 The outcome metrics for the evaluation were defined with the Steering Group
reflecting the aims and objectives of CR&D and the guidelines on evaluations, in
particular the Green Book. The measures included outputs and outcomes as well as
wider effects to help ensure that the fullest possible impact of CR&D was identified.
The main metrics were as follows:
● Employment including the number of actual and likely full time equivalent (FTE) gross and net additional jobs created and safeguarded
● Gross value added (GVA) expressed as £s gross and net additional that were actual and were likely to result
● Changes in attitudes and behaviour measured by the percentage of CR&D supported partners who expressed a view in interview on the positive impact of their projects in relation to the following factors:
- Contributed to the costs of projects
PACEC Executive Summary
Evaluation of the Collaborative Research and Development Programmes Page v
- Helped share the risk of investment
- Strengthened collaborative activity: businesses / academics
- Provided access to technical and R&D skills
- Led to leading edge research
- Improved technical understanding and knowledge
- Improved attitudes to collaboration
- Allowed the technical feasibility of ideas to be assessed
- Allowed the application of technologies to take place
- Developed products and processes
- Produced social impacts
- Produced environmental impacts, such as more efficient use of energy and reduced carbon emissions
- Improved Technology Readiness Levels (TRLs)
- Resulted in products or services that were likely to reach the market
- Resulted in intellectual property and patents
- Levered in finance to enable products to be exploited
- Improved the image and reputation of partners
- Increased the value of businesses
- Increased employment
- Increased turnover
- Allowed businesses to enter new markets
- Increased publications and dissemination
- Resulted in impacts on customers, suppliers and competitors
- Dissemination of outputs
- Additionality of projects
- Satisfied partners
To understand and quantify the direct and wider benefits that the programme has delivered from 2004 to 2011
X4.3 CR&D is likely to generate a total of 13,350 net additional full time equivalent (FTE)
jobs. Of these, 8,900 jobs arise directly from CR&D with a further 4,450 arising from
the wider supply chain jobs and linkages. The cost per net additional job is £32,000
(or £36,000 in 2010 prices)3. CR&D is likely to generate net additional GVA of
£2.9bn. For each £1 of CR&D grant, there will be an increase in GVA of £6.71 (or
£5.75 in 2010 prices). There are likely to be additional impacts as the CR&D
technologies and knowledge is transferred as partners leave their projects or the
technology in the public domain feeds into other products, services and processes.
3 In the evaluation on Grants for R&D carried out by PACEC using a similar approach to the
CR&D evaluation, the net additional cost per job was £32k (in 2008 prices) and that for each £1 of
GRD there was an increase in GVA of £9.00. Evaluation of Grants for R&D and Smart (BIS.
2009). This shows that while CR&D was similar to GRD/Smart in terms of the relatively low cost
per job (£36k, compared with £32k), CR&D’s high level of GVA return on investment (£5.75) was
not as high as that achieved by GRD/Smart (£9.00).
PACEC Executive Summary
Evaluation of the Collaborative Research and Development Programmes Page vi
X4.4 Project participants identified the following as the main actual and likely attitudinal
and behavioural impacts arising from the projects (the percentages refer to the
proportion of those interviewed who identified the impact during interview):
● Contributed to the costs of projects. 90% of partners
● Helped share the risk of investment (85%)
● Strengthened collaborative activity with businesses (84%)
● Provided access to technical advice and R&D skills (67%) and academics (73%)
● Led to leading edge research (59%)
● Improved innovation, R&D skills and processes (92%)
● Improved the technical knowledge and understanding (84%)
● Improved attitudes to collaboration (84%)
● Allowed the application of technologies to be explored (93%)
● Allowed the technical feasibility of ideas to be assessed (83%)
● Developed products (70%) and processes (57%)
● Social impacts e.g. access to information/knowledge (78%)
● Beneficial environmental impacts, e.g. more efficient use of energy and reduced carbon emissions (71%)
● Technology Readiness Levels (TRLs): changes over the project period:
- Work on basic principles 30% to two per cent
- Work on operation one per cent to 20%.
● Products or services are likely to reach the market (83%)
● Intellectual property and patents registration (35%)
● Further finance obtained for exploitation (32%)
● Improved their image and reputation (79%)
● Increased value of businesses (62%)
● Increased employment (56%)
● Entered new markets (53%)
● Increased turnover (53%)
● Increase in publications and dissemination (42%)
● Wider project effects for customers of partners (48%), suppliers (17%) or competitors (13%)
● Wide dissemination of outputs: widely (69%)
● The additionality of projects: definitely / probably not gone ahead anyway (86%)
● Partners satisfied: wholly / largely (70%)
X4.5 The main wider effects (apart from benefits to the supply chain as a result of
purchases and the jobs that resulted) were on the customers of the CR&D partners.
The strongest impacts on customers, identified by 60% of partners, were on the
technology available to them, primarily in products and on innovation. Knowledge
was also disseminated and, in the main, to international audiences.
PACEC Executive Summary
Evaluation of the Collaborative Research and Development Programmes Page vii
To ascertain the above at several layers of the hierarchy, including programme, project and sector levels through to partner types (i.e. businesses and academics) and national/international impacts
X4.6 The results indicated that there was broadly the same level of impact (as measured
by cost per job or GVA) for the enabling technology and market led categories
identified at paragraph X2.4 above). While there is considerable variation between
the individual sectors, caution should be applied to drawing any firm conclusions due
to the relatively small sample sizes and due to the extreme Pareto effect where less
than a fifth of the projects (five per cent) produce more than four fifths (87%) of the
impacts.
X4.7 The fact that business performance effects in academic partners (£0.90 GVA per £
spent) are almost a tenth of those in businesses (£8.13) reflects the different roles
that academic and business partners play in projects. However, the benefit of
academic involvement is clearly demonstrated by the fact that the overall business
impacts in projects with two or more academic partners (£9.67) are more than double
those in projects with no academics (£4.22).
To ascertain whether an increase in support of smaller projects provides greater or lesser benefit
X4.8 The evaluation considered the relative impacts of smaller and larger projects by the
size and value of the grant and the number of partners in each project. The research
shows that:
● There is some evidence that grants over £750k give rise to smaller business performance effects (£2.34 of GVA per £ spent) than either grants under £250k (£10.96) or medium sized grants, between £250 and £749k (£10.01)
● There is some evidence that the optimal number of partners is 4 or 5, since these projects gave rise to greater business performance effects (£8.91 GVA per £ spent) than either those with only 2 or 3 partners (£4.81) or those with 6 or more partners (£6.57)
To ascertain and quantify the benefits of using CR&D in conjunction with other instruments to deliver strategic and tactical objectives
To ascertain the influence and impact of aligned partners and funding
X4.9 Some 14% of project partners had sought and, in the main, obtained additional
funding from public sector partners. The main instruments were RDA funding for
innovation, grants for R&D, and Research Council funding. However, it is not
possible to assess and quantify the extent to which these instruments brought
additional benefits to CR&D use. The percentages of partners using an individual
additional source of funding is relatively small (i.e. six per cent for GRD as the main
additional instrument used). Hence the additional impact is likely to have been
relatively small.
X4.10 CR&D is jointly funded with partners at a national and regional level who, over the
period of the projects selected for the evaluation, contributed some 6.5% of total
PACEC Executive Summary
Evaluation of the Collaborative Research and Development Programmes Page viii
direct funding and worked with CR&D staff to develop the strategy, judge applications
for funding and monitor projects (i.e. contributions in kind). This is likely to have an
influence on the impacts. On a straightforward attribution ratio related to the share of
funding, some 6.5% of the benefits could be the result of partners funding.
To ascertain the overall strategic value of CR&D in the role of the Technology Strategy Board and in support for innovation in the UK economy
● including examining the rationale for CR&D as per the original business case, the current validity, and whether the original business case objectives have been met.
● including the additionality achieved by CR&D funding
X4.11 The positive impacts of CR&D on the UK economy (e.g. jobs and GVA) help the
Technology Strategy Board achieve its aims and underpins its role. CR&D
encourages collaborative partnerships where they may not otherwise have occurred.
CR&D has created opportunities for businesses and academic partners by providing
finance which they would not otherwise have obtained. It has stimulated additional
UK business and academic collaboration through the project partnership
arrangements. CR&D has brought innovative business and academic partners
together to allow them to find technological solutions to issues, and develop and
exploit products and services.
X4.12 Hence the original business case for CR&D and the rationale are shown to be valid,
based on the evaluation evidence underpinned by the additional impacts
demonstrated.
To identify and recommend where/how the CR&D can most effectively be used
● for example by business sector, size of business, type of collaboration, size of grant and through synergies with other programmes
● identify the critical factors in creating successful projects / programmes
● identify conclusions and lessons for future CR&D application
X4.13 This research suggests that the most effective way in which CR&D can be used is:
● Through grants of up to £750k
● Through projects ideally of 5 to 6 partners
● Through projects with at least one academic partner
● In conjunction with other research and innovation programmes focused on business support and collaboration
● Retaining a balance between the enabling and market driven projects
● Continuing to give partners the opportunity to collaborate, share costs and risks and develop knowledge and skills for innovation
X4.14 Some points raised by small numbers of participants were:
● To simplify the application and the monitoring process and outputs required
PACEC Executive Summary
Evaluation of the Collaborative Research and Development Programmes Page ix
● Improve the industry and sector knowledge of the project liaison / monitoring officers
● Increase and encourage the opportunities for networking outwith the project partners and consider a brokering facility in the scheme
● Keep the level and amount of grant under review to ensure that partner requirements were met and the resources were available to support the research, prototyping and production stages of the projects, i.e. exploitation
● Ensure that the grant is paid quickly, especially for the smaller businesses where cashflow was critical in the current funding and economic environment
X4.15 Other suggestions made by strategic partners were to consult more on policy
changes and competition launches, streamline and shorten the application process
and ensure that the monitoring approach and guidance was more consistent.
X4.16 The implications of the evaluation evidence are that the economic impacts of CR&D
could be enhanced with the positive selection of funders bids and partners where the
impacts are more likely to occur and by making advice / support available at and
prior to the exploitation stage to take outputs to market (by the aims and capabilities
of partners and types of projects). Wider dissemination and positive engagement
could help to draw on other sources of funding, especially risk funding. Stronger
impacts, on balance, are more likely to arise from the medium to smaller grants and
the medium to larger business and academic partnerships.
X4.17 In terms of future evaluations of CR&D it is suggested that the partner contact details
are kept up to date as partners leave or join, that impact and learning issues are
covered in monitoring / post completion questionnaires to allow some of the impacts
to be tracked (including information on softer and harder impacts and further
investment), and that consideration is given to a longitudinal evaluation approach
including some regular interviews with project partners, especially because it takes
time for some of the impacts to feed through. This would allow a dialogue to be
developed with the partners and current issues to be picked up. Finally, more
systematic and methodologically consistent evaluations across the Technology
Strategy Board innovation programmes would allow benchmarking evidence to be
collected and comparisons made as to their relative performance and the extent to
which they meet Technology Strategy Board objectives, combined with the
requirement for any adjustments.
PACEC Introduction
Evaluation of the Collaborative Research and Development Programmes Page 1
1 Introduction
1.1 Aims of the evaluation
1.1.1 PACEC were commissioned by the Technology Strategy Board (TSB) in October
2010 to carry out an evaluation of the Collaborative Research and Development
(CR&D) Programme4. The aim of this evaluation is to assess the economic impact of
CR&D, its outputs, outcomes and economic impact, the wider benefits and lessons
that can be learnt for developing similar programmes in the future.
1.1.2 The specific aims of the CR&D evaluation are:
● To define a set of outcome metrics which provide a useful measure of the full benefits of the programme and are consistent with the Government’s expectations of Return on Investment (ROI) evaluation and targets
- include economic measures such as Gross Value Added (GVA) and jobs, but also wider attitudinal, behavioural and spillover benefits including environmental and social benefits
- take into account the Green Book (HM Treasury’s guide to investment) and the original business case for CR&D
- assess additionality – i.e. the additional value of the Technology Strategy Board’s CR&D investment in relation to the outputs and behavioural changes
● To understand and quantify the direct and wider benefits that the programme has delivered from 2004 to 2011
● To ascertain the above at several layers of the hierarchy, including programme, project and sector levels through to partner types (i.e. businesses and academics) and national/international impacts
● To ascertain whether the potential impact has increased with the introduction of the challenge-led agenda to complement the technology inspired areas
● To ascertain whether an increase in support of smaller projects provides greater or lesser benefit
● To ascertain and quantify the benefits of using CR&D in conjunction with other instruments to deliver strategic and tactical objectives
● To ascertain the influence and impact of aligned partners and funding
● To ascertain the overall strategic value of CR&D in the role of the Technology Strategy Board and in support for innovation in the UK economy
- including examining the rationale for CR&D as per the original business case, the current validity, and whether the original business case objectives have been met
- including the additionality achieved by CR&D funding
● To identify and recommend where/how the CR&D can most effectively be used
- for example by business sector, size of business, type of collaboration, size of grant and through synergies with other programmes
4 The team included Professor Anan Hughes, Director of the Centre for Business Research at the
University of Cambridge and Director of the Innovation Research Centre, who provided advice
and assisted with the analysis.
PACEC Introduction
Evaluation of the Collaborative Research and Development Programmes Page 2
- identify the critical factors in creating successful projects / programmes
- identify conclusions and lessons for future CR&D application
1.2 Rationale for CR&D
1.2.1 CR&D forms part of a wider knowledge transfer and innovation support system and
by encouraging collaboration. It brings together key partners from HEIs and
businesses with a focus on projects when the CR&D competitions when held. The
interactions are underpinned by the resources from other funders including the
Research Councils, the RDAs and other funding agencies and government
departments. The innovation system, as such, extends to the network of wider
collaborators, suppliers, customers and competitors of business and those who
benefit from the diffusion and wider dissemination of information. The funding of
collaboration brings about changes in attitudes, culture, behaviour towards innovation
(through improved skills and practices for collaboration) and innovation with the
subsequent exploitation of ideas, products/services and processes. From the
increased collaboration there are potential business performance benefits (e.g. jobs,
sales, profitability and growth) reflecting the improved competitiveness of partners
(particularly businesses) which ultimately bring about net economic and social
benefits for the UK economy.
1.2.2 The logic chain for CR&D in Figure 1.1 below illustrates the rationale (reflecting
market failures and aims), the theory of change, the inputs (expenditure on CR&D),
targets, and projects (with partners). It outlines the outputs (or intermediate benefits)
that result as changes in the attitudes and the behaviour and the R&D / innovation
practices of partners. These help underpin and determine the outcomes, i.e. the
improved business performance effects, the wider spillover effects, including
environmental benefits (from technology / innovation) and social benefits from
networks, exchanges of information, and greater communication. The economic
impacts result through changes in employment, the quality of jobs, incomes and
Gross Value Added (GVA) to the national economy. The logic chain also includes
efficiency and return on investment measures for CR&D (i.e. cost effectiveness and
cost benefit ratios) and provides for lessons learnt to assist with policy development.
PACEC Introduction
Evaluation of the Collaborative Research and Development Programmes Page 3
Figure 1.1 TSB. CR&D Logic Chain and Economic Impacts
Policy Rationale
-Market failure: funding gap owing to the perceived risk (potentially with
excessive risk aversion) and potential returns on R&D projects for
businesses, academic partners and financiers and a lack of information on
sources of finance, coupled with a lack of understanding of business
capabilities to manage and exploit R&D successfully
-The TSB Strategy. Connect and catalyse and ensure the UK is a global
leader in innovation and magnet for innovative businesses treating societal
and economic challenges as opportunities for innovative solutions to increase
economic growth and the quality of life
Economic Impacts
-Economic benefits for the UK
-Net increase in employment
turnover and Gross Value Added
-Cost effectiveness / costs and
benefits
-Lessons and improvements in
R&D outputs and capacity
Wider Spillover Effects
-Environmental benefits from innovation technology
-Social benefits from interactions, communications, exchanges
-Complementary links with other organisations providing
funding for innovation and R&D and leverage of additional
resources to support the innovation process
-Encouragement of funders to underwrite and support
innovation and commercialisation
Outcomes
-Enhanced
technology
-Product /
process
innovations
-Improved
business, and
academic
performance
(revenue,
leverage,
turnover,
employment)
Theory of Change
CR&D funding helps
ensure businesses and
HE can undertake R&D
to explore the
technology issues and
commercial feasibility of
innovative ideas, and
develop prototypes and
products/services for the
market.
Inputs
Total funding on
CR&D for
feasibility and
larger scale
research and
development
projects including
leverage of
additional finance
Projects
Finance to support
competitions /
challenge led CR&D
to enhance research
in key field, resulting
in increased
collaboration,
technical
knowledge, ipr,
products, services
and process.
Outputs
-Clarification of
technical issues
-Feasibility of ideas
-Technical
knowledge
-Prototypes
-Products /
services
1.2.3 For the purposes of this evaluation the projects supported were grouped under two
headings – “enabling technology” and “market driven”. These corresponded to the
categories used by the then DTI when the first projects were started and for the latter
group focus on particular sectors where projects would be applied5.
1.2.4 The enabling technologies are:
● Bioscience
● Electronics, Photonics and Electrical Systems
● High Value Manufacturing
● Information and Communications Technology
● Advanced Materials and Micro and Nanotechnologies
1.2.5 The market application led sectors are:
● Creative Industries
● Environmental Sustainability
● Energy Generation and Supply
5 This categorisation predates the Technology Strategy Board’s later focus on challenge led and
technology capability areas and there is little or no read across to the present categories used by
the Technology Strategy Board.
PACEC Introduction
Evaluation of the Collaborative Research and Development Programmes Page 4
● Medicines and Healthcare
● Transport (Aerospace, Low Carbon Vehicles, Intelligent Transport Systems)
1.3 Evaluation methodology
1.3.1 In order to achieve the aims of the evaluation, an integrated and customised research
programme was undertaken which involved a desk study of CR&D reports, interviews
with CR&D staff and funding partners and stakeholders, and survey research with the
participants in a sample of CR&D projects (as well as a survey of unsuccessful
bidders to form a comparison group).
1.3.2 The guiding principles of the research were to ensure that:
● A representative cross-section of CR&D projects and participants in them was obtained together with a sufficient number of interviews to provide confidence in the information obtained
● The achieved sample of projects was broadly representative by:
- Different types of project partners (i.e. businesses and academic)
- Challenge led and technology inspired projects
- Smaller/medium and larger projects by value
- CR&D projects that have been used with other instruments / support
- Feasibility and major projects
- Projects that had been completed for two years
- The time period from 2004 to early 2009 for projects
● Interviews were held with the most appropriate participants in the CR&D projects
● The views of different participants could be compared and contrasted on similar issues in order to triangulate and confirm / corroborate the research results
● The research provided both “harder” quantitative information (through the scale of the research and percentages of respondents expressing views) and “softer” qualitative information, for example reflecting attitudinal and behavioural changes and impacts that result from participating in CR&D
1.3.3 The research programme comprised the following linked tasks:
● The inception meeting. This was held to clarify the evaluation aims and the overall methodology, identify the background reports and the contact information for partners in projects and stakeholders
As part of the inception stage there were discussions with the TSB technologists who worked on the CR&D project appraisals and implementation
● A desk study, particularly focusing on the programme rationale and the management information for CR&D, focusing on the number of projects, the partners in each, the timing of awards and grant expenditure
● Interviews with wider stakeholders to help inform the design stage and their role in CR&D
● A survey and interviews with 336 CR&D participants for projects approved in the period 2004 to 2009 (i.e. achieved interviews with 256 businesses and 80 academics). The interviews were conducted with a representative sample of partners using a structured questionnaire which was designed with the
PACEC Introduction
Evaluation of the Collaborative Research and Development Programmes Page 5
Steering Group and piloted before the full fieldwork. A representative sample of follow up Interviews with 30 participants was carried out to obtain more detailed information on the nature of impacts
● Interviews with a comparison group of 206 CR&D unsupported bidders. Again a representative sample was selected and interviews held using a structured questionnaire which was designed with the Steering Group and piloted before the full fieldwork
1.4 Analysis of the research results
1.4.1 The quantified analysis of CR&D is in three parts:
a Analysis of all projects and participants in CR&D, based on the management information supplied by Technology Strategy Board.
b Analysis of the 336 respondents to the participants’ survey. This was weighted to ensure that it was representative by ten sectors (five market application led sectors, and the five enabling technologies) and by type of participant (academic and business). This process of weighting slightly increases the margins of error of the survey estimates from 5.3% to 5.8% (a margin of error associated with 282 un-weighted responses). The Effective Sample Size (ESS) of 282 in cases where all respondents answered a question is shown at the foot of each table.
c Analysis of 206 respondents to the non-participants’ survey. This was weighted to ensure that it had the same characteristics as the participants’ survey. Again, the process of weighting increases the margin of error on the survey estimates, in this case from seven per cent to 10% (a margin of error associated with 91 un-weighted responses). The Effective Sample Size (ESS) of 91 in cases where all respondents answered a question is shown at the foot of each table.
1.4.2 Analysis was undertaken using the PACEC in-house survey analysis system primarily
using an enhanced SPSS system. This consisted primarily of univariate analysis6
and cross tabulations of data which are shown as tables, in the chapters which follow.
Presentationally, the following conventions are observed:
● A number is shown in bold where, taking into account the margin of error due to sampling, we are 95% certain that it is different from the number in the left hand total column (using a Chi-Squared statistical test)
● Numbers in columns are shaded where the difference between those in that particular column and those not in that column is at least 10 (yellow), 25 (orange) or 50 (red) percentage points
1.4.3 The approach to estimating the total net impacts reflects HMT and BIS guidance and
is as follows:
6 Multivariate analysis was undertaken, but no significant effects on impacts were found apart
from size, where having organisations with fewer than 200 staff were more likely to experience a
significant impact in their products and processes.
PACEC Introduction
Evaluation of the Collaborative Research and Development Programmes Page 6
Figure 1.2 Estimating the net impacts of CR&D
Gross attributable impacts
(i.e. changes in GVA & employment as a result of CR&D)
Less
Deadweight – counterfactual
(i.e. changes that would have happened anyway)
Equals
Gross additional impact
(i.e. effects attributable to the CR&D)
Less
Displacement
(i.e. increases in GVA/employment at the expense of competitors)
Equals
Net additional effects
(or total measurable annual economic impacts without linkages and multipliers)
Plus
Linkages and multipliers
(i.e. effects due to purchases by businesses and their staff )
Equals
Full net additional effects
(or total measurable annual economic impacts)
Multiplied by
Average duration
(in the case of GVA, how many years the effect lasts)
Equals
Cumulative net effect
(i.e. total cumulative measurable economic impact)
Source: PACEC
1.5 Structure of the report
1.5.1 Following this introduction, the following chapter characterises the CR&D projects.
Chapter 3 reports on the project participants, Chapter 4 examines the objectives of
project partners. Chapter 5 sets out the intermediate impacts on the attitudes and
behaviour of CR&D funded partners and Chapter 6 examines the business
performance impacts of CR&D and its economic impacts, including cost
effectiveness. Chapter 7 examines the wider effects. Chapter 8 examines the
additionality of CR&D, Chapter 9 presents the views on how participants assess the
scheme and potential improvements, and Chapter 10 summarises the conclusions
from each chapter.
1.5.2 The appendices show the scope of the interviews and some of the detailed results.
PACEC Characterisation of Projects
Evaluation of the Collaborative Research and Development Programmes Page 7
2 Characterisation of Projects
2.1 Introduction
2.1.1 This chapter summarises the management information provided by the Technology
Strategy Board. It characterises the projects by a range of variables including size
and sector of grant. This information is useful in describing the population of projects,
and ensuring that our survey results are representative of the population. The
information will also be useful in analysing the survey results to examine and test
relationships between different types of projects and their relative outcomes and
levels of success.
2.2 Management information
2.2.1 The project-characterising variables which were made available to us via the
Technology Strategy Board management information are as follows:
● Size of grant
● Sector (enabling technology, market-led, and subsectors of these)
● Size of largest single grant of each project, as a share of all grants for that project
● Number of project partners
● Number of academic project partners
● Duration of project (months)
● Grant amount as a percentage of project costs (as a proxy for stage of R&D)
2.2.2 The tables in the remainder of this chapter set out an analysis of these variables in
terms of the number of projects and the total project funding in each category (for
example, high value manufacturing has 43 projects and £28M in grant funding).
2.2.3 Data provided from the Technology Strategy Board management information system
show a total of 253 enabling technology projects qualified for, and received, different
levels of grants. In terms of their numerical strength, the dominant sectors were
advanced materials and micro and nanotechnologies (77 projects or 30% of total
number of projects) and electronics, photonics and electrical systems (70 projects or
28%). The high value manufacturing sector accounted for 43 projects (17%), the
information and communications technology sector had 34 projects (13%), and the
bioscience sector, 29 projects (11%). See Table 2.1.
2.2.4 Table 2.2 shows that the 253 projects received a total £134 million in grants. In terms
of the total amount of grants received, projects in the advanced materials and micro
and nanotechnologies sector were dominant again, and had a 28% share of the grant
funding. They were followed, in order, by the high value manufacturing (21% of grant
funding), electronics, photonics and electrical systems (21%), information and
communications technology (18%) and bioscience (12%) sectors. The table also
shows that 70% of the projects qualified for either large (£500-999k) or very large
PACEC Characterisation of Projects
Evaluation of the Collaborative Research and Development Programmes Page 8
(£1m+) grants. However, in terms of the size of funds, it was projects involving high
value manufacturing that were the recipients of the largest grants. They accounted for
more than a third (34%) of very large grants.
Table 2.1 Number of enabling technology projects by sector
Number of enabling technology projects
by grant size /£
Sector Total Small
(<250k) Medium
(250-499k) Large (500-
999k) V Large (1m+)
High Value Manufacturing 43 12 10 13 8
Electronics, Photonics and Electrical Systems 70 21 25 22 2
Information and Communications Technology 34 5 8 14 7
Advanced Materials and Micro and Nanotechnologies 77 18 25 28 6
Bioscience 29 7 15 1 6
Total 253 63 83 78 29
Source: TSB management information, analysis by PACEC
Table 2.2 Expenditure on enabling technology projects by sector
Expenditure on enabling technology projects /£m
by grant size /£
Sector Total Small
(<250k) Medium
(250-499k) Large (500-
999k) V Large (1m+)
High Value Manufacturing 28 2 3 9 14
Electronics, Photonics and Electrical Systems 29 3 9 15 2
Information and Communications Technology 24 1 3 10 10
Advanced Materials and Micro and Nanotechnologies 38 3 9 18 7
Bioscience 16 1 6 1 8
Total 134 10 30 53 41
Source: TSB management information, analysis by PACEC
2.2.5 The number of projects that had generated products (or services) with market
application (i.e. recipient market-led projects) was smaller than the enabling
technology projects. A total of 143 projects were in this category. In numerical terms,
around a third of the market application projects (52 projects or 36%) were in the
energy generation and supply sector. More than a quarter (31%) were involved in
environmental sustainability projects while one in nine (11%) were in transport, one in
seven (13%) in creative industries, and around one in ten (eight per cent) in
medicines and healthcare sector. See Table 2.3.
PACEC Characterisation of Projects
Evaluation of the Collaborative Research and Development Programmes Page 9
Table 2.3 Number of market-application projects by sector
Number of market application projects
by grant size /£
Sector Total Small
(<250k) Medium
(250-499k) Large (500-
999k) V Large (1m+)
Medicines and Healthcare 11 1 4 6 0
Environmental Sustainability 45 13 18 12 2
Transport (Aerospace, Low Carbon Vehicles, Intelligent Transport Systems) 16 1 5 5 5
Creative Industries 19 19 0 0 0
Energy Generation and Supply 52 24 13 10 5
Total 143 58 40 33 12
Source: TSB management information, analysis by PACEC
2.2.6 The market application projects received a total of £61 million in grants. The energy
generation and supply projects accounted for around a third (35%) of the total grant
expenditure, followed closely by those involved with environmental sustainability
(32%). Transport projects accounted for around a fifth (22%), and medicines and
healthcare, nine per cent. Projects in the creative industries received on average
smaller grants. Although they made up more than 13% of the market-application
projects, they received two per cent of the total amount of grants given to this sector.
In terms of the size of grants, the largest beneficiaries were projects involving
transportation and energy generation and supply, which accounted for almost half of
the very large grants (£1m+).
Table 2.4 Expenditure on market-application projects by sector
Expenditure on market application projects /£m
by grant size /£
Sector Total Small
(<250k) Medium
(250-499k) Large (500-
999k) V Large (1m+)
Medicines and Healthcare 6 0 1 4 0
Environmental Sustainability 20 2 7 8 2
Transport (Aerospace, Low Carbon Vehicles, Intelligent Transport Systems) 13 0 2 4 7
Creative Industries 1 1 0 0 0
Energy Generation and Supply 21 4 5 6 6
Total 61 7 15 23 16
Source: TSB management information, analysis by PACEC
2.2.7 The Technology Strategy Board management information system provided summary
data for all the projects qualifying for a grant. The 396 technology enabling and
market application projects received a combined total of £195 million in grants. Table
2.5 splits the projects into categories in order to investigate the difference between
projects with a single dominant partner receiving the majority of the funding, and
those where funds were more evenly split between more partners. The table shows
the size of the largest grant awarded to one of the project partners as a share of the
PACEC Characterisation of Projects
Evaluation of the Collaborative Research and Development Programmes Page 10
total amount received by the project. In around one in seven projects (15%), more
than 80% of the disbursed funds went to a single partner. For around a quarter
(24%) of the projects, the largest single grant was less than 40% of the total amount
of funding disbursed.
Table 2.5 Number of projects by the share of funding taken up by the largest grant
Number of projects
by grant size /£
Size of largest grant / total grants Total
Small (<250k)
Medium (250-499k)
Large (500-999k)
V Large (1m+)
Less than 40% 96 6 30 41 19
40-59% 156 46 56 41 13
60-74% 85 35 21 23 6
80%+ 59 34 16 6 3
Total 396 121 123 111 41
Source: TSB management information, analysis by PACEC
2.2.8 Table 2.6 shows how much of the total expenditure on projects was allocated to each
type of funding distribution – that is, those with one partner receiving more than 80%
of the funding, those where the largest grant was less than 40% of the total, and so
on. The figures show that a third of the total amount of grants went to projects where
the largest partner grant was less than 40% of the total funding. Slightly more than a
third went to projects with the largest partner receiving between 40-59% of funding;
around a fifth (21%) to those with a partner receiving 60-74% of funding; and one in
ten (nine per cent), to those with a partner receiving 80% or more of funding. It is
notable that larger projects were less likely to have a single partner receiving 80% of
the funding and were more likely to have a wider and/or more even distribution
between partners where the largest grant was less than 40% of the total.
Table 2.6 Expenditure on projects by the share of funding taken up by the largest grant
Expenditure on projects /£m
by grant size /£
Size of largest grant / total grants Total
Small (<250k)
Medium (250-499k)
Large (500-999k)
V Large (1m+)
Less than 40% 65 1 11 27 25
40-59% 72 6 20 28 17
60-74% 41 5 8 16 12
80%+ 18 4 6 4 4
Total 195 17 45 75 57
Source: TSB management information, analysis by PACEC
2.2.9 Collaborative research and development forms part of the wider transfer and
innovation system and within it brings together key partners from higher education
institutions and businesses that interact on different projects. The Technology
Strategy Board management information system provided data which showed the
PACEC Characterisation of Projects
Evaluation of the Collaborative Research and Development Programmes Page 11
level of collaboration on the 396 projects. As can be seen from Table 2.7, one in six
projects (18%) was a collaboration involving two partners. Just over a fifth (23%)
involved three partners, and a similar proportion (20%) involved four partners.
Approximately one-fifth (19%) involved five or six partners, and an identical proportion
was a collaboration with seven or more partners.
Table 2.7 Number of projects by number of partners per project
Number of projects
by grant size /£
Number of partners Total Small
(<250k) Medium
(250-499k) Large (500-
999k) V Large (1m+)
2 72 (18%) 42 16 11 3
3 90 (23%) 38 26 21 5
4 80 (20%) 18 30 28 4
5,6 77 (19%) 13 32 23 9
7+ 77 (19%) 10 19 28 20
Total 396 121 123 111 41
Source: TSB management information, analysis by PACEC
2.2.10 There was a linear relationship between the number of partners on each project and
the amount of grants disbursed to the project, with larger grants going to projects with
more partners. Thus, for example, projects involving only two partners received about
a tenth of the £195 million disbursed. By comparison, the projects with seven or more
partners received around a third of the total amount of grant disbursed. See Table
2.8.
Table 2.8 Expenditure on projects by number of partners per project
Expenditure on projects /£m
by grant size /£
Number of partners Total Small
(<250k) Medium
(250-499k) Large (500-
999k) V Large (1m+)
2 22 6 6 7 4
3 35 5 9 14 7
4 38 3 11 19 6
5,6 42 2 12 16 12
7+ 58 1 8 19 29
Total 195 17 45 75 57
Source: TSB management information, analysis by PACEC
2.2.11 Table 2.9 shows that more than two-thirds of the projects (69%) were collaborative
ventures involving one or more academic partners. Indeed, around half of the 396
projects were collaborations with a single academic partner. The table also shows
that projects involving academic partners tended, on the whole, to receive larger
grants.
PACEC Characterisation of Projects
Evaluation of the Collaborative Research and Development Programmes Page 12
Table 2.9 Number of projects by number of academic partners per project
Number of projects
by grant size /£
Number of academic partners Total Small
(<250k) Medium
(250-499k) Large (500-
999k) V Large (1m+)
None 121 (31%) 60 35 17 9
One 195 (49%) 56 70 60 9
More than one 80 (20%) 5 18 34 23
Total 396 121 123 111 41
Source: TSB management information, analysis by PACEC
2.2.12 In terms of the amount of grant disbursed, Table 2.10 shows that projects involving
academic partners accounted for almost four-fifths (78%) of the total going to all
projects. The pattern observed earlier (in Table 2.9), of the award of larger grants to
projects involving academic partners, is seen demonstrated more clearly here. It is
particularly noticeable that projects with more than one academic partners accounted
for three-fifths of the largest recipients (i.e. more than £1 million).
Table 2.10 Expenditure on projects by number of academic partners per project
Expenditure on projects /£m
by grant size /£
Number of academic partners Total Small
(<250k) Medium
(250-499k) Large (500-
999k) V Large (1m+)
None 44 7 13 11 12
One 85 9 25 40 11
More than one 66 1 7 25 34
Total 195 17 45 75 57
Source: TSB management information, analysis by PACEC
2.2.13 The majority of the projects have been operating for at least two years. Table 2.11
shows that more than two out of five (44%) have been established for three years or
more. Here, too, there appeared to be a near-linear relationship between the duration
of the project and the size of grant received; such that the older the project, the larger
the size of the grant.
PACEC Characterisation of Projects
Evaluation of the Collaborative Research and Development Programmes Page 13
Table 2.11 Number of projects by duration of projects in months
Number of projects
by grant size /£
Duration /month Total Small
(<250k) Medium
(250-499k) Large (500-
999k) V Large (1m+)
1-23 60 (15%) 44 11 5 0
24 54 (14%) 28 16 10 0
25-35 108 (27%) 31 45 27 5
36 63 (16%) 9 19 23 12
>36 111 (28%) 9 32 46 24
Total 396 121 123 111 41
Source: TSB management information, analysis by PACEC
2.2.14 Table 2.12 shows the expenditure on the projects, according to how long each has
been established. The table confirms the earlier observation of a direct relationship
between the age of the project and the amount of grant received. More than 60% of
the £195 million went to projects that were three years or older. By comparison,
projects that were two years or younger received less than a fifth (14%) of the grants
awarded.
Table 2.12 Expenditure on projects by duration of projects in months
Expenditure on projects /£m
by grant size /£
Duration /month Total Small
(<250k) Medium
(250-499k) Large (500-
999k) V Large (1m+)
1-23 10 (5%) 4 4 3 0
24 17 (9%) 4 6 7 0
25-35 46 (24%) 5 16 18 6
36 41 (21%) 2 7 16 16
>36 80 (41%) 2 12 32 35
Total 195 17 45 75 57
Source: TSB management information, analysis by PACEC
2.2.15 Lastly, in this section, the Technology Strategy Board management information
system provided data about the contribution that grants made towards projects costs.
As can be seen from Table 2.13, the grants received made significant contributions
towards the costs associated with the projects. Indeed, two-thirds of the projects
(67% or 264 projects) had half or more of their costs covered by the grant they
received.
PACEC Characterisation of Projects
Evaluation of the Collaborative Research and Development Programmes Page 14
Table 2.13 Number of projects by Grant as share of project costs
Number of projects
by grant size /£
Grant as share of project costs Total Small
(<250k) Medium
(250-499k) Large (500-
999k) V Large (1m+)
Under 40% 69 (17%) 34 19 11 5
40-49% 63 (16%) 18 23 16 6
50% 163 (41%) 48 54 43 18
51-74% 91 (23%) 20 22 38 11
75%+ 10 (3%) 1 5 3 1
Total 396 121 123 111 41
Source: TSB management information, analysis by PACEC
2.2.16 Table 2.14 shows more clearly that 40% of the total amount of grant disbursed, was
won by projects in which grants formed half (50%) of the share of project costs. More
than a quarter (27%) of total grants, accounted for between 50% and 75% of the
share of the costs associated with the projects.
Table 2.14 Expenditure on projects by Grant as share of project costs
Expenditure on projects /£m
by grant size /£
Grant as share of project costs Total Small
(<250k) Medium
(250-499k) Large (500-
999k) V Large (1m+)
Under 40% 29 4 7 8 10
40-49% 31 3 8 11 8
50% 78 7 20 29 22
51-74% 52 3 8 25 15
75%+ 6 0 2 2 1
Total 195 17 45 76 57
Source: TSB management information, analysis by PACEC
PACEC Project Participants
Evaluation of the Collaborative Research and Development Programmes Page 15
3 Project Participants
PACEC undertook survey research with participants in a sample of successful
collaborative research and development projects, as well as unsuccessful bidders,
who formed a comparison group. Following the initial interviews, in-depth follow-up
case study interviews were also conducted with a subset of the successful bidders to
further examine the issues. This chapter presents the evidence from the survey
research. The description of the survey results follows the main topic areas covered
by the questionnaire.
3.1 Project details
3.1.1 PACEC completed interviews with respondents from a sample of more than 300
projects, which resulted in 336 useable responses. This section provides details
about the projects included in the survey. Responses are weighted to be
representative of the population by the ten sectors (five market application led
sectors, and the five enabling technologies) and by type of participant (academic and
business).
3.1.2 Almost three-quarters of the respondents (73%) indicated that the lead partner was
the main initiator of the project. See Table 3.1.
Table 3.1 The main initiator of the project was the lead partner
Percentage of all respondents (by Competition and Sector)
Recipient
All
Recipient Enable Tech
Recipient Market
Led Recipient Business
Recipient Academic
Non Recipient
All
Yes 73 75 70 75 66 79
No 22 19 28 20 29 9
Don’t know 5 6 3 5 5 12
Number of respondents (ESS*) 281 171 114 215 67 90
Source: PACEC CR&D survey (Q1A) – see section 1.4 for explanation of ESS, Bolding and Shading
3.1.3 By far the largest input of the respondent organisations to their projects was the
application of research. The contribution of almost three out of every five
organisations (59%) to the project was in the form of applied research. The other
input of note was product development, with one in six respondents citing this. Basic
research accounted for around a tenth of the overall input from the respondent
organisations. The disaggregated data, which is presented in Table 3.2, shows that,
not surprisingly, there was significant disparity between the academic and non-
academic organisations in their contribution of applied research to projects, with
academic recipients (78%) one-and-a-half times more likely than business recipients
(53%), to make such input to the collaborative partnership. On the other hand,
business recipients were more likely than academic recipients to contribute
significantly more towards product development.
PACEC Project Participants
Evaluation of the Collaborative Research and Development Programmes Page 16
Table 3.2 The nature of input to the collaborative partnership
Percentage of all respondents (by Competition and Sector)
Recipient
All
Recipient Enable Tech
Recipient Market
Led Recipient Business
Recipient Academic
Non Recipient
All
Basic research 9 10 9 8 15 10
Applied research 59 63 51 53 78 55
Product development 16 14 21 21 1 16
Commercialisation 2 1 2 2 0 4
Other 14 12 17 16 6 14
Number of respondents (ESS) 282 171 114 215 67 91
Source: PACEC CR&D survey (Q2) – see section 1.4 for explanation of ESS, Bolding and Shading
3.1.4 The case study interviewees were asked whether they had collaborated with their
partners prior to the competition, or if participation in the competition had led to
collaboration. In 41% of cases, collaboration led to competition entry; in 34% of
cases, competition led to collaboration. 16% of case study interviewees stated that
there was a mixture of pre- and post-competition collaboration, and nine per cent did
not recall. Statistically significant differences between pre-and post-competition
collaborators will be commented upon in the text below.
3.1.5 The survey explored relationships between the project partners. Table 3.3 shows that
the overwhelming majority of the respondents described the level of collaboration
between the partners as either significant (45%) or high (36%). With one in seven
respondents (16%) describing the level of collaboration as moderate, it is notable that
only few (three per cent) indicated that collaboration was low. Success in winning a
grant was also associated with good partnership. Responses from the control group
which had not received funding indicated weak collaboration with partners. Around
half of non-recipients (48%) suggested there was very low level collaboration
between the partners on their projects, and around two-fifths (39%), that the level (of
collaboration) was only moderate.
Table 3.3 Level of collaboration between the partners
Percentage of all respondents (by Competition and Sector)
Recipient
All
Recipient Enable Tech
Recipient Market
Led Recipient Business
Recipient Academic
Non Recipient
All
Significant 45 47 42 44 50 4
High 36 35 38 37 35 9
Moderate 16 15 17 17 12 39
Low 3 3 2 3 3 48
Number of respondents (ESS) 280 171 112 213 67 91
Source: PACEC CR&D survey (Q3) – see section 1.4 for explanation of ESS, Bolding and Shading
3.1.6 The case study interviewees were asked the ways in which partners had
collaborated. The most common forms of collaboration were sharing technical/R&D
skills (88% of respondents) and performing agreed tasks (81%), with sharing of
PACEC Project Participants
Evaluation of the Collaborative Research and Development Programmes Page 17
research and equipment also undertaken by 75% of respondents. Sharing of
commercialisation skills was less common, but was still reported by over half (56%) of
case study interviewees.
3.1.7 Among these forms of collaboration, the most important to success was seen as
sharing technical/R&D skills. This was reported as being critical to success by 63%
of case study respondents. There was a significant difference of opinion between
pre- and post- competition collaborators; only 36% of case study interviewees that
had entered the competition pre-collaboration viewed the sharing of technical and
R&D skills as critical to success, as against 69% of post-competition collaborators.
3.1.8 88% of case study firms viewed the relationship between the lead partner and other
partners in the project as “very good”, and the remainder viewed it as “good”.
3.2 Company background
3.2.1 Around half (51%) of the participating organisations described their status at the time
the project started, as independent businesses with no subsidiaries. Just over a fifth
(22%) were academic or higher education institutions. Fewer than one in ten (seven
per cent in each case) indicated they were either an independent business with
subsidiaries, a subsidiary of a UK owned business, or a subsidiary of an overseas
owned business. However, there was hardly any difference between the recipients
and non-recipients included in the survey, with regard to their status or ownership.
See Table 3.4.
Table 3.4 Status of partner organisation at the time the project started
Percentage of all respondents (by Competition and Sector)
Recipient
All
Recipient Enable Tech
Recipient Market
Led Recipient Business
Recipient Academic
Non Recipient
All
Independent business with no subsidiaries 51 49 56 65 0 47
Independent business with subsidiaries 7 8 5 9 0 5
Subsidiary of a UK owned business 8 7 9 10 0 6
Subsidiary of an overseas owned business 7 6 8 9 0 10
Joint venture 1 1 0 1 0 0
Associated company 1 1 0 1 0 2
Not trading / not yet a business 5 4 6 6 0 9
Academic institution 22 24 17 0 100 22
Number of respondents (ESS) 282 171 114 215 67 91
Source: PACEC CR&D survey (b4A1) – see section 1.4 for explanation of ESS, Bolding and Shading
3.2.2 There was only a slight change in the status of the respondent organisations at the
time of the survey, compared with the start of the project. The most notable change
was in the proportion of businesses with no subsidiaries, which had fallen slightly,
from 51% to 45%. But there was a corresponding increase in the number of
PACEC Project Participants
Evaluation of the Collaborative Research and Development Programmes Page 18
organisations indicating they were a subsidiary of overseas owned business (from
seven per cent at the start of the project to 11% currently). The changes in the status
of the other ownership types were marginal, and were reflected generally across both
competition (recipient business and academic) and sector (enabling technology or
market led). See Table 3.5.
Table 3.5 Current status of partner organisation
Percentage of all respondents (by Competition and Sector)
Recipient
All
Recipient Enable Tech
Recipient Market
Led Recipient Business
Recipient Academic
Non Recipient
All
Independent business with no subsidiaries 45 43 49 57 0 47
Independent business with subsidiaries 8 9 7 11 0 5
Subsidiary of a UK owned business 7 6 8 9 0 6
Subsidiary of an overseas owned business 11 10 13 14 0 10
Joint venture 1 1 0 1 0 0
Associated company 1 2 0 2 0 2
Not trading / not yet a business 5 5 6 7 0 9
Academic institution 22 24 17 0 100 22
Number of respondents (ESS) 281 170 114 214 67 91
Source: PACEC CR&D survey (b4A2) – see section 1.4 for explanation of ESS, Bolding and Shading
3.2.3 The majority of the recipient organisations at the start of the project were SMEs.
Around a fifth (19%) of them were micro businesses with fewer than ten employees.
One in seven (15%) employed 10-24 people, and more than a quarter (29%),
between 25 and 199 people. However, more than a third (35%) were large
organisations with more than 200 employees. There were significant differences in
the size between the sector and competition types. Organisations engaged in
enabling technology projects (39%) were more likely than those engaged in market
led projects (28%) to be large; and so were recipient academic institutions (55%),
compared with recipient businesses (30%). There was little difference, in terms of
size, between the recipient and non-recipient organisations. See Table 3.6.
PACEC Project Participants
Evaluation of the Collaborative Research and Development Programmes Page 19
Table 3.6 Employment in the partner business/dept at the start of the project
Percentage of all respondents (by Competition and Sector)
Recipient
All
Recipient Enable Tech
Recipient Market
Led Recipient Business
Recipient Academic
Non Recipient
All
None 0 0 0 0 0 0
1-4 11 10 14 11 11 13
5-9 8 6 14 10 3 8
10-24 15 17 13 19 4 19
25-199 29 28 32 30 27 23
200+ 35 39 28 30 55 38
Number of respondents (ESS) 282 171 114 215 67 91
Source: PACEC CR&D survey (Q5A1) – see section 1.4 for explanation of ESS, Bolding and Shading
3.2.4 Very few of the participating organisations (four per cent) indicated that they did not
have any employees engaged in research and development (R&D) at the start of the
project. It is interesting to note from Table 3.7 that the smaller organisations had
higher proportions of employees engaged in R&D. For example, almost two-fifths of
the organisations indicating they had R&D staff were micro businesses with 1-4
employees. The rest of all the recipient organisations employed near-identical
proportions of R&D staff. The disaggregated data show further that recipient market
led organisations (48%) were more likely than enabling technology ones (30%) to
employ R&D staff. With regard to sector, the larger recipient academic organisations
were more likely than their recipient business counterparts to have employees
engaged in R&D.
Table 3.7 R&D employment at the start of the project
Percentage of all respondents (by Competition and Sector)
Recipient
All
Recipient Enable Tech
Recipient Market
Led Recipient Business
Recipient Academic
Non Recipient
All
None 4 4 4 5 0 10
1-4 36 30 48 37 33 44
5-9 15 14 15 18 4 18
10-24 15 18 10 17 11 5
25-199 15 18 10 12 28 8
200+ 14 16 11 11 24 15
Number of respondents (ESS) 278 169 113 213 66 90
Source: PACEC CR&D survey (Q5A2) – see section 1.4 for explanation of ESS, Bolding and Shading
3.2.5 More than half of the businesses (55%) started trading before 2000, and around a
fifth (21%), after that date. The remaining 24% were academic institutions. As can be
seen from Table 3.8, recipient market led businesses were much younger than those
engaged with enabling technology. On the whole, the non-recipient businesses (the
comparison group) were older than the recipient businesses.
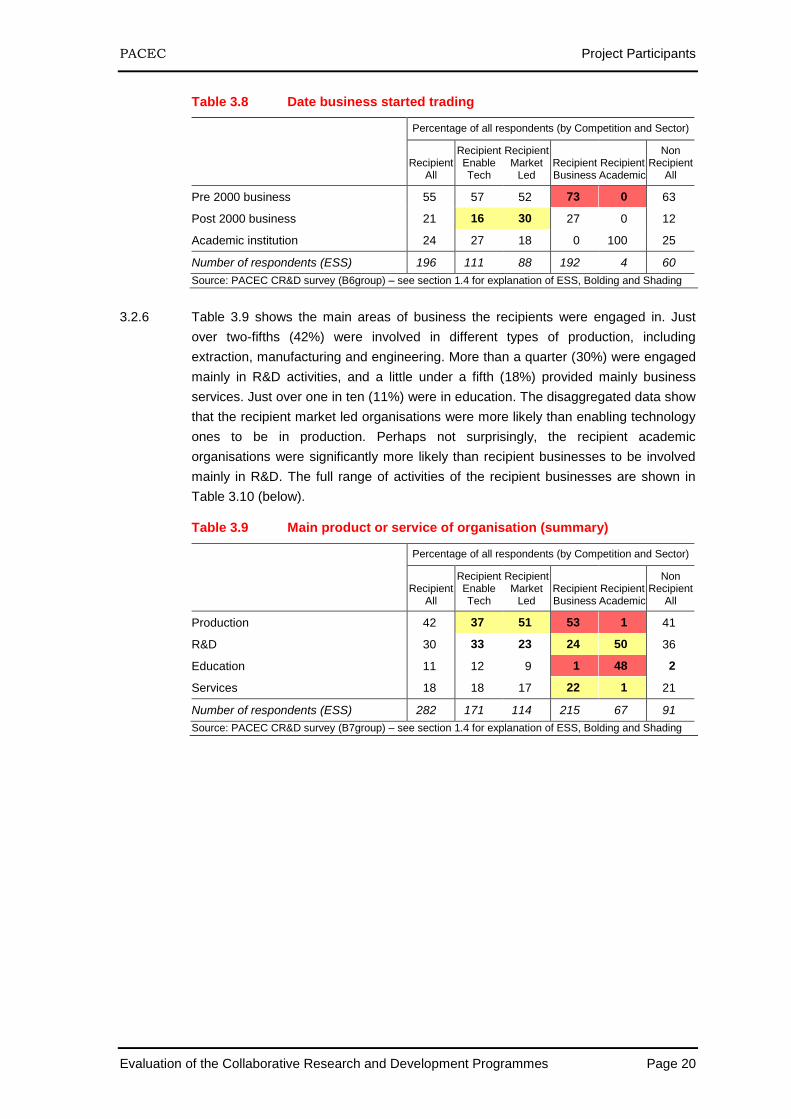
PACEC Project Participants
Evaluation of the Collaborative Research and Development Programmes Page 20
Table 3.8 Date business started trading
Percentage of all respondents (by Competition and Sector)
Recipient
All
Recipient Enable Tech
Recipient Market
Led Recipient Business
Recipient Academic
Non Recipient
All
Pre 2000 business 55 57 52 73 0 63
Post 2000 business 21 16 30 27 0 12
Academic institution 24 27 18 0 100 25
Number of respondents (ESS) 196 111 88 192 4 60
Source: PACEC CR&D survey (B6group) – see section 1.4 for explanation of ESS, Bolding and Shading
3.2.6 Table 3.9 shows the main areas of business the recipients were engaged in. Just
over two-fifths (42%) were involved in different types of production, including
extraction, manufacturing and engineering. More than a quarter (30%) were engaged
mainly in R&D activities, and a little under a fifth (18%) provided mainly business
services. Just over one in ten (11%) were in education. The disaggregated data show
that the recipient market led organisations were more likely than enabling technology
ones to be in production. Perhaps not surprisingly, the recipient academic
organisations were significantly more likely than recipient businesses to be involved
mainly in R&D. The full range of activities of the recipient businesses are shown in
Table 3.10 (below).
Table 3.9 Main product or service of organisation (summary)
Percentage of all respondents (by Competition and Sector)
Recipient
All
Recipient Enable Tech
Recipient Market
Led Recipient Business
Recipient Academic
Non Recipient
All
Production 42 37 51 53 1 41
R&D 30 33 23 24 50 36
Education 11 12 9 1 48 2
Services 18 18 17 22 1 21
Number of respondents (ESS) 282 171 114 215 67 91
Source: PACEC CR&D survey (B7group) – see section 1.4 for explanation of ESS, Bolding and Shading
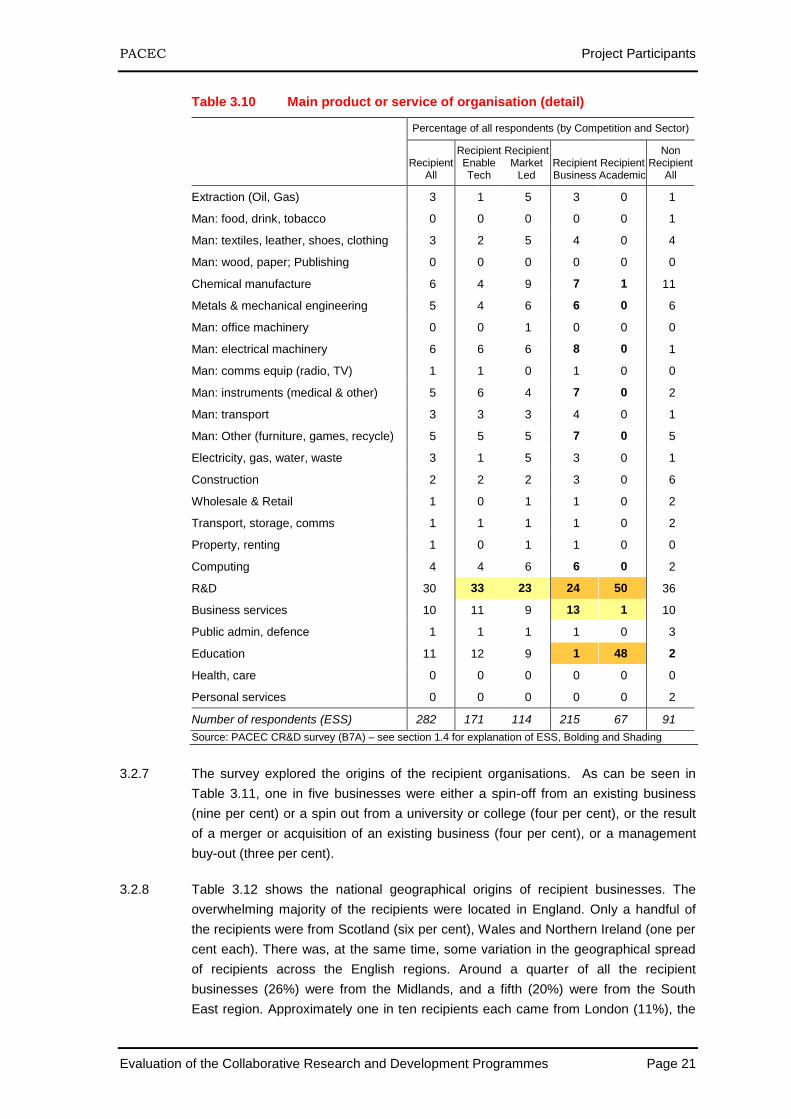
PACEC Project Participants
Evaluation of the Collaborative Research and Development Programmes Page 21
Table 3.10 Main product or service of organisation (detail)
Percentage of all respondents (by Competition and Sector)
Recipient
All
Recipient Enable Tech
Recipient Market
Led Recipient Business
Recipient Academic
Non Recipient
All
Extraction (Oil, Gas) 3 1 5 3 0 1
Man: food, drink, tobacco 0 0 0 0 0 1
Man: textiles, leather, shoes, clothing 3 2 5 4 0 4
Man: wood, paper; Publishing 0 0 0 0 0 0
Chemical manufacture 6 4 9 7 1 11
Metals & mechanical engineering 5 4 6 6 0 6
Man: office machinery 0 0 1 0 0 0
Man: electrical machinery 6 6 6 8 0 1
Man: comms equip (radio, TV) 1 1 0 1 0 0
Man: instruments (medical & other) 5 6 4 7 0 2
Man: transport 3 3 3 4 0 1
Man: Other (furniture, games, recycle) 5 5 5 7 0 5
Electricity, gas, water, waste 3 1 5 3 0 1
Construction 2 2 2 3 0 6
Wholesale & Retail 1 0 1 1 0 2
Transport, storage, comms 1 1 1 1 0 2
Property, renting 1 0 1 1 0 0
Computing 4 4 6 6 0 2
R&D 30 33 23 24 50 36
Business services 10 11 9 13 1 10
Public admin, defence 1 1 1 1 0 3
Education 11 12 9 1 48 2
Health, care 0 0 0 0 0 0
Personal services 0 0 0 0 0 2
Number of respondents (ESS) 282 171 114 215 67 91
Source: PACEC CR&D survey (B7A) – see section 1.4 for explanation of ESS, Bolding and Shading
3.2.7 The survey explored the origins of the recipient organisations. As can be seen in
Table 3.11, one in five businesses were either a spin-off from an existing business
(nine per cent) or a spin out from a university or college (four per cent), or the result
of a merger or acquisition of an existing business (four per cent), or a management
buy-out (three per cent).
3.2.8 Table 3.12 shows the national geographical origins of recipient businesses. The
overwhelming majority of the recipients were located in England. Only a handful of
the recipients were from Scotland (six per cent), Wales and Northern Ireland (one per
cent each). There was, at the same time, some variation in the geographical spread
of recipients across the English regions. Around a quarter of all the recipient
businesses (26%) were from the Midlands, and a fifth (20%) were from the South
East region. Approximately one in ten recipients each came from London (11%), the
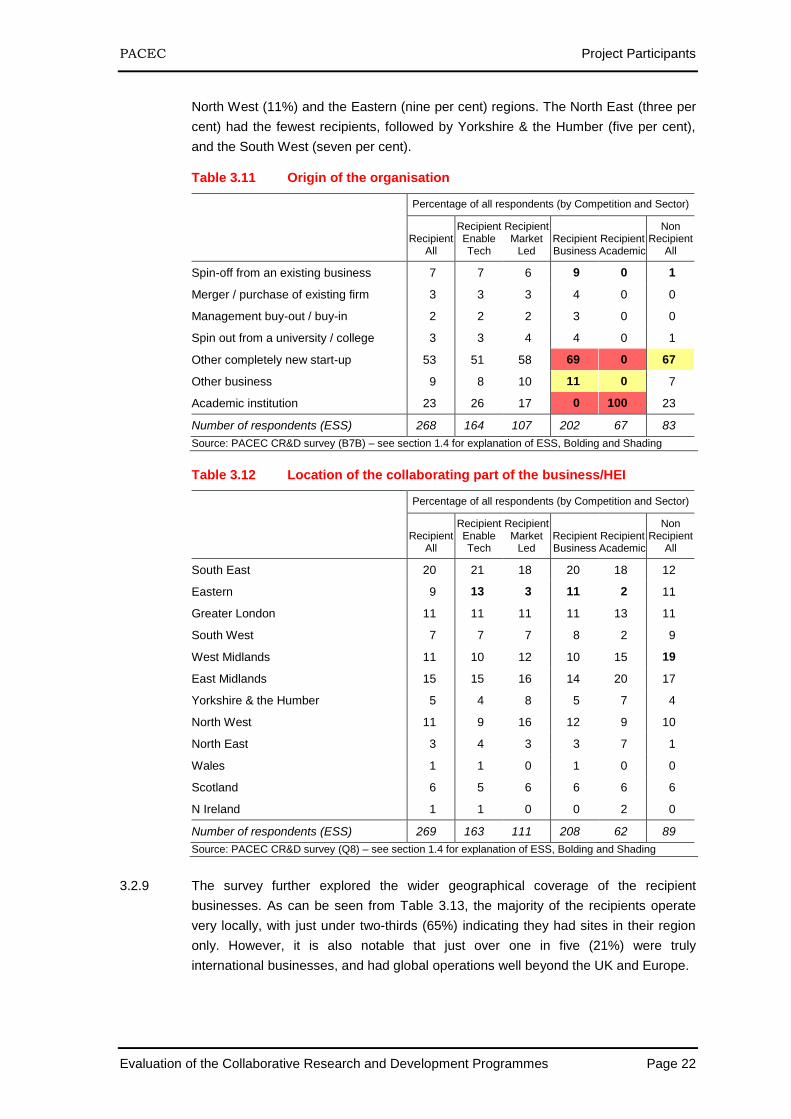
PACEC Project Participants
Evaluation of the Collaborative Research and Development Programmes Page 22
North West (11%) and the Eastern (nine per cent) regions. The North East (three per
cent) had the fewest recipients, followed by Yorkshire & the Humber (five per cent),
and the South West (seven per cent).
Table 3.11 Origin of the organisation
Percentage of all respondents (by Competition and Sector)
Recipient
All
Recipient Enable Tech
Recipient Market
Led Recipient Business
Recipient Academic
Non Recipient
All
Spin-off from an existing business 7 7 6 9 0 1
Merger / purchase of existing firm 3 3 3 4 0 0
Management buy-out / buy-in 2 2 2 3 0 0
Spin out from a university / college 3 3 4 4 0 1
Other completely new start-up 53 51 58 69 0 67
Other business 9 8 10 11 0 7
Academic institution 23 26 17 0 100 23
Number of respondents (ESS) 268 164 107 202 67 83
Source: PACEC CR&D survey (B7B) – see section 1.4 for explanation of ESS, Bolding and Shading
Table 3.12 Location of the collaborating part of the business/HEI
Percentage of all respondents (by Competition and Sector)
Recipient
All
Recipient Enable Tech
Recipient Market
Led Recipient Business
Recipient Academic
Non Recipient
All
South East 20 21 18 20 18 12
Eastern 9 13 3 11 2 11
Greater London 11 11 11 11 13 11
South West 7 7 7 8 2 9
West Midlands 11 10 12 10 15 19
East Midlands 15 15 16 14 20 17
Yorkshire & the Humber 5 4 8 5 7 4
North West 11 9 16 12 9 10
North East 3 4 3 3 7 1
Wales 1 1 0 1 0 0
Scotland 6 5 6 6 6 6
N Ireland 1 1 0 0 2 0
Number of respondents (ESS) 269 163 111 208 62 89
Source: PACEC CR&D survey (Q8) – see section 1.4 for explanation of ESS, Bolding and Shading
3.2.9 The survey further explored the wider geographical coverage of the recipient
businesses. As can be seen from Table 3.13, the majority of the recipients operate
very locally, with just under two-thirds (65%) indicating they had sites in their region
only. However, it is also notable that just over one in five (21%) were truly
international businesses, and had global operations well beyond the UK and Europe.
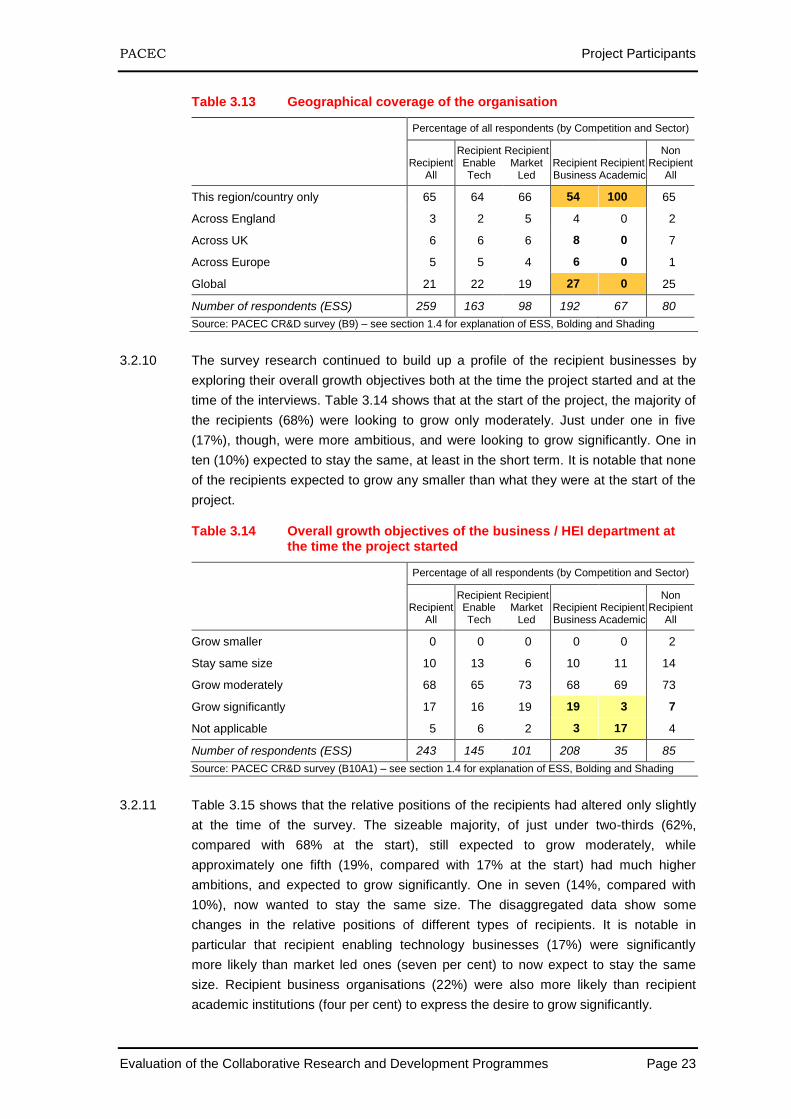
PACEC Project Participants
Evaluation of the Collaborative Research and Development Programmes Page 23
Table 3.13 Geographical coverage of the organisation
Percentage of all respondents (by Competition and Sector)
Recipient
All
Recipient Enable Tech
Recipient Market
Led Recipient Business
Recipient Academic
Non Recipient
All
This region/country only 65 64 66 54 100 65
Across England 3 2 5 4 0 2
Across UK 6 6 6 8 0 7
Across Europe 5 5 4 6 0 1
Global 21 22 19 27 0 25
Number of respondents (ESS) 259 163 98 192 67 80
Source: PACEC CR&D survey (B9) – see section 1.4 for explanation of ESS, Bolding and Shading
3.2.10 The survey research continued to build up a profile of the recipient businesses by
exploring their overall growth objectives both at the time the project started and at the
time of the interviews. Table 3.14 shows that at the start of the project, the majority of
the recipients (68%) were looking to grow only moderately. Just under one in five
(17%), though, were more ambitious, and were looking to grow significantly. One in
ten (10%) expected to stay the same, at least in the short term. It is notable that none
of the recipients expected to grow any smaller than what they were at the start of the
project.
Table 3.14 Overall growth objectives of the business / HEI department at the time the project started
Percentage of all respondents (by Competition and Sector)
Recipient
All
Recipient Enable Tech
Recipient Market
Led Recipient Business
Recipient Academic
Non Recipient
All
Grow smaller 0 0 0 0 0 2
Stay same size 10 13 6 10 11 14
Grow moderately 68 65 73 68 69 73
Grow significantly 17 16 19 19 3 7
Not applicable 5 6 2 3 17 4
Number of respondents (ESS) 243 145 101 208 35 85
Source: PACEC CR&D survey (B10A1) – see section 1.4 for explanation of ESS, Bolding and Shading
3.2.11 Table 3.15 shows that the relative positions of the recipients had altered only slightly
at the time of the survey. The sizeable majority, of just under two-thirds (62%,
compared with 68% at the start), still expected to grow moderately, while
approximately one fifth (19%, compared with 17% at the start) had much higher
ambitions, and expected to grow significantly. One in seven (14%, compared with
10%), now wanted to stay the same size. The disaggregated data show some
changes in the relative positions of different types of recipients. It is notable in
particular that recipient enabling technology businesses (17%) were significantly
more likely than market led ones (seven per cent) to now expect to stay the same
size. Recipient business organisations (22%) were also more likely than recipient
academic institutions (four per cent) to express the desire to grow significantly.
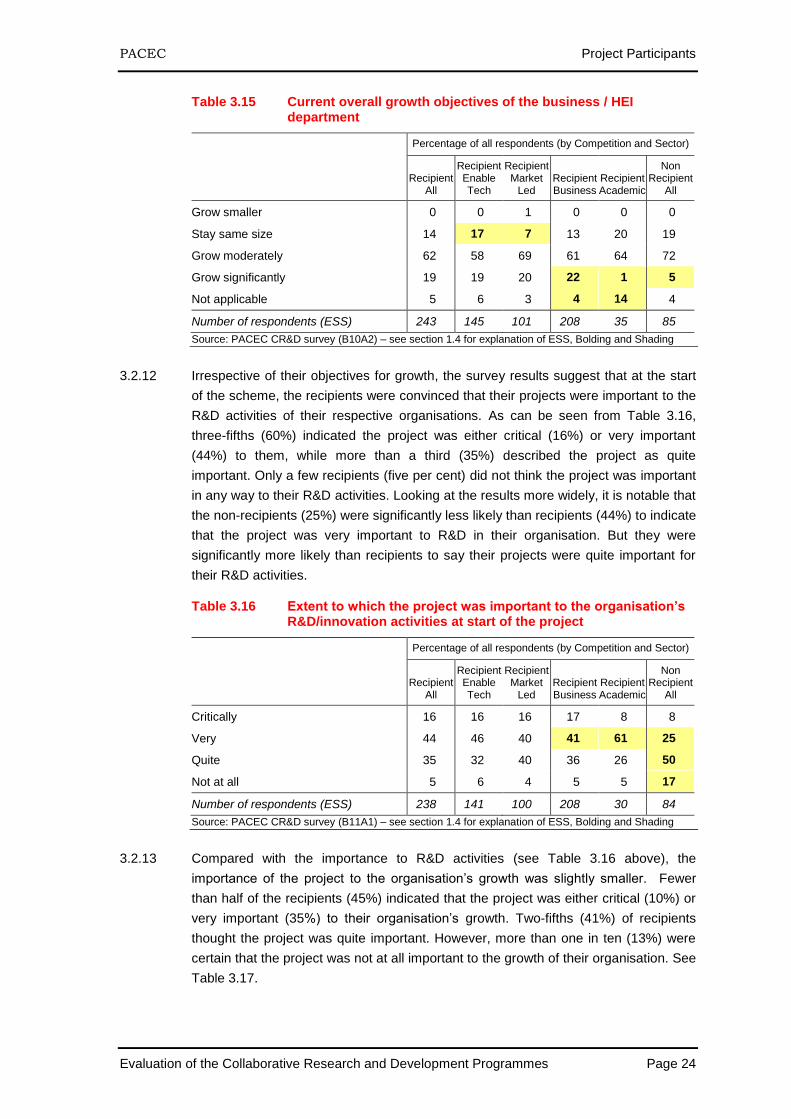
PACEC Project Participants
Evaluation of the Collaborative Research and Development Programmes Page 24
Table 3.15 Current overall growth objectives of the business / HEI department
Percentage of all respondents (by Competition and Sector)
Recipient
All
Recipient Enable Tech
Recipient Market
Led Recipient Business
Recipient Academic
Non Recipient
All
Grow smaller 0 0 1 0 0 0
Stay same size 14 17 7 13 20 19
Grow moderately 62 58 69 61 64 72
Grow significantly 19 19 20 22 1 5
Not applicable 5 6 3 4 14 4
Number of respondents (ESS) 243 145 101 208 35 85
Source: PACEC CR&D survey (B10A2) – see section 1.4 for explanation of ESS, Bolding and Shading
3.2.12 Irrespective of their objectives for growth, the survey results suggest that at the start
of the scheme, the recipients were convinced that their projects were important to the
R&D activities of their respective organisations. As can be seen from Table 3.16,
three-fifths (60%) indicated the project was either critical (16%) or very important
(44%) to them, while more than a third (35%) described the project as quite
important. Only a few recipients (five per cent) did not think the project was important
in any way to their R&D activities. Looking at the results more widely, it is notable that
the non-recipients (25%) were significantly less likely than recipients (44%) to indicate
that the project was very important to R&D in their organisation. But they were
significantly more likely than recipients to say their projects were quite important for
their R&D activities.
Table 3.16 Extent to which the project was important to the organisation’s R&D/innovation activities at start of the project
Percentage of all respondents (by Competition and Sector)
Recipient
All
Recipient Enable Tech
Recipient Market
Led Recipient Business
Recipient Academic
Non Recipient
All
Critically 16 16 16 17 8 8
Very 44 46 40 41 61 25
Quite 35 32 40 36 26 50
Not at all 5 6 4 5 5 17
Number of respondents (ESS) 238 141 100 208 30 84
Source: PACEC CR&D survey (B11A1) – see section 1.4 for explanation of ESS, Bolding and Shading
3.2.13 Compared with the importance to R&D activities (see Table 3.16 above), the
importance of the project to the organisation’s growth was slightly smaller. Fewer
than half of the recipients (45%) indicated that the project was either critical (10%) or
very important (35%) to their organisation’s growth. Two-fifths (41%) of recipients
thought the project was quite important. However, more than one in ten (13%) were
certain that the project was not at all important to the growth of their organisation. See
Table 3.17.
PACEC Project Participants
Evaluation of the Collaborative Research and Development Programmes Page 25
Table 3.17 Extent to which the project was important to the organisation’s growth
Percentage of all respondents (by Competition and Sector)
Recipient
All
Recipient Enable Tech
Recipient Market
Led Recipient Business
Recipient Academic
Non Recipient
All
Critically 10 10 11 11 9 7
Very 35 37 33 36 28 29
Quite 41 39 43 42 31 45
Not at all 13 14 13 12 32 20
Number of respondents (ESS) 232 138 97 209 23 84
Source: PACEC CR&D survey (B11A2) – see section 1.4 for explanation of ESS, Bolding and Shading
3.3 Further collaboration
3.3.1 66% of case study interviewees are collaborating with at least some of their partners
on a continuation of their project, and 13% are collaborating with all the partners.
Those partners who started collaborating after entry into the competition are far more
likely to be working with their partners on a continuation of the project; 91% are doing
so, as against 38% of partners whose collaborative activity took place before the
competition. This is a rather striking result – it may be that the competition tended to
forge longer-lasting partnerships, but part of the explanation for the result may simply
be that partnerships tend to have a characteristic length, and the ones which started
earlier may be more likely to finish earlier.
3.3.2 44% of case study interviewees are collaborating with at least some of their partners
on a new project. Six per cent have involved all their partners in a new project. 84%
view their relationships with other partners as “very good”, and the remainder as
“good”.
3.3.3 53% of case study interviewees stated that their project has made them “much more
likely” to engage in future collaboration, and 31% stated that collaboration was “more
likely”. 13% stated that there had been no change in their likelihood to collaborate,
and only three per cent felt that future collaboration had become less likely as a result
of the project.
PACEC Objectives of Project Partners
Evaluation of the Collaborative Research and Development Programmes Page 26
4 Objectives of Project Partners
4.1.1 The survey sought to find out more about why the recipient organisations and their
partners took part in the projects, and why they had also sought funding from the
CR&D scheme. They were asked, first, about their objectives in participating in the
project, i.e. what they wanted to achieve by taking part. Those objectives were
grouped under specific areas of business activity, including costs, R&D collaboration,
innovation and skills processes, the application of technology, development of
products and processes, and anticipated final outcomes. Table 4.1 provides a
summary of the responses, and shows that all the delineated areas of business
activity were quite important for the vast majority of recipients.
Table 4.1 Overall objectives in participating in the project
Percentage of all respondents (by Competition and Sector)
Recipient
All
Recipient Enable Tech
Recipient Market
Led Recipient Business
Recipient Academic
Non Recipient
All
Costs 80 79 80 80 78 79
R&D Collaboration 80 80 81 82 75 46
Innovation / R&D skills and processes 82 81 85 85 74 56
Technological applications 88 88 89 87 91 69
Products and processes 89 88 91 91 82 77
Final overriding objectives 68 63 78 73 52 20
Number of respondents (ESS) 282 171 114 215 67 88
Respondents could select several options; so percentages in any column may sum to more than 100. Source: PACEC CR&D survey (Q12A) – see section 1.4 for explanation of ESS, Bolding and Shading
4.1.2 The breakdown of these overall objectives is explored in detail. With regard to costs,
shown below, almost three-quarters of the recipients indicated they wanted to share
the risk of their investment in R&D. But almost two-fifths (38%) wanted to use the
project to lever in other private sector finance to help the development of the project.
This was particularly true of the market led projects. The disaggregated data show
that, on the whole, the non-recipient businesses were less likely than recipients to
use the scheme to share the risk of investment in R&D, and significantly less so to
lever in other private sector finance. See Table 4.2.
Table 4.2 Cost objectives of the organisation
Percentage of all respondents (by Competition and Sector)
Recipient
All
Recipient Enable Tech
Recipient Market
Led Recipient Business
Recipient Academic
Non Recipient
All
Costs (any) 80 79 80 80 78 79
Share risk of R&D investment 73 72 76 75 68 64
Lever in finance 38 36 42 38 36 17
Other 2 2 2 2 2 0
Number of respondents (ESS) 282 171 114 215 67 88
Respondents could select several options; so percentages in any column may sum to more than 100. Source: PACEC CR&D survey (Q12A) – see section 1.4 for explanation of ESS, Bolding and Shading
PACEC Objectives of Project Partners
Evaluation of the Collaborative Research and Development Programmes Page 27
4.1.3 The recipients’ motivation for R&D collaboration varied widely, although five factors
stood out. More than half (55%) wanted to use the scheme to access technical and
other research and development skills. Over two-fifths (44%) thought it would enable
them to strengthen collaborative activity with other businesses, and approximately a
third (32%), collaborative activity with higher education institutions. Just over a
quarter (28%) hoped collaboration would provide them access to leading edge
research, and about one in five (19%), access to equipment and research
infrastructure. Table 4.3 sets out the range of factors influencing R&D collaboration.
Table 4.3 Factors influencing R&D collaboration
Percentage of all respondents (by Competition and Sector)
Recipient
All
Recipient Enable Tech
Recipient Market
Led Recipient Business
Recipient Academic
Non Recipient
All
R&D Collaboration (any) 80 80 81 82 75 46
Access commercialisation skills 13 16 7 13 10 3
Access technical / R&D skills 55 54 56 60 35 30
Access leading edge research 28 29 25 30 19 7
Access equipment and research infrastructure 19 19 19 22 10 3
Strengthen collaborative activity with businesses 44 47 38 42 50 10
Strengthen collaborative activity with HEIs 32 30 35 36 18 5
Improve HEI enterprise/entrepreneurial curriculum 8 7 8 3 24 0
Provide placements/sponsorship for research students 5 5 7 2 17 1
Change business model 2 2 3 3 0 0
Other 5 4 7 5 4 0
Number of respondents (ESS) 282 171 114 215 67 88
Respondents could select several options; so percentages in any column may sum to more than 100. Source: PACEC CR&D survey (Q12B) – see section 1.4 for explanation of ESS, Bolding and Shading
4.1.4 Table 4.4 shows the objectives of the recipients for innovation and other skills and
processes. Here, the dominant motivation of the majority (64%) was the need to
improve their technical skills. This was followed by the desire to enhance knowledge
transfer across the business or education institution (51%), and to improve their
technical knowledge and understanding. Two-fifths of the recipients (40%) wanted to
use the project to improve the culture of their organisation towards overall
collaboration, and around a third (34%), to improve their innovation culture in
particular.
PACEC Objectives of Project Partners
Evaluation of the Collaborative Research and Development Programmes Page 28
Table 4.4 Innovation/R&D skills and process objectives
Percentage of all respondents (by Competition and Sector)
Recipient
All
Recipient Enable Tech
Recipient Market
Led Recipient Business
Recipient Academic
Non Recipient
All
Innovation / R&D skills & processes (any) 82 81 85 85 74 56
Improve commercialisation skills 13 12 14 13 12 1
Improve technical /R&D skills 64 63 68 66 58 44
Improve technical knowledge / understanding 49 50 47 52 39 20
Enhance equipment & research infrastructure 14 14 15 14 15 4
Enhance knowledge transfer across the business/HEI 51 51 50 50 52 25
Improve collaboration (culture/capability) 40 38 42 41 33 4
Improve innovation culture/capacity 34 31 40 35 32 2
Other 1 1 0 1 0 0
Number of respondents (ESS) 282 171 114 215 67 88
Respondents could select several options; so percentages in any column may sum to more than 100. Source: PACEC CR&D survey (Q12C) – see section 1.4 for explanation of ESS, Bolding and Shading
4.1.5 The principal objective of the recipients regarding the application of technology was to
develop new scientific or technical knowledge applications. Almost two-thirds of all
recipients (64%) cited this. More than half (55%) were less specific, but indicated they
wanted to use the project more generally to explore the application of different
technologies. Other recipients were more specific in their intent, and around half
(49%) were looking to use the project to investigate the technical feasibility of ideas,
and around a quarter (24%), to investigate the commercial feasibility of an idea. See
Table 4.5.
Table 4.5 Technological application objectives
Percentage of all respondents (by Competition and Sector)
Recipient
All
Recipient Enable Tech
Recipient Market
Led Recipient Business
Recipient Academic
Non Recipient
All
Technological applications (any) 88 88 89 87 91 69
Produce new scientific/technical knowledge 64 68 58 60 80 57
Explore the application of technologies 55 58 50 52 65 48
Investigate the technical feasibility of an idea(s) 49 48 49 48 51 16
Investigate the commercial feasibility of an idea 24 26 20 25 18 12
Other 1 1 2 1 2 0
Number of respondents (ESS) 282 171 114 215 67 88
Respondents could select several options; so percentages in any column may sum to more than 100. Source: PACEC CR&D survey (Q12D) – see section 1.4 for explanation of ESS, Bolding and Shading
PACEC Objectives of Project Partners
Evaluation of the Collaborative Research and Development Programmes Page 29
4.1.6 Two factors stood out in particular, with regard to the recipients’ objectives for
products and processes. Three-fifths (59%) of all recipients indicated they wanted to
use the project to develop new products or services, but almost half (48%) suggested
they wanted to use the project to reduce the environmental impact of existing
practices and activities. The other important factors, mentioned by at least a fifth of
the recipients were developing new processes (26%), making a positive social impact
(23%), and improving existing products or services. See Table 4.6.
Table 4.6 Product and process objectives
Percentage of all respondents (by Competition and Sector)
Recipient
All
Recipient Enable Tech
Recipient Market
Led Recipient Business
Recipient Academic
Non Recipient
All
Products and processes (any) 89 88 91 91 82 77
Develop new product/service(s) 59 57 63 59 60 51
Improve existing product/service(s) 22 24 17 24 14 24
Develop new process(es) 26 26 24 26 24 27
Improve existing process(es) 12 13 8 12 11 12
Reduce environmental impact 48 47 51 50 41 37
Have a positive social impact 23 22 24 24 20 22
Meet regulatory requirements 12 12 14 12 15 12
Other 1 0 1 1 0 1
Number of respondents (ESS) 282 171 114 215 67 88
Respondents could select several options; so percentages in any column may sum to more than 100. Source: PACEC CR&D survey (Q12E) – see section 1.4 for explanation of ESS, Bolding and Shading
4.1.7 On the whole, the partners were less definitive about having a specific final or
overriding objective for participating in the project. Instead, they hoped participation
would help them achieve a number of specific goals. Around one in three hoped that
the project would help them increase the value of their business (37%); improve the
image and reputation of their business or academic institution (34%); enter new
markets or increase their market share (30%). About one in four hoped participation
would help them to increase their turnover (26%), or increase their profits (24%) and
one in five (21%) to increase employment. See Table 4.7.
PACEC Objectives of Project Partners
Evaluation of the Collaborative Research and Development Programmes Page 30
Table 4.7 The final objectives of the organisation
Percentage of all respondents (by Competition and Sector)
Recipient
All
Recipient Enable Tech
Recipient Market
Led Recipient Business
Recipient Academic
Non Recipient
All
Final objectives (any) 68 63 78 73 52 20
Start up a spin-off business 2 2 3 2 2 0
Position the bus/HEI for merger acquisition 2 2 2 2 1 3
Enter new markets or increased market share 30 29 33 37 7 2
Increase export sales (or start exporting) 12 12 11 14 2 1
Increase income from intellectual property 17 15 21 18 11 1
Increased publications 13 13 11 8 30 2
Improve the image/reputation of the Bus/HEI 34 32 37 35 31 3
Reduce costs per unit produced / provided 6 6 6 7 3 0
Increase turnover 26 25 28 32 6 5
Increase employment 21 20 23 25 8 4
Increase profitability 24 24 25 30 3 5
Increase value of the Bus/HEI 37 35 41 40 25 2
Other 19 15 25 21 11 2
Number of respondents (ESS) 282 171 114 215 67 88
Respondents could select several options; so percentages in any column may sum to more than 100. Source: PACEC CR&D survey (Q12F) – see section 1.4 for explanation of ESS, Bolding and Shading
4.1.8 In order to get a better perspective of the importance of CR&D funding to recipients
achieving their objectives in the areas of business activity (examined above), the
survey explored the barriers that had prevented them from pursuing those objectives
in the first place. Table 4.8 presents a summary of the factors that recipients identified
as significant barriers. It is clear from the figures that cost was by far the most
important barrier the recipients faced. More than two-thirds of the respondents (68%)
indicated cost was a significant constraint. The issues of collaboration (14%),
development and transfer of knowledge (nine per cent), skills (seven per cent) and
markets (four per cent) were far less significant barriers.
PACEC Objectives of Project Partners
Evaluation of the Collaborative Research and Development Programmes Page 31
Table 4.8 Barriers to objectives prior to CR&D grant (summary)
Percentage of all respondents (by Competition and Sector)
Recipient
All
Recipient Enable Tech
Recipient Market
Led Recipient Business
Recipient Academic
Non Recipient
All
Cost 68 69 66 70 62 80
Collaboration 14 14 16 15 12 7
Knowledge 9 10 8 11 4 4
Skills 7 6 8 8 2 1
Market 4 5 4 5 3 2
Other 12 13 11 11 15 11
None 10 10 11 10 12 9
Number of respondents (ESS) 270 167 107 207 64 81
Respondents could select several options; so percentages in any column may sum to more than 100. Source: PACEC CR&D survey (Q13A) – see section 1.4 for explanation of ESS, Bolding and Shading
4.1.9 Table 4.9 sets out the barriers mentioned by recipients in greater detail. The
particular areas of cost worth noting were those relating to R&D or innovation in
general (51%), and to a lesser extent, access to finance and the economic risk of
undertaking the project itself. The main issues about collaboration related to
recipients establishing good relationships with businesses and higher education
institutions.
PACEC Objectives of Project Partners
Evaluation of the Collaborative Research and Development Programmes Page 32
Table 4.9 Barriers to objectives prior to CR&D grant (detail)
Percentage of all respondents (by Competition and Sector)
Recipient
All
Recipient Enable Tech
Recipient Market
Led Recipient Business
Recipient Academic
Non Recipient
All
Cost of finance 12 11 15 13 9 10
Cost of R&D / innovation 51 52 48 52 46 41
Access to finance 15 15 13 14 18 42
Economic risk 10 9 13 11 7 9
Collaboration with businesses 13 12 15 14 12 6
Collaboration with HEIs 7 7 6 7 5 1
Technical challenge 9 9 8 10 4 3
Leading edge research 2 2 2 2 1 1
Ability to arrange IPR 1 1 1 1 1 0
Commercialisation skills 1 1 1 0 2 0
Technical / R&D skills 6 5 7 7 1 1
Equipment, research infrastructure 2 2 1 2 0 0
Meeting UK/EU regulation 0 0 0 0 1 0
Other priorities of the Bus/HEI 3 3 3 4 1 1
Competitor products/services/processes 0 0 0 0 0 0
Low/uncertain demand for products/services 1 1 1 1 1 1
Other 12 13 11 11 15 11
None 10 10 11 10 12 9
Number of respondents (ESS) 270 167 107 207 64 81
Respondents could select several options; so percentages in any column may sum to more than 100. Source: PACEC CR&D survey (Q13A) – see section 1.4 for explanation of ESS, Bolding and Shading
4.1.10 The importance of CR&D funding can be gauged from the fact that only one in six
recipients (16%) had sought alternative funding before applying for a grant from the
scheme. See Table 4.10.
Table 4.10 Organisation sought alternative funding before the CR&D grant
Percentage of all respondents (by Competition and Sector)
Recipient
All
Recipient Enable Tech
Recipient Market
Led Recipient Business
Recipient Academic
Non Recipient
All
Yes 16 15 18 17 13 n/a
No 74 73 76 74 75 n/a
Don't recall 10 12 6 9 13 n/a
Number of respondents (ESS) 278 169 112 212 66 n/a
Source: PACEC CR&D survey (Q14A) – see section 1.4 for explanation of ESS, Bolding and Shading
4.1.11 Those who had sought any alternative funding at all, had relied mostly on their
organisation’s own finances (13%), grants and funding from research councils (13%),
and finance from venture capitalists, either as loans (11%) or equity (11%). See
4.1.11.
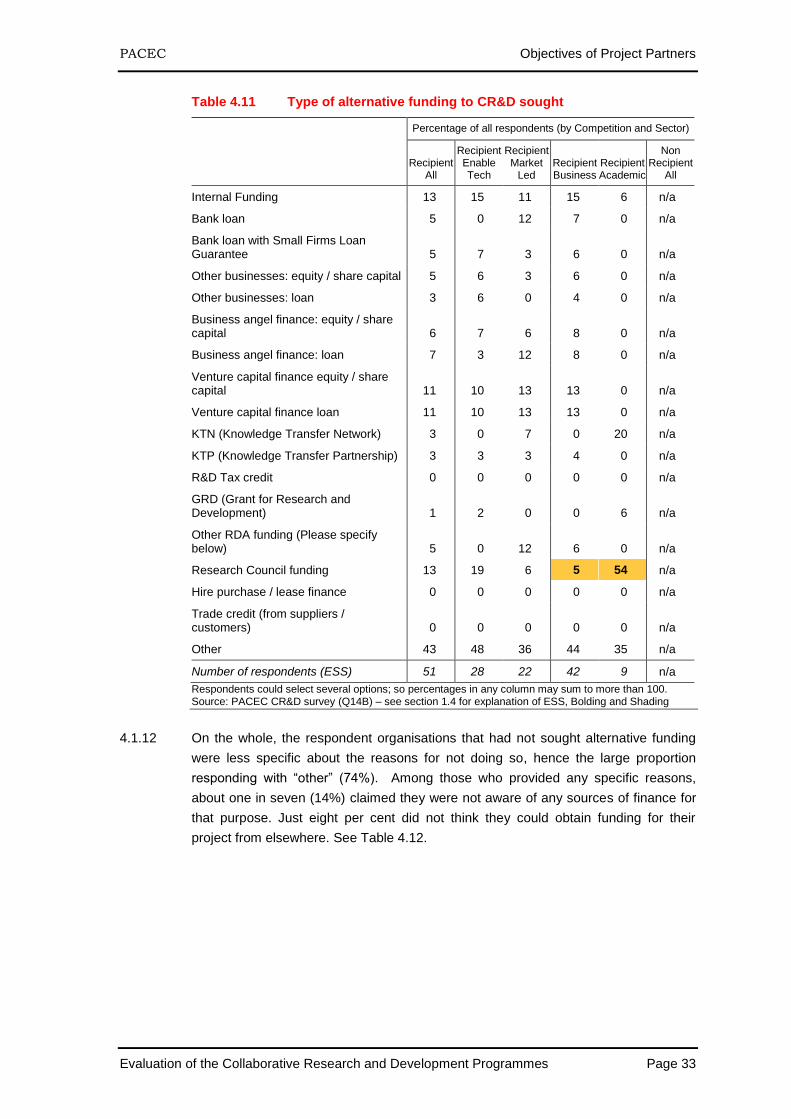
PACEC Objectives of Project Partners
Evaluation of the Collaborative Research and Development Programmes Page 33
Table 4.11 Type of alternative funding to CR&D sought
Percentage of all respondents (by Competition and Sector)
Recipient
All
Recipient Enable Tech
Recipient Market
Led Recipient Business
Recipient Academic
Non Recipient
All
Internal Funding 13 15 11 15 6 n/a
Bank loan 5 0 12 7 0 n/a
Bank loan with Small Firms Loan Guarantee 5 7 3 6 0 n/a
Other businesses: equity / share capital 5 6 3 6 0 n/a
Other businesses: loan 3 6 0 4 0 n/a
Business angel finance: equity / share capital 6 7 6 8 0 n/a
Business angel finance: loan 7 3 12 8 0 n/a
Venture capital finance equity / share capital 11 10 13 13 0 n/a
Venture capital finance loan 11 10 13 13 0 n/a
KTN (Knowledge Transfer Network) 3 0 7 0 20 n/a
KTP (Knowledge Transfer Partnership) 3 3 3 4 0 n/a
R&D Tax credit 0 0 0 0 0 n/a
GRD (Grant for Research and Development) 1 2 0 0 6 n/a
Other RDA funding (Please specify below) 5 0 12 6 0 n/a
Research Council funding 13 19 6 5 54 n/a
Hire purchase / lease finance 0 0 0 0 0 n/a
Trade credit (from suppliers / customers) 0 0 0 0 0 n/a
Other 43 48 36 44 35 n/a
Number of respondents (ESS) 51 28 22 42 9 n/a
Respondents could select several options; so percentages in any column may sum to more than 100. Source: PACEC CR&D survey (Q14B) – see section 1.4 for explanation of ESS, Bolding and Shading
4.1.12 On the whole, the respondent organisations that had not sought alternative funding
were less specific about the reasons for not doing so, hence the large proportion
responding with “other” (74%). Among those who provided any specific reasons,
about one in seven (14%) claimed they were not aware of any sources of finance for
that purpose. Just eight per cent did not think they could obtain funding for their
project from elsewhere. See Table 4.12.
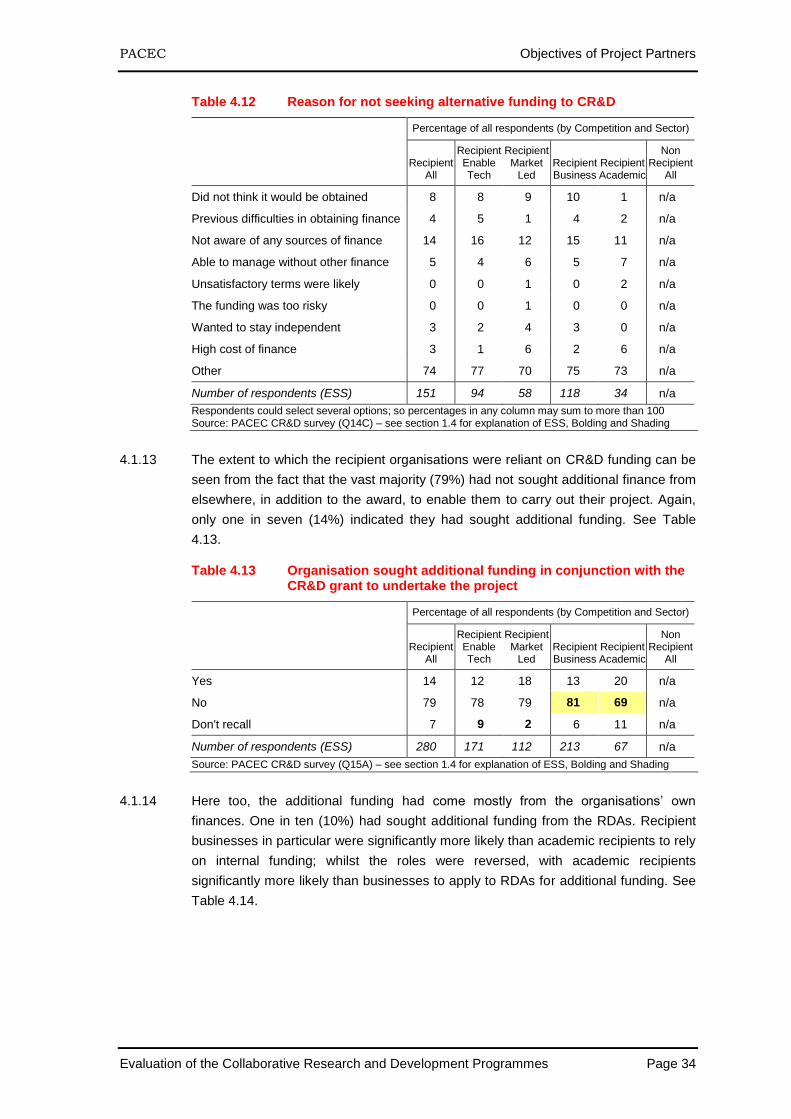
PACEC Objectives of Project Partners
Evaluation of the Collaborative Research and Development Programmes Page 34
Table 4.12 Reason for not seeking alternative funding to CR&D
Percentage of all respondents (by Competition and Sector)
Recipient
All
Recipient Enable Tech
Recipient Market
Led Recipient Business
Recipient Academic
Non Recipient
All
Did not think it would be obtained 8 8 9 10 1 n/a
Previous difficulties in obtaining finance 4 5 1 4 2 n/a
Not aware of any sources of finance 14 16 12 15 11 n/a
Able to manage without other finance 5 4 6 5 7 n/a
Unsatisfactory terms were likely 0 0 1 0 2 n/a
The funding was too risky 0 0 1 0 0 n/a
Wanted to stay independent 3 2 4 3 0 n/a
High cost of finance 3 1 6 2 6 n/a
Other 74 77 70 75 73 n/a
Number of respondents (ESS) 151 94 58 118 34 n/a
Respondents could select several options; so percentages in any column may sum to more than 100 Source: PACEC CR&D survey (Q14C) – see section 1.4 for explanation of ESS, Bolding and Shading
4.1.13 The extent to which the recipient organisations were reliant on CR&D funding can be
seen from the fact that the vast majority (79%) had not sought additional finance from
elsewhere, in addition to the award, to enable them to carry out their project. Again,
only one in seven (14%) indicated they had sought additional funding. See Table
4.13.
Table 4.13 Organisation sought additional funding in conjunction with the CR&D grant to undertake the project
Percentage of all respondents (by Competition and Sector)
Recipient
All
Recipient Enable Tech
Recipient Market
Led Recipient Business
Recipient Academic
Non Recipient
All
Yes 14 12 18 13 20 n/a
No 79 78 79 81 69 n/a
Don't recall 7 9 2 6 11 n/a
Number of respondents (ESS) 280 171 112 213 67 n/a
Source: PACEC CR&D survey (Q15A) – see section 1.4 for explanation of ESS, Bolding and Shading
4.1.14 Here too, the additional funding had come mostly from the organisations’ own
finances. One in ten (10%) had sought additional funding from the RDAs. Recipient
businesses in particular were significantly more likely than academic recipients to rely
on internal funding; whilst the roles were reversed, with academic recipients
significantly more likely than businesses to apply to RDAs for additional funding. See
Table 4.14.
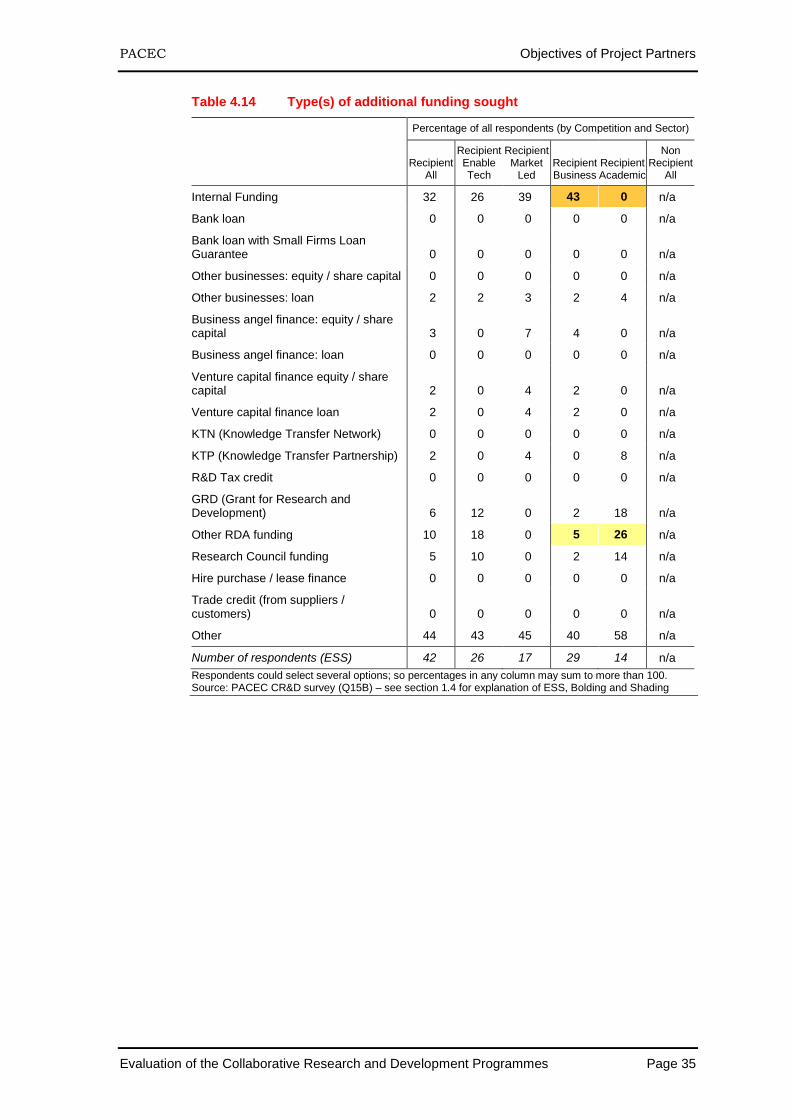
PACEC Objectives of Project Partners
Evaluation of the Collaborative Research and Development Programmes Page 35
Table 4.14 Type(s) of additional funding sought
Percentage of all respondents (by Competition and Sector)
Recipient
All
Recipient Enable Tech
Recipient Market
Led Recipient Business
Recipient Academic
Non Recipient
All
Internal Funding 32 26 39 43 0 n/a
Bank loan 0 0 0 0 0 n/a
Bank loan with Small Firms Loan Guarantee 0 0 0 0 0 n/a
Other businesses: equity / share capital 0 0 0 0 0 n/a
Other businesses: loan 2 2 3 2 4 n/a
Business angel finance: equity / share capital 3 0 7 4 0 n/a
Business angel finance: loan 0 0 0 0 0 n/a
Venture capital finance equity / share capital 2 0 4 2 0 n/a
Venture capital finance loan 2 0 4 2 0 n/a
KTN (Knowledge Transfer Network) 0 0 0 0 0 n/a
KTP (Knowledge Transfer Partnership) 2 0 4 0 8 n/a
R&D Tax credit 0 0 0 0 0 n/a
GRD (Grant for Research and Development) 6 12 0 2 18 n/a
Other RDA funding 10 18 0 5 26 n/a
Research Council funding 5 10 0 2 14 n/a
Hire purchase / lease finance 0 0 0 0 0 n/a
Trade credit (from suppliers / customers) 0 0 0 0 0 n/a
Other 44 43 45 40 58 n/a
Number of respondents (ESS) 42 26 17 29 14 n/a
Respondents could select several options; so percentages in any column may sum to more than 100. Source: PACEC CR&D survey (Q15B) – see section 1.4 for explanation of ESS, Bolding and Shading
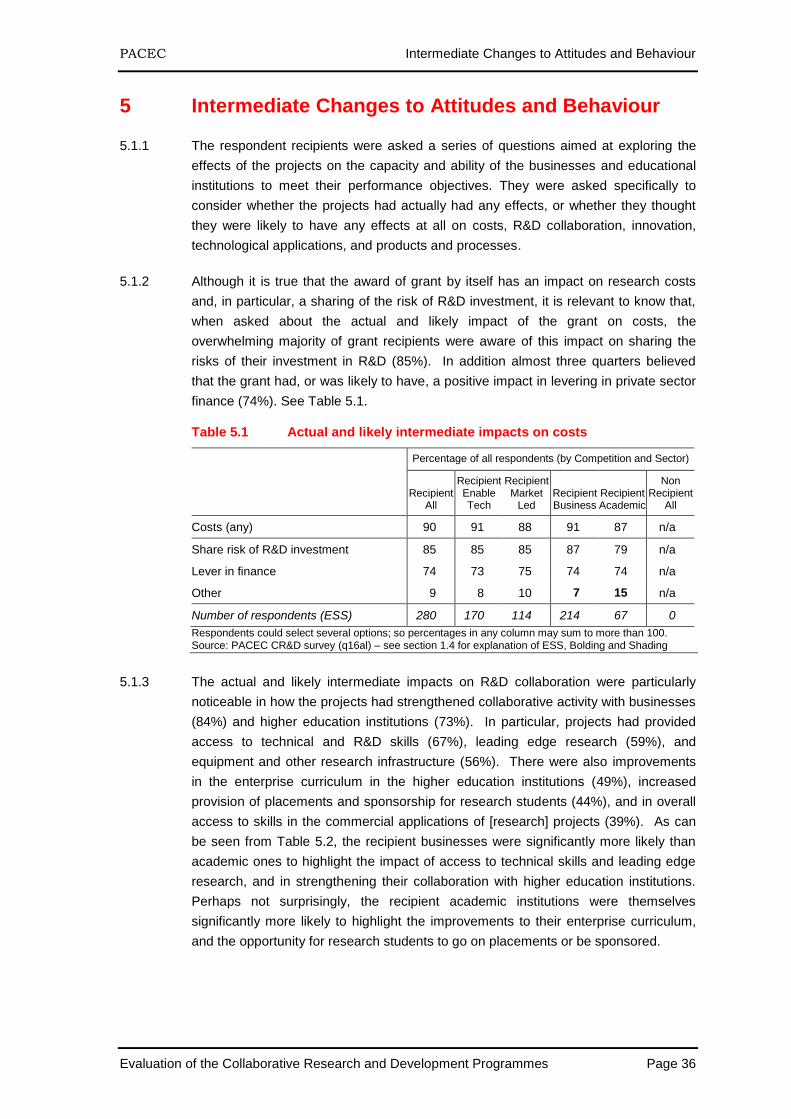
PACEC Intermediate Changes to Attitudes and Behaviour
Evaluation of the Collaborative Research and Development Programmes Page 36
5 Intermediate Changes to Attitudes and Behaviour
5.1.1 The respondent recipients were asked a series of questions aimed at exploring the
effects of the projects on the capacity and ability of the businesses and educational
institutions to meet their performance objectives. They were asked specifically to
consider whether the projects had actually had any effects, or whether they thought
they were likely to have any effects at all on costs, R&D collaboration, innovation,
technological applications, and products and processes.
5.1.2 Although it is true that the award of grant by itself has an impact on research costs
and, in particular, a sharing of the risk of R&D investment, it is relevant to know that,
when asked about the actual and likely impact of the grant on costs, the
overwhelming majority of grant recipients were aware of this impact on sharing the
risks of their investment in R&D (85%). In addition almost three quarters believed
that the grant had, or was likely to have, a positive impact in levering in private sector
finance (74%). See Table 5.1.
Table 5.1 Actual and likely intermediate impacts on costs
Percentage of all respondents (by Competition and Sector)
Recipient
All
Recipient Enable Tech
Recipient Market
Led Recipient Business
Recipient Academic
Non Recipient
All
Costs (any) 90 91 88 91 87 n/a
Share risk of R&D investment 85 85 85 87 79 n/a
Lever in finance 74 73 75 74 74 n/a
Other 9 8 10 7 15 n/a
Number of respondents (ESS) 280 170 114 214 67 0
Respondents could select several options; so percentages in any column may sum to more than 100. Source: PACEC CR&D survey (q16al) – see section 1.4 for explanation of ESS, Bolding and Shading
5.1.3 The actual and likely intermediate impacts on R&D collaboration were particularly
noticeable in how the projects had strengthened collaborative activity with businesses
(84%) and higher education institutions (73%). In particular, projects had provided
access to technical and R&D skills (67%), leading edge research (59%), and
equipment and other research infrastructure (56%). There were also improvements
in the enterprise curriculum in the higher education institutions (49%), increased
provision of placements and sponsorship for research students (44%), and in overall
access to skills in the commercial applications of [research] projects (39%). As can
be seen from Table 5.2, the recipient businesses were significantly more likely than
academic ones to highlight the impact of access to technical skills and leading edge
research, and in strengthening their collaboration with higher education institutions.
Perhaps not surprisingly, the recipient academic institutions were themselves
significantly more likely to highlight the improvements to their enterprise curriculum,
and the opportunity for research students to go on placements or be sponsored.
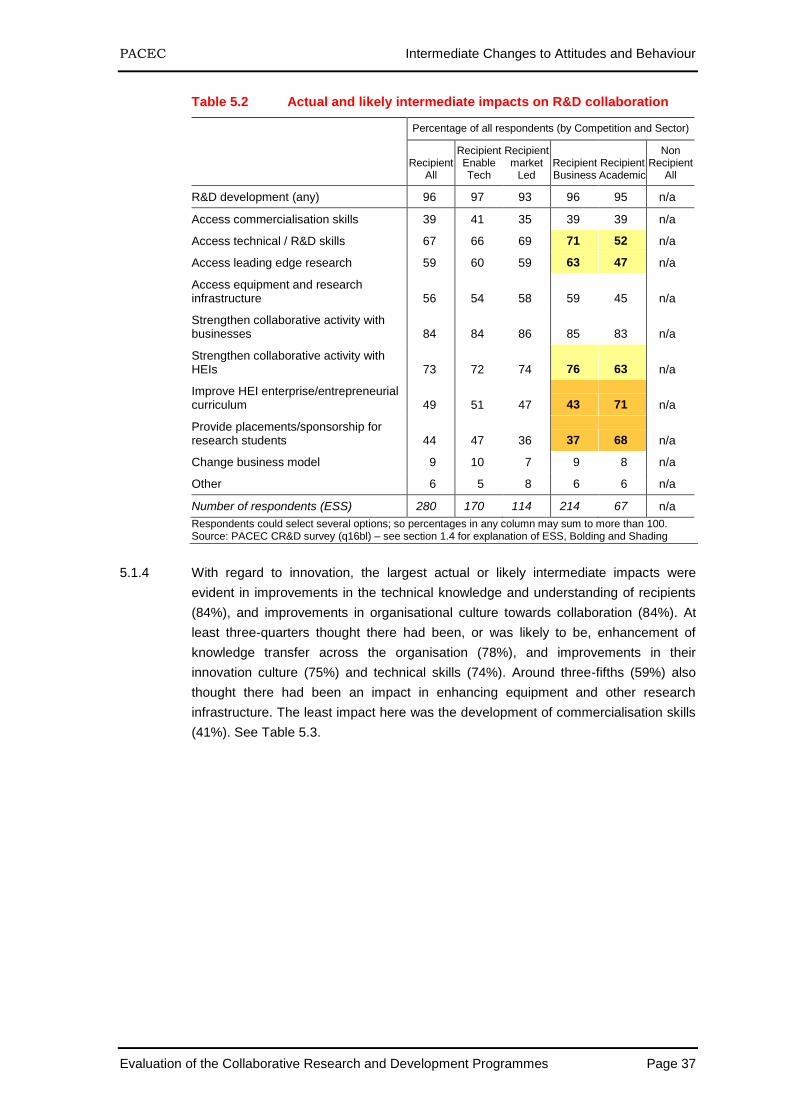
PACEC Intermediate Changes to Attitudes and Behaviour
Evaluation of the Collaborative Research and Development Programmes Page 37
Table 5.2 Actual and likely intermediate impacts on R&D collaboration
Percentage of all respondents (by Competition and Sector)
Recipient
All
Recipient Enable Tech
Recipient market
Led Recipient Business
Recipient Academic
Non Recipient
All
R&D development (any) 96 97 93 96 95 n/a
Access commercialisation skills 39 41 35 39 39 n/a
Access technical / R&D skills 67 66 69 71 52 n/a
Access leading edge research 59 60 59 63 47 n/a
Access equipment and research infrastructure 56 54 58 59 45 n/a
Strengthen collaborative activity with businesses 84 84 86 85 83 n/a
Strengthen collaborative activity with HEIs 73 72 74 76 63 n/a
Improve HEI enterprise/entrepreneurial curriculum 49 51 47 43 71 n/a
Provide placements/sponsorship for research students 44 47 36 37 68 n/a
Change business model 9 10 7 9 8 n/a
Other 6 5 8 6 6 n/a
Number of respondents (ESS) 280 170 114 214 67 n/a
Respondents could select several options; so percentages in any column may sum to more than 100. Source: PACEC CR&D survey (q16bl) – see section 1.4 for explanation of ESS, Bolding and Shading
5.1.4 With regard to innovation, the largest actual or likely intermediate impacts were
evident in improvements in the technical knowledge and understanding of recipients
(84%), and improvements in organisational culture towards collaboration (84%). At
least three-quarters thought there had been, or was likely to be, enhancement of
knowledge transfer across the organisation (78%), and improvements in their
innovation culture (75%) and technical skills (74%). Around three-fifths (59%) also
thought there had been an impact in enhancing equipment and other research
infrastructure. The least impact here was the development of commercialisation skills
(41%). See Table 5.3.
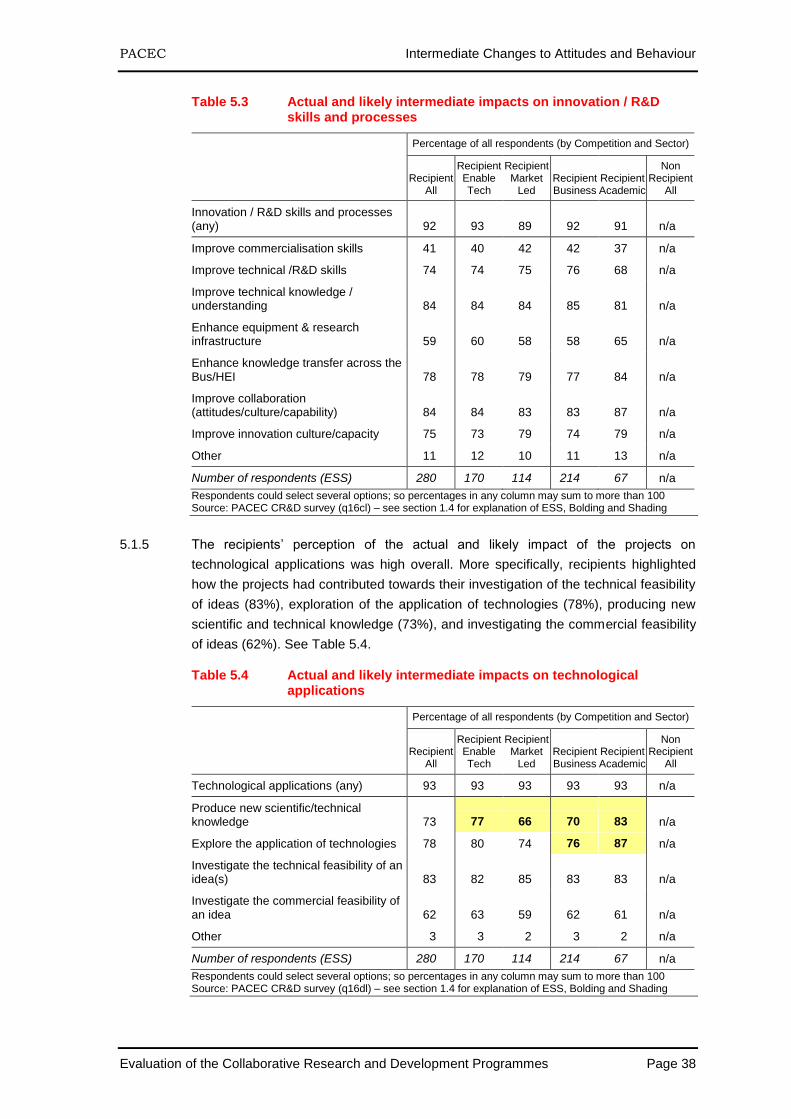
PACEC Intermediate Changes to Attitudes and Behaviour
Evaluation of the Collaborative Research and Development Programmes Page 38
Table 5.3 Actual and likely intermediate impacts on innovation / R&D skills and processes
Percentage of all respondents (by Competition and Sector)
Recipient
All
Recipient Enable Tech
Recipient Market
Led Recipient Business
Recipient Academic
Non Recipient
All
Innovation / R&D skills and processes (any) 92 93 89 92 91 n/a
Improve commercialisation skills 41 40 42 42 37 n/a
Improve technical /R&D skills 74 74 75 76 68 n/a
Improve technical knowledge / understanding 84 84 84 85 81 n/a
Enhance equipment & research infrastructure 59 60 58 58 65 n/a
Enhance knowledge transfer across the Bus/HEI 78 78 79 77 84 n/a
Improve collaboration (attitudes/culture/capability) 84 84 83 83 87 n/a
Improve innovation culture/capacity 75 73 79 74 79 n/a
Other 11 12 10 11 13 n/a
Number of respondents (ESS) 280 170 114 214 67 n/a
Respondents could select several options; so percentages in any column may sum to more than 100 Source: PACEC CR&D survey (q16cl) – see section 1.4 for explanation of ESS, Bolding and Shading
5.1.5 The recipients’ perception of the actual and likely impact of the projects on
technological applications was high overall. More specifically, recipients highlighted
how the projects had contributed towards their investigation of the technical feasibility
of ideas (83%), exploration of the application of technologies (78%), producing new
scientific and technical knowledge (73%), and investigating the commercial feasibility
of ideas (62%). See Table 5.4.
Table 5.4 Actual and likely intermediate impacts on technological applications
Percentage of all respondents (by Competition and Sector)
Recipient
All
Recipient Enable Tech
Recipient Market
Led Recipient Business
Recipient Academic
Non Recipient
All
Technological applications (any) 93 93 93 93 93 n/a
Produce new scientific/technical knowledge 73 77 66 70 83 n/a
Explore the application of technologies 78 80 74 76 87 n/a
Investigate the technical feasibility of an idea(s) 83 82 85 83 83 n/a
Investigate the commercial feasibility of an idea 62 63 59 62 61 n/a
Other 3 3 2 3 2 n/a
Number of respondents (ESS) 280 170 114 214 67 n/a
Respondents could select several options; so percentages in any column may sum to more than 100 Source: PACEC CR&D survey (q16dl) – see section 1.4 for explanation of ESS, Bolding and Shading
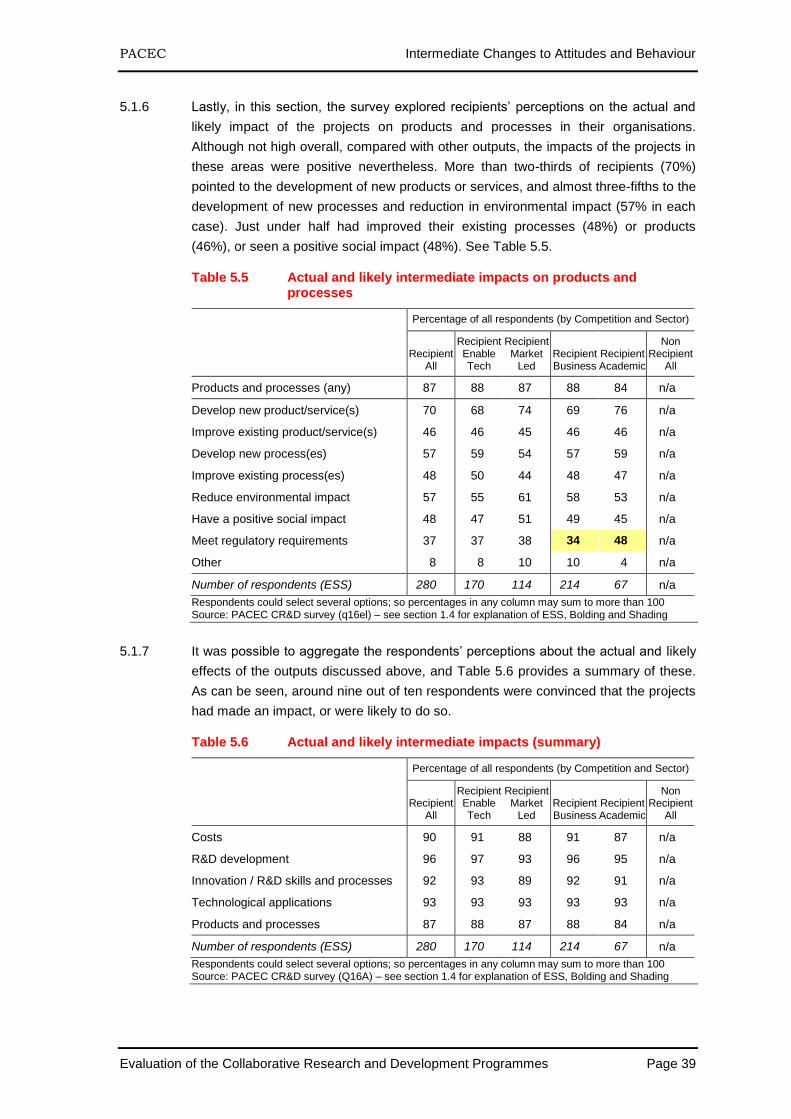
PACEC Intermediate Changes to Attitudes and Behaviour
Evaluation of the Collaborative Research and Development Programmes Page 39
5.1.6 Lastly, in this section, the survey explored recipients’ perceptions on the actual and
likely impact of the projects on products and processes in their organisations.
Although not high overall, compared with other outputs, the impacts of the projects in
these areas were positive nevertheless. More than two-thirds of recipients (70%)
pointed to the development of new products or services, and almost three-fifths to the
development of new processes and reduction in environmental impact (57% in each
case). Just under half had improved their existing processes (48%) or products
(46%), or seen a positive social impact (48%). See Table 5.5.
Table 5.5 Actual and likely intermediate impacts on products and processes
Percentage of all respondents (by Competition and Sector)
Recipient
All
Recipient Enable Tech
Recipient Market
Led Recipient Business
Recipient Academic
Non Recipient
All
Products and processes (any) 87 88 87 88 84 n/a
Develop new product/service(s) 70 68 74 69 76 n/a
Improve existing product/service(s) 46 46 45 46 46 n/a
Develop new process(es) 57 59 54 57 59 n/a
Improve existing process(es) 48 50 44 48 47 n/a
Reduce environmental impact 57 55 61 58 53 n/a
Have a positive social impact 48 47 51 49 45 n/a
Meet regulatory requirements 37 37 38 34 48 n/a
Other 8 8 10 10 4 n/a
Number of respondents (ESS) 280 170 114 214 67 n/a
Respondents could select several options; so percentages in any column may sum to more than 100 Source: PACEC CR&D survey (q16el) – see section 1.4 for explanation of ESS, Bolding and Shading
5.1.7 It was possible to aggregate the respondents’ perceptions about the actual and likely
effects of the outputs discussed above, and Table 5.6 provides a summary of these.
As can be seen, around nine out of ten respondents were convinced that the projects
had made an impact, or were likely to do so.
Table 5.6 Actual and likely intermediate impacts (summary)
Percentage of all respondents (by Competition and Sector)
Recipient
All
Recipient Enable Tech
Recipient Market
Led Recipient Business
Recipient Academic
Non Recipient
All
Costs 90 91 88 91 87 n/a
R&D development 96 97 93 96 95 n/a
Innovation / R&D skills and processes 92 93 89 92 91 n/a
Technological applications 93 93 93 93 93 n/a
Products and processes 87 88 87 88 84 n/a
Number of respondents (ESS) 280 170 114 214 67 n/a
Respondents could select several options; so percentages in any column may sum to more than 100 Source: PACEC CR&D survey (Q16A) – see section 1.4 for explanation of ESS, Bolding and Shading
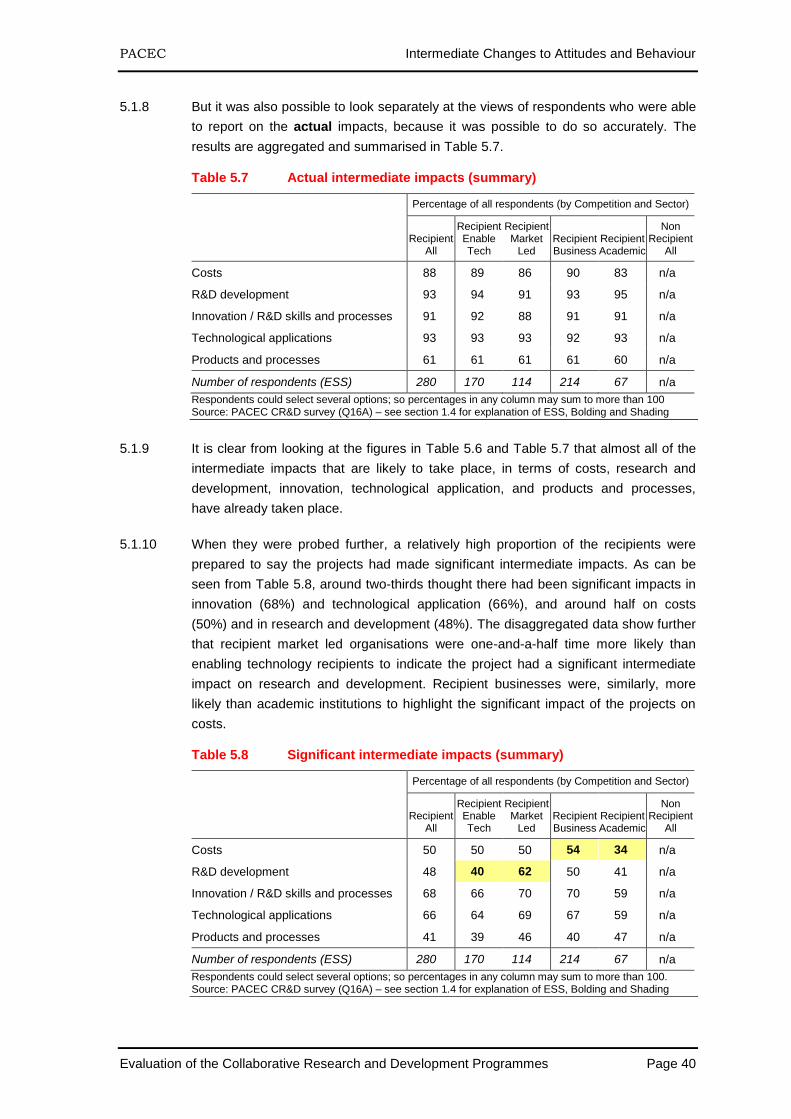
PACEC Intermediate Changes to Attitudes and Behaviour
Evaluation of the Collaborative Research and Development Programmes Page 40
5.1.8 But it was also possible to look separately at the views of respondents who were able
to report on the actual impacts, because it was possible to do so accurately. The
results are aggregated and summarised in Table 5.7.
Table 5.7 Actual intermediate impacts (summary)
Percentage of all respondents (by Competition and Sector)
Recipient
All
Recipient Enable Tech
Recipient Market
Led Recipient Business
Recipient Academic
Non Recipient
All
Costs 88 89 86 90 83 n/a
R&D development 93 94 91 93 95 n/a
Innovation / R&D skills and processes 91 92 88 91 91 n/a
Technological applications 93 93 93 92 93 n/a
Products and processes 61 61 61 61 60 n/a
Number of respondents (ESS) 280 170 114 214 67 n/a
Respondents could select several options; so percentages in any column may sum to more than 100 Source: PACEC CR&D survey (Q16A) – see section 1.4 for explanation of ESS, Bolding and Shading
5.1.9 It is clear from looking at the figures in Table 5.6 and Table 5.7 that almost all of the
intermediate impacts that are likely to take place, in terms of costs, research and
development, innovation, technological application, and products and processes,
have already taken place.
5.1.10 When they were probed further, a relatively high proportion of the recipients were
prepared to say the projects had made significant intermediate impacts. As can be
seen from Table 5.8, around two-thirds thought there had been significant impacts in
innovation (68%) and technological application (66%), and around half on costs
(50%) and in research and development (48%). The disaggregated data show further
that recipient market led organisations were one-and-a-half time more likely than
enabling technology recipients to indicate the project had a significant intermediate
impact on research and development. Recipient businesses were, similarly, more
likely than academic institutions to highlight the significant impact of the projects on
costs.
Table 5.8 Significant intermediate impacts (summary)
Percentage of all respondents (by Competition and Sector)
Recipient
All
Recipient Enable Tech
Recipient Market
Led Recipient Business
Recipient Academic
Non Recipient
All
Costs 50 50 50 54 34 n/a
R&D development 48 40 62 50 41 n/a
Innovation / R&D skills and processes 68 66 70 70 59 n/a
Technological applications 66 64 69 67 59 n/a
Products and processes 41 39 46 40 47 n/a
Number of respondents (ESS) 280 170 114 214 67 n/a
Respondents could select several options; so percentages in any column may sum to more than 100. Source: PACEC CR&D survey (Q16A) – see section 1.4 for explanation of ESS, Bolding and Shading
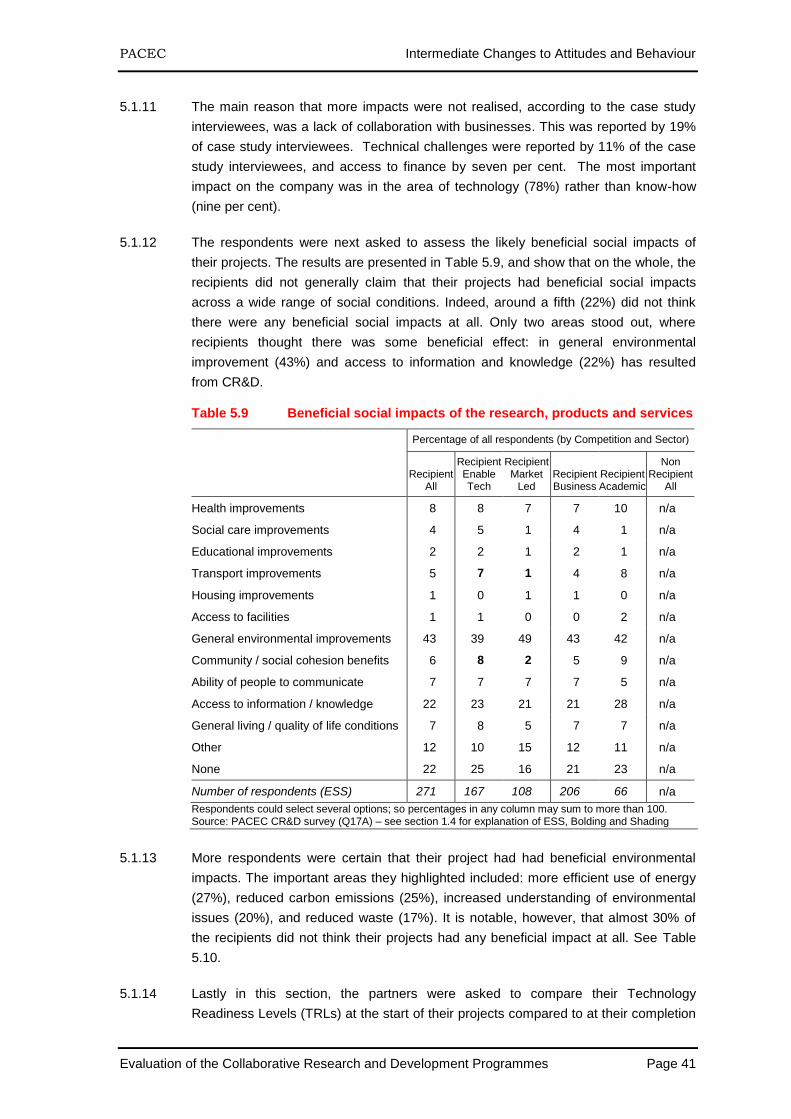
PACEC Intermediate Changes to Attitudes and Behaviour
Evaluation of the Collaborative Research and Development Programmes Page 41
5.1.11 The main reason that more impacts were not realised, according to the case study
interviewees, was a lack of collaboration with businesses. This was reported by 19%
of case study interviewees. Technical challenges were reported by 11% of the case
study interviewees, and access to finance by seven per cent. The most important
impact on the company was in the area of technology (78%) rather than know-how
(nine per cent).
5.1.12 The respondents were next asked to assess the likely beneficial social impacts of
their projects. The results are presented in Table 5.9, and show that on the whole, the
recipients did not generally claim that their projects had beneficial social impacts
across a wide range of social conditions. Indeed, around a fifth (22%) did not think
there were any beneficial social impacts at all. Only two areas stood out, where
recipients thought there was some beneficial effect: in general environmental
improvement (43%) and access to information and knowledge (22%) has resulted
from CR&D.
Table 5.9 Beneficial social impacts of the research, products and services
Percentage of all respondents (by Competition and Sector)
Recipient
All
Recipient Enable Tech
Recipient Market
Led Recipient Business
Recipient Academic
Non Recipient
All
Health improvements 8 8 7 7 10 n/a
Social care improvements 4 5 1 4 1 n/a
Educational improvements 2 2 1 2 1 n/a
Transport improvements 5 7 1 4 8 n/a
Housing improvements 1 0 1 1 0 n/a
Access to facilities 1 1 0 0 2 n/a
General environmental improvements 43 39 49 43 42 n/a
Community / social cohesion benefits 6 8 2 5 9 n/a
Ability of people to communicate 7 7 7 7 5 n/a
Access to information / knowledge 22 23 21 21 28 n/a
General living / quality of life conditions 7 8 5 7 7 n/a
Other 12 10 15 12 11 n/a
None 22 25 16 21 23 n/a
Number of respondents (ESS) 271 167 108 206 66 n/a
Respondents could select several options; so percentages in any column may sum to more than 100. Source: PACEC CR&D survey (Q17A) – see section 1.4 for explanation of ESS, Bolding and Shading
5.1.13 More respondents were certain that their project had had beneficial environmental
impacts. The important areas they highlighted included: more efficient use of energy
(27%), reduced carbon emissions (25%), increased understanding of environmental
issues (20%), and reduced waste (17%). It is notable, however, that almost 30% of
the recipients did not think their projects had any beneficial impact at all. See Table
5.10.
5.1.14 Lastly in this section, the partners were asked to compare their Technology
Readiness Levels (TRLs) at the start of their projects compared to at their completion
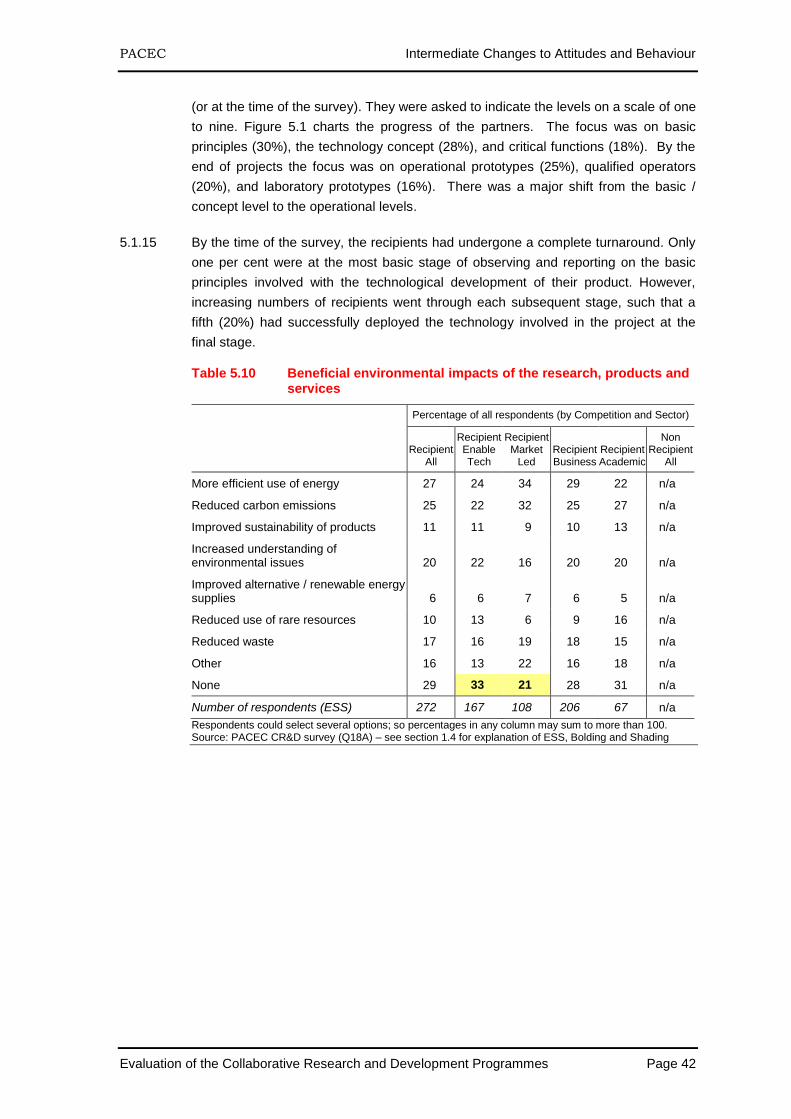
PACEC Intermediate Changes to Attitudes and Behaviour
Evaluation of the Collaborative Research and Development Programmes Page 42
(or at the time of the survey). They were asked to indicate the levels on a scale of one
to nine. Figure 5.1 charts the progress of the partners. The focus was on basic
principles (30%), the technology concept (28%), and critical functions (18%). By the
end of projects the focus was on operational prototypes (25%), qualified operators
(20%), and laboratory prototypes (16%). There was a major shift from the basic /
concept level to the operational levels.
5.1.15 By the time of the survey, the recipients had undergone a complete turnaround. Only
one per cent were at the most basic stage of observing and reporting on the basic
principles involved with the technological development of their product. However,
increasing numbers of recipients went through each subsequent stage, such that a
fifth (20%) had successfully deployed the technology involved in the project at the
final stage.
Table 5.10 Beneficial environmental impacts of the research, products and services
Percentage of all respondents (by Competition and Sector)
Recipient
All
Recipient Enable Tech
Recipient Market
Led Recipient Business
Recipient Academic
Non Recipient
All
More efficient use of energy 27 24 34 29 22 n/a
Reduced carbon emissions 25 22 32 25 27 n/a
Improved sustainability of products 11 11 9 10 13 n/a
Increased understanding of environmental issues 20 22 16 20 20 n/a
Improved alternative / renewable energy supplies 6 6 7 6 5 n/a
Reduced use of rare resources 10 13 6 9 16 n/a
Reduced waste 17 16 19 18 15 n/a
Other 16 13 22 16 18 n/a
None 29 33 21 28 31 n/a
Number of respondents (ESS) 272 167 108 206 67 n/a
Respondents could select several options; so percentages in any column may sum to more than 100. Source: PACEC CR&D survey (Q18A) – see section 1.4 for explanation of ESS, Bolding and Shading
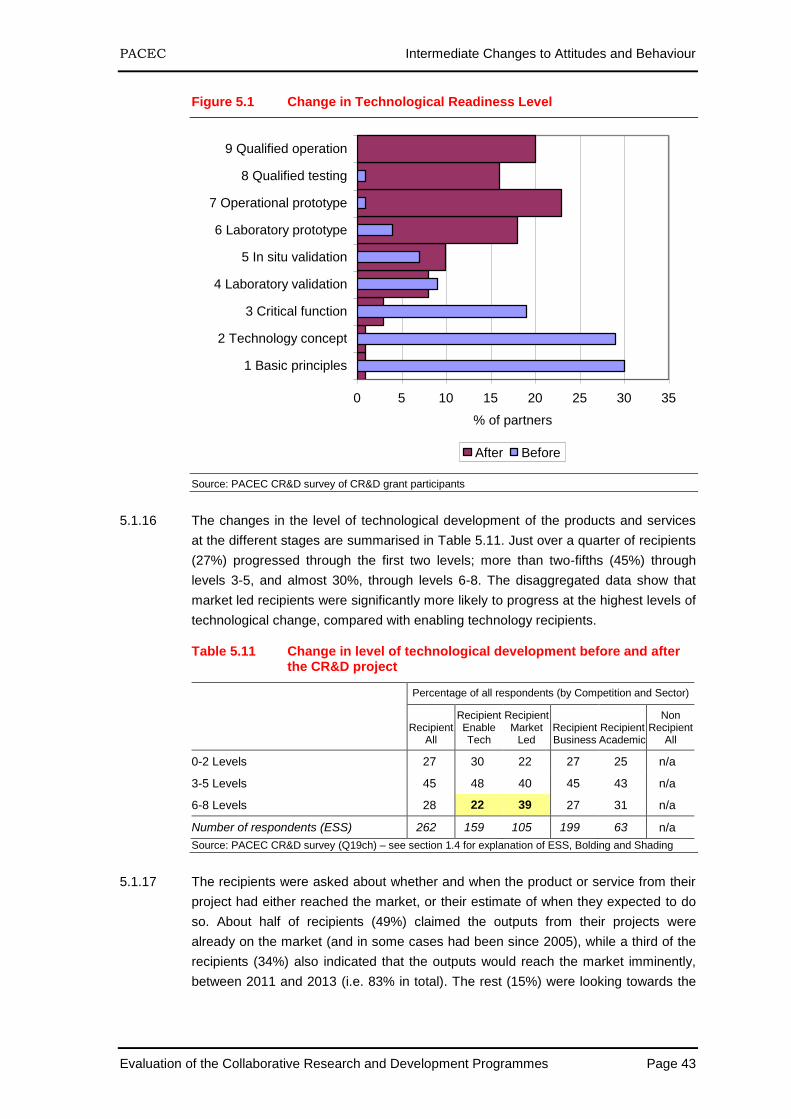
PACEC Intermediate Changes to Attitudes and Behaviour
Evaluation of the Collaborative Research and Development Programmes Page 43
Figure 5.1 Change in Technological Readiness Level
0 5 10 15 20 25 30 35
1 Basic principles
2 Technology concept
3 Critical function
4 Laboratory validation
5 In situ validation
6 Laboratory prototype
7 Operational prototype
8 Qualified testing
9 Qualified operation
% of partners
After Before
Source: PACEC CR&D survey of CR&D grant participants
5.1.16 The changes in the level of technological development of the products and services
at the different stages are summarised in Table 5.11. Just over a quarter of recipients
(27%) progressed through the first two levels; more than two-fifths (45%) through
levels 3-5, and almost 30%, through levels 6-8. The disaggregated data show that
market led recipients were significantly more likely to progress at the highest levels of
technological change, compared with enabling technology recipients.
Table 5.11 Change in level of technological development before and after the CR&D project
Percentage of all respondents (by Competition and Sector)
Recipient
All
Recipient Enable Tech
Recipient Market
Led Recipient Business
Recipient Academic
Non Recipient
All
0-2 Levels 27 30 22 27 25 n/a
3-5 Levels 45 48 40 45 43 n/a
6-8 Levels 28 22 39 27 31 n/a
Number of respondents (ESS) 262 159 105 199 63 n/a
Source: PACEC CR&D survey (Q19ch) – see section 1.4 for explanation of ESS, Bolding and Shading
5.1.17 The recipients were asked about whether and when the product or service from their
project had either reached the market, or their estimate of when they expected to do
so. About half of recipients (49%) claimed the outputs from their projects were
already on the market (and in some cases had been since 2005), while a third of the
recipients (34%) also indicated that the outputs would reach the market imminently,
between 2011 and 2013 (i.e. 83% in total). The rest (15%) were looking towards the
PACEC Intermediate Changes to Attitudes and Behaviour
Evaluation of the Collaborative Research and Development Programmes Page 44
medium to long term, and expected the outputs to reach market between 2014 and
2025. See Table 5.12.
Table 5.12 Year in which products and services are likely to reach the market
Percentage of all respondents (by Competition and Sector)
Recipient
All
Recipient Enable Tech
Recipient Market
Led Recipient Business
Recipient Academic
Non Recipient
All
2005-2010 49 44 55 49 45 n/a
2011-2013 34 38 27 32 42 n/a
2014-2025 18 18 17 18 14 n/a
Number of respondents (ESS) 165 97 69 130 36 n/a
Source: PACEC CR&D survey (Q20group) – see section 1.4 for explanation of ESS, Bolding and Shading
5.1.18 As can be seen from Table 5.13, 35% had registered a patent, one third of recipients
expect the project to result in at least one item of intellectual property. More
specifically, approximately one fifth of the recipients (21%) were confident that one
patent will result from the project, and just under one in seven (13%) expected two or
more patents.
Table 5.13 Number of items of intellectual property (patents) which have resulted or will result from the project supported by the grant
Percentage of all respondents (by Competition and Sector)
Recipient
All
Recipient Enable Tech
Recipient market
Led Recipient Business
Recipient Academic
Non Recipient
All
None 65 68 60 65 66 n/a
1 21 22 19 20 21 n/a
2 6 7 6 7 6 n/a
3 2 2 4 2 3 n/a
4 or more 5 2 12 6 4 n/a
Number of respondents (ESS) 267 164 106 208 59 n/a
Source: PACEC CR&D survey (Q21A) – see section 1.4 for explanation of ESS, Bolding and Shading
5.1.19 Almost two-thirds of the recipients who were anticipating patents (64%) were
developing, or had developed a patent that their organisation owned exclusively. But
there was further evidence to suggest a high level of collaboration between the
partners, particularly from the fact that a fifth of the patents (19%) were owned jointly
with another business or higher education institution and one in six (16%) were
owned by another organisation and licensed by the partner concerned. See Table
5.14.
PACEC Intermediate Changes to Attitudes and Behaviour
Evaluation of the Collaborative Research and Development Programmes Page 45
Table 5.14 Ownership of intellectual property (patents) which have resulted or will result from the project supported by the grant
Percentage of respondents anticipating some patents (by Competition and Sector)
Recipient
All
Recipient Enable Tech
Recipient Market
Led Recipient Business
Recipient Academic
Non Recipient
All
Owned exclusively by the Bus/HEI 64 65 63 69 46 n/a
Jointly owned by the Bus/HEI 19 19 18 16 29 n/a
Licensed by the Bus/HEI (owned by others) 16 15 18 14 24 n/a
Not licensed by the Bus/HEI (owned by others) 7 6 8 6 8 n/a
Number of respondents (ESS) 115 67 53 90 25 n/a
Source: PACEC CR&D survey (Q21A) – see section 1.4 for explanation of ESS, Bolding and Shading
5.1.20 The scale of the success of the projects in developing intellectual property is
demonstrated by the fact that more than three-fifths of the recipients who were
anticipating patents (62%) had actually obtained a patent. More than a third (37%)
had also applied for a patent and were awaiting the result. The rest (14%), moreover,
were confident they would apply for a patent in the near future. See Table 5.15.
Table 5.15 Stage of applications for intellectual property (patents) which have resulted or will result from the project supported by the grant
Percentage of respondents anticipating some patents (by Competition and Sector)
Recipient
All
Recipient Enable Tech
Recipient Market
Led Recipient Business
Recipient Academic
Non Recipient
All
Obtained 62 57 68 59 73 n/a
Applied for, but not obtained 37 36 38 39 27 n/a
Likely to be applied for in the future 14 15 11 16 5 n/a
Number of respondents (ESS) 115 67 53 90 25 n/a
Source: PACEC CR&D survey (Q21A) – see section 1.4 for explanation of ESS, Bolding and Shading
5.1.21 Where a patent had been awarded, the most likely beneficiaries were likely to be the
qualifying recipients themselves. Consequently, almost two-thirds of the recipients
who were anticipating patents (63%) indicated they did not expect to license the
research output to anybody else. Around a quarter (26%) expected to share the
benefits by licensing the patent to their partners, and one in seven (14%), to other
businesses. Very few expected (three per cent) to license the patent to an academic
institution. Further analysis according to sectors showed that the market led
recipients were more likely to license the patent to other businesses; and enabling
technology recipients, to retain the benefits themselves. See Table 5.16.
PACEC Intermediate Changes to Attitudes and Behaviour
Evaluation of the Collaborative Research and Development Programmes Page 46
Table 5.16 Likely licensees of CR&D research outputs
Percentage of respondents anticipating some patents (by Competition and Sector)
Recipient
All
Recipient Enable Tech
Recipient Market
Led Recipient Business
Recipient Academic
Non Recipient
All
Partners 26 22 33 24 35 n/a
Other HEIs 3 2 6 4 1 n/a
Other businesses 14 10 24 15 10 n/a
None 63 70 46 64 57 n/a
Number of respondents (ESS) 178 107 80 141 37 n/a
Respondents could select several options; so percentages in any column may sum to more than 100. Source: PACEC CR&D survey (Q21M) – see section 1.4 for explanation of ESS, Bolding and Shading
5.1.22 The respondents were next asked what barriers they anticipated would prevent them
from introducing their products and services from the projects into the market place.
Table 5.17 shows that around two out of five recipients (39%) did not foresee any
potential barriers to bringing their products to market. Those who anticipated any
particular difficulty cited the high costs involved (17%), lack of knowledge, in
particular the technical challenges involved (12%), and the particular demands of
markets (12%).
Table 5.17 Barriers to introducing products/services arising from the project into the market place (summary)
Percentage of all respondents (by Competition and Sector)
Recipient
All
Recipient Enable Tech
Recipient market
Led Recipient Business
Recipient Academic
Non Recipient
All
Cost 17 16 18 16 18 n/a
Collaboration 3 3 2 2 4 n/a
Knowledge 12 12 11 14 1 n/a
Skills 3 3 3 3 1 n/a
Market 12 12 12 13 8 n/a
Other 30 32 26 31 27 n/a
None 39 35 48 38 46 n/a
Number of respondents (ESS) 260 159 104 207 53 2
Respondents could select several options; so percentages in any column may sum to more than 100. Source: PACEC CR&D survey (q22A) – see section 1.4 for explanation of ESS, Bolding and Shading
5.1.23 The details of the potential barriers anticipated by the recipients are set out in Table
5.18.
PACEC Intermediate Changes to Attitudes and Behaviour
Evaluation of the Collaborative Research and Development Programmes Page 47
Table 5.18 Barriers to introducing products/services arising from the project into the market place (detail)
Percentage of all respondents (by Competition and Sector)
Recipient
All
Recipient Enable Tech
Recipient market
Led Recipient Business
Recipient Academic
Non Recipient
All
Cost of finance 2 3 1 1 6 n/a
Cost of R&D / innovation 10 9 10 9 11 n/a
Access to finance 5 5 4 5 5 n/a
Economic risk 5 4 6 6 1 n/a
Collaboration with businesses 2 2 2 2 1 n/a
Collaboration with HEIs 2 2 2 2 3 n/a
Technical challenge 11 12 9 13 1 n/a
Leading edge research 0 0 0 0 0 n/a
Ability to arrange IPR 1 0 1 1 0 n/a
Skills Commercialisation skills 1 1 1 1 0 n/a
Technical / R&D skills 2 2 2 2 1 n/a
Equipment, research infrastructure 0 0 1 0 0 n/a
Market Meeting UK/EU regulation 2 1 3 2 1 n/a
Other priorities of the Bus/HEI 2 2 2 2 2 n/a
Competitor products/services/processes 1 1 1 1 0 n/a
Low/uncertain demand for products/services 8 8 8 9 5 n/a
Other 30 32 26 31 27 n/a
None 39 35 48 38 46 n/a
Cost effectiveness / viability 5 4 5 6 1 n/a
Not ready 5 5 4 5 3 n/a
Didn't work 2 3 1 3 0 n/a
Another partner's responsibility 5 5 5 4 10 n/a
Number of respondents (ESS) 260 159 104 207 53 2
Respondents could select several options; so percentages in any column may sum to more than 100. Source: PACEC CR&D survey (Q22A) – see section 1.4 for explanation of ESS, Bolding and Shading
5.1.24 There was evidence from the survey to suggest that many of the partners who
received CR&D grants had been encouraged by the success of their project to seek
to improve their products, or even to introduce new products. As can be seen from
Table 5.19, approximately a third of the recipients (32%) had sought further finance
for exploitation and to enable them to introduce new or improved products into the
market place, since completing their original product.
PACEC Intermediate Changes to Attitudes and Behaviour
Evaluation of the Collaborative Research and Development Programmes Page 48
Table 5.19 Partners that sought further finance for exploitation (new products and services for the market place)
Percentage of all respondents (by Competition and Sector)
Recipient
All
Recipient Enable Tech
Recipient Market
Led Recipient Business
Recipient Academic
Non Recipient
All
Yes 32 34 30 33 29 n/a
No 64 61 69 63 67 n/a
Don’t know 4 5 1 4 4 n/a
Number of respondents (ESS) 276 167 112 213 64 n/a
Source: PACEC CR&D survey (Q23A) – see section 1.4 for explanation of ESS, Bolding and Shading
5.1.25 A large majority of those who had sought further finance (60%) were planning to use
this to support their R&D activities. One in seven (15%) intended to use the money to
develop commercial products and services, while a quarter (25%) were planning to
do both. See Table 5.20.
Table 5.20 Purpose for which partners sought further funding
Percentage of all respondents (by Competition and Sector)
Recipient
All
Recipient Enable Tech
Recipient Market
Led Recipient Business
Recipient Academic
Non Recipient
All
R&D 60 67 46 59 64 n/a
Commercial development 15 13 19 14 19 n/a
Both 25 20 36 27 17 n/a
Number of respondents (ESS) 72 45 27 58 14 n/a
Source: PACEC CR&D survey (Q23B) – see section 1.4 for explanation of ESS, Bolding and Shading
5.1.26 When they were probed further, the indications were that the sources of further
finance were spread widely. The main sources were internal funding (from turnover
and reserves), a combination of loans (primarily from the banks and other
businesses, and to some extent form venture capital funds and business angels) – in
similar proportions risk capital for the VCs and business angel sectors, and loan or
equity in equal proportions from other trading businesses.
5.1.27 The survey results provided evidence of other benefits the recipients were enjoying,
as a result of being awarded a CR&D grant. In particular, almost two-thirds of the
recipients (64%) indicated that getting the grant has made it easier for them to obtain
finance more generally. More than a quarter (27%) claimed they had found it much
easier, and almost two-fifths (37%), a little easier. However, more than a third (36%)
did not think that the award had made any difference to their ability to obtain finance.
In terms of sector, the recipient businesses were significantly more likely than
recipient academic institutions not to see any difference in their ability to obtain
finance. See Table 5.21.
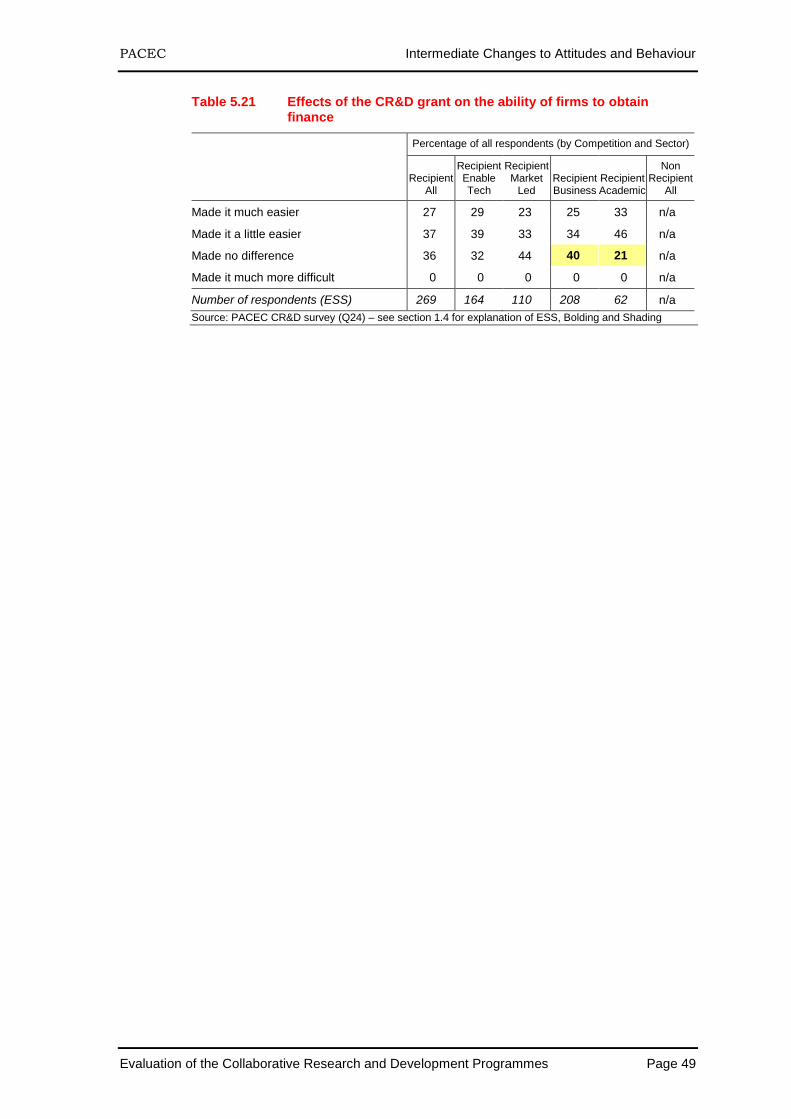
PACEC Intermediate Changes to Attitudes and Behaviour
Evaluation of the Collaborative Research and Development Programmes Page 49
Table 5.21 Effects of the CR&D grant on the ability of firms to obtain finance
Percentage of all respondents (by Competition and Sector)
Recipient
All
Recipient Enable Tech
Recipient Market
Led Recipient Business
Recipient Academic
Non Recipient
All
Made it much easier 27 29 23 25 33 n/a
Made it a little easier 37 39 33 34 46 n/a
Made no difference 36 32 44 40 21 n/a
Made it much more difficult 0 0 0 0 0 n/a
Number of respondents (ESS) 269 164 110 208 62 n/a
Source: PACEC CR&D survey (Q24) – see section 1.4 for explanation of ESS, Bolding and Shading
PACEC Business Performance and Economic Impacts
Evaluation of the Collaborative Research and Development Programmes Page 50
6 Business Performance and Economic Impacts
This chapter examines the impacts that CR&D has had on the business performance
of grant receivers. Based on the results, the economic impacts are examined in
terms of gross and net additional jobs and GVA, together with the costs of generating
these impacts, i.e. the efficiency of CR&D.
6.1 Business Performance Impacts
6.1.1 The survey with businesses explored the effects of the projects on the business
performance of the recipients, in particular their financial turnover and levels of
employment. The recipients were asked their views and perceptions about the actual
and likely performance effects of the project on a range of business performance
measures. Their responses are set out in Table 6.1. By far the most important impact
of the project was the way in which they believed it would improve the image and
reputation of the recipient businesses and academic institutions. Four out of every
five recipients (79%) cited this business performance measure. Around three-fifths
(62%) also indicated that the project would increase the value of their business. It is
particularly notable that more than half of the businesses (56%) anticipated increased
employment, as a result of the project. More than half also thought it would enable
them to enter new markets or increase their market share (53%), increase their
financial turnover (53%), or increase their profits (51%). Quite important too was how
they thought the project would increase the income of the business from intellectual
property rights (45%). For the academic institutions in particular, there was an added
benefit from increased publications (42%), whilst exporters predicted an increase in
their overseas sales (39%). Around a third of the businesses (34%) also believed
they would become more efficient and more productive, as they reduce their
production costs.
6.1.2 The disaggregated data in Table 6.1 show there was considerable variation between
the sectors in their views about the actual and likely business performance effects.
The recipient businesses were significantly more likely than academic institutions to
have higher expectations across several of the business performance measures, in
particular, entering new markets, increasing turnover, increasing profitability,
increasing employment, and increasing export sales. Academic institutions, not
surprisingly, were more likely than businesses to expect an increase in publications.
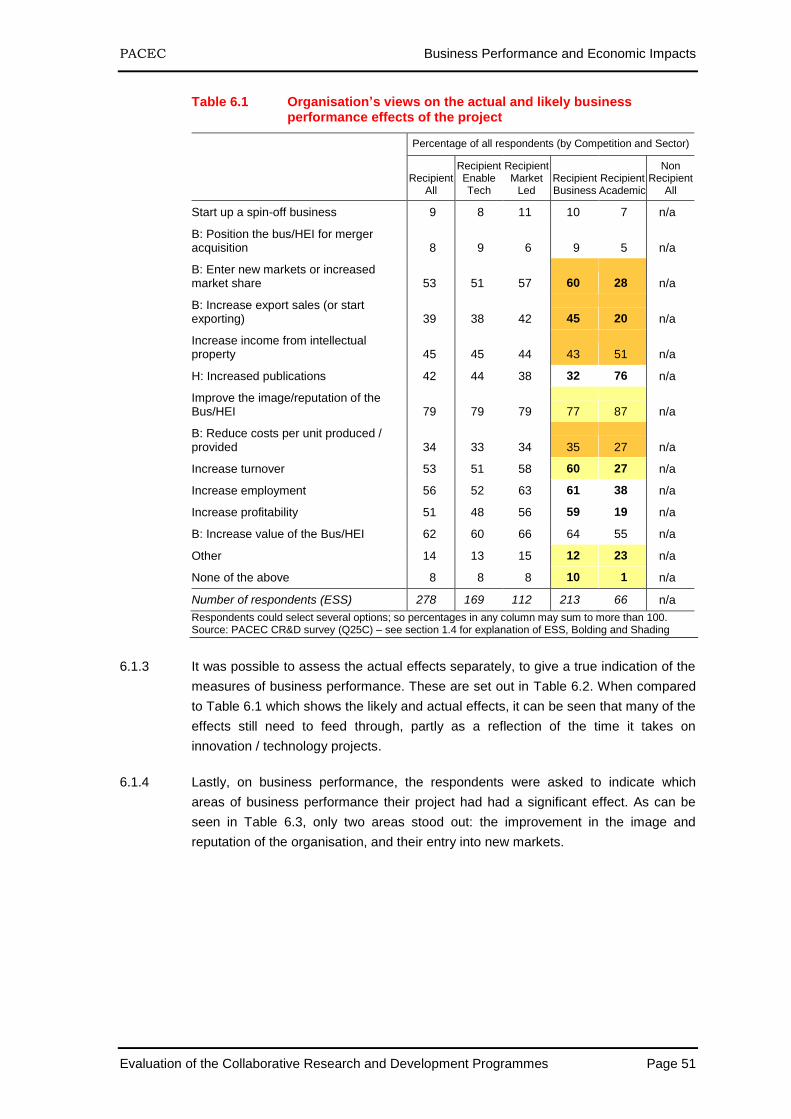
PACEC Business Performance and Economic Impacts
Evaluation of the Collaborative Research and Development Programmes Page 51
Table 6.1 Organisation’s views on the actual and likely business performance effects of the project
Percentage of all respondents (by Competition and Sector)
Recipient
All
Recipient Enable Tech
Recipient Market
Led Recipient Business
Recipient Academic
Non Recipient
All
Start up a spin-off business 9 8 11 10 7 n/a
B: Position the bus/HEI for merger acquisition 8 9 6 9 5 n/a
B: Enter new markets or increased market share 53 51 57 60 28 n/a
B: Increase export sales (or start exporting) 39 38 42 45 20 n/a
Increase income from intellectual property 45 45 44 43 51 n/a
H: Increased publications 42 44 38 32 76 n/a
Improve the image/reputation of the Bus/HEI 79 79 79 77 87 n/a
B: Reduce costs per unit produced / provided 34 33 34 35 27 n/a
Increase turnover 53 51 58 60 27 n/a
Increase employment 56 52 63 61 38 n/a
Increase profitability 51 48 56 59 19 n/a
B: Increase value of the Bus/HEI 62 60 66 64 55 n/a
Other 14 13 15 12 23 n/a
None of the above 8 8 8 10 1 n/a
Number of respondents (ESS) 278 169 112 213 66 n/a
Respondents could select several options; so percentages in any column may sum to more than 100. Source: PACEC CR&D survey (Q25C) – see section 1.4 for explanation of ESS, Bolding and Shading
6.1.3 It was possible to assess the actual effects separately, to give a true indication of the
measures of business performance. These are set out in Table 6.2. When compared
to Table 6.1 which shows the likely and actual effects, it can be seen that many of the
effects still need to feed through, partly as a reflection of the time it takes on
innovation / technology projects.
6.1.4 Lastly, on business performance, the respondents were asked to indicate which
areas of business performance their project had had a significant effect. As can be
seen in Table 6.3, only two areas stood out: the improvement in the image and
reputation of the organisation, and their entry into new markets.
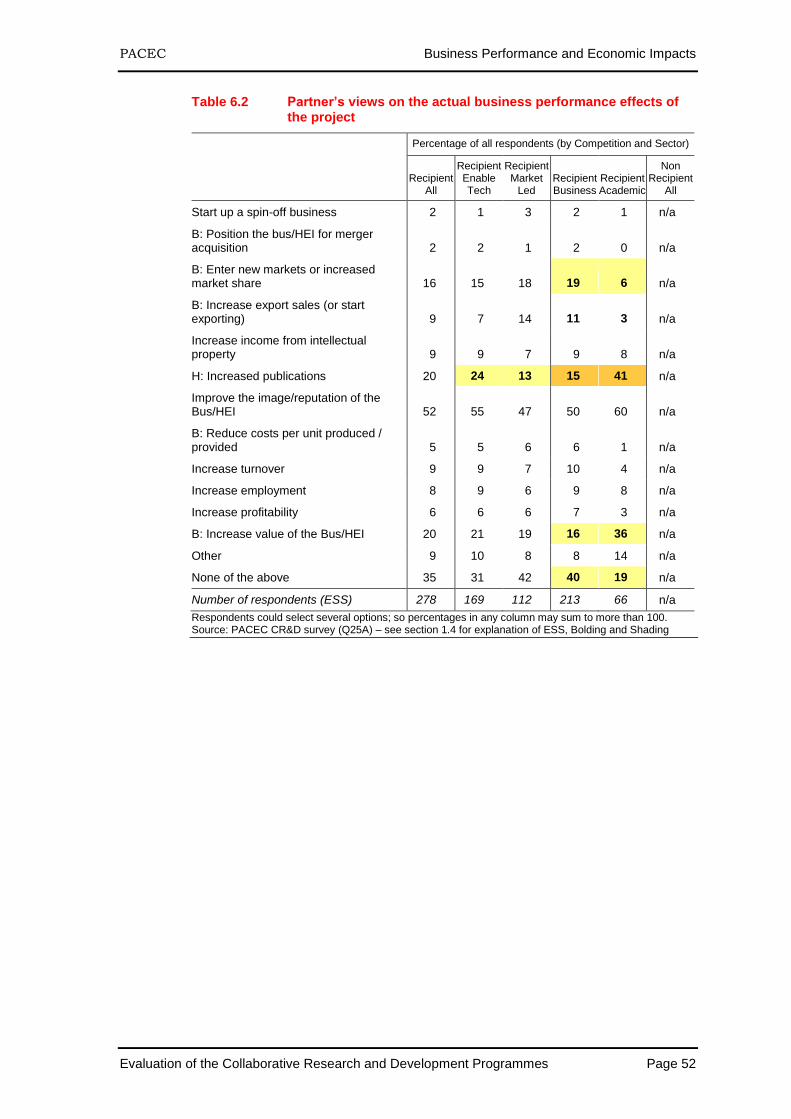
PACEC Business Performance and Economic Impacts
Evaluation of the Collaborative Research and Development Programmes Page 52
Table 6.2 Partner’s views on the actual business performance effects of the project
Percentage of all respondents (by Competition and Sector)
Recipient
All
Recipient Enable Tech
Recipient Market
Led Recipient Business
Recipient Academic
Non Recipient
All
Start up a spin-off business 2 1 3 2 1 n/a
B: Position the bus/HEI for merger acquisition 2 2 1 2 0 n/a
B: Enter new markets or increased market share 16 15 18 19 6 n/a
B: Increase export sales (or start exporting) 9 7 14 11 3 n/a
Increase income from intellectual property 9 9 7 9 8 n/a
H: Increased publications 20 24 13 15 41 n/a
Improve the image/reputation of the Bus/HEI 52 55 47 50 60 n/a
B: Reduce costs per unit produced / provided 5 5 6 6 1 n/a
Increase turnover 9 9 7 10 4 n/a
Increase employment 8 9 6 9 8 n/a
Increase profitability 6 6 6 7 3 n/a
B: Increase value of the Bus/HEI 20 21 19 16 36 n/a
Other 9 10 8 8 14 n/a
None of the above 35 31 42 40 19 n/a
Number of respondents (ESS) 278 169 112 213 66 n/a
Respondents could select several options; so percentages in any column may sum to more than 100. Source: PACEC CR&D survey (Q25A) – see section 1.4 for explanation of ESS, Bolding and Shading
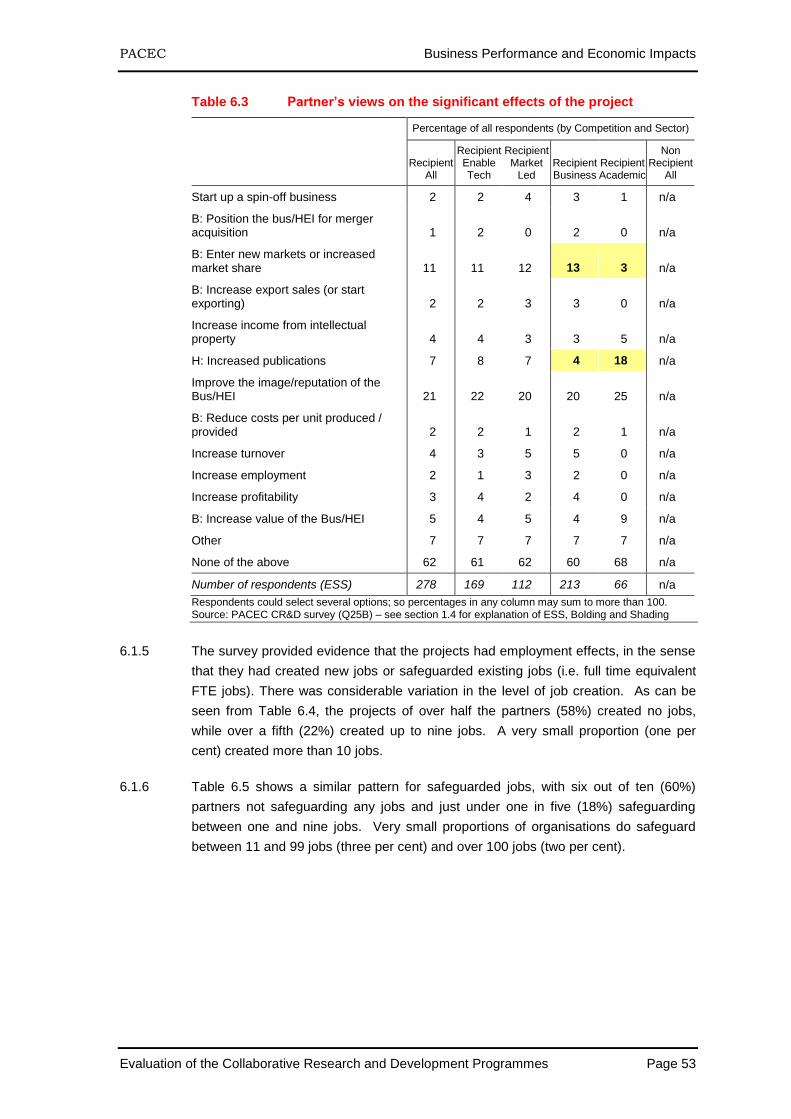
PACEC Business Performance and Economic Impacts
Evaluation of the Collaborative Research and Development Programmes Page 53
Table 6.3 Partner’s views on the significant effects of the project
Percentage of all respondents (by Competition and Sector)
Recipient
All
Recipient Enable Tech
Recipient Market
Led Recipient Business
Recipient Academic
Non Recipient
All
Start up a spin-off business 2 2 4 3 1 n/a
B: Position the bus/HEI for merger acquisition 1 2 0 2 0 n/a
B: Enter new markets or increased market share 11 11 12 13 3 n/a
B: Increase export sales (or start exporting) 2 2 3 3 0 n/a
Increase income from intellectual property 4 4 3 3 5 n/a
H: Increased publications 7 8 7 4 18 n/a
Improve the image/reputation of the Bus/HEI 21 22 20 20 25 n/a
B: Reduce costs per unit produced / provided 2 2 1 2 1 n/a
Increase turnover 4 3 5 5 0 n/a
Increase employment 2 1 3 2 0 n/a
Increase profitability 3 4 2 4 0 n/a
B: Increase value of the Bus/HEI 5 4 5 4 9 n/a
Other 7 7 7 7 7 n/a
None of the above 62 61 62 60 68 n/a
Number of respondents (ESS) 278 169 112 213 66 n/a
Respondents could select several options; so percentages in any column may sum to more than 100. Source: PACEC CR&D survey (Q25B) – see section 1.4 for explanation of ESS, Bolding and Shading
6.1.5 The survey provided evidence that the projects had employment effects, in the sense
that they had created new jobs or safeguarded existing jobs (i.e. full time equivalent
FTE jobs). There was considerable variation in the level of job creation. As can be
seen from Table 6.4, the projects of over half the partners (58%) created no jobs,
while over a fifth (22%) created up to nine jobs. A very small proportion (one per
cent) created more than 10 jobs.
6.1.6 Table 6.5 shows a similar pattern for safeguarded jobs, with six out of ten (60%)
partners not safeguarding any jobs and just under one in five (18%) safeguarding
between one and nine jobs. Very small proportions of organisations do safeguard
between 11 and 99 jobs (three per cent) and over 100 jobs (two per cent).
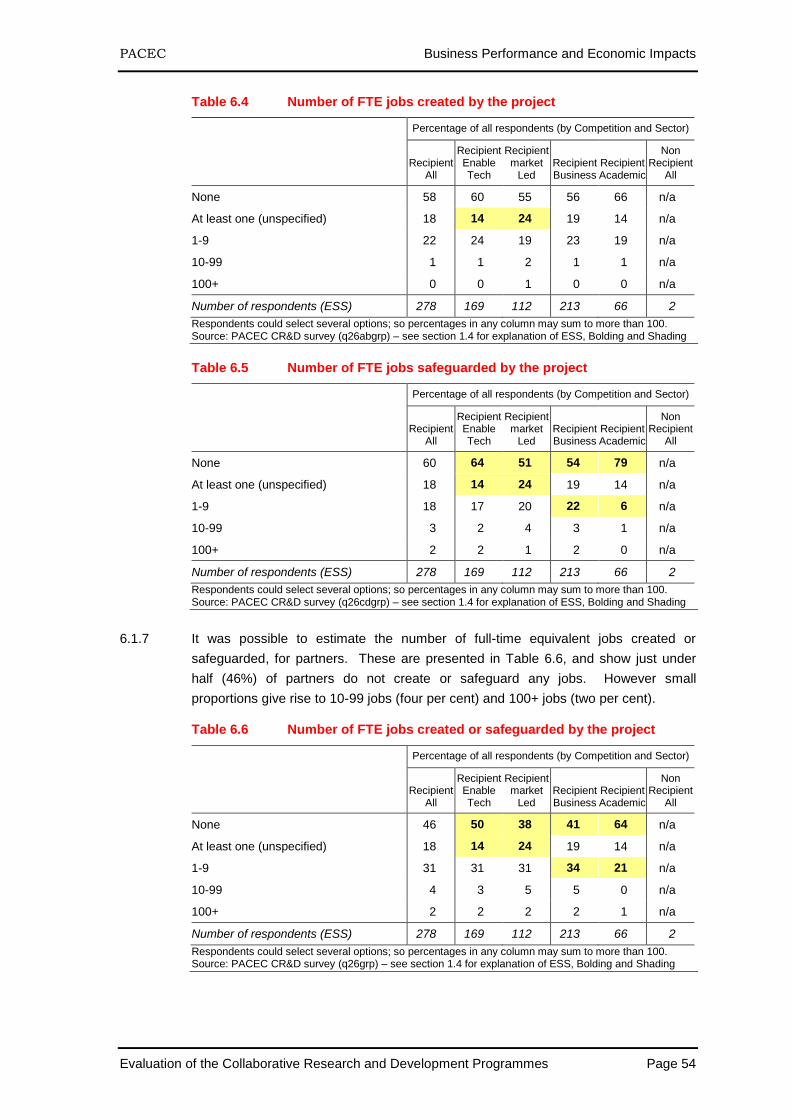
PACEC Business Performance and Economic Impacts
Evaluation of the Collaborative Research and Development Programmes Page 54
Table 6.4 Number of FTE jobs created by the project
Percentage of all respondents (by Competition and Sector)
Recipient
All
Recipient Enable Tech
Recipient market
Led Recipient Business
Recipient Academic
Non Recipient
All
None 58 60 55 56 66 n/a
At least one (unspecified) 18 14 24 19 14 n/a
1-9 22 24 19 23 19 n/a
10-99 1 1 2 1 1 n/a
100+ 0 0 1 0 0 n/a
Number of respondents (ESS) 278 169 112 213 66 2
Respondents could select several options; so percentages in any column may sum to more than 100. Source: PACEC CR&D survey (q26abgrp) – see section 1.4 for explanation of ESS, Bolding and Shading
Table 6.5 Number of FTE jobs safeguarded by the project
Percentage of all respondents (by Competition and Sector)
Recipient
All
Recipient Enable Tech
Recipient market
Led Recipient Business
Recipient Academic
Non Recipient
All
None 60 64 51 54 79 n/a
At least one (unspecified) 18 14 24 19 14 n/a
1-9 18 17 20 22 6 n/a
10-99 3 2 4 3 1 n/a
100+ 2 2 1 2 0 n/a
Number of respondents (ESS) 278 169 112 213 66 2
Respondents could select several options; so percentages in any column may sum to more than 100. Source: PACEC CR&D survey (q26cdgrp) – see section 1.4 for explanation of ESS, Bolding and Shading
6.1.7 It was possible to estimate the number of full-time equivalent jobs created or
safeguarded, for partners. These are presented in Table 6.6, and show just under
half (46%) of partners do not create or safeguard any jobs. However small
proportions give rise to 10-99 jobs (four per cent) and 100+ jobs (two per cent).
Table 6.6 Number of FTE jobs created or safeguarded by the project
Percentage of all respondents (by Competition and Sector)
Recipient
All
Recipient Enable Tech
Recipient market
Led Recipient Business
Recipient Academic
Non Recipient
All
None 46 50 38 41 64 n/a
At least one (unspecified) 18 14 24 19 14 n/a
1-9 31 31 31 34 21 n/a
10-99 4 3 5 5 0 n/a
100+ 2 2 2 2 1 n/a
Number of respondents (ESS) 278 169 112 213 66 2
Respondents could select several options; so percentages in any column may sum to more than 100. Source: PACEC CR&D survey (q26grp) – see section 1.4 for explanation of ESS, Bolding and Shading
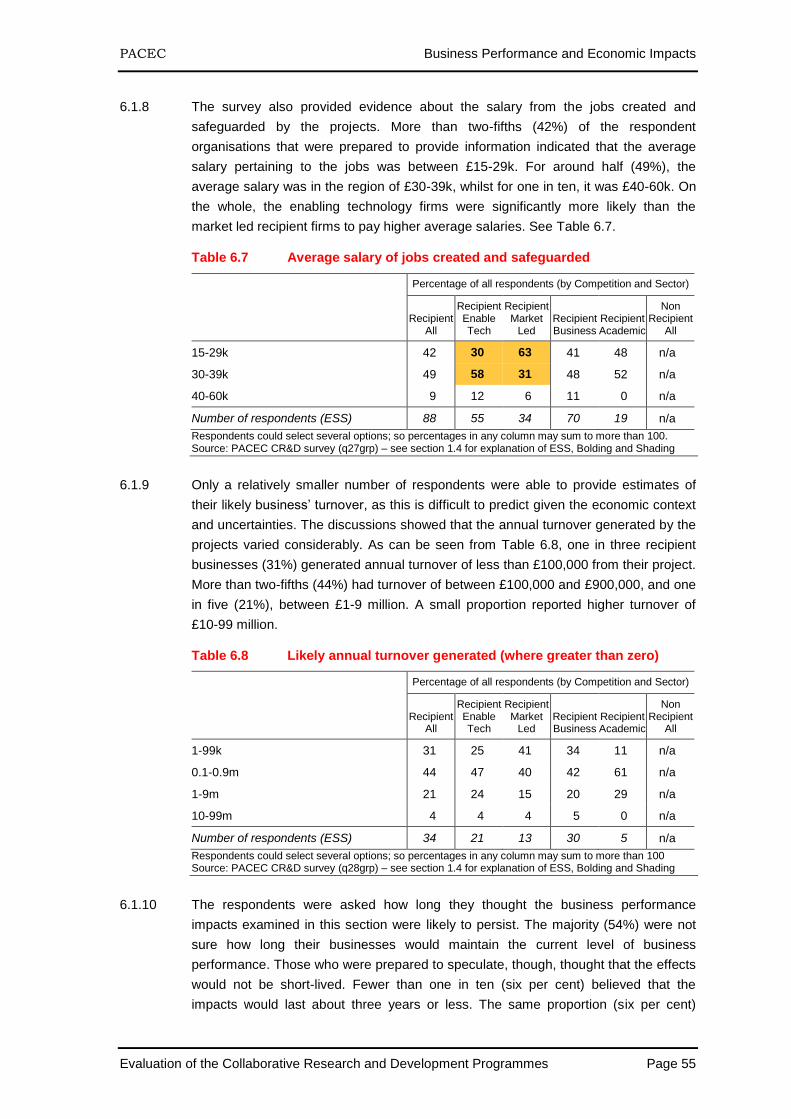
PACEC Business Performance and Economic Impacts
Evaluation of the Collaborative Research and Development Programmes Page 55
6.1.8 The survey also provided evidence about the salary from the jobs created and
safeguarded by the projects. More than two-fifths (42%) of the respondent
organisations that were prepared to provide information indicated that the average
salary pertaining to the jobs was between £15-29k. For around half (49%), the
average salary was in the region of £30-39k, whilst for one in ten, it was £40-60k. On
the whole, the enabling technology firms were significantly more likely than the
market led recipient firms to pay higher average salaries. See Table 6.7.
Table 6.7 Average salary of jobs created and safeguarded
Percentage of all respondents (by Competition and Sector)
Recipient
All
Recipient Enable Tech
Recipient Market
Led Recipient Business
Recipient Academic
Non Recipient
All
15-29k 42 30 63 41 48 n/a
30-39k 49 58 31 48 52 n/a
40-60k 9 12 6 11 0 n/a
Number of respondents (ESS) 88 55 34 70 19 n/a
Respondents could select several options; so percentages in any column may sum to more than 100. Source: PACEC CR&D survey (q27grp) – see section 1.4 for explanation of ESS, Bolding and Shading
6.1.9 Only a relatively smaller number of respondents were able to provide estimates of
their likely business’ turnover, as this is difficult to predict given the economic context
and uncertainties. The discussions showed that the annual turnover generated by the
projects varied considerably. As can be seen from Table 6.8, one in three recipient
businesses (31%) generated annual turnover of less than £100,000 from their project.
More than two-fifths (44%) had turnover of between £100,000 and £900,000, and one
in five (21%), between £1-9 million. A small proportion reported higher turnover of
£10-99 million.
Table 6.8 Likely annual turnover generated (where greater than zero)
Percentage of all respondents (by Competition and Sector)
Recipient
All
Recipient Enable Tech
Recipient Market
Led Recipient Business
Recipient Academic
Non Recipient
All
1-99k 31 25 41 34 11 n/a
0.1-0.9m 44 47 40 42 61 n/a
1-9m 21 24 15 20 29 n/a
10-99m 4 4 4 5 0 n/a
Number of respondents (ESS) 34 21 13 30 5 n/a
Respondents could select several options; so percentages in any column may sum to more than 100 Source: PACEC CR&D survey (q28grp) – see section 1.4 for explanation of ESS, Bolding and Shading
6.1.10 The respondents were asked how long they thought the business performance
impacts examined in this section were likely to persist. The majority (54%) were not
sure how long their businesses would maintain the current level of business
performance. Those who were prepared to speculate, though, thought that the effects
would not be short-lived. Fewer than one in ten (six per cent) believed that the
impacts would last about three years or less. The same proportion (six per cent)
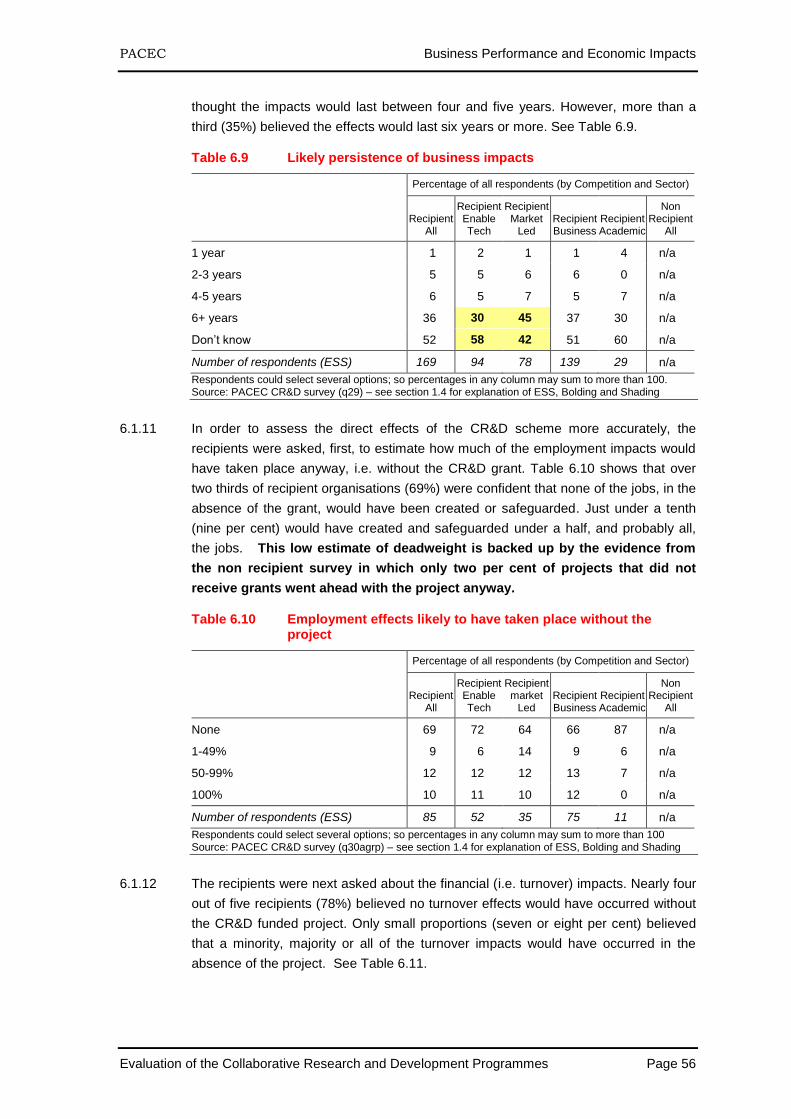
PACEC Business Performance and Economic Impacts
Evaluation of the Collaborative Research and Development Programmes Page 56
thought the impacts would last between four and five years. However, more than a
third (35%) believed the effects would last six years or more. See Table 6.9.
Table 6.9 Likely persistence of business impacts
Percentage of all respondents (by Competition and Sector)
Recipient
All
Recipient Enable Tech
Recipient Market
Led Recipient Business
Recipient Academic
Non Recipient
All
1 year 1 2 1 1 4 n/a
2-3 years 5 5 6 6 0 n/a
4-5 years 6 5 7 5 7 n/a
6+ years 36 30 45 37 30 n/a
Don’t know 52 58 42 51 60 n/a
Number of respondents (ESS) 169 94 78 139 29 n/a
Respondents could select several options; so percentages in any column may sum to more than 100. Source: PACEC CR&D survey (q29) – see section 1.4 for explanation of ESS, Bolding and Shading
6.1.11 In order to assess the direct effects of the CR&D scheme more accurately, the
recipients were asked, first, to estimate how much of the employment impacts would
have taken place anyway, i.e. without the CR&D grant. Table 6.10 shows that over
two thirds of recipient organisations (69%) were confident that none of the jobs, in the
absence of the grant, would have been created or safeguarded. Just under a tenth
(nine per cent) would have created and safeguarded under a half, and probably all,
the jobs. This low estimate of deadweight is backed up by the evidence from
the non recipient survey in which only two per cent of projects that did not
receive grants went ahead with the project anyway.
Table 6.10 Employment effects likely to have taken place without the project
Percentage of all respondents (by Competition and Sector)
Recipient
All
Recipient Enable Tech
Recipient market
Led Recipient Business
Recipient Academic
Non Recipient
All
None 69 72 64 66 87 n/a
1-49% 9 6 14 9 6 n/a
50-99% 12 12 12 13 7 n/a
100% 10 11 10 12 0 n/a
Number of respondents (ESS) 85 52 35 75 11 n/a
Respondents could select several options; so percentages in any column may sum to more than 100 Source: PACEC CR&D survey (q30agrp) – see section 1.4 for explanation of ESS, Bolding and Shading
6.1.12 The recipients were next asked about the financial (i.e. turnover) impacts. Nearly four
out of five recipients (78%) believed no turnover effects would have occurred without
the CR&D funded project. Only small proportions (seven or eight per cent) believed
that a minority, majority or all of the turnover impacts would have occurred in the
absence of the project. See Table 6.11.
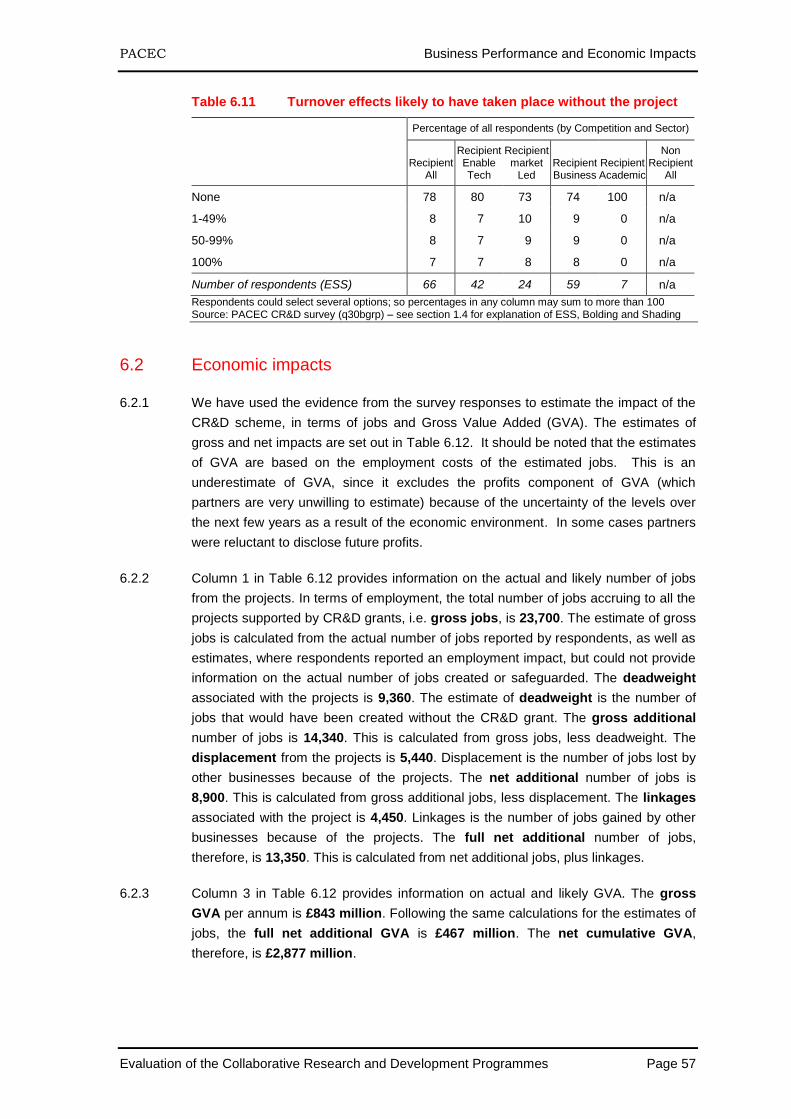
PACEC Business Performance and Economic Impacts
Evaluation of the Collaborative Research and Development Programmes Page 57
Table 6.11 Turnover effects likely to have taken place without the project
Percentage of all respondents (by Competition and Sector)
Recipient
All
Recipient Enable Tech
Recipient market
Led Recipient Business
Recipient Academic
Non Recipient
All
None 78 80 73 74 100 n/a
1-49% 8 7 10 9 0 n/a
50-99% 8 7 9 9 0 n/a
100% 7 7 8 8 0 n/a
Number of respondents (ESS) 66 42 24 59 7 n/a
Respondents could select several options; so percentages in any column may sum to more than 100 Source: PACEC CR&D survey (q30bgrp) – see section 1.4 for explanation of ESS, Bolding and Shading
6.2 Economic impacts
6.2.1 We have used the evidence from the survey responses to estimate the impact of the
CR&D scheme, in terms of jobs and Gross Value Added (GVA). The estimates of
gross and net impacts are set out in Table 6.12. It should be noted that the estimates
of GVA are based on the employment costs of the estimated jobs. This is an
underestimate of GVA, since it excludes the profits component of GVA (which
partners are very unwilling to estimate) because of the uncertainty of the levels over
the next few years as a result of the economic environment. In some cases partners
were reluctant to disclose future profits.
6.2.2 Column 1 in Table 6.12 provides information on the actual and likely number of jobs
from the projects. In terms of employment, the total number of jobs accruing to all the
projects supported by CR&D grants, i.e. gross jobs, is 23,700. The estimate of gross
jobs is calculated from the actual number of jobs reported by respondents, as well as
estimates, where respondents reported an employment impact, but could not provide
information on the actual number of jobs created or safeguarded. The deadweight
associated with the projects is 9,360. The estimate of deadweight is the number of
jobs that would have been created without the CR&D grant. The gross additional
number of jobs is 14,340. This is calculated from gross jobs, less deadweight. The
displacement from the projects is 5,440. Displacement is the number of jobs lost by
other businesses because of the projects. The net additional number of jobs is
8,900. This is calculated from gross additional jobs, less displacement. The linkages
associated with the project is 4,450. Linkages is the number of jobs gained by other
businesses because of the projects. The full net additional number of jobs,
therefore, is 13,350. This is calculated from net additional jobs, plus linkages.
6.2.3 Column 3 in Table 6.12 provides information on actual and likely GVA. The gross
GVA per annum is £843 million. Following the same calculations for the estimates of
jobs, the full net additional GVA is £467 million. The net cumulative GVA,
therefore, is £2,877 million.
PACEC Business Performance and Economic Impacts
Evaluation of the Collaborative Research and Development Programmes Page 58
Table 6.12 Jobs and GVA: gross to net impacts
Jobs (000s) (Full Time Equivalents)
Gross Value Added (£m per annum)
Actual+Likely Actual Actual+Likely Actual
Gross 23.70 1.36 843 134
Deadweight 9.36 0.47 346 73
Gross Additional 14.34 0.88 497 61
Displacement 5.44 0.33 186 23
Net additional 8.90 0.56 311 38
Linkages 4.45 0.28 156 19
Full Net Additional 13.35 0.83 467 56
Net Cumulative 2,877 361
Deadweight (/%) 40% 35% 41% 55%
Displacement (/%) 38% 37% 37% 38%
Linkages 1.5 1.5 1.5 1.5
Persistence 6.2 6.4
Source: PACEC CR&D survey
6.2.4 Table 6.13 provides summary evidence of the cost-effectiveness of the CR&D
scheme, based on a number of [cost effectiveness] measures, at current and 2010
prices. The project costs is £429 million. The total amount of grants disbursed to all
the projects was £195 million. The cost per gross job is £18,000 (Project costs/Gross
Jobs). The full net cost of jobs is £32,000 (Project costs /Full Net Additional Jobs).
The Gross Value Added for every pound spent is £1.97 (GVA/ Project costs). The net
cumulative GVA per pound spent is £6.71 (Net Cumulative GVA/ Project costs). This
means that every £1 spent by Technology Strategy Board increased GVA by £6.71.
PACEC Business Performance and Economic Impacts
Evaluation of the Collaborative Research and Development Programmes Page 59
Table 6.13 The Cost Effectiveness of CR&D
Cost Effectiveness measures
(Current Prices) (2010 Prices)
Actual+Likely Actual Actual+Likely Actual
Total Project costs (£m) 429 429 486 486
TSB Expenditure (£m) 195 195 221 221
Gross Jobs (FTE 000s) 23.70 1.36 23.70 1.36
Net Additional Jobs (FTE 000s) 8.90 0.56 8.90 0.56
Full Net Additional Jobs (FTE 000s) 13.35 0.83 13.35 0.83
Cost / Gross Job (£k) 18 316 20 358
Cost / Net Additional Job (£k) 48 772 55 875
Cost / Full Net Attributable Job (£k) 32 515 36 584
Gross GVA (£m pa) 843 134 843 134
Net Additional GVA (£m pa) 311 38 311 38
Full Net Additional GVA (£m pa) 467 56 467 56
Net Cumulative GVA (£m) 2,877 361 2,792 340
Gross GVA / £ spent 1.97 0.31 1.74 0.28
Net Additional GVA / £ spent 0.73 0.09 0.64 0.08
Full Net Additional GVA / £ spent 1.09 0.13 0.96 0.12
Net Cumulative GVA / £ spent 6.71 0.84 5.75 0.70
Source: PACEC CR&D survey
6.2.5 There are likely to be additional impacts as the CR&D technologies and knowledge is
transferred as partners leave their projects or the technology in the public domain
feeds into other products, services and processes.
6.2.6 The methodology used for the evaluation allows some cost effectiveness
comparisons to be made with other evaluations for R&D programmes that have
funded R&D through grants. This is where similar approaches have been used and
they also reflect the unique characteristics of their schemes. This comparison is
shown in Table 6.14 for Smart and Grants for R&D (GRD) and other schemes. While
the cost per job of CR&D (£36k) falls within the range found for GRD and Smart
(£31k to £38k), CR&D’s albeit high level of GVA return on investment (£5.75) is not
as high as the very high levels achieved by GRD (£9) and Smart (£10).
PACEC Business Performance and Economic Impacts
Evaluation of the Collaborative Research and Development Programmes Page 60
Table 6.14 The Cost Effectiveness of CR&D and Other Programmes
CR&D GRD
Smart: Scotland
Smart (England)
Full net additional attributable job (FTE) cost £36k £32k £38k £31k
Net cumulative GVA / £ spent £5.75 £9 £10 N/A
Source: PACEC7
6.2.7 Table 6.15 provides and summarises evidence of the cost effectiveness of the CR&D
scheme according to the characteristics of the recipient organisations. When looking
at the table it should be noted that high levels of impacts give rise to low cost per job
and high GVA per £ spent. The observations from the table are:
● There is very little difference between the effectiveness of CR&D (as measured either by cost per job or GVA generated per unit of grant) between the Enabling technologies and the Market Led grants as a whole. While there is considerable variation between the individual sectors, caution should be applied to drawing any conclusions due the relatively small sample sizes and due to the Pareto effect (where a five per cent of projects give rise to 87% of the impacts). However, the results do show that there are some projects (in transport and materials/nano) which have particularly large economic impacts
● The fact that business performance effects in academic partners (£0.90 GVA per £ spent) are almost a tenth of those in business organisations (£8.13) reflects the different roles that academic and business partners play in projects. However, the benefit of academic involvement is clearly demonstrated by the fact that the overall business impacts in projects with two or more academic partners (£9.67) are more than double those in projects with no academics (£4.22)
● There is some evidence that grants over £750k give rise to smaller business performance effects (£2.34 of GVA per £ spent) than either grants under £250k (£10.96) or medium sized grants, between £250 and £749k (£10.01)
● There is some evidence that the optimal number of partners is 4 or 5, since these projects gave rise to greater business performance effects (£8.91 GVA per £ spent) than either those with only 2 or 3 partners (£4.81) or those with 6 or more partners (£6.57)
● Business impacts are five times greater in late (2007 or later) projects compared with early (2006 or earlier) projects. It is impossible to infer from the research whether this is due to greater realism (and less optimism) in older projects
7 Sources: PACEC studies on the Evaluation of Grants for R&D and Smart (BIS. 2009), the
Evaluation of SMART: Scotland (Scottish Government. 2010), and the Evaluation of Smart (DTI.
2001/02).
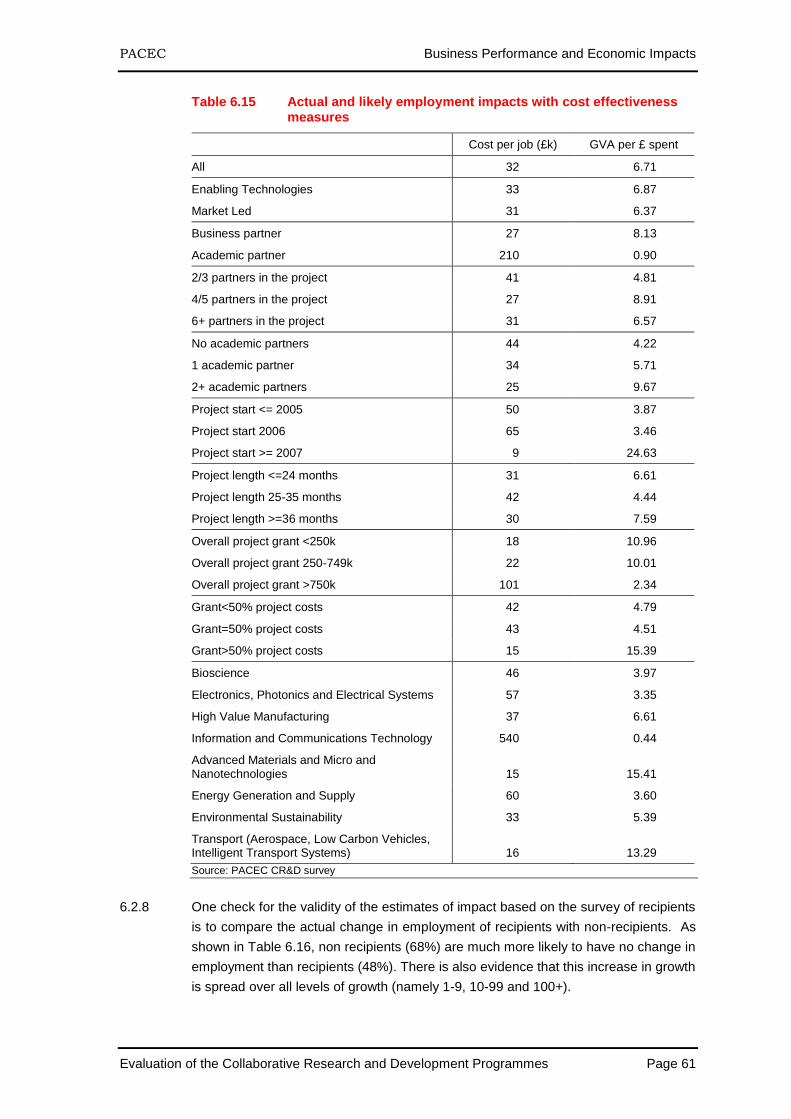
PACEC Business Performance and Economic Impacts
Evaluation of the Collaborative Research and Development Programmes Page 61
Table 6.15 Actual and likely employment impacts with cost effectiveness measures
Cost per job (£k) GVA per £ spent
All 32 6.71
Enabling Technologies 33 6.87
Market Led 31 6.37
Business partner 27 8.13
Academic partner 210 0.90
2/3 partners in the project 41 4.81
4/5 partners in the project 27 8.91
6+ partners in the project 31 6.57
No academic partners 44 4.22
1 academic partner 34 5.71
2+ academic partners 25 9.67
Project start <= 2005 50 3.87
Project start 2006 65 3.46
Project start >= 2007 9 24.63
Project length <=24 months 31 6.61
Project length 25-35 months 42 4.44
Project length >=36 months 30 7.59
Overall project grant <250k 18 10.96
Overall project grant 250-749k 22 10.01
Overall project grant >750k 101 2.34
Grant<50% project costs 42 4.79
Grant=50% project costs 43 4.51
Grant>50% project costs 15 15.39
Bioscience 46 3.97
Electronics, Photonics and Electrical Systems 57 3.35
High Value Manufacturing 37 6.61
Information and Communications Technology 540 0.44
Advanced Materials and Micro and Nanotechnologies 15 15.41
Energy Generation and Supply 60 3.60
Environmental Sustainability 33 5.39
Transport (Aerospace, Low Carbon Vehicles, Intelligent Transport Systems) 16 13.29
Source: PACEC CR&D survey
6.2.8 One check for the validity of the estimates of impact based on the survey of recipients
is to compare the actual change in employment of recipients with non-recipients. As
shown in Table 6.16, non recipients (68%) are much more likely to have no change in
employment than recipients (48%). There is also evidence that this increase in growth
is spread over all levels of growth (namely 1-9, 10-99 and 100+).
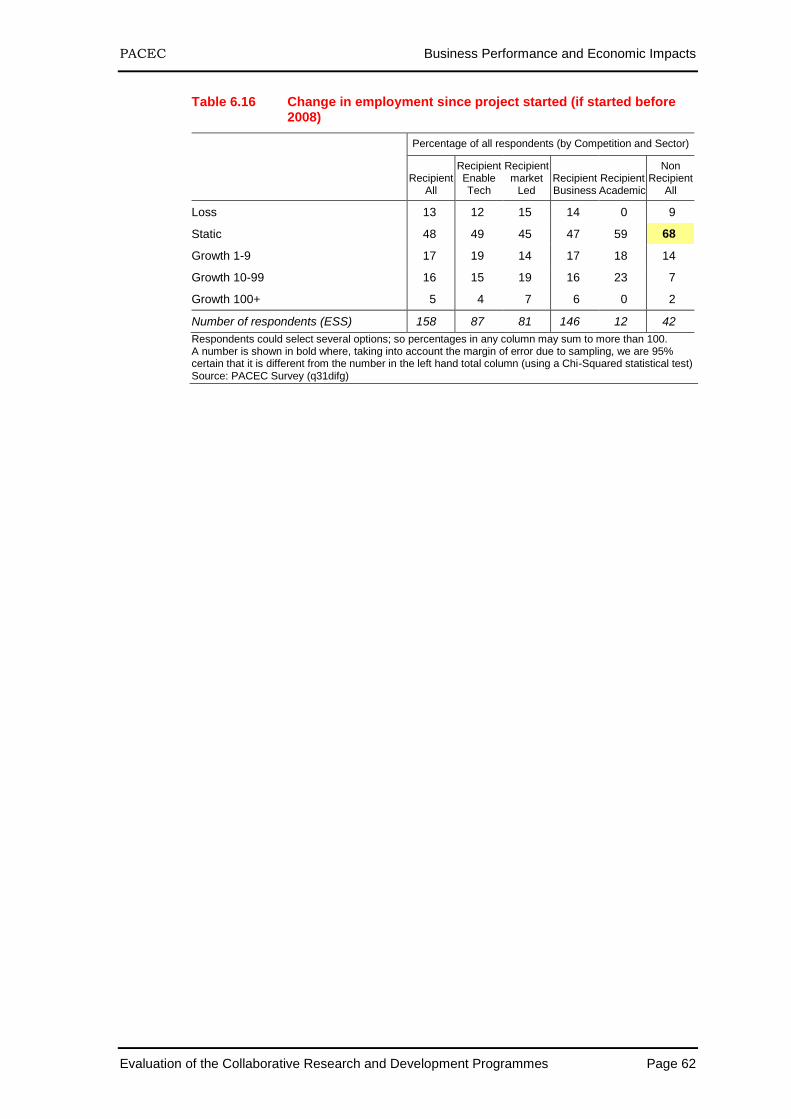
PACEC Business Performance and Economic Impacts
Evaluation of the Collaborative Research and Development Programmes Page 62
Table 6.16 Change in employment since project started (if started before 2008)
Percentage of all respondents (by Competition and Sector)
Recipient
All
Recipient Enable Tech
Recipient market
Led Recipient Business
Recipient Academic
Non Recipient
All
Loss 13 12 15 14 0 9
Static 48 49 45 47 59 68
Growth 1-9 17 19 14 17 18 14
Growth 10-99 16 15 19 16 23 7
Growth 100+ 5 4 7 6 0 2
Number of respondents (ESS) 158 87 81 146 12 42
Respondents could select several options; so percentages in any column may sum to more than 100. A number is shown in bold where, taking into account the margin of error due to sampling, we are 95% certain that it is different from the number in the left hand total column (using a Chi-Squared statistical test) Source: PACEC Survey (q31difg)
PACEC Wider Effects
Evaluation of the Collaborative Research and Development Programmes Page 63
7 Wider Effects
The research examined two aspects of the wider effects: the effect on strategic
partners and in particular the extent to which CR&D allows them to achieve their
aims; and the wider impact of businesses who were awarded the CR&D grant
7.1 Wider impacts on strategic partners
7.1.1 The Technology Strategy Board and CR&D partners at national and regional levels
provide direct funding to CR&D of some 6.5% of project expenditure and provide
resources in kind through helping to develop the CR&D strategy, exchange views and
become involved in the different stages of applications and project monitoring. They
also provide some advice to businesses, in particular, on their innovation services (as
well as funding), the relationship to CR&D and refer potential participants to CR&D.
7.1.2 All the partners consulted considered that CR&D helped them to achieve their
objectives with respect to collaborative innovation and R&D, prototyping and
demonstrating outputs, and deploying them through exploitation. CR&D, in their
view, contributed to the strategic alignment of programmes and a more joined up
approach in the public sector support for key priority sectors, technologies and
platforms as well as the challenge and competitive approach to collaborative projects.
This allows the partner and CR&D funding to be more focused than it otherwise
would be and the risks to be shared, culminating in additional benefits to the UK
economy. Partners also referred businesses and academics on their own
programmes to CR&D to help underpin the collaborative approach and ensure
outcomes could be achieved. The joint working contributed to the synergies between
partners and the innovation programmes.
7.2 Wider impacts of project partners
7.2.1 The survey investigated recipients’ views about whether there were any positive or
negative wider effects of CR&D projects on other firms and organisations, and on the
wider economy. They were asked, first, whether they thought there had been, or are
likely to be any positive effects from the projects, on their customers, suppliers or
competitors. Table 7.1 shows that most recipients thought the project effects would
be felt more by their customers. Almost half of the recipients (48%) believed this to be
the case. One in six (17%) thought their suppliers had benefited, and just over one in
ten (13%), their competitors. It is worth pointing out that almost one in three of the
recipients (31%) did not think their projects had had any positive effects on their
customers, suppliers or competitors.
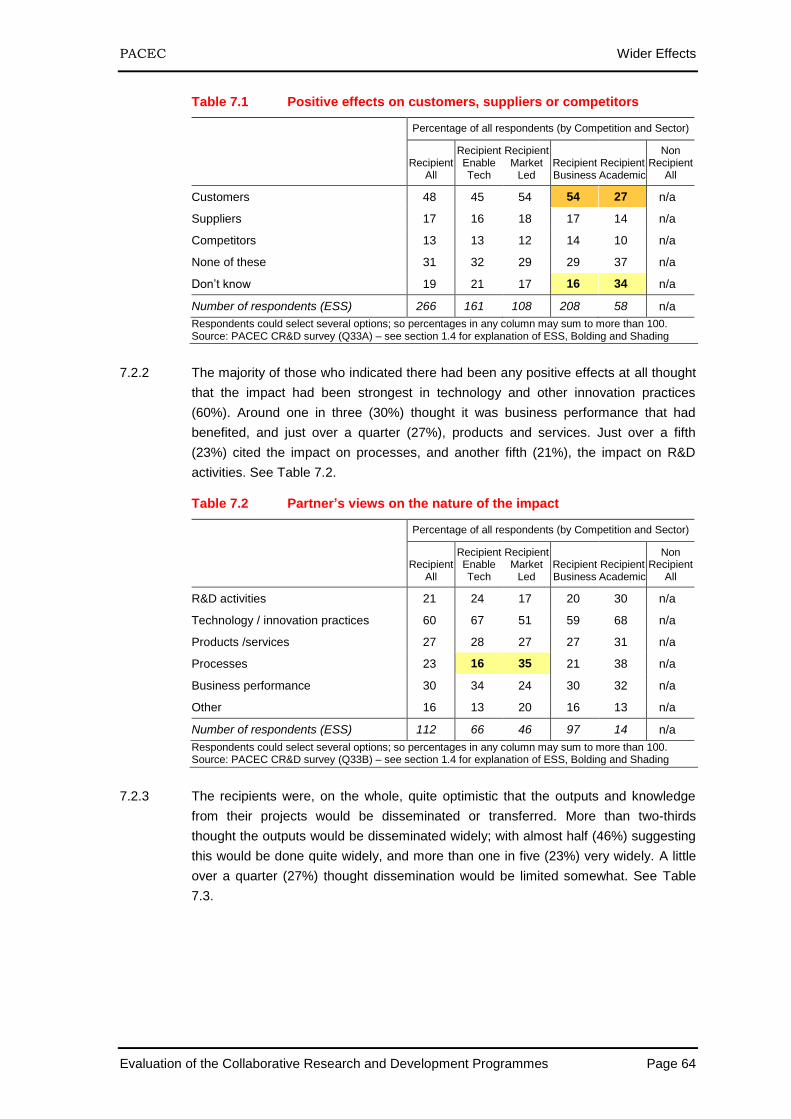
PACEC Wider Effects
Evaluation of the Collaborative Research and Development Programmes Page 64
Table 7.1 Positive effects on customers, suppliers or competitors
Percentage of all respondents (by Competition and Sector)
Recipient
All
Recipient Enable Tech
Recipient Market
Led Recipient Business
Recipient Academic
Non Recipient
All
Customers 48 45 54 54 27 n/a
Suppliers 17 16 18 17 14 n/a
Competitors 13 13 12 14 10 n/a
None of these 31 32 29 29 37 n/a
Don’t know 19 21 17 16 34 n/a
Number of respondents (ESS) 266 161 108 208 58 n/a
Respondents could select several options; so percentages in any column may sum to more than 100. Source: PACEC CR&D survey (Q33A) – see section 1.4 for explanation of ESS, Bolding and Shading
7.2.2 The majority of those who indicated there had been any positive effects at all thought
that the impact had been strongest in technology and other innovation practices
(60%). Around one in three (30%) thought it was business performance that had
benefited, and just over a quarter (27%), products and services. Just over a fifth
(23%) cited the impact on processes, and another fifth (21%), the impact on R&D
activities. See Table 7.2.
Table 7.2 Partner’s views on the nature of the impact
Percentage of all respondents (by Competition and Sector)
Recipient
All
Recipient Enable Tech
Recipient Market
Led Recipient Business
Recipient Academic
Non Recipient
All
R&D activities 21 24 17 20 30 n/a
Technology / innovation practices 60 67 51 59 68 n/a
Products /services 27 28 27 27 31 n/a
Processes 23 16 35 21 38 n/a
Business performance 30 34 24 30 32 n/a
Other 16 13 20 16 13 n/a
Number of respondents (ESS) 112 66 46 97 14 n/a
Respondents could select several options; so percentages in any column may sum to more than 100. Source: PACEC CR&D survey (Q33B) – see section 1.4 for explanation of ESS, Bolding and Shading
7.2.3 The recipients were, on the whole, quite optimistic that the outputs and knowledge
from their projects would be disseminated or transferred. More than two-thirds
thought the outputs would be disseminated widely; with almost half (46%) suggesting
this would be done quite widely, and more than one in five (23%) very widely. A little
over a quarter (27%) thought dissemination would be limited somewhat. See Table
7.3.
PACEC Wider Effects
Evaluation of the Collaborative Research and Development Programmes Page 65
Table 7.3 Partner’s views on the likely dissemination or transfer of project outputs
Percentage of all respondents (by Competition and Sector)
Recipient
All
Recipient Enable Tech
Recipient Market
Led Recipient Business
Recipient Academic
Non Recipient
All
Very widely 23 23 22 21 31 n/a
Quite widely 46 47 42 44 49 n/a
Limited amount 27 25 31 29 18 n/a
Not at all 5 5 5 6 2 n/a
Number of respondents (ESS) 266 166 104 206 61 n/a
Source: PACEC CR&D survey (Q34A) – see section 1.4 for explanation of ESS, Bolding and Shading
7.2.4 Those who indicated the outputs would be widely disseminated believed they would
have a world-wide audience. Table 7.4 shows that almost nine in ten (86%) thought
the outputs would have international application. One in three (32%), however,
thought dissemination was likely to be limited to the UK. At the same time, more than
one in ten respondents (12%) thought the product outputs would have application in
other sectors, while a much smaller proportion thought they could be applied to other
technologies (six per cent) or other products (four per cent).
Table 7.4 Recipients’ views on the likely areas for wider dissemination of project outputs
Percentage of all respondents (by Competition and Sector)
Recipient
All
Recipient Enable Tech
Recipient Market
Led Recipient Business
Recipient Academic
Non Recipient
All
Across UK 32 33 29 32 32 n/a
Internationally 86 85 86 84 90 n/a
Other technologies 6 8 2 5 11 n/a
Other sectors 12 12 10 11 14 n/a
Products/services 4 4 2 3 5 n/a
Processes 1 1 1 1 2 n/a
Number of respondents (ESS) 207 134 76 157 50 n/a
Respondents could select several options; so percentages in any column may sum to more than 100 Source: PACEC CR&D survey (Q34B) – see section 1.4 for explanation of ESS, Bolding and Shading
7.2.5 Given their views about the positive effects of the project outputs on their customers,
suppliers and competitors, it is not surprising that the overwhelming majority of these
also did not think there had been any negative effects on those organisations. See
Table 7.5.
PACEC Wider Effects
Evaluation of the Collaborative Research and Development Programmes Page 66
Table 7.5 Organisations suffering negative effects
Percentage of all respondents (by Competition and Sector)
Recipient
All
Recipient Enable Tech
Recipient Market
Led Recipient Business
Recipient Academic
Non Recipient
All
Customers 1 0 1 1 0 n/a
Suppliers 1 0 1 1 0 n/a
Competitors 2 3 1 2 0 n/a
None of these 83 83 85 84 80 n/a
Number of respondents (ESS) 282 171 114 215 67 n/a
Source: PACEC CR&D survey (Q35A) – see section 1.4 for explanation of ESS, Bolding and Shading
7.2.6 Lastly in this section, the recipients were asked what they thought would happen to
the sales arising from the project, if they suddenly ceased trading. Their views were
highly polarised. Half of them (50%) did not think any of their sales would be taken by
UK competitors, while almost two-fifths (37%) thought all their sales would be. Just
over one in ten (13%) thought this would be somewhere in-between the two. See
Table 7.6.
Table 7.6 Partner’s views on % of sales arising from the project that would be taken by UK competitors if they ceased trading
Percentage of all respondents (by Competition and Sector)
Recipient
All
Recipient Enable Tech
Recipient market
Led Recipient Business
Recipient Academic
Non Recipient
All
None 50 54 41 58 26 n/a
1-49% 6 7 5 6 6 n/a
50-99% 7 6 9 4 16 n/a
100% 37 33 45 32 51 n/a
Number of respondents (ESS) 73 51 22 52 22 n/a
Source: PACEC CR&D survey (Q36) – see section 1.4 for explanation of ESS, Bolding and Shading
PACEC Additionality of the projects
Evaluation of the Collaborative Research and Development Programmes Page 67
8 Additionality of the projects
8.1.1 The respondents were asked a series of questions intended to find out what they
thought might have happened to their firms’ projects if they had not received funding
from the CR&D scheme. Table 8.1 provides further evidence of the importance of
CR&D funding to the success of the recipients’ projects. Seven out of ten of all
recipients (70%) indicated that they would definitely not have proceeded with their
project if they had not received a CR&D award. One in six (16%) said they would
probably not have gone ahead with their project. Only around one in ten were certain
they would have probably (seven per cent) or definitely (two per cent) gone ahead
without CR&D funding.
Table 8.1 Recipients’ views on whether their project would have gone ahead without a CR&D award
Percentage of all respondents (by Competition and Sector)
Recipient
All
Recipient Enable Tech
Recipient Market
Led Recipient Business
Recipient Academic
Non Recipient
All
Definitely 2 2 4 2 2 n/a
Probably 7 7 6 7 6 n/a
Possibly 4 3 7 5 1 n/a
Probably not 16 20 10 17 16 n/a
Definitely not 70 69 73 69 74 n/a
Number of respondents (ESS) 271 166 109 210 62 n/a
Source: PACEC CR&D survey (Q32A1) – see section 1.4 for explanation of ESS, Bolding and Shading
8.1.2 The majority of those who indicated that their project would have definitely or
probably proceeded without the award conceded they would have delayed the project
for anything up to five years. Approximately two-thirds would have delayed their
project for 1-2 years, and a fifth (21%), for between three and five years. Only one in
ten (11%) thought their project would have gone ahead at the same time it did.
8.1.3 Only a small number of those saying they would have proceeded without CR&D
funding provided some indication about the likely scale of the project. Around half of
these (52%), thought it would have been on the same scale. The rest believed the
projects would have been smaller; and, variously, between a quarter (15%) and
three-quarters (13%) of the present scale. See Table 8.3.
8.1.4 The same respondents were asked about the scope of their project, if they had not
received CR&D funding. The majority (65%) were, again, certain that the aims and
focus of their project would have been the same. The rest thought the scope would
have been different: and either slightly (11%), moderately (13%) or very (11%)
different. See Table 8.4.
PACEC Additionality of the projects
Evaluation of the Collaborative Research and Development Programmes Page 68
Table 8.2 Timing of the projects without CR&D funding
Percentage of all respondents (by Competition and Sector)
Recipient
All
Recipient Enable Tech
Recipient Market
Led Recipient Business
Recipient Academic
Non Recipient
All
Sooner 2 0 5 2 0 n/a
Same 11 5 20 13 0 n/a
1-2yr later 66 73 56 60 100 n/a
3-5 yrs later 21 23 19 25 0 n/a
6+yrs later 0 0 0 0 0 n/a
Number of respondents (ESS) 35 17 21 29 6 n/a
Source: PACEC CR&D survey (Q32A2) – see section 1.4 for explanation of ESS, Bolding and Shading
Table 8.3 Scale of the project without CR&D funding
Percentage of all respondents (by Competition and Sector)
Recipient
All
Recipient Enable Tech
Recipient Market
Led Recipient Business
Recipient Academic
Non Recipient
All
Greater 2 0 5 2 0 n/a
Same 52 66 30 50 69 n/a
¾ the size 13 12 14 13 12 n/a
½ the size 18 8 35 18 19 n/a
¼ the size 15 14 16 17 0 n/a
Number of respondents (ESS) 34 17 20 29 5 n/a
Source: PACEC CR&D survey (Q32A3) – see section 1.4 for explanation of ESS, Bolding and Shading
Table 8.4 Scope of the project (aims / focus) without CR&D funding
Percentage of all respondents (by Competition and Sector)
Recipient
All
Recipient Enable Tech
Recipient Market
Led Recipient Business
Recipient Academic
Non Recipient
All
Same 65 68 59 66 60 n/a
Slightly different 11 12 10 11 11 n/a
Moderately different 13 6 24 11 29 n/a
Very different 11 14 6 13 0 n/a
Number of respondents (ESS) 33 17 19 28 5 n/a
Source: PACEC CR&D survey (Q32A4) – see section 1.4 for explanation of ESS, Bolding and Shading
8.1.5 68% of the case study interviewees stated that they were currently active in exploiting
the outputs of their projects. On average, they felt that they were two years ahead of
their competition in terms of technological development and market exploitation.
8.1.6 Lastly, in this section, those who indicated they would have proceeded without CR&D
funding were probed further to find out about the possible alternative sources of
funding they would have used for their projects. As can be seen from Table 8.5, the
large majority (65%) would rely on their own (internal) finances. Around one in ten
(12%) would have applied for a research and development grant (GRD), and a
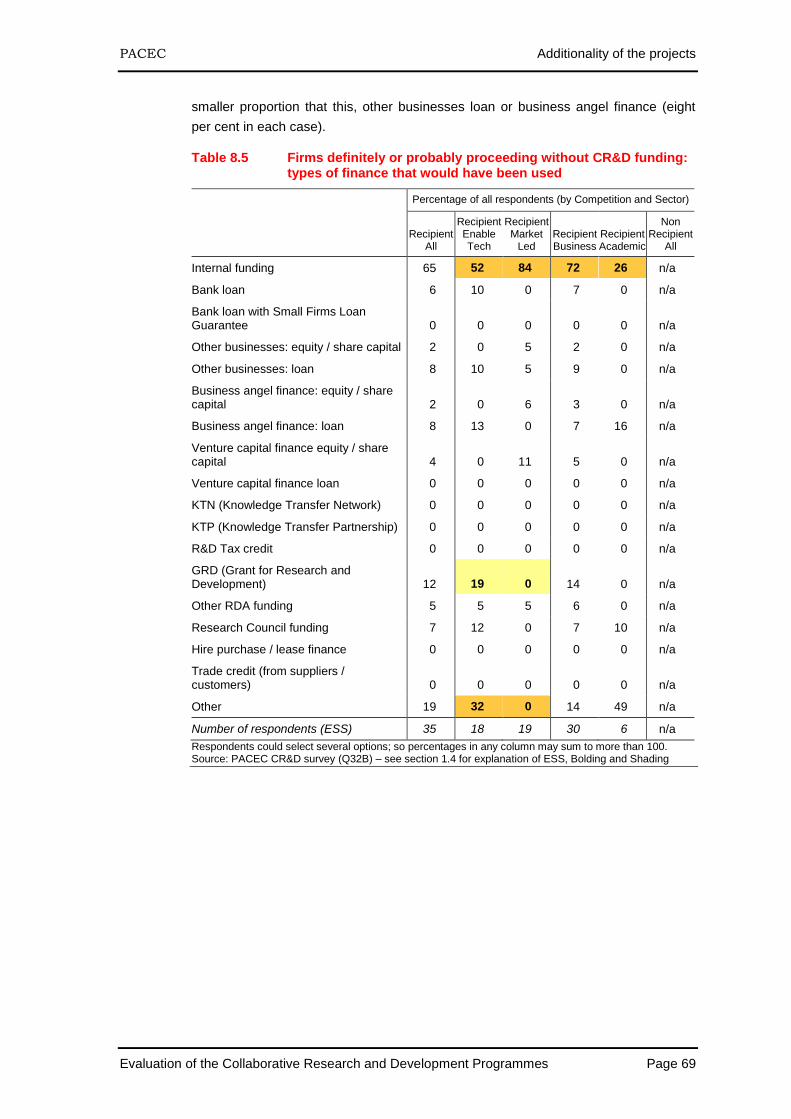
PACEC Additionality of the projects
Evaluation of the Collaborative Research and Development Programmes Page 69
smaller proportion that this, other businesses loan or business angel finance (eight
per cent in each case).
Table 8.5 Firms definitely or probably proceeding without CR&D funding: types of finance that would have been used
Percentage of all respondents (by Competition and Sector)
Recipient
All
Recipient Enable Tech
Recipient Market
Led Recipient Business
Recipient Academic
Non Recipient
All
Internal funding 65 52 84 72 26 n/a
Bank loan 6 10 0 7 0 n/a
Bank loan with Small Firms Loan Guarantee 0 0 0 0 0 n/a
Other businesses: equity / share capital 2 0 5 2 0 n/a
Other businesses: loan 8 10 5 9 0 n/a
Business angel finance: equity / share capital 2 0 6 3 0 n/a
Business angel finance: loan 8 13 0 7 16 n/a
Venture capital finance equity / share capital 4 0 11 5 0 n/a
Venture capital finance loan 0 0 0 0 0 n/a
KTN (Knowledge Transfer Network) 0 0 0 0 0 n/a
KTP (Knowledge Transfer Partnership) 0 0 0 0 0 n/a
R&D Tax credit 0 0 0 0 0 n/a
GRD (Grant for Research and Development) 12 19 0 14 0 n/a
Other RDA funding 5 5 5 6 0 n/a
Research Council funding 7 12 0 7 10 n/a
Hire purchase / lease finance 0 0 0 0 0 n/a
Trade credit (from suppliers / customers) 0 0 0 0 0 n/a
Other 19 32 0 14 49 n/a
Number of respondents (ESS) 35 18 19 30 6 n/a
Respondents could select several options; so percentages in any column may sum to more than 100. Source: PACEC CR&D survey (Q32B) – see section 1.4 for explanation of ESS, Bolding and Shading
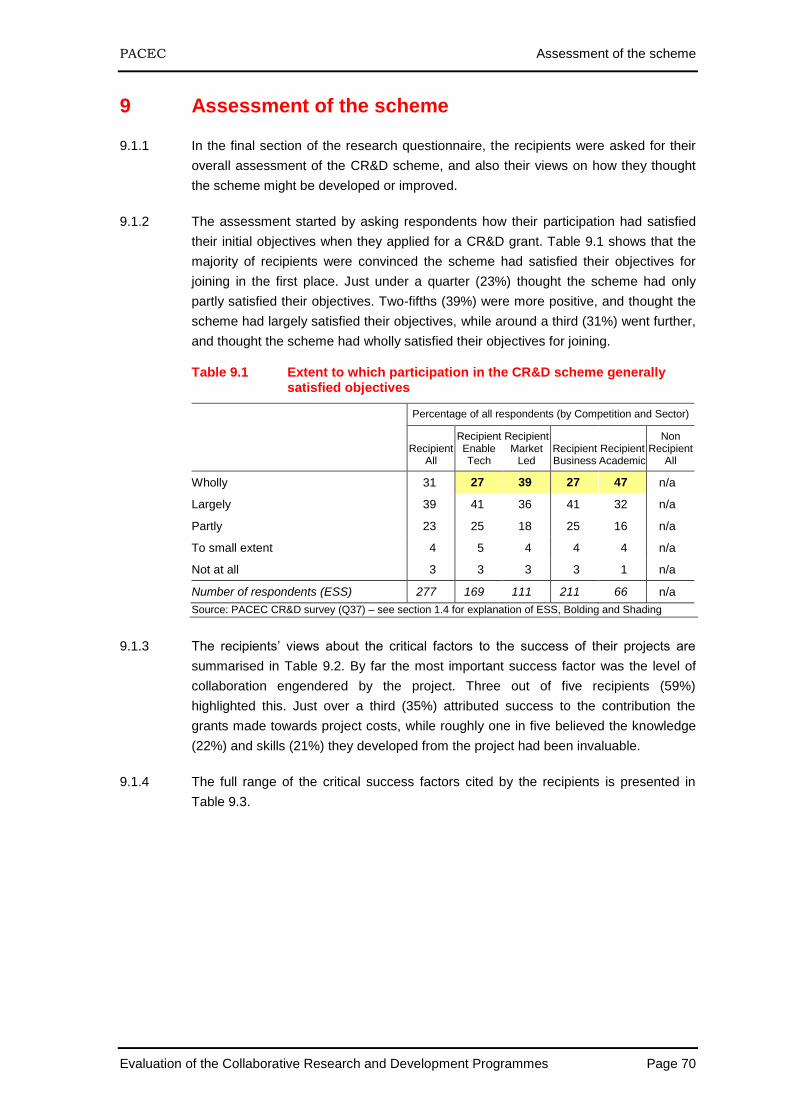
PACEC Assessment of the scheme
Evaluation of the Collaborative Research and Development Programmes Page 70
9 Assessment of the scheme
9.1.1 In the final section of the research questionnaire, the recipients were asked for their
overall assessment of the CR&D scheme, and also their views on how they thought
the scheme might be developed or improved.
9.1.2 The assessment started by asking respondents how their participation had satisfied
their initial objectives when they applied for a CR&D grant. Table 9.1 shows that the
majority of recipients were convinced the scheme had satisfied their objectives for
joining in the first place. Just under a quarter (23%) thought the scheme had only
partly satisfied their objectives. Two-fifths (39%) were more positive, and thought the
scheme had largely satisfied their objectives, while around a third (31%) went further,
and thought the scheme had wholly satisfied their objectives for joining.
Table 9.1 Extent to which participation in the CR&D scheme generally satisfied objectives
Percentage of all respondents (by Competition and Sector)
Recipient
All
Recipient Enable Tech
Recipient Market
Led Recipient Business
Recipient Academic
Non Recipient
All
Wholly 31 27 39 27 47 n/a
Largely 39 41 36 41 32 n/a
Partly 23 25 18 25 16 n/a
To small extent 4 5 4 4 4 n/a
Not at all 3 3 3 3 1 n/a
Number of respondents (ESS) 277 169 111 211 66 n/a
Source: PACEC CR&D survey (Q37) – see section 1.4 for explanation of ESS, Bolding and Shading
9.1.3 The recipients’ views about the critical factors to the success of their projects are
summarised in Table 9.2. By far the most important success factor was the level of
collaboration engendered by the project. Three out of five recipients (59%)
highlighted this. Just over a third (35%) attributed success to the contribution the
grants made towards project costs, while roughly one in five believed the knowledge
(22%) and skills (21%) they developed from the project had been invaluable.
9.1.4 The full range of the critical success factors cited by the recipients is presented in
Table 9.3.
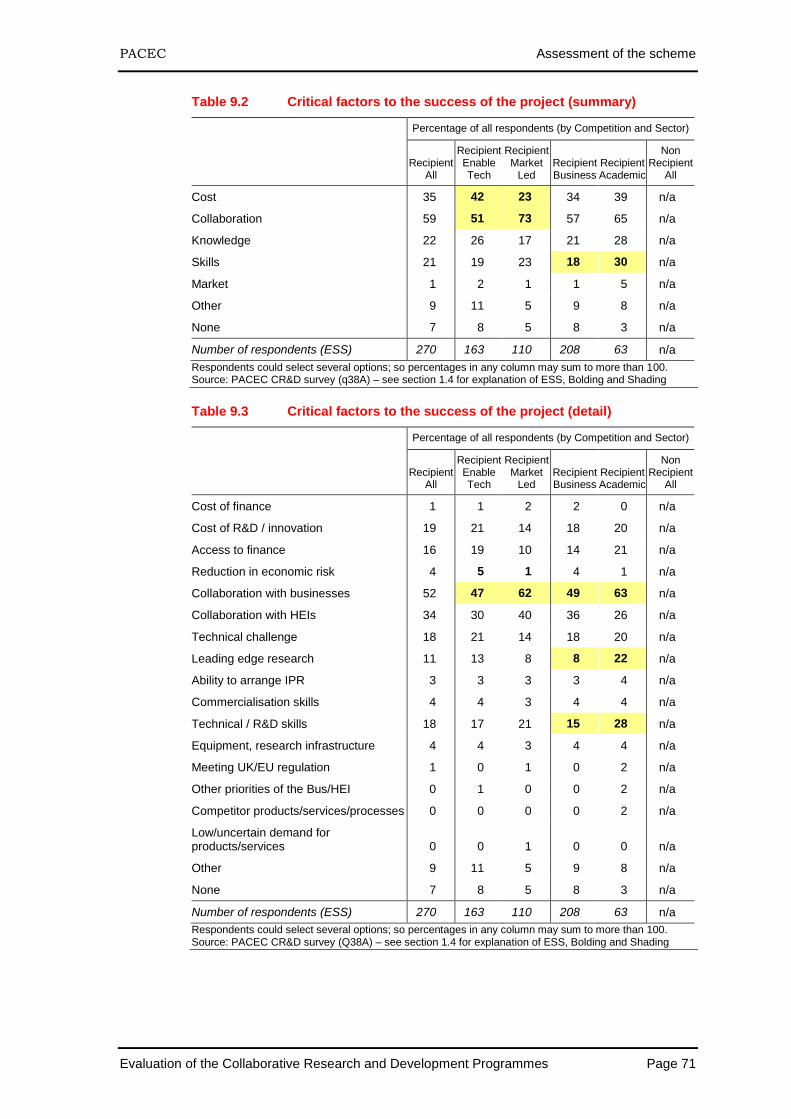
PACEC Assessment of the scheme
Evaluation of the Collaborative Research and Development Programmes Page 71
Table 9.2 Critical factors to the success of the project (summary)
Percentage of all respondents (by Competition and Sector)
Recipient
All
Recipient Enable Tech
Recipient Market
Led Recipient Business
Recipient Academic
Non Recipient
All
Cost 35 42 23 34 39 n/a
Collaboration 59 51 73 57 65 n/a
Knowledge 22 26 17 21 28 n/a
Skills 21 19 23 18 30 n/a
Market 1 2 1 1 5 n/a
Other 9 11 5 9 8 n/a
None 7 8 5 8 3 n/a
Number of respondents (ESS) 270 163 110 208 63 n/a
Respondents could select several options; so percentages in any column may sum to more than 100. Source: PACEC CR&D survey (q38A) – see section 1.4 for explanation of ESS, Bolding and Shading
Table 9.3 Critical factors to the success of the project (detail)
Percentage of all respondents (by Competition and Sector)
Recipient
All
Recipient Enable Tech
Recipient Market
Led Recipient Business
Recipient Academic
Non Recipient
All
Cost of finance 1 1 2 2 0 n/a
Cost of R&D / innovation 19 21 14 18 20 n/a
Access to finance 16 19 10 14 21 n/a
Reduction in economic risk 4 5 1 4 1 n/a
Collaboration with businesses 52 47 62 49 63 n/a
Collaboration with HEIs 34 30 40 36 26 n/a
Technical challenge 18 21 14 18 20 n/a
Leading edge research 11 13 8 8 22 n/a
Ability to arrange IPR 3 3 3 3 4 n/a
Commercialisation skills 4 4 3 4 4 n/a
Technical / R&D skills 18 17 21 15 28 n/a
Equipment, research infrastructure 4 4 3 4 4 n/a
Meeting UK/EU regulation 1 0 1 0 2 n/a
Other priorities of the Bus/HEI 0 1 0 0 2 n/a
Competitor products/services/processes 0 0 0 0 2 n/a
Low/uncertain demand for products/services 0 0 1 0 0 n/a
Other 9 11 5 9 8 n/a
None 7 8 5 8 3 n/a
Number of respondents (ESS) 270 163 110 208 63 n/a
Respondents could select several options; so percentages in any column may sum to more than 100. Source: PACEC CR&D survey (Q38A) – see section 1.4 for explanation of ESS, Bolding and Shading
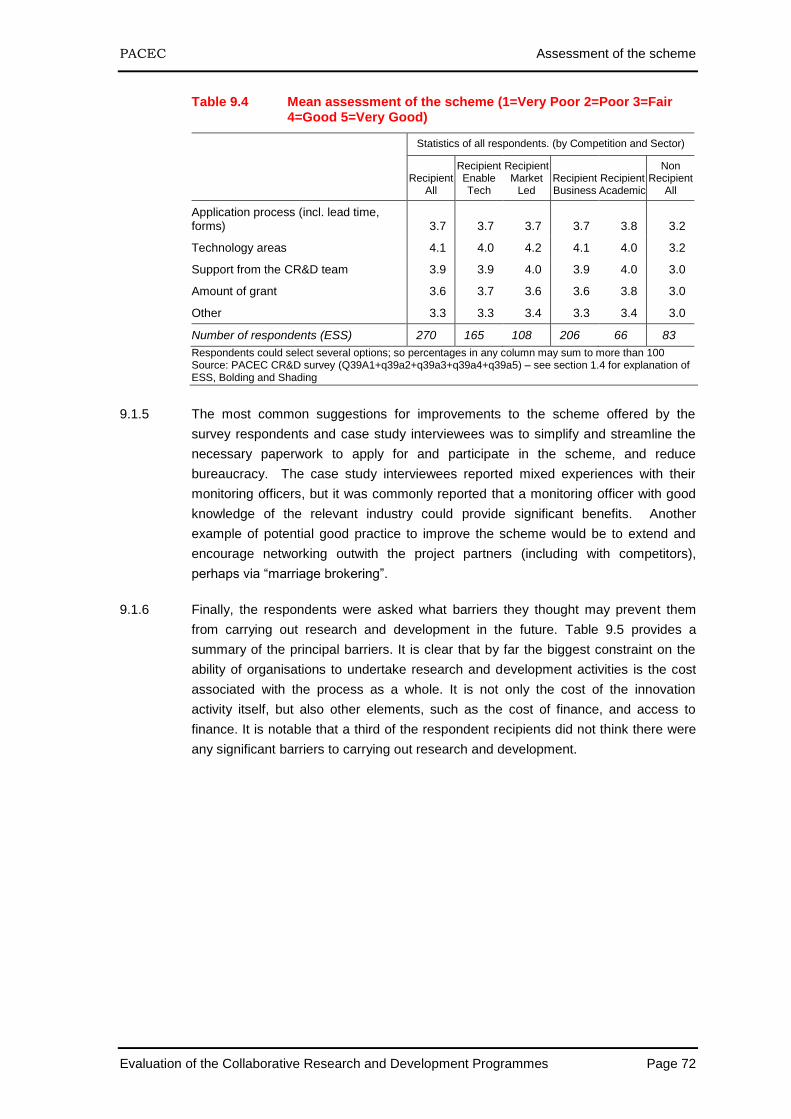
PACEC Assessment of the scheme
Evaluation of the Collaborative Research and Development Programmes Page 72
Table 9.4 Mean assessment of the scheme (1=Very Poor 2=Poor 3=Fair 4=Good 5=Very Good)
Statistics of all respondents. (by Competition and Sector)
Recipient
All
Recipient Enable Tech
Recipient Market
Led Recipient Business
Recipient Academic
Non Recipient
All
Application process (incl. lead time, forms) 3.7 3.7 3.7 3.7 3.8 3.2
Technology areas 4.1 4.0 4.2 4.1 4.0 3.2
Support from the CR&D team 3.9 3.9 4.0 3.9 4.0 3.0
Amount of grant 3.6 3.7 3.6 3.6 3.8 3.0
Other 3.3 3.3 3.4 3.3 3.4 3.0
Number of respondents (ESS) 270 165 108 206 66 83
Respondents could select several options; so percentages in any column may sum to more than 100 Source: PACEC CR&D survey (Q39A1+q39a2+q39a3+q39a4+q39a5) – see section 1.4 for explanation of ESS, Bolding and Shading
9.1.5 The most common suggestions for improvements to the scheme offered by the
survey respondents and case study interviewees was to simplify and streamline the
necessary paperwork to apply for and participate in the scheme, and reduce
bureaucracy. The case study interviewees reported mixed experiences with their
monitoring officers, but it was commonly reported that a monitoring officer with good
knowledge of the relevant industry could provide significant benefits. Another
example of potential good practice to improve the scheme would be to extend and
encourage networking outwith the project partners (including with competitors),
perhaps via “marriage brokering”.
9.1.6 Finally, the respondents were asked what barriers they thought may prevent them
from carrying out research and development in the future. Table 9.5 provides a
summary of the principal barriers. It is clear that by far the biggest constraint on the
ability of organisations to undertake research and development activities is the cost
associated with the process as a whole. It is not only the cost of the innovation
activity itself, but also other elements, such as the cost of finance, and access to
finance. It is notable that a third of the respondent recipients did not think there were
any significant barriers to carrying out research and development.
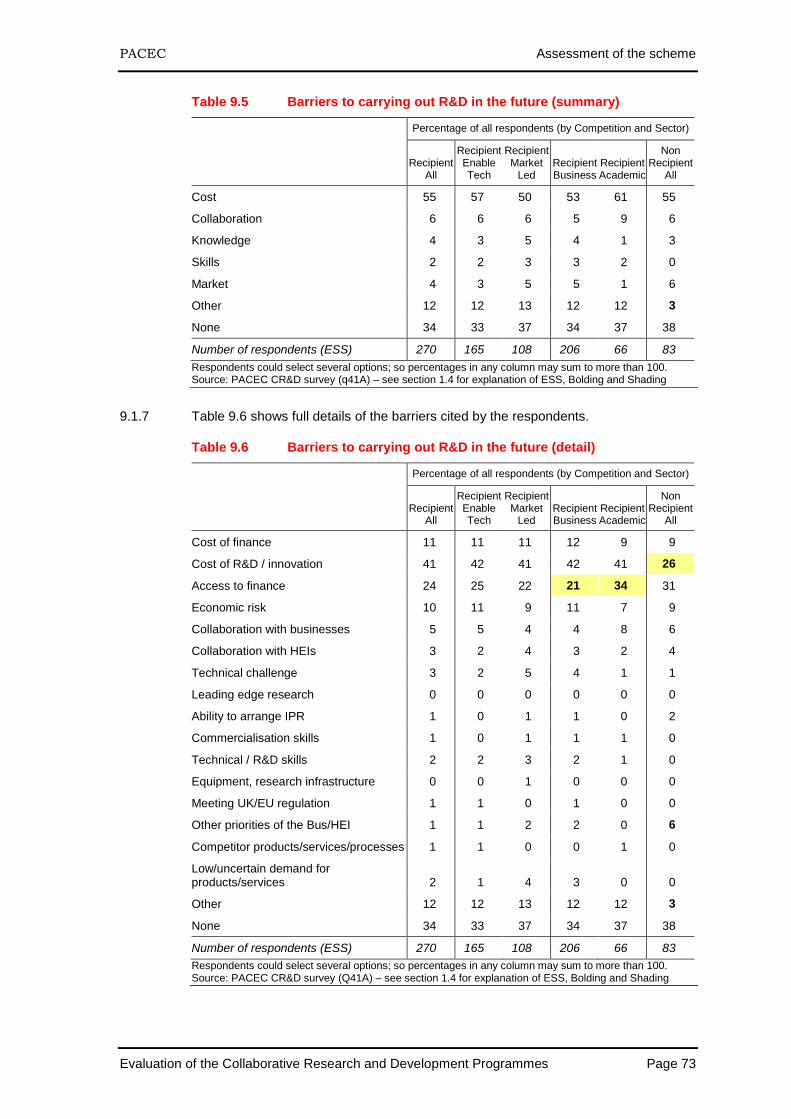
PACEC Assessment of the scheme
Evaluation of the Collaborative Research and Development Programmes Page 73
Table 9.5 Barriers to carrying out R&D in the future (summary)
Percentage of all respondents (by Competition and Sector)
Recipient
All
Recipient Enable Tech
Recipient Market
Led Recipient Business
Recipient Academic
Non Recipient
All
Cost 55 57 50 53 61 55
Collaboration 6 6 6 5 9 6
Knowledge 4 3 5 4 1 3
Skills 2 2 3 3 2 0
Market 4 3 5 5 1 6
Other 12 12 13 12 12 3
None 34 33 37 34 37 38
Number of respondents (ESS) 270 165 108 206 66 83
Respondents could select several options; so percentages in any column may sum to more than 100. Source: PACEC CR&D survey (q41A) – see section 1.4 for explanation of ESS, Bolding and Shading
9.1.7 Table 9.6 shows full details of the barriers cited by the respondents.
Table 9.6 Barriers to carrying out R&D in the future (detail)
Percentage of all respondents (by Competition and Sector)
Recipient
All
Recipient Enable Tech
Recipient Market
Led Recipient Business
Recipient Academic
Non Recipient
All
Cost of finance 11 11 11 12 9 9
Cost of R&D / innovation 41 42 41 42 41 26
Access to finance 24 25 22 21 34 31
Economic risk 10 11 9 11 7 9
Collaboration with businesses 5 5 4 4 8 6
Collaboration with HEIs 3 2 4 3 2 4
Technical challenge 3 2 5 4 1 1
Leading edge research 0 0 0 0 0 0
Ability to arrange IPR 1 0 1 1 0 2
Commercialisation skills 1 0 1 1 1 0
Technical / R&D skills 2 2 3 2 1 0
Equipment, research infrastructure 0 0 1 0 0 0
Meeting UK/EU regulation 1 1 0 1 0 0
Other priorities of the Bus/HEI 1 1 2 2 0 6
Competitor products/services/processes 1 1 0 0 1 0
Low/uncertain demand for products/services 2 1 4 3 0 0
Other 12 12 13 12 12 3
None 34 33 37 34 37 38
Number of respondents (ESS) 270 165 108 206 66 83
Respondents could select several options; so percentages in any column may sum to more than 100. Source: PACEC CR&D survey (Q41A) – see section 1.4 for explanation of ESS, Bolding and Shading
PACEC Assessment of the scheme
Evaluation of the Collaborative Research and Development Programmes Page 74
9.1.8 Reinforcing the above conclusion that cost is the main barrier to R&D, the survey and
case study interviewees commonly stated that the best thing that the Technology
Strategy Board could do to help overcome R&D barriers was to provide more funding.
Specific suggestions by the project partners included improved cohesion in the
process of funding projects between the prototype and production phases, and
increased speed of funding, particularly for the smallest companies, which are most
sensitive to cashflow, especially in the current financial and funding climate and
uncertainty.
9.1.9 The strategic partners made some similar points to the project partners in the context
of their support for CR&D and the role that it played in assisting them to meet their
objectives. It was considered that there could be more consultation on policy
changes made for CR&D at the planning and strategy development stage, and the
launch of competitions and challenges. At the application stage, suggestions were
made to give more notice in advance of challenges, the inclusion of more academics
as assessors on applications, the provision of application outcome decisions in
advance and prior to agreeing the details (e.g. IP arrangements) and the streamlining
of the process. The monitoring of projects could also be more consistent, reflecting
guidelines.
PACEC Key Findings
Evaluation of the Collaborative Research and Development Programmes Page 75
10 Key Findings
Key Findings for the Research
This chapter sets out the main summary points from the chapters above. The
findings in terms of the evaluation aims are shown in the Executive Summary.
Panel 10.1 Characterisation of Projects
● There were a total of 396 CR&D projects, awarded between 2004 and early 2009, on which the evaluation focused. The value of grants was £195m.
● There was a total of 253 enabling technology projects that received a total £134 million in grants, mainly in Advanced Materials and Micro and Nanotechnologies (77 projects), and electronics, photonics and electrical systems (70 projects).
● There were 143 market application projects that received a total of £61 million in grants, mainly energy generation and supply projects (52) and environmental sustainability projects (45).
● Projects most commonly involved three total partners (23% of cases), but were roughly equally likely to involve four partners (20%), five or six partners (19%), seven or more partners (19%), or just two partners (18%). Larger grants generally went to projects with more partners.
● All projects had business partners. More than two-thirds of the projects (69%) were projects that involved one or more academic partners. Projects involving academic partners tended, on the whole, to receive larger grants.
● The majority of the projects have been operating for at least two years. Two out of five (44%) have been established for three years or more.
● More than 60% of the £195 million went to projects that were three years or older.
● Grants received made significant contributions to the total project costs. Almost two-thirds of the projects (67% or 264 projects) had half or more of their total costs reflecting the CR&D management information covered by the CR&D grant.
PACEC Key Findings
Evaluation of the Collaborative Research and Development Programmes Page 76
Panel 10.2 Project Participants
Project details
● Completed interviews were held with 336 partners participating in 167 projects.
● Almost three-quarters of the partners (73%) indicated that the lead partner was the main initiator of the project.
● By far the largest input to projects as an activity was applied research undertaken by the partners (59%). The other input of note was product development (16%).
● The overwhelming majority of partners described the level of collaboration between the partners as either significant (45%) or high (36%).
Company background
● Around half of the partners in projects (51%), as the largest group, were independent businesses at the time the project started and this did not change in broad terms during their participation in CR&D.
● The majority (65%) of the partners at the start of the project were SMEs. Of these, around a fifth (19%) were micro businesses with fewer than ten employees.
● Very few of the participating organisations (four per cent) indicated that they did not have any employees engaged in research and development (R&D).
● More than half of the businesses (55%) started trading before 2000.
● Just over two-fifths of partners (42%) were involved in production activities, followed by R&D (30%), services (18%) and education (11%).
● One in five business partners were either a spin-off from an existing business (nine per cent) or a spin out from a university or college (four per cent), or the result of a merger or acquisition of an existing business (four per cent), or a management buy-out (three per cent).
● The overwhelming majority of the partners were located in England. Only a handful were in each of the other three regions / devolved administrations.
● The majority of the partners operated in their local area, with just under two-thirds (65%) indicating they only had sites in their region.
● It is also notable that just over one in five (21%) had global operations.
● At the start of the project, the majority of the recipients (68%) were looking to grow moderately. Just under one in five (17%) were more ambitious, and looking to grow significantly. The relative positions of the partners had altered only slightly at the time of the survey, with lower growth expectations – which probably reflects the current economic context and uncertainty.
● Three-fifths of partners (60%) indicated the project was either critical (16%) or very important (44%) to their R&D/innovation activities, whereas fewer than half of the partners (46%) indicated that the project was either critical (10%) or very important (36%) to their organisation’s growth.
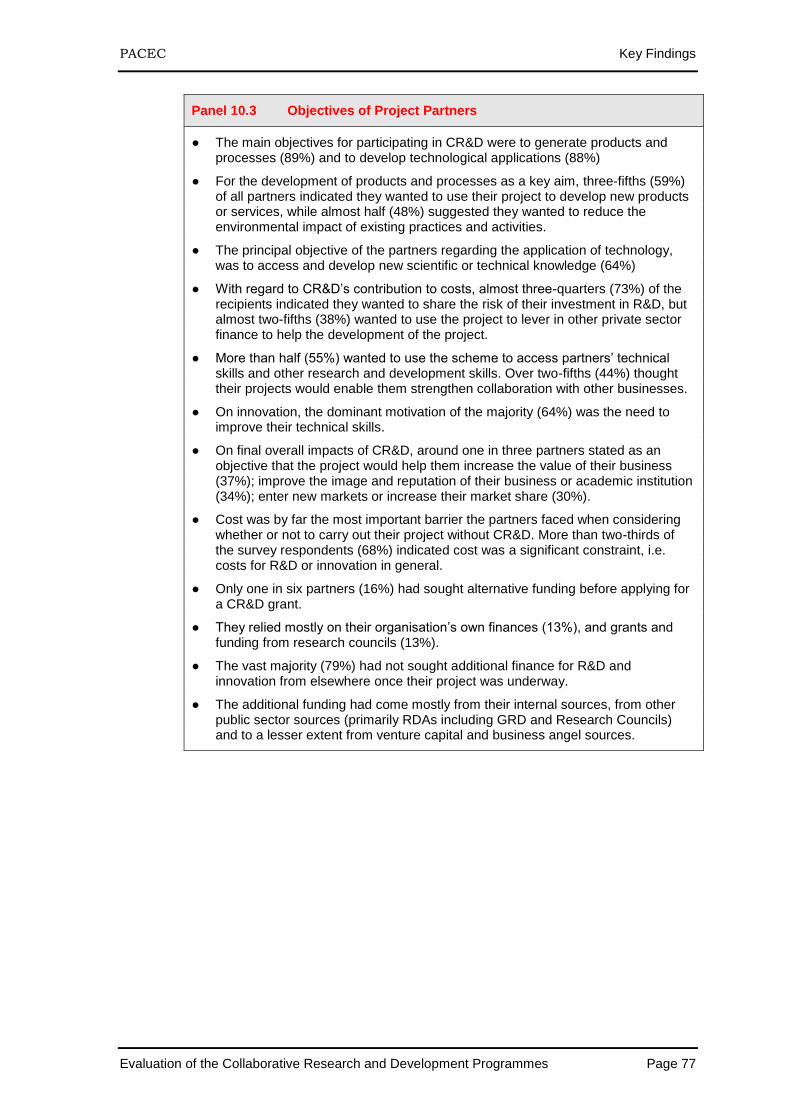
PACEC Key Findings
Evaluation of the Collaborative Research and Development Programmes Page 77
Panel 10.3 Objectives of Project Partners
● The main objectives for participating in CR&D were to generate products and processes (89%) and to develop technological applications (88%)
● For the development of products and processes as a key aim, three-fifths (59%) of all partners indicated they wanted to use their project to develop new products or services, while almost half (48%) suggested they wanted to reduce the environmental impact of existing practices and activities.
● The principal objective of the partners regarding the application of technology, was to access and develop new scientific or technical knowledge (64%)
● With regard to CR&D’s contribution to costs, almost three-quarters (73%) of the recipients indicated they wanted to share the risk of their investment in R&D, but almost two-fifths (38%) wanted to use the project to lever in other private sector finance to help the development of the project.
● More than half (55%) wanted to use the scheme to access partners’ technical skills and other research and development skills. Over two-fifths (44%) thought their projects would enable them strengthen collaboration with other businesses.
● On innovation, the dominant motivation of the majority (64%) was the need to improve their technical skills.
● On final overall impacts of CR&D, around one in three partners stated as an objective that the project would help them increase the value of their business (37%); improve the image and reputation of their business or academic institution (34%); enter new markets or increase their market share (30%).
● Cost was by far the most important barrier the partners faced when considering whether or not to carry out their project without CR&D. More than two-thirds of the survey respondents (68%) indicated cost was a significant constraint, i.e. costs for R&D or innovation in general.
● Only one in six partners (16%) had sought alternative funding before applying for a CR&D grant.
● They relied mostly on their organisation’s own finances (13%), and grants and funding from research councils (13%).
● The vast majority (79%) had not sought additional finance for R&D and innovation from elsewhere once their project was underway.
● The additional funding had come mostly from their internal sources, from other public sector sources (primarily RDAs including GRD and Research Councils) and to a lesser extent from venture capital and business angel sources.
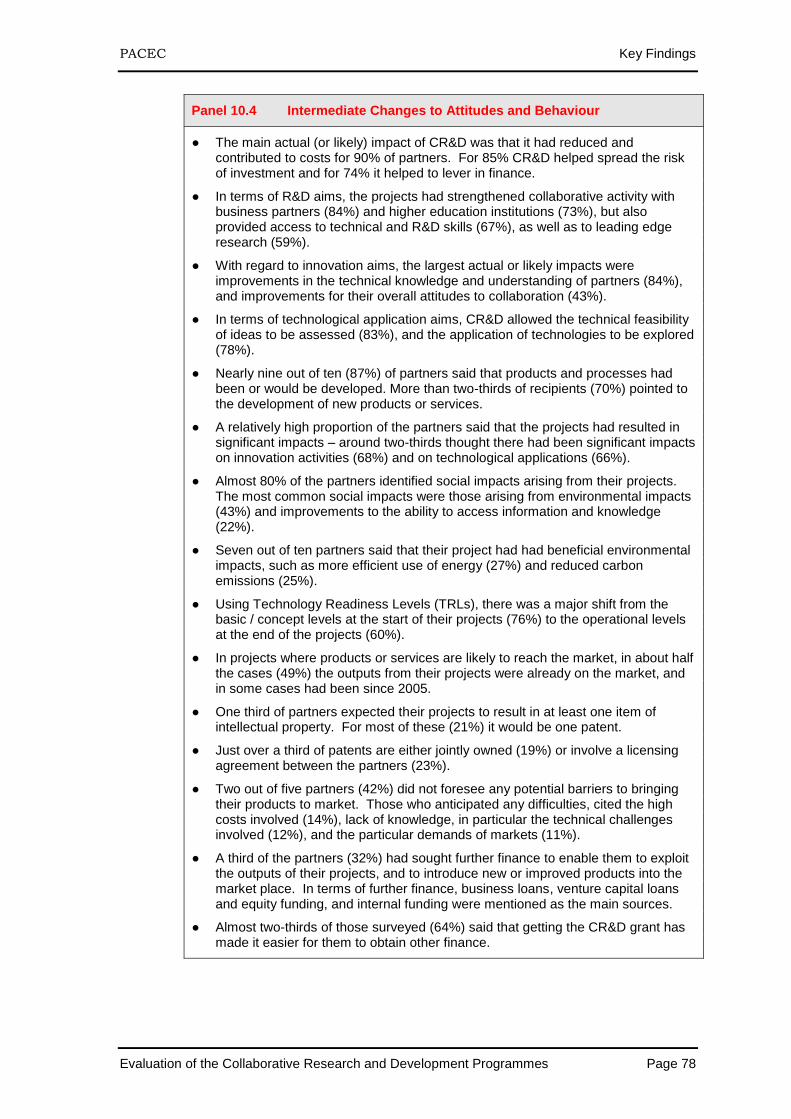
PACEC Key Findings
Evaluation of the Collaborative Research and Development Programmes Page 78
Panel 10.4 Intermediate Changes to Attitudes and Behaviour
● The main actual (or likely) impact of CR&D was that it had reduced and contributed to costs for 90% of partners. For 85% CR&D helped spread the risk of investment and for 74% it helped to lever in finance.
● In terms of R&D aims, the projects had strengthened collaborative activity with business partners (84%) and higher education institutions (73%), but also provided access to technical and R&D skills (67%), as well as to leading edge research (59%).
● With regard to innovation aims, the largest actual or likely impacts were improvements in the technical knowledge and understanding of partners (84%), and improvements for their overall attitudes to collaboration (43%).
● In terms of technological application aims, CR&D allowed the technical feasibility of ideas to be assessed (83%), and the application of technologies to be explored (78%).
● Nearly nine out of ten (87%) of partners said that products and processes had been or would be developed. More than two-thirds of recipients (70%) pointed to the development of new products or services.
● A relatively high proportion of the partners said that the projects had resulted in significant impacts – around two-thirds thought there had been significant impacts on innovation activities (68%) and on technological applications (66%).
● Almost 80% of the partners identified social impacts arising from their projects. The most common social impacts were those arising from environmental impacts (43%) and improvements to the ability to access information and knowledge (22%).
● Seven out of ten partners said that their project had had beneficial environmental impacts, such as more efficient use of energy (27%) and reduced carbon emissions (25%).
● Using Technology Readiness Levels (TRLs), there was a major shift from the basic / concept levels at the start of their projects (76%) to the operational levels at the end of the projects (60%).
● In projects where products or services are likely to reach the market, in about half the cases (49%) the outputs from their projects were already on the market, and in some cases had been since 2005.
● One third of partners expected their projects to result in at least one item of intellectual property. For most of these (21%) it would be one patent.
● Just over a third of patents are either jointly owned (19%) or involve a licensing agreement between the partners (23%).
● Two out of five partners (42%) did not foresee any potential barriers to bringing their products to market. Those who anticipated any difficulties, cited the high costs involved (14%), lack of knowledge, in particular the technical challenges involved (12%), and the particular demands of markets (11%).
● A third of the partners (32%) had sought further finance to enable them to exploit the outputs of their projects, and to introduce new or improved products into the market place. In terms of further finance, business loans, venture capital loans and equity funding, and internal funding were mentioned as the main sources.
● Almost two-thirds of those surveyed (64%) said that getting the CR&D grant has made it easier for them to obtain other finance.
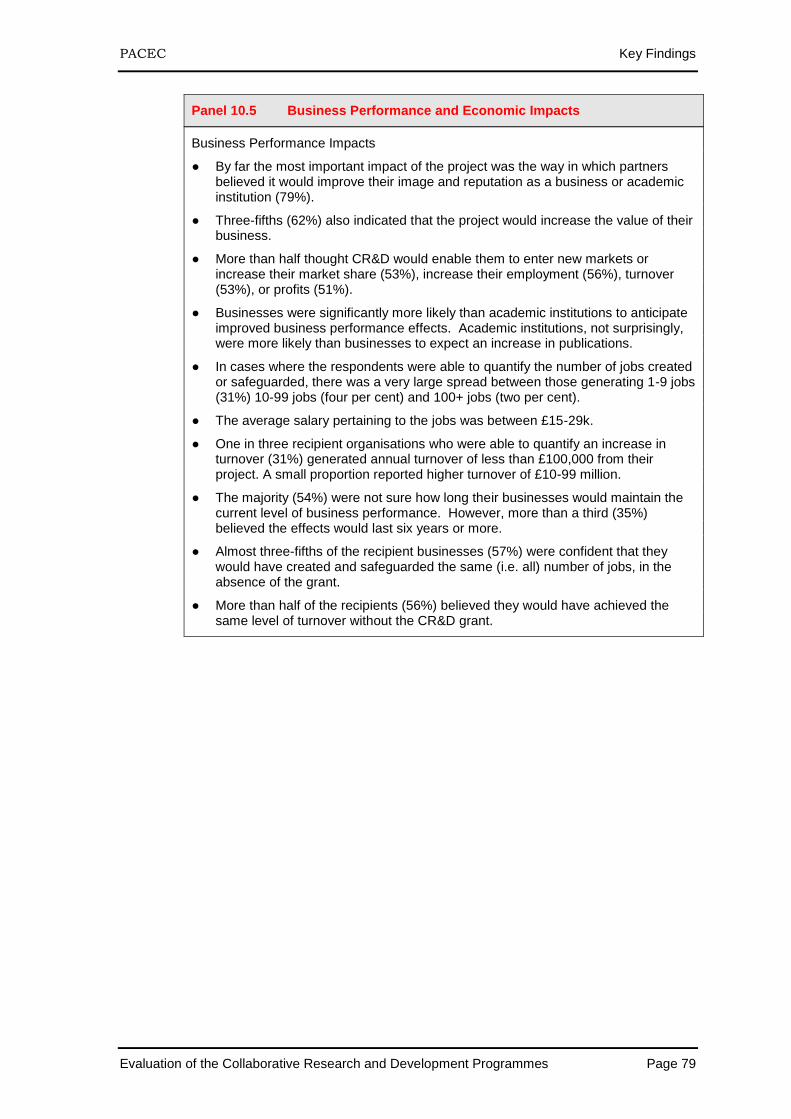
PACEC Key Findings
Evaluation of the Collaborative Research and Development Programmes Page 79
Panel 10.5 Business Performance and Economic Impacts
Business Performance Impacts
● By far the most important impact of the project was the way in which partners believed it would improve their image and reputation as a business or academic institution (79%).
● Three-fifths (62%) also indicated that the project would increase the value of their business.
● More than half thought CR&D would enable them to enter new markets or increase their market share (53%), increase their employment (56%), turnover (53%), or profits (51%).
● Businesses were significantly more likely than academic institutions to anticipate improved business performance effects. Academic institutions, not surprisingly, were more likely than businesses to expect an increase in publications.
● In cases where the respondents were able to quantify the number of jobs created or safeguarded, there was a very large spread between those generating 1-9 jobs (31%) 10-99 jobs (four per cent) and 100+ jobs (two per cent).
● The average salary pertaining to the jobs was between £15-29k.
● One in three recipient organisations who were able to quantify an increase in turnover (31%) generated annual turnover of less than £100,000 from their project. A small proportion reported higher turnover of £10-99 million.
● The majority (54%) were not sure how long their businesses would maintain the current level of business performance. However, more than a third (35%) believed the effects would last six years or more.
● Almost three-fifths of the recipient businesses (57%) were confident that they would have created and safeguarded the same (i.e. all) number of jobs, in the absence of the grant.
● More than half of the recipients (56%) believed they would have achieved the same level of turnover without the CR&D grant.
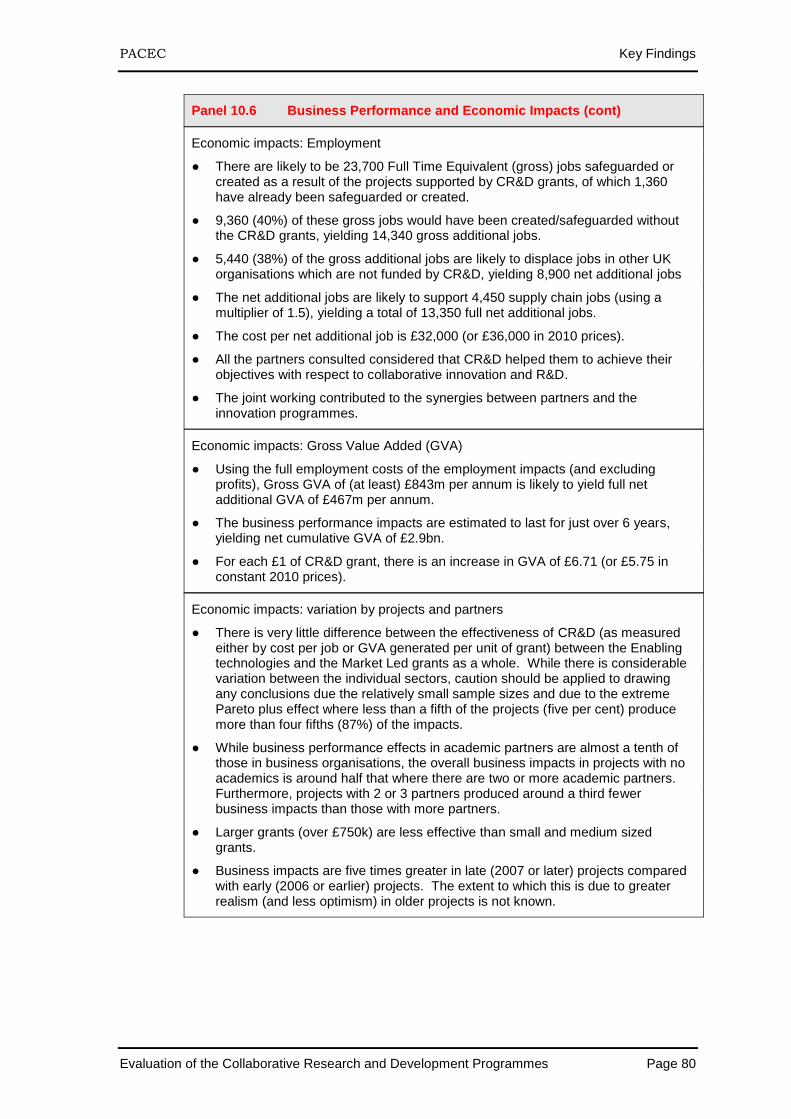
PACEC Key Findings
Evaluation of the Collaborative Research and Development Programmes Page 80
Panel 10.6 Business Performance and Economic Impacts (cont)
Economic impacts: Employment
● There are likely to be 23,700 Full Time Equivalent (gross) jobs safeguarded or created as a result of the projects supported by CR&D grants, of which 1,360 have already been safeguarded or created.
● 9,360 (40%) of these gross jobs would have been created/safeguarded without the CR&D grants, yielding 14,340 gross additional jobs.
● 5,440 (38%) of the gross additional jobs are likely to displace jobs in other UK organisations which are not funded by CR&D, yielding 8,900 net additional jobs
● The net additional jobs are likely to support 4,450 supply chain jobs (using a multiplier of 1.5), yielding a total of 13,350 full net additional jobs.
● The cost per net additional job is £32,000 (or £36,000 in 2010 prices).
● All the partners consulted considered that CR&D helped them to achieve their objectives with respect to collaborative innovation and R&D.
● The joint working contributed to the synergies between partners and the innovation programmes.
Economic impacts: Gross Value Added (GVA)
● Using the full employment costs of the employment impacts (and excluding profits), Gross GVA of (at least) £843m per annum is likely to yield full net additional GVA of £467m per annum.
● The business performance impacts are estimated to last for just over 6 years, yielding net cumulative GVA of £2.9bn.
● For each £1 of CR&D grant, there is an increase in GVA of £6.71 (or £5.75 in constant 2010 prices).
Economic impacts: variation by projects and partners
● There is very little difference between the effectiveness of CR&D (as measured either by cost per job or GVA generated per unit of grant) between the Enabling technologies and the Market Led grants as a whole. While there is considerable variation between the individual sectors, caution should be applied to drawing any conclusions due the relatively small sample sizes and due to the extreme Pareto plus effect where less than a fifth of the projects (five per cent) produce more than four fifths (87%) of the impacts.
● While business performance effects in academic partners are almost a tenth of those in business organisations, the overall business impacts in projects with no academics is around half that where there are two or more academic partners. Furthermore, projects with 2 or 3 partners produced around a third fewer business impacts than those with more partners.
● Larger grants (over £750k) are less effective than small and medium sized grants.
● Business impacts are five times greater in late (2007 or later) projects compared with early (2006 or earlier) projects. The extent to which this is due to greater realism (and less optimism) in older projects is not known.
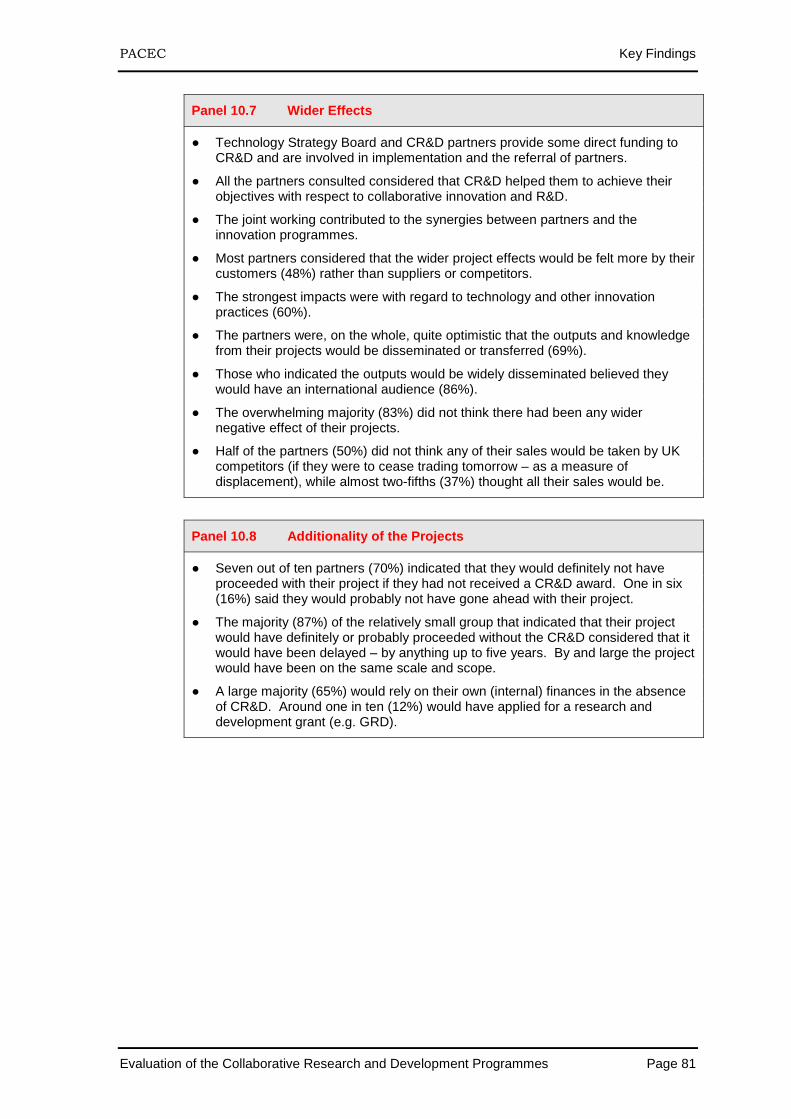
PACEC Key Findings
Evaluation of the Collaborative Research and Development Programmes Page 81
Panel 10.7 Wider Effects
● Technology Strategy Board and CR&D partners provide some direct funding to CR&D and are involved in implementation and the referral of partners.
● All the partners consulted considered that CR&D helped them to achieve their objectives with respect to collaborative innovation and R&D.
● The joint working contributed to the synergies between partners and the innovation programmes.
● Most partners considered that the wider project effects would be felt more by their customers (48%) rather than suppliers or competitors.
● The strongest impacts were with regard to technology and other innovation practices (60%).
● The partners were, on the whole, quite optimistic that the outputs and knowledge from their projects would be disseminated or transferred (69%).
● Those who indicated the outputs would be widely disseminated believed they would have an international audience (86%).
● The overwhelming majority (83%) did not think there had been any wider negative effect of their projects.
● Half of the partners (50%) did not think any of their sales would be taken by UK competitors (if they were to cease trading tomorrow – as a measure of displacement), while almost two-fifths (37%) thought all their sales would be.
Panel 10.8 Additionality of the Projects
● Seven out of ten partners (70%) indicated that they would definitely not have proceeded with their project if they had not received a CR&D award. One in six (16%) said they would probably not have gone ahead with their project.
● The majority (87%) of the relatively small group that indicated that their project would have definitely or probably proceeded without the CR&D considered that it would have been delayed – by anything up to five years. By and large the project would have been on the same scale and scope.
● A large majority (65%) would rely on their own (internal) finances in the absence of CR&D. Around one in ten (12%) would have applied for a research and development grant (e.g. GRD).
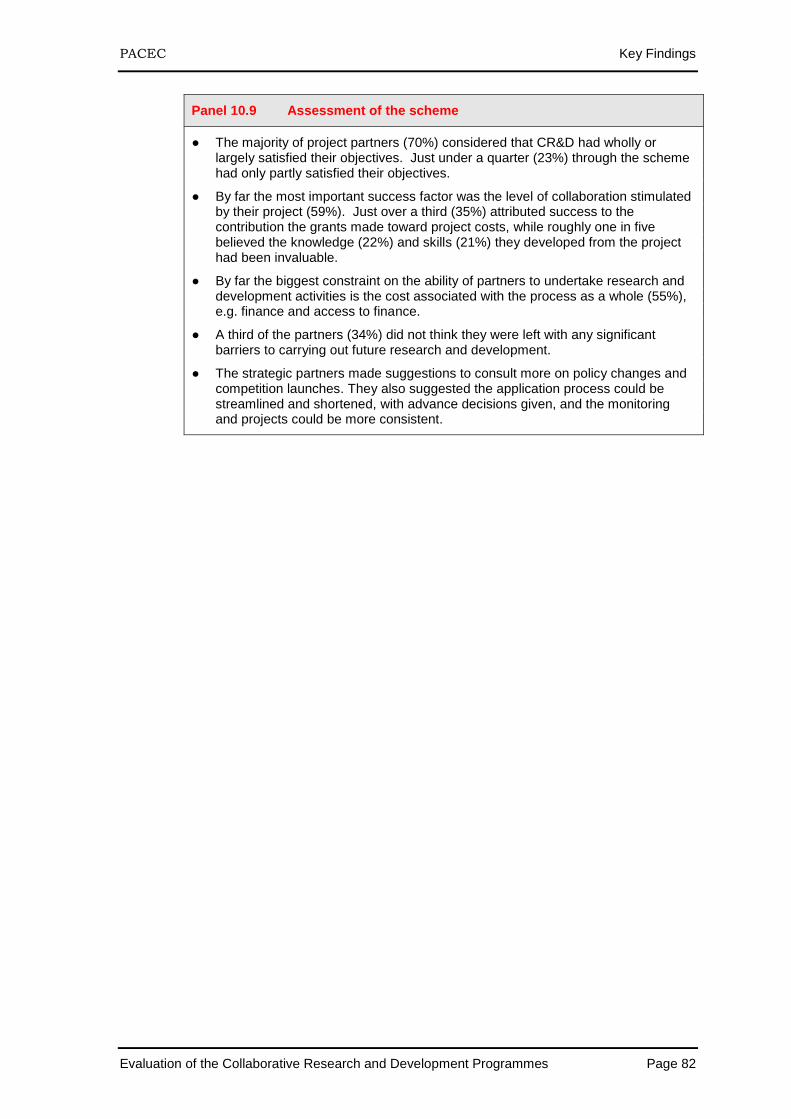
PACEC Key Findings
Evaluation of the Collaborative Research and Development Programmes Page 82
Panel 10.9 Assessment of the scheme
● The majority of project partners (70%) considered that CR&D had wholly or largely satisfied their objectives. Just under a quarter (23%) through the scheme had only partly satisfied their objectives.
● By far the most important success factor was the level of collaboration stimulated by their project (59%). Just over a third (35%) attributed success to the contribution the grants made toward project costs, while roughly one in five believed the knowledge (22%) and skills (21%) they developed from the project had been invaluable.
● By far the biggest constraint on the ability of partners to undertake research and development activities is the cost associated with the process as a whole (55%), e.g. finance and access to finance.
● A third of the partners (34%) did not think they were left with any significant barriers to carrying out future research and development.
● The strategic partners made suggestions to consult more on policy changes and competition launches. They also suggested the application process could be streamlined and shortened, with advance decisions given, and the monitoring and projects could be more consistent.