Embed Size (px)
Citation preview

Ref: 5645R/46059003-784/SV
FINAL REPORT (2003) For: ENVIRONMENTAL PROTECTION EXPENDITURE BY INDUSTRY: 2003 UK SURVEY Submitted to: Department for Environment, Food and Rural Affairs June 2005
St George's House, 2nd Floor 5 St George's Road Wimbledon London SW19 4DR Tel: 020 8944 3300 Fax: 020 8944 3301 Email: [email protected]
5645R/46059-003-784/SV Final Report June 2005
The views and recommendations expressed in this report are those of the authors and do
not necessarily represent the views of the Department for Environment, Food and Rural
Affairs, its ministers or officials.

i 5645R/46059-003-784/SV Final Report June 2005
EXECUTIVE SUMMARY
Introduction
This report presents the findings of a study commissioned by the Department for Environment, Food
and Rural Affairs (Defra) and undertaken by URS Corporation Limited (URS), to estimate expenditure
by UK industry on environmental protection in 2003.
The primary objectives of the study are:
• To provide Defra with annual estimates of environmental protection expenditure by UK industry;
and
• To enable Defra to provide these estimates to the European Commission as required under the
EU Structural Business Statistics Regulation 58/97.
In addition to these broad objectives, annual data from the survey may be used to assess how
expenditure is changing and to compare the competitiveness of UK industries relative to other EU
countries. The data also enables companies and trade associations to benchmark their own
environmental performance against that of the industry as a whole, both in the UK and the EU.
This is the seventh survey of this type; previous surveys were carried out in 1994 (a pilot survey),
1997, 1999, 2000, 2001 and 2002. The 2003 survey was conducted in 3 phases between April 2004
and July 2005, steered by a group with representatives from Defra, Department for Trade and
Industry (DTI), Environment Agency, Scottish Environmental Protection Agency (SEPA) and the Office
for National Statistics (ONS).
Methodology
The industry sectors follow the Standard Industrial Classification (SIC) codes and are covered by the
survey as follows:
SIC code Industry 10 – 14 Mining and quarrying15 & 16 Food, beverages and tobacco products 17 – 19 Textiles, clothing and leather products 20 Wood and wood products 21 & 22 Pulp and paper, printing and publishing 23 Coke, petroleum and nuclear fuel 24 Chemicals and chemical products 25 Rubber and plastics 26 Other non-metallic minerals 27 & 28 Basic metals and metal products 29 – 31 Machinery and equipment 32 & 33 Electrical, medical and optical equipment 34 & 35 Transport equipment 36 Furniture manufacture 40 & 41 Energy production and water

ii 5645R/46059-003-784/SV Final Report June 2005
The Government’s Inter Departmental Business Register (IDBR) provided a stratified random sample
of 8,142 companies from the above industry sectors and these were invited on a voluntary basis to
complete and return a postal questionnaire. The total number of validated responses was 1,591,
giving a valid response rate of 19.5 per cent, which is approximately the same as in previous surveys.
The responses were subjected to a range of detailed validation checks.
The survey analysed the following expenditure patterns in UK industry: • Operating expenditure (OPEX), which includes the in-house operating costs of a company’s own
environmental protection activities, and also payments to others for environmental protection
services including waste disposal; and
• Capital expenditure (CAPEX), which consists of ‘end of pipe’ investments (expenditure on
equipment to clean up at the end of the production process) and integrated investment
expenditure (expenditure on equipment which reduces or eliminates emissions and discharges as
part of the production process).
Also identified were the following:
• Income and savings resulting from environmental protection activities carried out in 2003;
• The environmental media (areas) affected by the spending, namely waste water, air, solid waste,
soil/groundwater, noise/vibrations and nature protection; and
• The use of Environmental Reporting Systems.
Main results for 2003
• Gross spending on environmental protection in 2003 by UK industry amounted to an estimated
£3.4 billion;
• The primary spending sectors were food, beverages and tobacco products (12 per cent of total
spend), power industries (14 per cent of total spend) and chemicals and chemical products (18
per cent of total spend);
• Operating expenditure accounted for 85 per cent of the total environmental protection
expenditure, with capital expenditure making up the remainder;
• 40 per cent of the total expenditure was spent on solid waste, with a further 27 per cent spent
on wastewater, and the remaining 33 per cent spent on air, soil/groundwater, noise and nature
protection and other areas;
• This spending was offset by an estimated income of £178 million from the sale of by-products
and estimated cost savings of £265 million from environmental protection measures undertaken
during the year;

iii 5645R/46059-003-784/SV Final Report June 2005
• 22 per cent of companies surveyed separately identify environmental protection expenditure in
their management accounting system. The use of environmental reporting systems is more
widespread amongst companies with over 250 employees; and
• 22 per cent of companies surveyed publicly report on their environmental expenditure in their
annual accounts (12%) or an environmental / sustainability report (10%).
Comparisons between years
Direct comparisons between survey years are not possible because the estimates are subject to wide
confidence intervals and because of improvements made over time to the questionnaire design and
estimation procedures. In the light of this, the following charts show differences in the percentage
shares of total spending reported in each year, rather than the absolute figures. It should be noted
that efforts are made each year to reduce confidence intervals as well as to keep the questionnaire
and methodology consistent.
A summary of total environmental protection expenditure by businesses for 2000, 2001, 2002 and
2003 is presented in Figure E1. Ranges indicating the 95 percent confidence intervals associated
with each value are provided in parenthesis where available. Gross spending on environmental
protection in 2003 by UK industry amounted to an estimated £3.4 billion, plus or minus £0.6 billion at
95 per cent confidence. The estimates of previous years were £4.2 billion in 2000, £3.9 billion in
2001, and £2.6 billion in 2002. Although a reduction in spending might have been expected as a
result of the general downturn in the manufacturing sector over the period, it now appears as if the
2002 figure is a bit of an anomaly. A summary of the proportion of total expenditure for 2000, 2001,
2002 and 2003 by the main industry groups is presented in Figure E2.
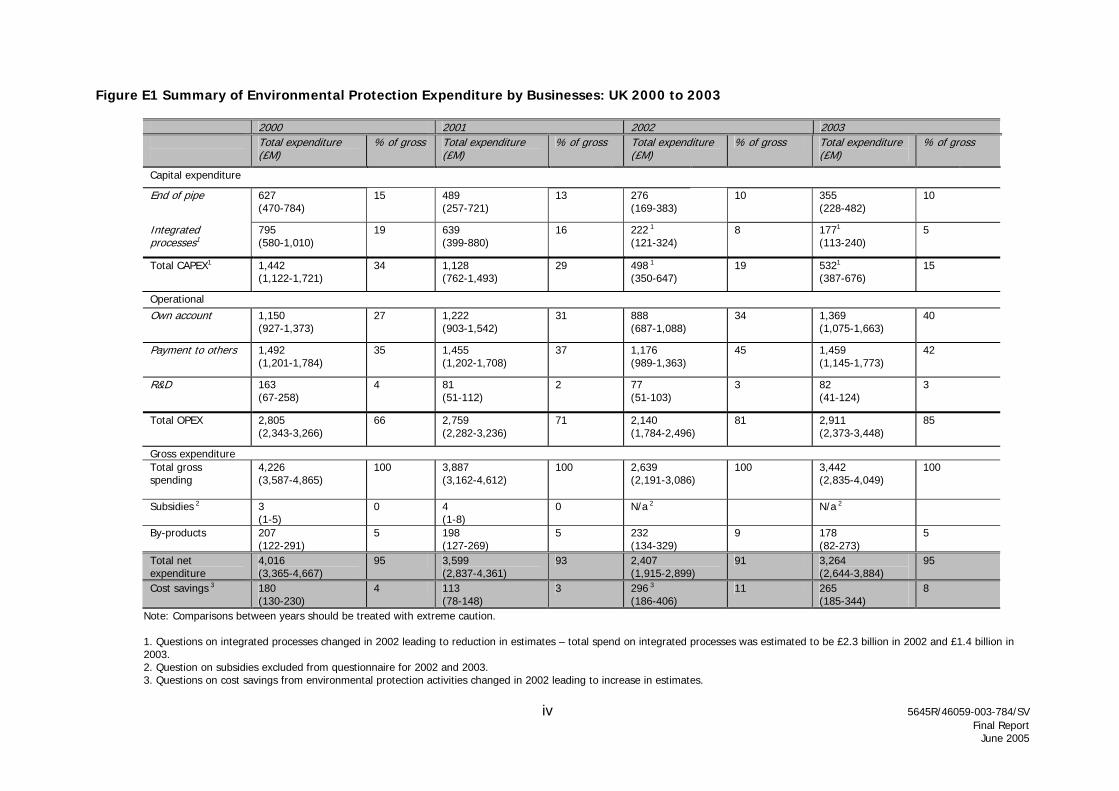
Figure E1 Summary of Environmental Protection Expenditure by Businesses: UK 2000 to 2003
2000 2001 2002 2003
Total expenditure (£M)
% of gross Total expenditure (£M)
% of gross Total expenditure (£M)
% of gross Total expenditure (£M)
% of gross
Capital expenditure
End of pipe
627 (470-784)
15 489(257-721)
13 276(169-383)
10 355(228-482)
10
Integrated processes1
795 (580-1,010)
19 639(399-880)
16 222 1
(121-324) 8 1771
(113-240) 5
Total CAPEX1
1,442 (1,122-1,721)
34 1,128(762-1,493)
29 498 1
(350-647) 19 5321
(387-676) 15
Operational Own account 1,150
(927-1,373) 27 1,222
(903-1,542) 31 888
(687-1,088) 34 1,369
(1,075-1,663) 40
Payment to others 1,492 (1,201-1,784)
35 1,455(1,202-1,708)
37 1,176(989-1,363)
45 1,459(1,145-1,773)
42
R&D 163 (67-258)
4 81(51-112)
2 77(51-103)
3 82(41-124)
3
Total OPEX
2,805 (2,343-3,266)
66 2,759(2,282-3,236)
71 2,140(1,784-2,496)
81 2,911(2,373-3,448)
85
Gross expenditure Total gross spending
4,226 (3,587-4,865)
100 3,887(3,162-4,612)
100 2,639(2,191-3,086)
100 3,442(2,835-4,049)
100
Subsidies 2 3 (1-5)
0 4(1-8)
0 N/a 2 N/a 2
By-products 207(122-291)
5 198(127-269)
5 232(134-329)
9 178(82-273)
5
Total net expenditure
4,016 (3,365-4,667)
95 3,599 (2,837-4,361)
93 2,407 (1,915-2,899)
91 3,264 (2,644-3,884)
95
Cost savings 3 180 (130-230)
4 113 (78-148)
3 296 3
(186-406) 11 265
(185-344) 8
Note: Comparisons between years should be treated with extreme caution. 1. Questions on integrated processes changed in 2002 leading to reduction in estimates – total spend on integrated processes was estimated to be £2.3 billion in 2002 and £1.4 billion in 2003. 2. Question on subsidies excluded from questionnaire for 2002 and 2003. 3. Questions on cost savings from environmental protection activities changed in 2002 leading to increase in estimates.
iv 5645R/46059-003-784/SV Final Report June 2005

Figure E2 - Proportion of Total Environmental Expenditure by Standard Industrial
Classification (SIC) sectors: UK 2000, 2001, 2002 and 2003.
02468
101214161820
Sector
Pro
port
ion
of T
ota
l Sp
end
(%)
2000
2001
2002
2003
In all four years the primary spending sectors were food, beverages and tobacco products (ranging
from 12 to 19 per cent of total spend), power industries (ranging between 11 and 17 per cent of total
spend) and chemicals and chemical products (ranging between 15 and 19 per cent of total spend).
The detailed analysis of these results is presented in Section 5 of the report.
Figures E3 and E4 show the proportion of expenditure across environmental media for operating
and capital expenditures respectively in 2003.
v 5645R/46059-003-784/SV Final Report June 2005
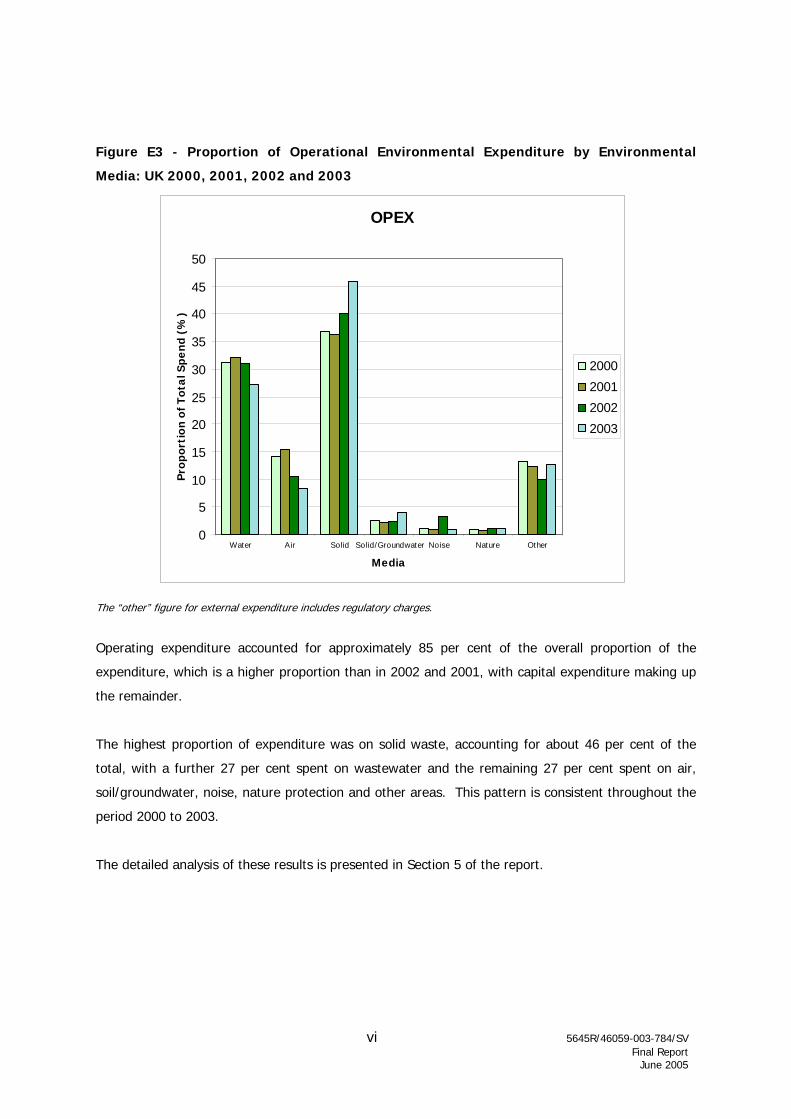
Figure E3 - Proportion of Operational Environmental Expenditure by Environmental
Media: UK 2000, 2001, 2002 and 2003
vi 5645R/46059-003-784/SV Final Report June 2005
OPEX
0
5
10
15
20
25
30
35
40
45
50
Water Air Solid Solid/Groundwater Noise Nature Other
Media
Prop
orti
on
of T
ota
l Sp
end
(%
)
2000
2001
2002
2003
The “other” figure for external expenditure includes regulatory charges.
Operating expenditure accounted for approximately 85 per cent of the overall proportion of the
expenditure, which is a higher proportion than in 2002 and 2001, with capital expenditure making up
the remainder.
The highest proportion of expenditure was on solid waste, accounting for about 46 per cent of the
total, with a further 27 per cent spent on wastewater and the remaining 27 per cent spent on air,
soil/groundwater, noise, nature protection and other areas. This pattern is consistent throughout the
period 2000 to 2003.
The detailed analysis of these results is presented in Section 5 of the report.
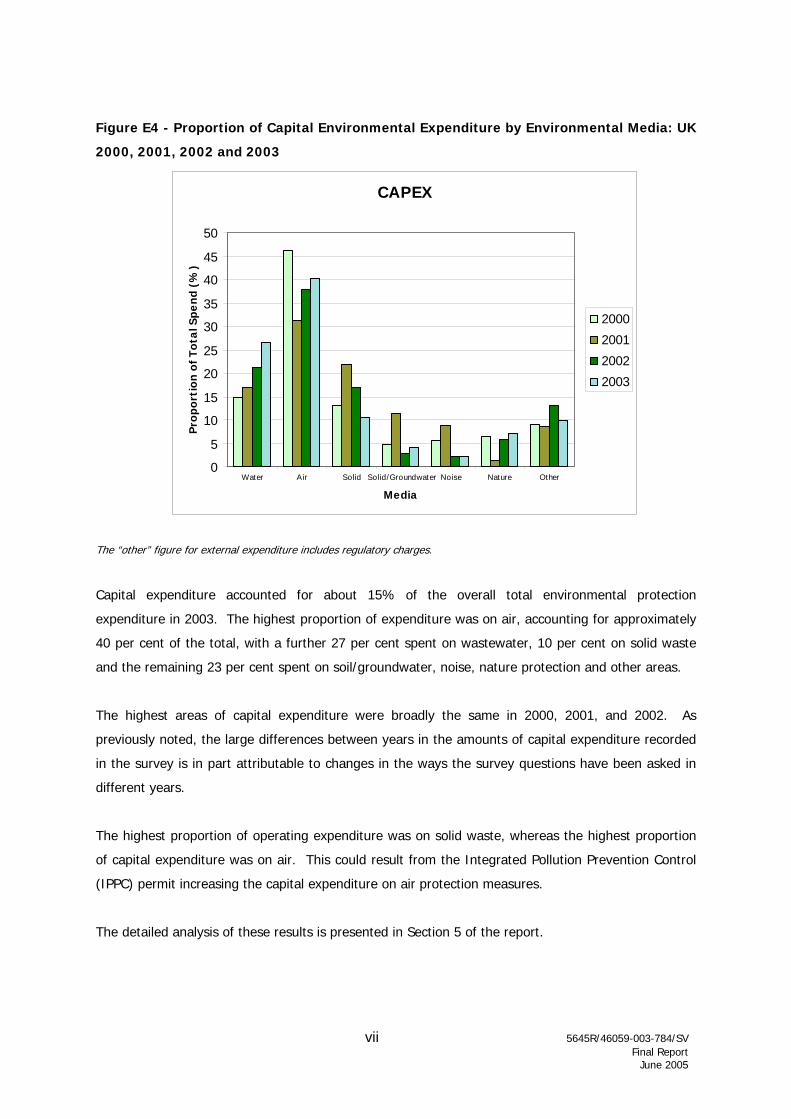
Figure E4 - Proportion of Capital Environmental Expenditure by Environmental Media: UK
2000, 2001, 2002 and 2003
vii 5645R/46059-003-784/SV Final Report June 2005
CAPEX
0
5
10
15
20
25
30
35
40
45
50
Water Air Solid Solid/Groundwater Noise Nature Other
Media
Pro
port
ion
of T
ota
l Spe
nd (
%)
2000
2001
2002
2003
The “other” figure for external expenditure includes regulatory charges.
Capital expenditure accounted for about 15% of the overall total environmental protection
expenditure in 2003. The highest proportion of expenditure was on air, accounting for approximately
40 per cent of the total, with a further 27 per cent spent on wastewater, 10 per cent on solid waste
and the remaining 23 per cent spent on soil/groundwater, noise, nature protection and other areas.
The highest areas of capital expenditure were broadly the same in 2000, 2001, and 2002. As
previously noted, the large differences between years in the amounts of capital expenditure recorded
in the survey is in part attributable to changes in the ways the survey questions have been asked in
different years.
The highest proportion of operating expenditure was on solid waste, whereas the highest proportion
of capital expenditure was on air. This could result from the Integrated Pollution Prevention Control
(IPPC) permit increasing the capital expenditure on air protection measures.
The detailed analysis of these results is presented in Section 5 of the report.

TABLE OF CONTENTS
5645R/46059-003-784/SV
viii Final Report June 2005
Page No
EXECUTIVE SUMMARY I
1 INTRODUCTION 1 1.1 OBJECTIVES 1 1.2 SCOPE AND BACKGROUND 2 1.3 DEFINITION OF ENVIRONMENTAL PROTECTION EXPENDITURE 3 1.4 REPORT STRUCTURE 4
2 SURVEY METHODOLOGY AND PREPARATION 5 2.1 MODIFICATIONS INTRODUCED IN THE 2003 SURVEY 6 2.2 SAMPLING METHODOLOGY 7 2.3 DATABASE DESIGN 7 2.4 SURVEY PROMOTION 8
3 CONDUCTING THE SURVEY 9 3.1 METHODOLOGY 9 3.2 TOP COMPANY FOCUS 11
3.2.1 Impact of the Top Company Focus 12 3.2.2 Lessons learnt from the Dedicated Top Company Follow-up 13
3.3 SME SIMPLIFIED APPROACH 14 3.4 HELPDESK SUPPORT 15
4 ANALYSIS OF RESPONSES 17 4.1 RESPONSES 17
4.1.1 Response Rates 17 4.1.2 Weighted Response Rates 20 4.1.3 Repeated Responses 20 4.1.4 Response Bias 22 4.1.5 2002 vs. 2003 Methodology 23
4.2 STANDARD ERRORS AND CONFIDENCE INTERVALS 23
5 SURVEY RESULTS AND ANALYSIS 25 5.1 TOTAL EXPENDITURE 25 5.2 EXPENDITURE BY ENVIRONMENTAL MEDIA 27 5.3 EXPENDITURE BY INDUSTRY SECTOR 31 5.4 COST SAVINGS AND INCOME 32 5.5 ENVIRONMENTAL PROTECTION EXPENDITURE BY INDIVIDUAL (SIC) SECTOR 35
5.5.1 SIC 10 to 14: Mining and Quarrying 36 5.5.2 SIC 15 & 16: Food Products and Beverages, and Tobacco Products 39 5.5.3 SIC 17, 18, and 19: Textiles, Clothing and Leather Products 41 5.5.4 SIC 20: Wood and Wood Products 43 5.5.5 SIC 21: Pulp and Paper 45 5.5.6 SIC 22: Publishing and Printing 47 5.5.7 SIC 23: Coke, Petroleum and Nuclear Fuel 49 5.5.8 SIC 24: Chemicals (Basic, Pharmaceuticals and Other) 51 5.5.9 SIC 251 and 252: Rubber and Plastics 54 5.5.10 SIC 26: Other Non-Metallic Minerals 56 5.5.11 SIC 27: Basic Metals 58
TABLE OF CONTENTS (Continued) Page No
5645R/46059-003-784/SV ix Final Report June 2005
5.5.12 SIC 28: Fabricated Metal Products 60 5.5.13 SIC 29, 30 and 31: Machinery and Equipment, Office Machinery and Apparatus and Electrical Machinery and Apparatus 63 5.5.14 SIC 32 & 33: Radio, TV and Comms, and Medical, Precision and Optical 66 5.5.15 SIC 34 & 35: Motor Vehicles and Other Transport Equipment 68 5.5.16 SIC 36: Furniture Manufacture 71 5.5.17 SIC 40: Electricity, Gas, Steam and Hot Water 73 5.5.18 SIC 41: Collection, Purification and Water Distribution 75
5.6 COMPARISON OF CURRENT EXPENDITURE WITH SUPPLY SIDE ESTIMATES77 5.7 ENVIRONMENTAL REPORTING SYSTEMS 80
5.7.1 Separate Identification of Environmental Expenditure in information systems 80 5.7.2 Findings 82
6 RECOMMENDATIONS FOR FUTURE SURVEYS 83 6.1 GENERAL 83 6.2 QUESTIONNAIRE DESIGN 85 6.3 VALIDATION PROCESS 86
LIST OF ABBREVIATIONS 87
LIST OF STANDARD INDUSTRIAL CLASSIFICATION (SIC) CODES 88
5645R/46059-003-784/SV Final Report June 2005
1
1 INTRODUCTION
This report presents the results for the seventh annual study commissioned by the Department for
Environment, Food and Rural Affairs (Defra) and undertaken by URS Corporation Limited (URS), to
estimate expenditure by UK industry on environmental protection in 2003. Previous surveys were
carried out in 1994 (a pilot survey), 1997, 1999, 2000, 2001, and 2002. The following sections of the
report summarise the findings from the analysis of the 2003 questionnaires completed by
participating UK companies.
The 2003 data is shown in contrast to the results from the 2000, 2001 and 2002 surveys. Direct
comparisons between survey years are not, however, possible because;
• The estimates are subject to wide confidence intervals; and
• Improvements have been made to the questionnaire design and estimation procedures.
In light of these discontinuities, comparisons are shown as percentage shares of the total spending
reported in each year, rather than the absolute figures. However, comparisons between years should
still be treated with caution.
1.1 OBJECTIVES
The primary objectives of the study were to:
• Provide Defra with annual estimates of environmental protection expenditure by UK industry; and
• Enable the UK Government to meet the requirements of the European Union (EU) Structural
Business Statistics Regulation 58/97, which provided a tool for regular data collection on the
variables and economic activities and is designed to give information on the service sector.
In addition to these broad objectives, annual data from the survey may be used to assess how
expenditure is changing and to compare the competitiveness of UK industries relative to other EU
countries. The data enables companies and trade associations to benchmark their own environmental
spending against that of the industry as a whole, both in the UK and the EU.
5645R/46059-003-784/SV Final Report June 2005
2
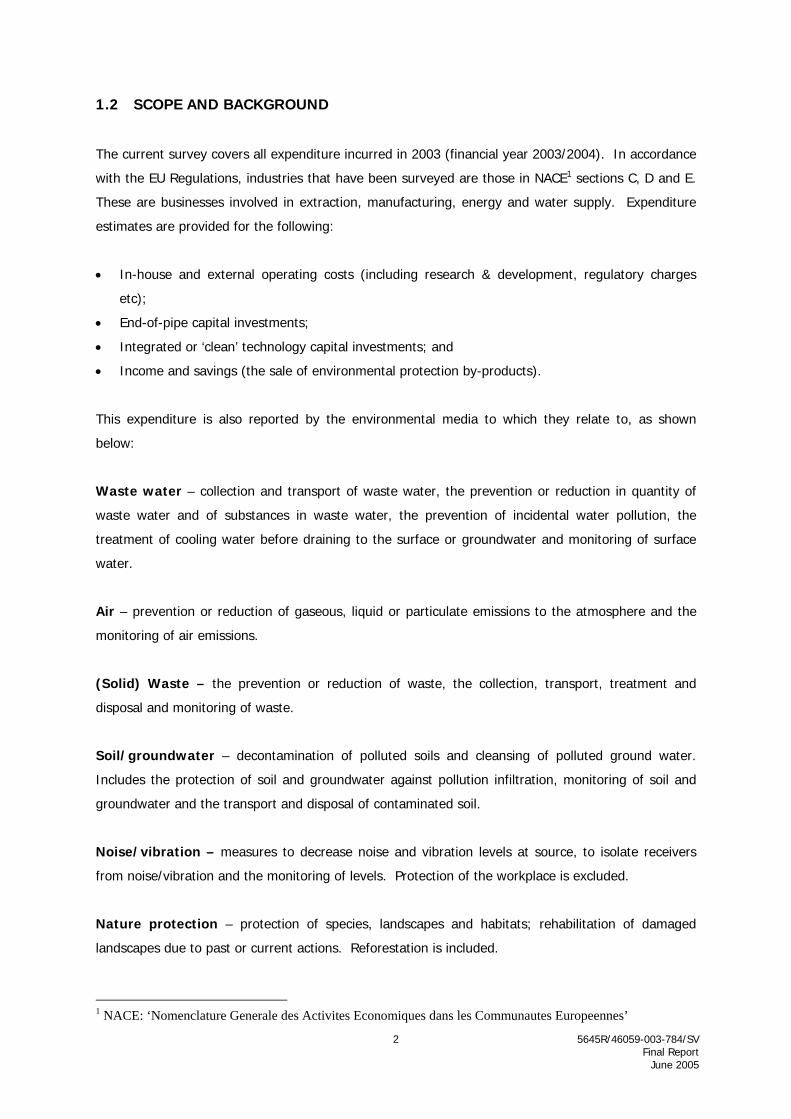
1.2 SCOPE AND BACKGROUND
The current survey covers all expenditure incurred in 2003 (financial year 2003/2004). In accordance
with the EU Regulations, industries that have been surveyed are those in NACE1 sections C, D and E.
These are businesses involved in extraction, manufacturing, energy and water supply. Expenditure
estimates are provided for the following:
• In-house and external operating costs (including research & development, regulatory charges
etc);
• End-of-pipe capital investments;
• Integrated or ‘clean’ technology capital investments; and
• Income and savings (the sale of environmental protection by-products).
This expenditure is also reported by the environmental media to which they relate to, as shown
below:
Waste water – collection and transport of waste water, the prevention or reduction in quantity of
waste water and of substances in waste water, the prevention of incidental water pollution, the
treatment of cooling water before draining to the surface or groundwater and monitoring of surface
water.
Air – prevention or reduction of gaseous, liquid or particulate emissions to the atmosphere and the
monitoring of air emissions.
(Solid) Waste – the prevention or reduction of waste, the collection, transport, treatment and
disposal and monitoring of waste.
Soil/groundwater – decontamination of polluted soils and cleansing of polluted ground water.
Includes the protection of soil and groundwater against pollution infiltration, monitoring of soil and
groundwater and the transport and disposal of contaminated soil.
Noise/vibration – measures to decrease noise and vibration levels at source, to isolate receivers
from noise/vibration and the monitoring of levels. Protection of the workplace is excluded.
Nature protection – protection of species, landscapes and habitats; rehabilitation of damaged
landscapes due to past or current actions. Reforestation is included.
1 NACE: ‘Nomenclature Generale des Activites Economiques dans les Communautes Europeennes’

5645R/46059-003-784/SV Final Report June 2005
3
This survey succeeds the Defra (formerly known as Department of Environment, Transport and the
Regions - DETR) surveys carried out in 2002, 2001, 2000, 1999, 1997 and research on environmental
protection expenditure in 1994 (pilot study). The reports from these surveys can be downloaded at:
http://www.defra.gov.uk/environment/statistics/envsurvey/index.htm
1.3 DEFINITION OF ENVIRONMENTAL PROTECTION EXPENDITURE
The definition of environmental protection expenditure used for this survey was established by the
Statistical Office of the European Community (SOEC) as follows:
‘Environmental protection expenditure is the sum of capital and current expenditure on environmental protection activities. Environmental protection is an action or activity (involving the use of equipment, labour, manufacturing techniques and practices, information networks or products) where the main purpose is to collect, treat, reduce, prevent, or eliminate pollutants and pollution or any other degradation of the environment resulting from the activity of the company. Environmental protection expenditure may relate to activities that generate marketable by-products, or results in savings, or are financed by subsidies or capital allowances. In such cases, environmental protection expenditure should be reported gross of any such cost offsets.’
Environmental protection expenditure includes: expenditure to reduce or prevent emission to air and
water; expenditure to protect or clean up soil and groundwater; expenditure to prevent noise and
vibration; and expenditure to reduce, treat and dispose of waste materials. Expenditure may be
operating expenditure (OPEX) or capital expenditure (CAPEX).
OPEX includes the operating costs of a company’s own environmental protection equipment and
services and also payments to others for environmental protection services (including waste disposal).
CAPEX consists of end-of-pipe expenditure and expenditure on integrated processes. End-of-
pipe CAPEX is defined as expenditure on equipment used to treat, handle, measure or dispose of
emissions and wastes from production. Examples include effluent treatment plant, exhaust air
scrubbing systems, and solid waste compactors.
Capital expenditure on integrated processes relates to new or modified production facilities
designed to integrate environmental protection into the production process. This might include
adaptation of an existing installation/process whereby the integrated expenditure is then the total
purchase cost of the adaptation. It also includes installing a new process in which the design takes
environmental protection into account and in this case the expenditure counted is only the extra cost
compared with installing a ‘dirtier’ alternative.

5645R/46059-003-784/SV Final Report June 2005
4
Energy costs are not included in the definition of environmental protection expenditure, except where
energy is specifically used to run environmental protection equipment or services. Also excluded is
any expenditure on health and safety equipment or services.
1.4 REPORT STRUCTURE
This report consists of the following sections:
Section 1 Introduction;
Section 2 Survey Methodology and Preparation;
Section 3 Conducting the Survey;
Section 4 Analysis of Responses;
Section 5 Survey Results and Analysis; and
Section 6 Recommendations for Future Surveys.
This main report is supplemented by detailed annexes, as described below, which are presented as a
separate document:
Annex 1 Cover Letters and Technical Guidance Notes;
Annex 2 Detailed Sampling Methodology;
Annex 3 Validation of Responses;
Annex 4 Copies of promotional material;
Annex 5 Response codes for sorting correspondence;
Annex 6 Drivers behind participation;
Annex 7 Output of Data Analysis;
Annex 8 Grossing-up Procedure;
Annex 9 Methods for derivation of standard error and confidence intervals;
Annex 10 Detailed Results Tables; and
Annex 11 Valid Data.
The report and the Annexes can be downloaded from Defra’s web site at
http://www.defra.gov.uk/environment/statistics/envsurvey/index.htm

5645R/46059-003-784/SV Final Report June 2005
5
2 SURVEY METHODOLOGY AND PREPARATION
The main survey consisted of three phases, conducted between April 2004 and July 2005, which were
sub-divided into individual tasks/activities:
• Pre-survey is the first survey phase, which includes the following activities (April
2004 – May 2004):
o Review the previous year’s survey and introduction of modifications o Promote survey results o Produce a Project Initiation Document (PID) o Steering Group meeting participation
• Survey phase, which includes the following activities (June 2004 – February
2005):
o Select sample from the IDBR and carry out subsequent database work (request for the IDBR sample was sent out in March 2004)
o Review and submit mailout materials to Defra o Amend and approve mailout materials as required o Coordinate printing of the mailout materials o Provide helpdesk support o Dispatch survey pack to companies o Data entry of survey returns o Dispatch the reminder postcard o Survey resends as required o Reminder letter dispatch o Produce interim report
• Analysis and Final Reporting, this phase of the project includes the following
activities (March 2005 – July 2005):
o Creation / updating of validation process o Continuous validation (statistically and by calling companies to clarify issues) o Grossing of Results o Estimation of Non-response Bias o Supply of retrieval database to Defra o Assessment of previous Year’s Survey o Final Reporting and Feedback
Progress of the survey is guided by a Steering Group comprising of representatives from Defra,
Department for Trade and Industry (DTI), Environment Agency, Scottish Environmental Protection
Agency (SEPA) and the Office for National Statistics (ONS). URS are grateful for the guidance and
assistance provided by the Steering Group.
A few of the activities described above are discussed in detail below. These include introducing
modifications for 2003 survey, preparation of sampling methodology, changes in the database design,
and survey promotion.

5645R/46059-003-784/SV Final Report June 2005
6
2.1 MODIFICATIONS INTRODUCED IN THE 2003 SURVEY
Several modifications that were introduced during previous surveys were carried through to the 2003
survey, which in particular sought to improve awareness, help with definition issues and widen
ownership of the survey. These include for example the following activities:
• In order to continue to reduce respondent burden, micro sized companies, companies with 1 to 9
employees, were again excluded from the survey in 2003. In addition, small to medium sized
enterprises (SMEs), companies with between 10 and 50 employees, received a simplified cover
letter that asked them to complete only specific questions. Larger SMEs, large companies
(companies 250 plus employees) and top companies (specifically selected based on their
employee number and turnover as well as if they had responded to a number of previous
surveys) all received slightly different cover letters emphasising different issues. The definitions
of these company groups are explained in full in section 3.1 and the cover letters can be seen in
Annex 1.
• Helpdesk staff were trained to encourage companies to fill in specific / minimum questions in
cases where they felt that the survey was not relevant to them. This approach was carried over
from the previous surveys, as it proved useful in persuading companies to respond when they
contacted the Helpdesk.
• At the data entry stage, validation of internal inconsistencies and calculation errors were carried
out continuously during data entry, using a process specifically built into the Access database. In
addition to these inconsistency checks all of the other validation checks were built into the
database for the 2002 survey. The list of validation checks was updated to correspond to the
new 2003 survey form. This approach was continued because it made the further validation
process easier and quicker. It also enabled companies to be contacted with any queries fairly
soon after they had returned the questionnaire, while the information was still fresh in their
minds.
A number of new modifications were introduced for the survey in 2003, which aimed to reduce the
burden on respondents as well as to increase the response rate. These included the following
activities:
• The survey period was increased from ten to twelve weeks to allow enough time for completion
during a busy period of the year, and also to allow enough time for the questionnaire to reach the
right person within the company. In addition, to increasing the survey period, survey returns
were accepted several weeks after the final deadline.

5645R/46059-003-784/SV Final Report June 2005
7
• Chasing of Top Companies was increased by sending an additional e-mail to the companies’
general helpdesks, using the information that was available on their websites. The email
requested a contact name and email address of the person who was specifically responsible for
this type of information. Subsequently, the survey was sent to this contact, with a request to
complete the necessary information.
2.2 SAMPLING METHODOLOGY
The final stage of preparation involved selecting the sample of companies, which would be sent the
final questionnaire. In 2003, 8,142 companies were sampled across the extraction, manufacturing,
energy and water supply industries (see Figure 2.1 below a breakdown of the industry sectors
covered by the survey). A census was taken of the larger companies (companies with 250 plus
employees) with a stratified sampling approach, weighted towards the industry sectors with high
expenditure rates in the past, used to sample the smaller companies. The sampling procedure was
also designed to optimise the sample in terms of the sectors where the expenditure would be
greatest. The sampling methodology is described in full in Annex 2.
Figure 2.1 Industry sectors covered by the survey
SIC code Industry 10 – 14 Mining & Quarrying 15 – 37 Manufacturing 15-16 17-19 20 21-22 23 24-25 26 27 28-36
Food, beverages and tobacco products Textiles Wood and wood products Pulp, paper and printing Coke, petroleum and nuclear fuel Chemicals, plastics and rubber Non-metallic mineral products Basic metals Other manufacturing
40-41 Electricity, gas & water. 2.3 DATABASE DESIGN
The 2002 survey database was re-developed for the 2003 survey. The database was designed and
built using Microsoft Access 2000 to store information from the surveys. The database was intended
for use by:
• URS personnel gathering information from postal questionnaires and other correspondence;

5645R/46059-003-784/SV Final Report June 2005
8
• URS personnel to carry out continuous validation checks of the data entry process and to record
all of the phone calls made to the responding companies when confirming the data; and
• URS personnel conducting statistical analysis of each year’s data.
The database was re-developed for the 2003 survey to incorporate some additional validation tests.
Some of the data from the previous survey was retained within the database to allow for comparisons
to be made. Validation checks incorporated into the database are shown in Annex 3.
There are a number of advantages of building the validation checks into the data entry system:
1. Checks could be run more frequently;
2. The results of any follow up calls or validation changes were recorded;
3. The validation tests took account of the data types and conversions;
4. There was no delay between the data entry and the return of the validation checks; and
5. Companies could be contacted promptly after returning their completed questionnaires with any
queries.
After the validation tests were run, the results were stored for manual validation. The records within
the list would not change until the validation tests were run again.
2.4 SURVEY PROMOTION
Survey promotion was carried out as previously. A separate article was published independently by
ENDS, which is presented in Annex 4.
5645R/46059-003-784/SV Final Report June 2005
9
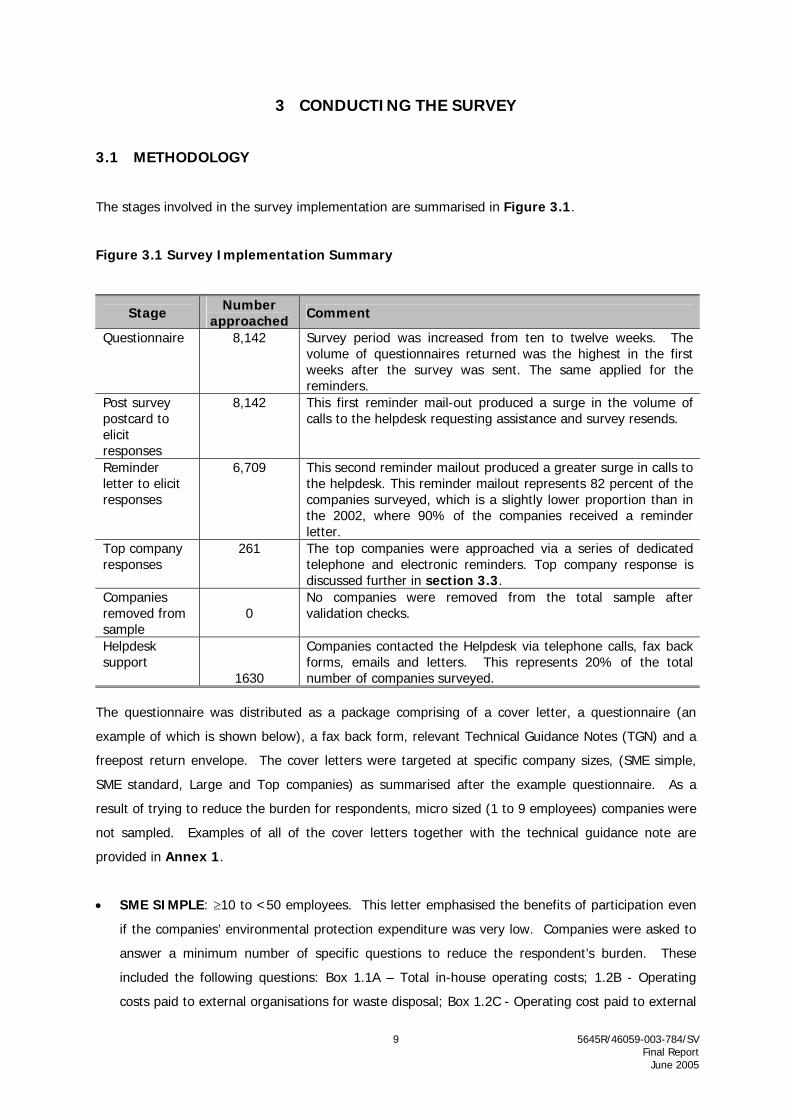
3 CONDUCTING THE SURVEY
3.1 METHODOLOGY
The stages involved in the survey implementation are summarised in Figure 3.1.
Figure 3.1 Survey Implementation Summary
Stage Number approached Comment
Questionnaire 8,142 Survey period was increased from ten to twelve weeks. The volume of questionnaires returned was the highest in the first weeks after the survey was sent. The same applied for the reminders.
Post survey postcard to elicit responses
8,142 This first reminder mail-out produced a surge in the volume of calls to the helpdesk requesting assistance and survey resends.
Reminder letter to elicit responses
6,709 This second reminder mailout produced a greater surge in calls to the helpdesk. This reminder mailout represents 82 percent of the companies surveyed, which is a slightly lower proportion than in the 2002, where 90% of the companies received a reminder letter.
Top company responses
261 The top companies were approached via a series of dedicated telephone and electronic reminders. Top company response is discussed further in section 3.3.
Companies removed from sample
0
No companies were removed from the total sample after validation checks.
Helpdesk support
1630
Companies contacted the Helpdesk via telephone calls, fax back forms, emails and letters. This represents 20% of the total number of companies surveyed.
The questionnaire was distributed as a package comprising of a cover letter, a questionnaire (an
example of which is shown below), a fax back form, relevant Technical Guidance Notes (TGN) and a
freepost return envelope. The cover letters were targeted at specific company sizes, (SME simple,
SME standard, Large and Top companies) as summarised after the example questionnaire. As a
result of trying to reduce the burden for respondents, micro sized (1 to 9 employees) companies were
not sampled. Examples of all of the cover letters together with the technical guidance note are
provided in Annex 1.
• SME SIMPLE: ≥10 to <50 employees. This letter emphasised the benefits of participation even
if the companies’ environmental protection expenditure was very low. Companies were asked to
answer a minimum number of specific questions to reduce the respondent’s burden. These
included the following questions: Box 1.1A – Total in-house operating costs; 1.2B - Operating
costs paid to external organisations for waste disposal; Box 1.2C - Operating cost paid to external
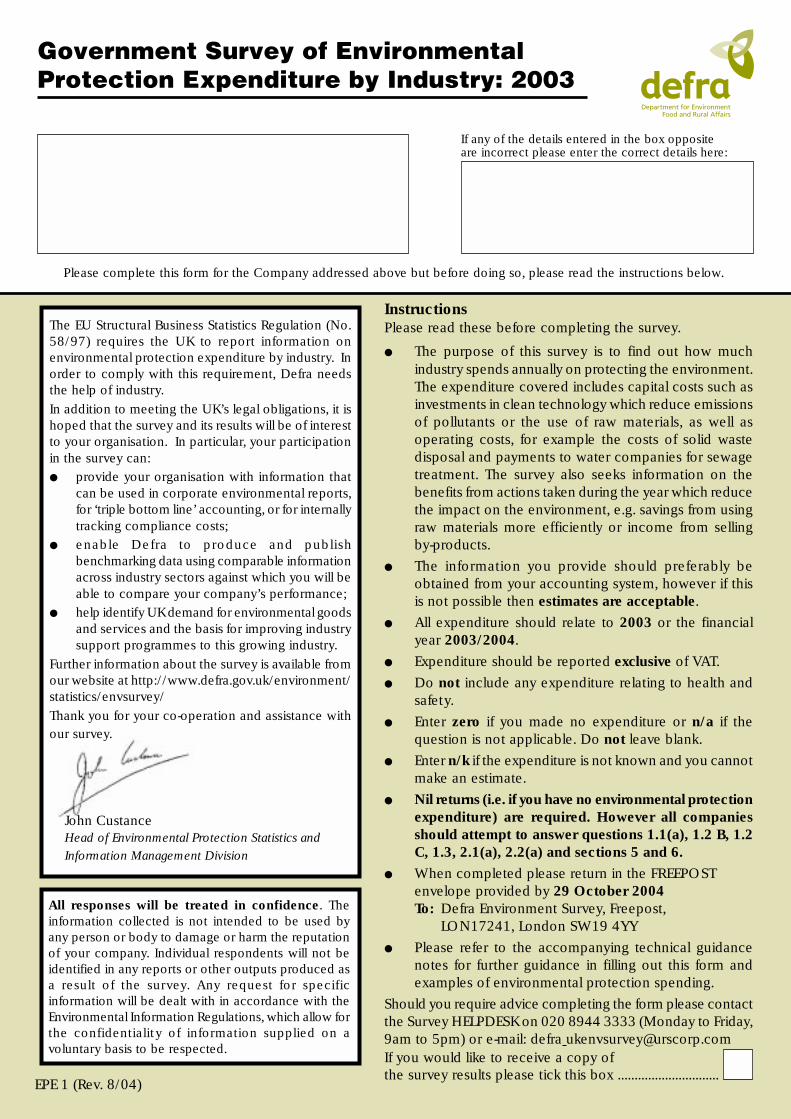
Government Survey of EnvironmentalProtection Expenditure by Industry: 2003
If any of the details entered in the box oppositeare incorrect please enter the correct details here:
Please complete this form for the Company addressed above but before doing so, please read the instructions below.
InstructionsPlease read these before completing the survey.
● The purpose of this survey is to find out how muchindustry spends annually on protecting the environment.The expenditure covered includes capital costs such asinvestments in clean technology which reduce emissionsof pollutants or the use of raw materials, as well asoperating costs, for example the costs of solid wastedisposal and payments to water companies for sewagetreatment. The survey also seeks information on thebenefits from actions taken during the year which reducethe impact on the environment, e.g. savings from usingraw materials more efficiently or income from sellingby-products.
● The information you provide should preferably beobtained from your accounting system, however if thisis not possible then estimates are acceptable.
● All expenditure should relate to 2003 or the financialyear 2003/2004.
● Expenditure should be reported exclusive of VAT.
● Do not include any expenditure relating to health andsafety.
● Enter zero if you made no expenditure or n/a if thequestion is not applicable. Do not leave blank.
● Enter n/k if the expenditure is not known and you cannotmake an estimate.
● Nil returns (i.e. if you have no environmental protectionexpenditure) are required. However all companiesshould attempt to answer questions 1.1(a), 1.2 B, 1.2C, 1.3, 2.1(a), 2.2(a) and sections 5 and 6.
● When completed please return in the FREEPOSTenvelope provided by 29 October 2004To: Defra Environment Survey, Freepost,
LON17241, London SW19 4YY
● Please refer to the accompanying technical guidancenotes for further guidance in filling out this form andexamples of environmental protection spending.
Should you require advice completing the form please contactthe Survey HELPDESK on 020 8944 3333 (Monday to Friday,9am to 5pm) or e-mail: defra [email protected] you would like to receive a copy ofthe survey results please tick this box ..............................
EPE 1 (Rev. 8/04)
The EU Structural Business Statistics Regulation (No.58/97) requires the UK to report information onenvironmental protection expenditure by industry. Inorder to comply with this requirement, Defra needsthe help of industry.In addition to meeting the UK’s legal obligations, it ishoped that the survey and its results will be of interestto your organisation. In particular, your participationin the survey can:● provide your organisation with information that
can be used in corporate environmental reports,for ‘triple bottom line’ accounting, or for internallytracking compliance costs;
● enable Defra to produce and publishbenchmarking data using comparable informationacross industry sectors against which you will beable to compare your company’s performance;
● help identify UK demand for environmental goodsand services and the basis for improving industrysupport programmes to this growing industry.
Further information about the survey is available fromour website at http://www.defra.gov.uk/environment/statistics/envsurvey/Thank you for your co-operation and assistance withour survey.
John CustanceHead of Environmental Protection Statistics andInformation Management Division
All responses will be treated in confidence. Theinformation collected is not intended to be used byany person or body to damage or harm the reputationof your company. Individual respondents will not beidentified in any reports or other outputs produced asa result of the survey. Any request for specificinformation will be dealt with in accordance with theEnvironmental Information Regulations, which allow forthe confidentiality of information supplied on avoluntary basis to be respected.
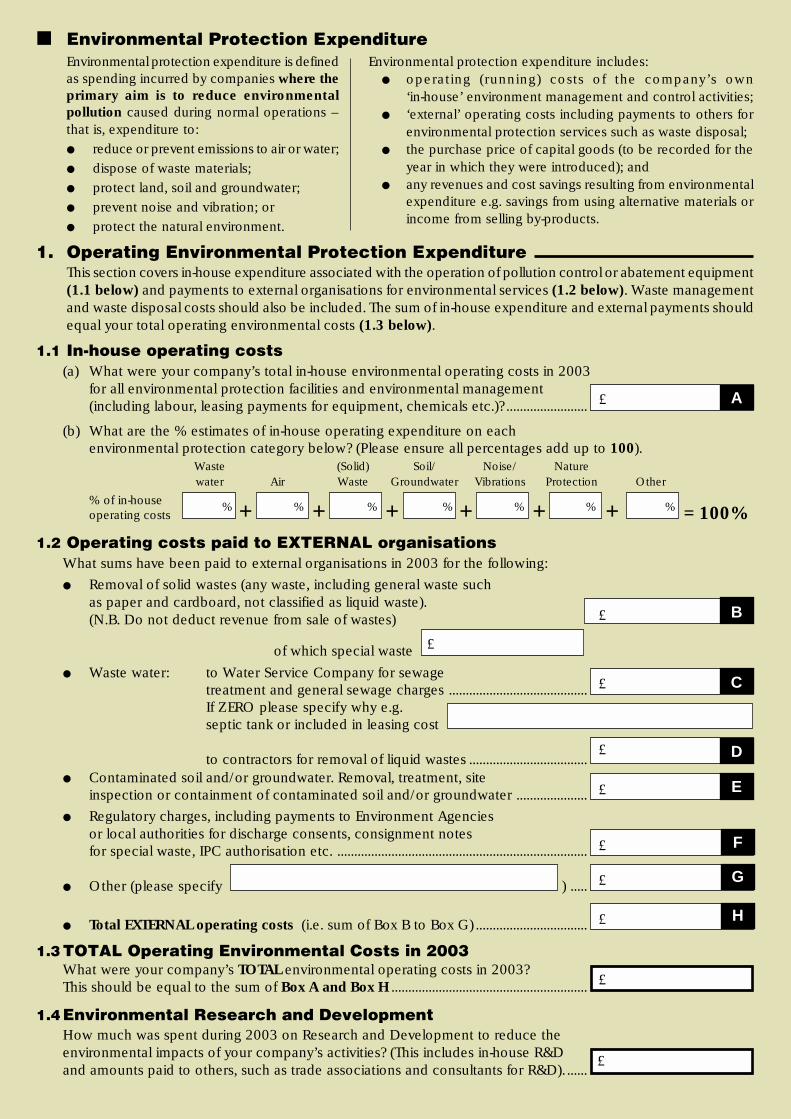
■ Environmental Protection ExpenditureEnvironmental protection expenditure is definedas spending incurred by companies where theprimary aim is to reduce environmentalpollution caused during normal operations –that is, expenditure to:● reduce or prevent emissions to air or water;● dispose of waste materials;● protect land, soil and groundwater;● prevent noise and vibration; or● protect the natural environment.
Environmental protection expenditure includes:● operating (running) costs of the company’s own
‘in-house’ environment management and control activities;● ‘external’ operating costs including payments to others for
environmental protection services such as waste disposal;● the purchase price of capital goods (to be recorded for the
year in which they were introduced); and● any revenues and cost savings resulting from environmental
expenditure e.g. savings from using alternative materials orincome from selling by-products.
1. Operating Environmental Protection ExpenditureThis section covers in-house expenditure associated with the operation of pollution control or abatement equipment(1.1 below) and payments to external organisations for environmental services (1.2 below). Waste managementand waste disposal costs should also be included. The sum of in-house expenditure and external payments shouldequal your total operating environmental costs (1.3 below).
1.1 In-house operating costs(a) What were your company’s total in-house environmental operating costs in 2003
for all environmental protection facilities and environmental management(including labour, leasing payments for equipment, chemicals etc.)? ........................
(b) What are the % estimates of in-house operating expenditure on eachenvironmental protection category below? (Please ensure all percentages add up to 100).
Waste (Solid) Soil/ Noise/ Naturewater Air Waste Groundwater Vibrations Protection Other
% of in-houseoperating costs + + + + + + = 100%
1.2 Operating costs paid to EXTERNAL organisationsWhat sums have been paid to external organisations in 2003 for the following:
● Removal of solid wastes (any waste, including general waste suchas paper and cardboard, not classified as liquid waste).(N.B. Do not deduct revenue from sale of wastes)
of which special waste
● Waste water: to Water Service Company for sewagetreatment and general sewage charges .........................................If ZERO please specify why e.g.septic tank or included in leasing cost
to contractors for removal of liquid wastes ...................................● Contaminated soil and/or groundwater. Removal, treatment, site
inspection or containment of contaminated soil and/or groundwater .....................
● Regulatory charges, including payments to Environment Agenciesor local authorities for discharge consents, consignment notesfor special waste, IPC authorisation etc. ..........................................................................
● Other (please specify ) .....
● Total EXTERNAL operating costs (i.e. sum of Box B to Box G) .................................
1.3 TOTAL Operating Environmental Costs in 2003What were your company’s TOTAL environmental operating costs in 2003?This should be equal to the sum of Box A and Box H ..........................................................
1.4Environmental Research and DevelopmentHow much was spent during 2003 on Research and Development to reduce theenvironmental impacts of your company’s activities? (This includes in-house R&Dand amounts paid to others, such as trade associations and consultants for R&D). ......
£
£
£
£
% % % % % % %
£
A
B
C
£
£
£
£
£
£
D
E
F
G
H

2. Capital Environmental Protection Expenditures
2.1 ‘End-of-Pipe’ Capital Expenditure‘End-of-pipe’ equipment is used to treat, handle, measure or dispose of emissions and wastes from production,but not equipment which is used in, or as part of, production processes or installations (covered in 2.2 below).Examples of ‘end-of-pipe’ equipment include effluent treatment plant and exhaust air scrubbing systems.
For further examples refer to the technical guidance notes.
(a) What was your company’s total capital expenditure (exclusive of VAT)on ‘end-of-pipe’ pollution control equipment, which became operationalin 2003, including equipment and installation costs? ...................................................
(b) What are the % estimates of 2003 ‘end-of-pipe’ capital expenditure on eachenvironmental protection category below? (Please ensure all percentages add up to 100).
Waste (Solid) Soil/ Noise/ Naturewater Air Waste Groundwater Vibrations Protection Other% of ‘end of
pipe’ capitalexpenditure + + + + + + = 100%
(c) Please provide a brief description of the main ‘end-of-pipe‘ capital expenditure.
2.2 ‘Integrated’ Capital Expenditure‘Integrated’ capital expenditure relates to new or modified production facilities, which have been designed sothat environmental protection is an integral part of the process.
(a) Most new integrated processes are more efficient and contribute to reducingpollution and/or the use of raw materials in some way. What was the totalexpenditure on such integrated processes that became operational in 2003? .......
(b) The primary aim of some of the expenditure recorded in 2.2(a) may not beto reduce environmental pollution. What is the element that specifically relatesto the additional cost of environmentally friendly processes? .....................................For example, if a new production process was installed in which the design takes account of environmental protection requirements,the environmental protection expenditure comprises the extra cost compared with a cheaper and less environmentally friendlyalternative. It can also include the adaptation of an existing installation/process. The environmental protection expenditure is then thetotal purchase cost of the adaptation.
(c) Of the expenditure recorded in 2.2(b), what are the percentages on each of the environmental protectioncategories shown below? (Please ensure all percentages add up to 100).
Waste (Solid) Soil/ Noise/ Nature% ofwater Air Waste Groundwater Vibrations Protection Other‘integrated’
capitalexpenditure + + + + + + = 100%
(d) Please provide a brief description of the main ‘integrated’ capital expenditure.
3. Cost Savings and IncomeThis section covers cost savings or income arising from expenditures or processchanges taken in 2003 that have resulted in environmental improvements.
3.1 Annualised cost savings resulting from:
(i) improved use of or substitution of raw materials ...........................................................
(ii) reductions in water use or production of effluent .........................................................
(iii) reductions in energy use......................................................................................................
(iv) savings in waste disposal costs ...........................................................................................
(v) other .........................................................................................................................................
% % % % % % %
% % % % % % %
£
£
£
£
£
£
£
£
5. Classification details● Number of persons employed
in the company (at 31.12.2003) .......................................................................................
● Company turnover in 2003................................................................................................
● Total Capital Expenditure in 2003 ....................................................................................
● Please specify whether all the above information wasfilled in for a site, division, whole company or other ...................................................
6. Contact detailsName Telephone No. (including national dialling code)
Position in Company e-mail address
Thank you for your assistancePlease return the questionnaire in the FREEPOST
envelope provided by 29 October 2004, toDefra Environment Survey, Freepost, LON17241, London SW19 4YY
£
£
3.2 What is the annualised level of income, if any, that has been obtained fromthe sale of by-products arising from expenditures or process changes takenin 2003 that have resulted in environmental improvements? ............................................Please note that income from the sale of by-products should only be reportedwhere these products are additional to the company’s core business.
3.3 What is the main product which generates this income?
4. Environmental Reporting Systems4.1 Do you separately identify environmental protection expenditure in any of the following?
(a) Management accounting system .................................................................................................... YES NO
(b) The financial accounts ...................................................................................................................... YES NO
(c) Data generated by an environmental management system ..................................................... YES NO
(d) Other sources ..................................................................................................................................... YES NO
4.2 Is some or all of this information also externally reported in:
(a) the annual reports and accounts?................................................................................................... YES NO
(b) an environmental report? ................................................................................................................. YES NO
(c) a corporate social responsibility or sustainability report? ......................................................... YES NO
(d) other? .................................................................................................................................................... YES NO
4.3 How long did it take you to complete this questionnaire? ....................................... hours minsPlease include the time required to retrieve/compile the relevant information.
4.4 Are there any comments you would like to make on this survey?
£

5645R/46059-003-784/SV Final Report June 2005
10
organisations for wastewater disposal; Box 1.3 - Total environmental operating costs in 2002; Box
2.1a - Total 'end of pipe' capital expenditure; Box 2.2a - Total 'integrated' expenditure; and
Sections 4, 5 and 6 – Completing information on environmental reporting systems, the
classification and company contact details;
• SME STANDARD:≥50 to <250 employees. The letter concentrated on emphasising the benefits
of participation to this size of company as the performance benchmarking and environmental
compliance;
• LARGE: ≥ 250 employees, excluding the top 261 companies. The letter emphasised the benefits
of participation by including Turnbull Guidance. The information collated in the survey may be
used to satisfy the corporate governance requirements; and
• TOP COMPANIES: ≥ 250 employees, selected companies from a ranked pool of the top 261
companies ranked by turnover and employee numbers. In addition to companies selected by
turnover and employee number, the 28 companies that did not respond in 2002 but did respond
in 1999, 2000, and 2001, and the 40 companies that did not respond in 2002 survey but did in
2000 and 2001, were also selected as Top Companies.
A change in methodology for the 2001 survey meant those companies with fewer than 10 employees
were excluded from the sample frame. This approach was continued for the 2002 and 2003 surveys
and the adjustment allowed more sampling to occur for companies with 10 to 249 employees. It was
felt that this change could be continued in 2003 because there seemed to be no real difference
between the expenditure per employee for the different size bands.
This change also aimed to improve the confidence intervals in the estimation of expenditure, and had
the added benefit of reducing the burden placed on the smallest companies. However the removal of
a complete section of the population meant that additional qualifications needed to be made
regarding the results of the survey. A comparison of the number of companies from which the
sample was drawn shows the clear effect of excluding the companies with under 10 employees as
seen in Figure 3.2.
5645R/46059-003-784/SV Final Report June 2005
11
Figure 3.2 Comparison of the number of companies from which the sample was drawn
from 1999 to 2003
1999 2000 2001 2002 2003
Complete Population 138,635 135,755 133,883 133,568 132,901
Excluded from sample 90,890 93,503 93,783
Population from which
sample was drawn
138,635 135,755 42,993 40,065 39,118
3.2 TOP COMPANY FOCUS
The focus on the top companies was changed from a ‘Top 100 interviews’ in 1999 to a ‘Dedicated Top
Company Follow-up’ for the 2000 survey. Due to its success, the Dedicated Top Company Follow-up
was continued for the 2001, 2002 and 2003 surveys. The following advantages have become
apparent each year using this approach:
• Feedback received from companies is an integral part of the questionnaire design for the
following year;
• Companies were pleased to be listed as Top Companies and therefore said that they will do their
best to participate in the survey.
• The telephone conversation provided the survey team with an opportunity to validate the data
and create confidence that the data supplied by respondents was valid. It also provided an
insight into the way companies interpreted the questions and presented their information;
• Key expenditure issues that are particularly relevant to the company are identified and may be
used for future reference during validation;
• Allowed us to build on the contacts made to minimise the difficulties experienced in identifying
and contacting the right person within the organisation. Also it helped to establish a good
working relationship with the company to help the survey process both this year and in future
years;
• Continue to raise the profile of the survey to minimise on the failure of companies to respond to
the questionnaire, either due to lack of interest or ability to complete as well as to encourage
5645R/46059-003-784/SV Final Report June 2005
12
companies to allocate time/resources to complete the survey and set up their accounting systems
to account for the required environmental protection expenditure information; and
• Continue to raise the profile to encourage response from the larger multi-nationals with a policy
of not partaking in voluntary surveys.
In addition to the standard Top Company Follow-up carried over from the previous years surveys, an
extra dimension was added into the process for the 2003 survey. For those Top Companies where
the contact person was not reachable by phone, an additional e-mail was sent to the companies’
general helpdesk, utilising the information they provided on their websites, enquiring whom the
appropriate person would be to contact with regards to the survey. The questionnaire and
corresponding material was then sent to the contact. The number of queries sent to a general
helpdesk was 51 and as a result contact was made with 7 companies. It is not possible to say which
survey returns are a direct result of the additional e-mail sent to the companies’ general helpdesk due
to the variety of methods used to contact the Top Companies and the difficulty in identifying exactly
why a company responded.
3.2.1 Impact of the Top Company Focus
Top Company responses for the follow-up are shown below in Figure 3.3. An analysis of reminder
calls for Top Companies is also provided. Specific codes used for recording the correspondence
received by the Helpdesk are presented in Annex 5.
Figure 3.3 Top company correspondence response codes. Response QuantityCompany declined to participate 56Undecided whether to participate 2Response sent for whole company – individual units not responding 4Late return 0Said that will return the survey – but did not 61Returned Questionnaires 65Company uncontactable / no response 73Total 261

5645R/46059-003-784/SV Final Report June 2005
13
3.2.2 Lessons learnt from the Dedicated Top Company Follow-up
During the reminder call phase for the Top Companies, more detail was noted during the telephone
conversations than at any previous stage. As a result, more specific analysis could be conducted
from this Top Company Follow-up. Key findings include:
• For the Top Companies that declined to participate in this year’s survey (2003) the most common
reasons were the same as in previous surveys. These included that next year would be more
convenient and that they did not have the resources or time available at present to complete the
survey. A commonly occurring reason was that the information that would support a response
was not readily available. Related to this, another reason was that due to the size and nature of
the companies, gathering the required information would necessitate too much time to be
devoted to it as the company’s accounting procedures do not separately identify environmental
protection expenditure; and
• Requests for resends were particularly prevalent where questionnaires had been sent to
unnamed persons and hence had gone missing or passed on from department to department, or
from person to person. As a result there was difficulty in finding the person made responsible for
its completion to remind them about the deadline.
It may be concluded that the numerous reminder calls made to these companies (with a majority of
the Top Companies being called at least three times or until a definite response was received) helped
to achieve a good response. In addition it is suggested that the timing of the 2003 survey suited
companies particularly well as it did not overlap with the end of year and Christmas periods as in
2002. 65 survey returns from 261 Top Companies gives a response rate of 25 per cent, which is an
increase on the 2002 response rate of 20 per cent. The highest responding sectors were Wood and
Wood Products (100%), Fabricated Metal Products (50%) and Furniture Manufacture (50%). Sectors
with the lowest response rates were Textiles (0%), Leather Products (0%) and Publishing & Printing
(0%).

5645R/46059-003-784/SV Final Report June 2005
14
3.3 SME SIMPLIFIED APPROACH
The expanded SME approach used for the 2001 and 2002 survey was continued in 2003. Hence, for
the 2001, 2002 and 2003 surveys, all companies with between 10 and 49 employees received a
simplified request. In contrast, the 2000 survey, half of the SME Simple and all of the micro-sized
companies received this simplified cover letter, and the other half received a standard cover letter.
The simplified cover letter instructed companies to answer specific questions. The specific questions
included the following:
• Box A in section 1.1 – Total in-house operating costs;
• Box B in section 1.2 - Operating costs paid to external organisations covering waste disposal;
• Box C in section 1.2 - Operating costs paid to external organisations covering wastewater
disposal;
• Box 1.3 - Total environmental operating costs in 2002;
• Box 2.1a - Total 'end of pipe' capital expenditure;
• Box 2.2a - Total 'integrated' expenditure; and
• Sections 5 and 6 - Complete the classification and contact details sections (see questionnaire for
further detail).
Companies in other categories (SME Standard, Large and Top) received the standard cover letters,
which instructed companies to answer all of the questions. The standard letter emphasised the
benefits of participation to this size of company, particularly focusing on the benefits and relevance of
the survey for performance benchmarking and environmental compliance purposes.
The highest responding sectors with the SME Simple approach included sector Collection, Purification
& Water Distribution (43%), Medical, Precision & Optical (38%), Radio, Television & Communications
(26%) and Chemical & Chemical Products – Other and Basic (26% and 25% respectively). This is
very similar to the 2002 survey with the exception of Radio, Television & Communications and Basic
Chemicals being amongst the highest 2003 respondents. In 2001 and 2002 the highest responding
sectors were Fabricated Metal Products, Chemical & Chemical Products and Machinery & Equipment.
The overall response rate of 20% within the SME Simple companies is in line with the overall
response rate for the survey. The SME Simple approach ensures that smaller companies also take
part in the survey and therefore, that the survey provides a broad representation of UK industry.
The percentage of response rates is not merely a reflection of the effect of the letter type but is also
the influence of the company’s size. As such, they should not be compared with the results of
simplified letters within the 2002 survey.

5645R/46059-003-784/SV Final Report June 2005
15
It should be noted that the majority (around 90 per cent) of the companies that received the
simplified request actually completed additional sections within the questionnaire. This extra data has
been included within the data set and subsequent analysis.
3.4 HELPDESK SUPPORT
The Helpdesk provided a key area of focus for the survey with companies using the facility to discuss
all aspects of the survey and opening a constructive dialogue between the sample population and the
URS survey team. This provided insight into the information from which the data have been derived,
allowed the data to be validated, and feedback to be obtained from companies as to their individual
experiences with the survey.
A Helpdesk telephone line, fax and email facilities were available to participating companies
throughout the entire survey period. Companies could use any or all of these methods to contact a
member of the URS survey team.
Throughout the main survey period about 1,560 calls and faxes and approximately 70 emails were
received. These facilities, in conjunction with the website, have proved to be a valuable part of the
survey process. The feedback provided has enabled the survey team to track the reasons for
participation and constraints identified by potential survey participants. Annex 6 identifies the main
drivers behind participation and also the reasons why companies declined to participate. This
feedback will be utilised when designing future surveys.
Companies that have used the Helpdesk services commented that it provided useful information,
clarification and assistance in completing the survey form. In addition, the Helpdesk phone calls were
utilised to persuade companies to respond to the questionnaire even if they thought that the survey
was not relevant to them. The URS survey team asked companies to complete the minimum
questions required including external operating cost paid for waste disposal, and for wastewater
charges, as well as the environmental reporting, company classification and contact details.
The website has been maintained and continually updated throughout the year. The website address
is: http://www.defra.gov.uk/environment/statistics/envsurvey/index.htm.
The website has been used in conjunction with the Helpdesk to provide companies with additional
copies of the questionnaire, technical guidance notes and other information relating to the survey.
Approximately 40 companies were directed to the website in order to obtain another copy of the 2003
survey or to fill it in online. When survey resends were requested the website was used as a primary
means of providing another copy of the questionnaire, a copy sent by e-mail and fax was used as a
5645R/46059-003-784/SV Final Report June 2005
16
secondary means and a postal copy was only offered as a final resort. Despite this, companies
mostly preferred to receive an additional copy of the survey by post.
In addition a web-based questionnaire was used for the 2003 in order for companies to be able to fill
in the survey online. This method of responding was encouraged through the calls received at
helpdesk. However, only handful of questionnaires filled in online were received by e-mail by the end
of the survey period. This approach was introduced to reduce the burden on respondents as well as
on the helpdesk staff and will be encouraged in the following survey. Introduction of the web-based
questionnaire was well received and provided added flexibility to the survey. It is therefore
recommended that this approach be mentioned in the survey correspondence sent to the companies.
5645R/46059-003-784/SV Final Report June 2005
17
4 ANALYSIS OF RESPONSES
4.1 RESPONSES
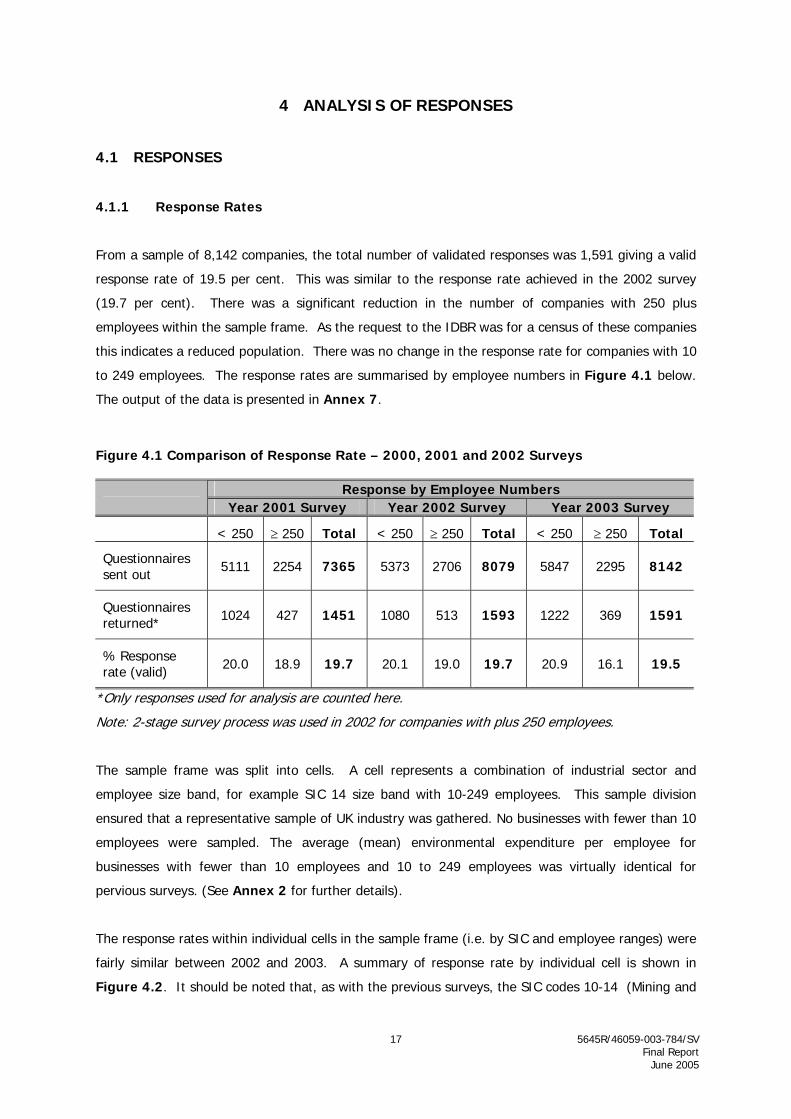
4.1.1 Response Rates
From a sample of 8,142 companies, the total number of validated responses was 1,591 giving a valid
response rate of 19.5 per cent. This was similar to the response rate achieved in the 2002 survey
(19.7 per cent). There was a significant reduction in the number of companies with 250 plus
employees within the sample frame. As the request to the IDBR was for a census of these companies
this indicates a reduced population. There was no change in the response rate for companies with 10
to 249 employees. The response rates are summarised by employee numbers in Figure 4.1 below.
The output of the data is presented in Annex 7.
Figure 4.1 Comparison of Response Rate – 2000, 2001 and 2002 Surveys
Response by Employee Numbers Year 2001 Survey Year 2002 Survey Year 2003 Survey
< 250 ≥ 250 Total < 250 ≥ 250 Total < 250 ≥ 250 Total
Questionnaires sent out 5111 2254 7365 5373 2706 8079 5847 2295 8142
Questionnaires returned* 1024 427 1451 1080 513 1593 1222 369 1591
% Response rate (valid) 20.0 18.9 19.7 20.1 19.0 19.7 20.9 16.1 19.5
*Only responses used for analysis are counted here.
Note: 2-stage survey process was used in 2002 for companies with plus 250 employees.
The sample frame was split into cells. A cell represents a combination of industrial sector and
employee size band, for example SIC 14 size band with 10-249 employees. This sample division
ensured that a representative sample of UK industry was gathered. No businesses with fewer than 10
employees were sampled. The average (mean) environmental expenditure per employee for
businesses with fewer than 10 employees and 10 to 249 employees was virtually identical for
pervious surveys. (See Annex 2 for further details).
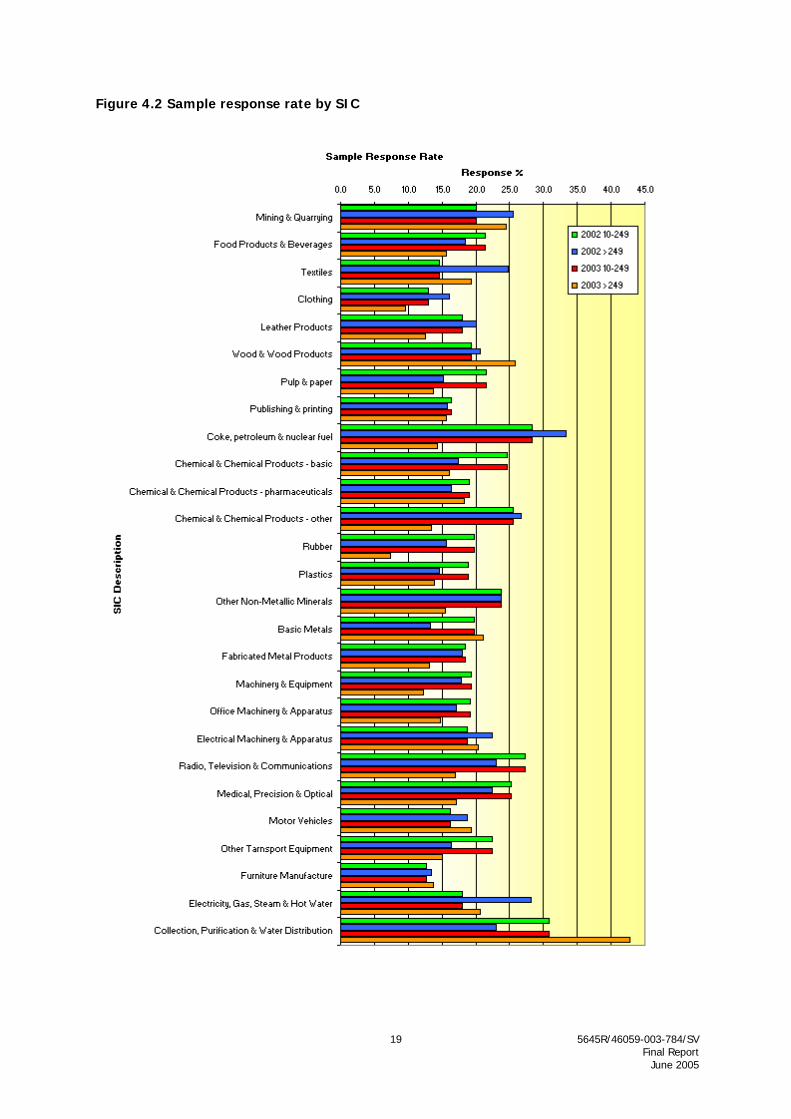
The response rates within individual cells in the sample frame (i.e. by SIC and employee ranges) were
fairly similar between 2002 and 2003. A summary of response rate by individual cell is shown in
Figure 4.2. It should be noted that, as with the previous surveys, the SIC codes 10-14 (Mining and

5645R/46059-003-784/SV Final Report June 2005
18
Quarrying) and 15 and 16 (Food Products and Beverages including Tobacco Products) are combined
for reporting purposes. Details of the valid data are presented in Annex 11.
5645R/46059-003-784/SV Final Report June 2005
19
Figure 4.2 Sample response rate by SIC

4.1.2 Weighted Response Rates
The overall response rate given above considers each company as an equal contributor to the final
results. The sample frame has, however, been designed to target higher spending sectors and the
largest employers. This means that other response rate measures may be more appropriate. A
number of alternative effective response rates are given in the Figure 4.3 below.
Figure 4.3 Alternative measures of response rate
Measure response rate by:
Sample Frame Grouping Response Rate
Census 17.8%
Non-Census 20.5%
Number of Companies
All 19.5%
Census 21.7%
Non-Census 22.8%
Number of Employees
All 21.8%
Census 26.8%
Non-Census 22.7%
Turnover
All 26.5%
Census 27.8%
Non-Census 22.0%
Spending
All 27.3%
This analysis shows that the sampling strategy is effective in targeting the highest spending sectors,
with 27 per cent of the estimated spending of the sample accounted for by respondents.
4.1.3 Repeated Responses
With five years of survey data it is possible to consider the responses of individual companies across
the five-year period. Figure 4.4 shows the distribution of repeat responses based upon the 2003
respondents. It should be noted that the opportunities to respond to the surveys are not the same
for all companies. Some may have been included in every survey, whilst for others 2003 was their
first chance to respond.
20 5645R/46059-003-784/SV Final Report June 2005
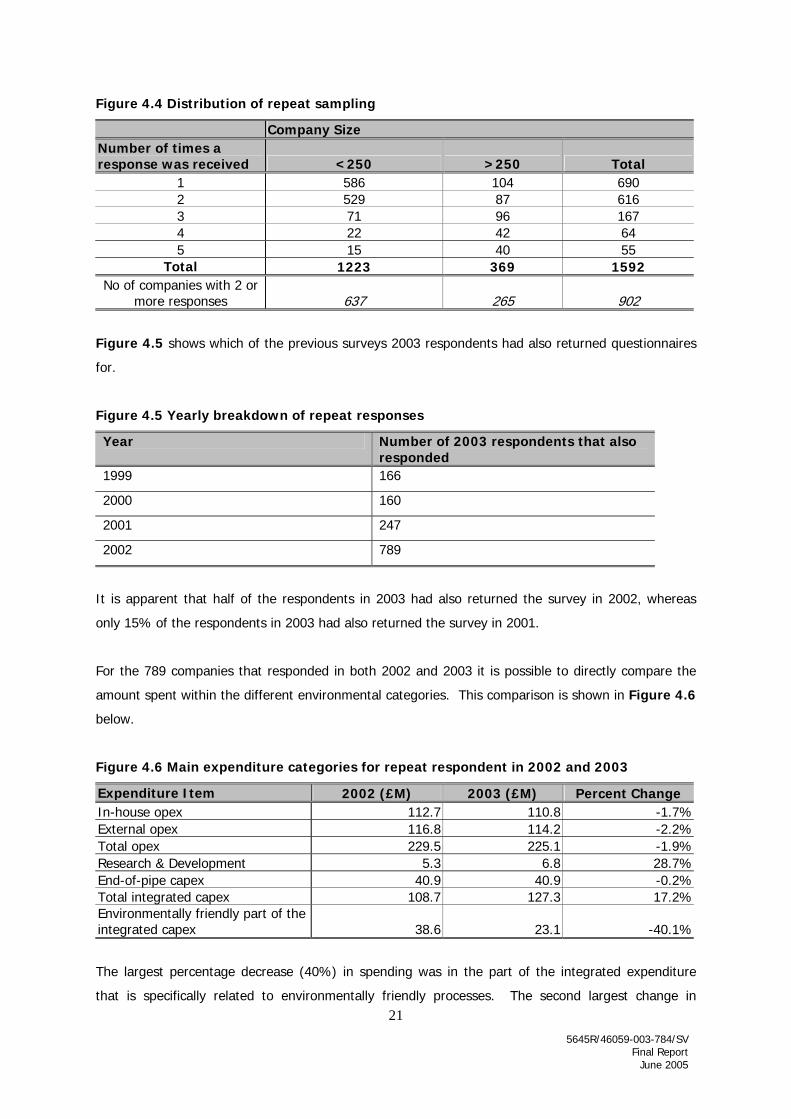
Figure 4.4 Distribution of repeat sampling
Company Size Number of times a response was received <250 >250 Total
1 586 104 690 2 529 87 616 3 71 96 167 4 22 42 64 5 15 40 55
Total 1223 369 1592 No of companies with 2 or
more responses 637 265 902
Figure 4.5 shows which of the previous surveys 2003 respondents had also returned questionnaires
for.
Figure 4.5 Yearly breakdown of repeat responses
Year Number of 2003 respondents that also responded
1999 166
2000 160
2001 247
2002 789
It is apparent that half of the respondents in 2003 had also returned the survey in 2002, whereas
only 15% of the respondents in 2003 had also returned the survey in 2001.
For the 789 companies that responded in both 2002 and 2003 it is possible to directly compare the
amount spent within the different environmental categories. This comparison is shown in Figure 4.6
below.
Figure 4.6 Main expenditure categories for repeat respondent in 2002 and 2003
Expenditure Item 2002 (£M) 2003 (£M) Percent Change In-house opex 112.7 110.8 -1.7%External opex 116.8 114.2 -2.2%Total opex 229.5 225.1 -1.9%Research & Development 5.3 6.8 28.7%End-of-pipe capex 40.9 40.9 -0.2%Total integrated capex 108.7 127.3 17.2%Environmentally friendly part of the integrated capex 38.6 23.1 -40.1%
The largest percentage decrease (40%) in spending was in the part of the integrated expenditure
that is specifically related to environmentally friendly processes. The second largest change in
21 5645R/46059-003-784/SV Final Report June 2005

spending was the increase (28%) in spending on research and development and the third largest is
the increase in the total spending on integrated expenditure (17%). The spending has shifted
towards the total integrated expenditure from the part of the integrated expenditure that specifically
related to environmental protection. It should be noted that the values seen in Figure 4.6 are for the
repeat respondent’s total spending without any grossing up.
4.1.4 Response Bias
There are many forms of response bias associated with this survey and these have been well
documented in previous reports. To recount, the potential sources of response bias previously
identified included:
• Companies with zero or low expenditure being more likely to respond because they have less of
the questionnaire to complete;
• Larger companies with organised environmental departments being more likely to respond
because of availability of the data;
• Possible bias from companies that have completed the survey in previous years being more likely
be able to complete one for 2003; and
• Companies that take environmental protection expenditure more seriously may well be more
likely to respond to the survey, but would be expected to have higher expenditure.
The effect of these possible biases is likely to be reduced, however, by the stratified sampling and
grossing arrangements (details of the grossing-up procedure are presented in Annex 8), that is,
using a relatively large number of cells (determined by size of company and SIC) to categorise
companies with similar characteristics – any bias is then “contained” within the cell.
The repetition of the survey over a number of years has allowed for measures to be taken to obtain a
better understanding of the potential and likely significance of these response biases. For example:
• The question on the reporting systems used indicated that most companies complete the
questionnaire without a reporting system suggesting that even without easily available data
companies do manage to respond; and
• A number of companies actually self-exclude themselves from the survey if they have zero
expenditure suggesting that zero expenditure may not increase the likelihood of a company
responding.
22 5645R/46059-003-784/SV Final Report June 2005

4.1.5 2002 vs. 2003 Methodology
In comparing the two sets of data, there are a number of factors that need to be considered. The
ranges indicated by the confidence intervals for the total expenditure are relatively large, and there
have been improvements made to the questionnaire design and estimation procedure. Hence
comparing the absolute values should be undertaken with caution. The process of generating
estimates of expenditure from the sample sets means that it is possible for one company’s
expenditure, to affect the final figure to a considerable degree. Furthermore the nature of
environmental protection expenditure is such that an individual company may make a large “one-off”
investment (e.g. capital equipment upgrade). Therefore, even though these large figures may make
a considerable difference in the final expenditure they should still be included. This principally relates
to capital expenditure rather than operating expenditure, which is generally more consistent from one
year to the next.
4.2 STANDARD ERRORS AND CONFIDENCE INTERVALS
The methodology adopted for the standard error calculation follows that used in the previous studies.
The results of the 2003 survey, in general, have similar standard errors to the equivalent results in
2002. This could be attributed to the limited number of changes made to both the sample frame and
the questionnaire between the 2002 and 2003 surveys.
The methods for deriving standard errors and 95 percent confidence intervals are presented in
Annex 9, together with the calculated standard errors and confidence limits themselves. Annex 9
explains the method of calculating standard errors (SE), for aggregates, i.e., operating expenditure,
capital expenditure, total gross, and total net expenditures.
The method followed involves aggregating the responses for each business. It is then possible to
calculate overall standard errors by using these aggregate sums. This method takes into account the
correlation between the responses to different questions by individual companies. Some companies
have zero expenditure for all questions whereas others have high expenditures for most questions.
This reflects the different types of businesses operating within particular SIC sectors. Figure 4.7
shows the standard errors for total environmental protection expenditure for different SIC sectors.
23 5645R/46059-003-784/SV Final Report June 2005

Figure 4. 7 Standard error for total environmental expenditure for different SIC sectors
0
0.1
0.2
0.3
0.4
0.5
0.6
0.7
0.8
0.9
1
SIC
Sta
nd
ard
Err
or /
Tot
al E
xpen
dit
ure
2000
2001
2002
2003
24 5645R/46059-003-784/SV Final Report June 2005

5 SURVEY RESULTS AND ANALYSIS
5.1 TOTAL EXPENDITURE
An estimated total of £3.4 billion was spent by UK industry on environmental protection in 2003.
Operating expenditure accounted for approximately 85 per cent of the total, with capital expenditure
making up the remainder. In-house operating costs account for nearly half of all operating costs, a
rather higher proportion than in previous years, most of the remainder being accounted for by
payments to others. Capital expenditure is dominated by spending on end-of-pipe processes, which
shows signs of decline since 2000. Spending on integrated processes is estimated at a relatively low
level of £180 million in 2003.
A summary of total expenditure is presented in Figure 5.1 in conjunction with equivalent data from
the 2000, 2001 and surveys for comparison. Ranges indicating the 95 percent confidence intervals
associated with each value are provided in parenthesis where available. As might be expected
because of the higher level of estimated expenditure, generally the interval 95 percent confidence
intervals are higher for the 2003 survey than the 2002 survey. Detailed tables of the expenditure can
be found in Annex 10. Gross spending on environmental protection in 2003 by UK industry
amounted to an estimated £3.4 billion, plus or minus £0.6 billion at 95 per cent confidence. The
estimates for previous years were £4.2 billion in 2000, £3.9 billion in 2001, and £2.6 billion in 2002.
Although a reduction in spending might have been expected as a result of the general downturn in
the manufacturing sector over the period, it now appears as if the 2002 figure is a bit of an anomaly.
Direct comparisons between survey years are not possible because the estimates are subject to wide
confidence intervals and because of improvements made over time to the questionnaire design and
estimation procedures. In light of this, comparisons will be shown as percentage shares of the total
spending reported in each year, rather than absolute figures. Comparisons between years should,
however still be treated with caution.
25 5645R/46059-003-784/SV Final Report June 2005

Figure 5.1 Total Expenditure Summary
2000 2001 2002 2003
Total expenditure (£M)
% of gross Total expenditure (£M)
% of gross Total expenditure (£M)
% of gross Total expenditure (£M)
% of gross
Capital expenditure
End of pipe
627 (470-784)
15 489(257-721)
13 276(169-383)
10 355(228-482)
10
Integrated processes1
795 (580-1,010)
19 639(399-880)
16 222 1
(121-324) 8 1771
(113-240) 5
Total CAPEX1
1,442 (1,122-1,721)
34 1,128(762-1,493)
29 498 1
(350-647) 19 5321
(387-676) 15
Operational Own account 1,150
(927-1,373) 27 1,222
(903-1,542) 31 888
(687-1,088) 34 1,369
(1,075-1,663) 40
Payment to others 1,492 (1,201-1,784)
35 1,455(1,202-1,708)
37 1,176(989-1,363)
45 1,459(1,145-1,773)
42
R&D 163 (67-258)
4 81(51-112)
2 77(51-103)
3 82(41-124)
3
Total OPEX
2,805 (2,343-3,266)
66 2,759(2,282-3,236)
71 2,140(1,784-2,496)
81 2,911(2,373-3,448)
85
Gross expenditure Total gross spending
4,226 (3,587-4,865)
100 3,887(3,162-4,612)
100 2,639(2,191-3,086)
100 3,442(2,835-4,049)
100
Subsidies 2 3 (1-5)
0 4(1-8)
0 N/a 2 N/a 2
By-products 207(122-291)
5 198(127-269)
5 232(134-329)
9 178(82-273)
5
Total net expenditure
4,016 (3,365-4,667)
95 3,599 (2,837-4,361)
93 2,407 (1,915-2,899)
91 3,264 (2,644-3,884)
95
Cost savings 3 180 (130-230)
4 113 (78-148)
3 296 3
(186-406) 11 265
(185-344) 8
Note: Comparisons between years should be treated with extreme caution 1. Questions on integrated processes changed in 2002 leading to reduction in estimates – total spend on integrated processes was estimated to be £2.3 billion in 2002 and £1.4 billion in
2003. 2. Question on subsidies excluded from questionnaire for 2002. 3. Questions on cost savings from environmental protection activities changed in 2002 leading to increase in estimates.
5645R/46059-003-784/SV Final Report June 2005
26

5.2 EXPENDITURE BY ENVIRONMENTAL MEDIA
This section summarises the amount of expenditure allocated to various environmental protection
categories. Responses are classified under capital expenditure (Figure 5.2) and operating
expenditure (Figure 5.3) and shown in bar chart form (Figures 5.4 and 5.5).
Figure 5.2 2003 Capital Environmental Expenditure by Media
Environmental media Capital Expenditure (£M) Integrated
Expenditure Integrated End-of-
Pipe
Total % of
total
2002 %
of total
2003 % of
total
Integrated
2002 %
of total
Integrated
Water 30 112 141 27% 21% 17% 13%
Air 49 164 213 40% 38% 28% 36%
Solid 22 33 55 10% 17% 12% 10%
Soil/ground water 11 11 22 4% 3% 6% 3%
Noise 7 3 11 2% 2% 4% 3%
Nature protection 27 10 38 7% 6% 15% 7%
Other 30 21 52 10% 13% 17% 28%
Total (£m) 177 355 532 498
Expenditure on air protection measures accounted for 40 percent of capital expenditure, as a
percentage of the total. Capital expenditure on air, water and solids combined accounted for 77
percent. The percentage spend by media is more variable for integrated expenditure items than for
end-of-pipe. The percentage of integrated nature protection expenditure has doubled between 2002
and 2003 (7% to 15%).
5645R/46059-003-784/SV Final Report
June 2005
27

Figure 5.3 2003 Operational Environmental Expenditure by Media
Environmental media Operating Expenditure (£M)
Internal External Total % of total 2002 % of total
Water 337 434 771 27% 31%
Air 235 2 237 8% 10%
Solid 491 805 1296 46% 40%
Soil/ground water 46 64 110 4% 2%
Noise 27 0 27 1% 3%
Nature protection 21 8 29 1% 1%
Other** 211 146 358 13% 10%
Total (£m) 1369 1459 2828 2064
** Includes regulator charges
Expenditure on solid waste accounted for 46 percent of the total operating cost (excluding R&D). This
was the largest expenditure category for both internal and external expenditure. In comparison to
2002, operational environmental expenditure on water and air protection measures, as a proportion
of the total operating expenditure, decreased. It should be noted that by its very nature an increased
percentage in one category would result in a decrease within another category.
Figures 5.4 and 5.5 show the proportion of expenditure across environmental media for operating
and capital expenditures respectively between 2000 and 2003.
5645R/46059-003-784/SV Final Report
June 2005
28
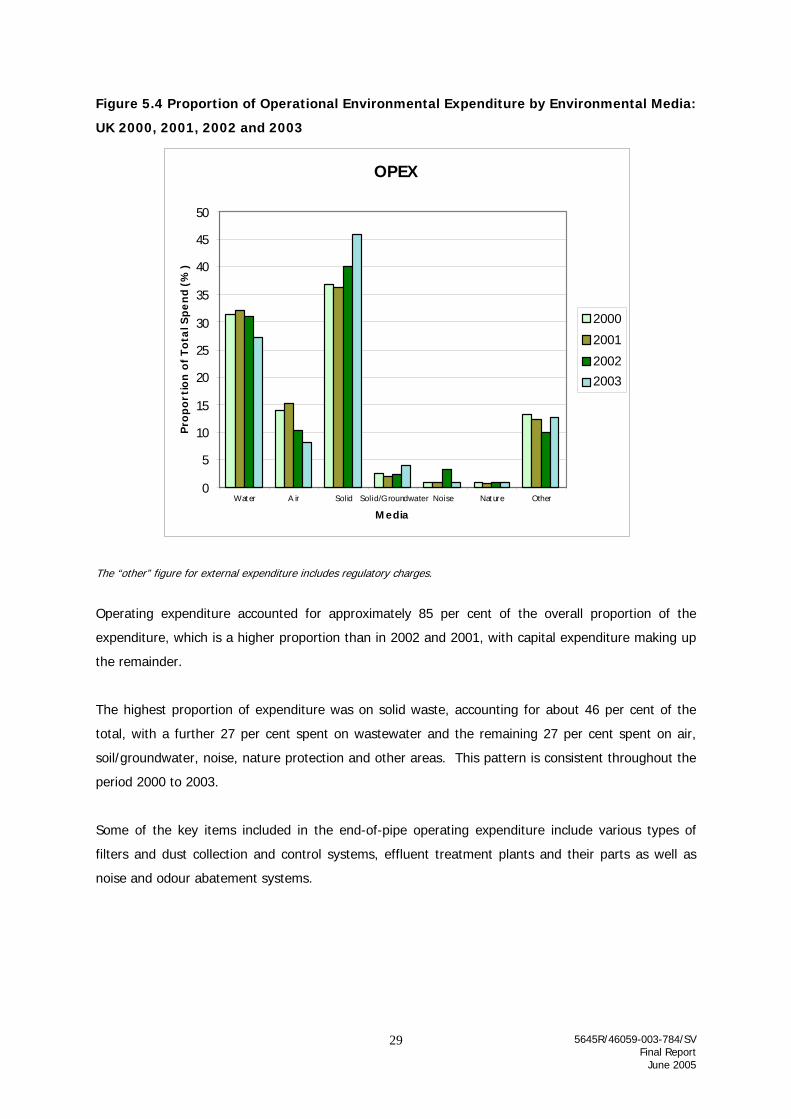
Figure 5.4 Proportion of Operational Environmental Expenditure by Environmental Media:
UK 2000, 2001, 2002 and 2003
OPEX
0
5
10
15
20
25
30
35
40
45
50
Wat er A ir Solid Solid/Groundwater Noise Nat ure Other
Media
Pro
po
rtio
n o
f T
ota
l Sp
en
d (%
)
2000
2001
20022003
The “other” figure for external expenditure includes regulatory charges.
Operating expenditure accounted for approximately 85 per cent of the overall proportion of the
expenditure, which is a higher proportion than in 2002 and 2001, with capital expenditure making up
the remainder.
The highest proportion of expenditure was on solid waste, accounting for about 46 per cent of the
total, with a further 27 per cent spent on wastewater and the remaining 27 per cent spent on air,
soil/groundwater, noise, nature protection and other areas. This pattern is consistent throughout the
period 2000 to 2003.
Some of the key items included in the end-of-pipe operating expenditure include various types of
filters and dust collection and control systems, effluent treatment plants and their parts as well as
noise and odour abatement systems.
5645R/46059-003-784/SV Final Report
June 2005
29

Figure 5.5 Proportion of Capital Environmental Expenditure by Environmental Media: UK
2000, 2001, 2002 and 2003
CAPEX
0
5
10
15
20
25
30
35
40
45
50
Wat er A ir Solid Solid/Groundwater Noise Nat ure Other
Media
Pro
po
rtio
n o
f T
ota
l Sp
en
d (%
)
2000
20012002
2003
The “other” figure for external expenditure includes regulatory charges.
Capital expenditure accounted for about 15% of the overall total environmental protection
expenditure in 2003. The highest proportion of expenditure was on air, accounting for approximately
40 per cent of the total, with a further 27 per cent spent on wastewater, 10 per cent on solid waste
and the remaining 23 per cent spent on soil/groundwater, noise, nature protection and other areas.
The highest areas of capital expenditure were broadly the same in 2000, 2001, and 2002. As
previously noted, the large differences between years in the amounts of capital expenditure recorded
in the survey is in part attributable to changes in the ways the survey questions have been asked in
different years.
The highest proportion of operating expenditure was on solid waste, whereas the highest proportion
of capital expenditure was on air. This could result from the Integrated Pollution Prevention Control
(IPPC) permit increasing the capital expenditure on air protection measures.
5645R/46059-003-784/SV Final Report
June 2005
30

5.3 EXPENDITURE BY INDUSTRY SECTOR
In all four years the primary spending sectors were Food, Beverages and Tobacco Products (ranging
between 12 to 19 per cent of total spend), Electricity, Gas, Steam and Hot Water (ranging between
11 to 17 per cent) and Chemicals and Chemical Products (ranging between 15 and 19 per cent of
total spend). The bar chart in Figure 5.6 shows the proportion of total expenditure by sector for
2000 to 2003.
Figure 5.6 Proportion of Total Environmental Expenditure by Standard Industrial
Classification (SIC) sectors: UK 2000, 2001, 2002 and 2003.
02468
101214161820
Sector
Pro
port
ion
of T
ota
l Sp
end
(%)
2000
2001
2002
2003
Since 2002 expenditure has decreased in the two largest spending sectors, Beverages and Tobacco
Products and Electricity, Gas, Steam and Hot Water. However in the Chemicals and Chemical
Products sector the expenditure has increased. Spending in the Machinery & Equipment sector has
more than doubled since 2002. Also a large increase has been noted in the Textiles, Clothing and
Leather Products sector since 2002. Sectors where the spending has remained fairly stable include
Mining and Quarrying, Rubber and Plastics, Electrical, Medical and Optical, Transport Equipment and
Furniture Manufacture.
5645R/46059-003-784/SV Final Report
June 2005
31
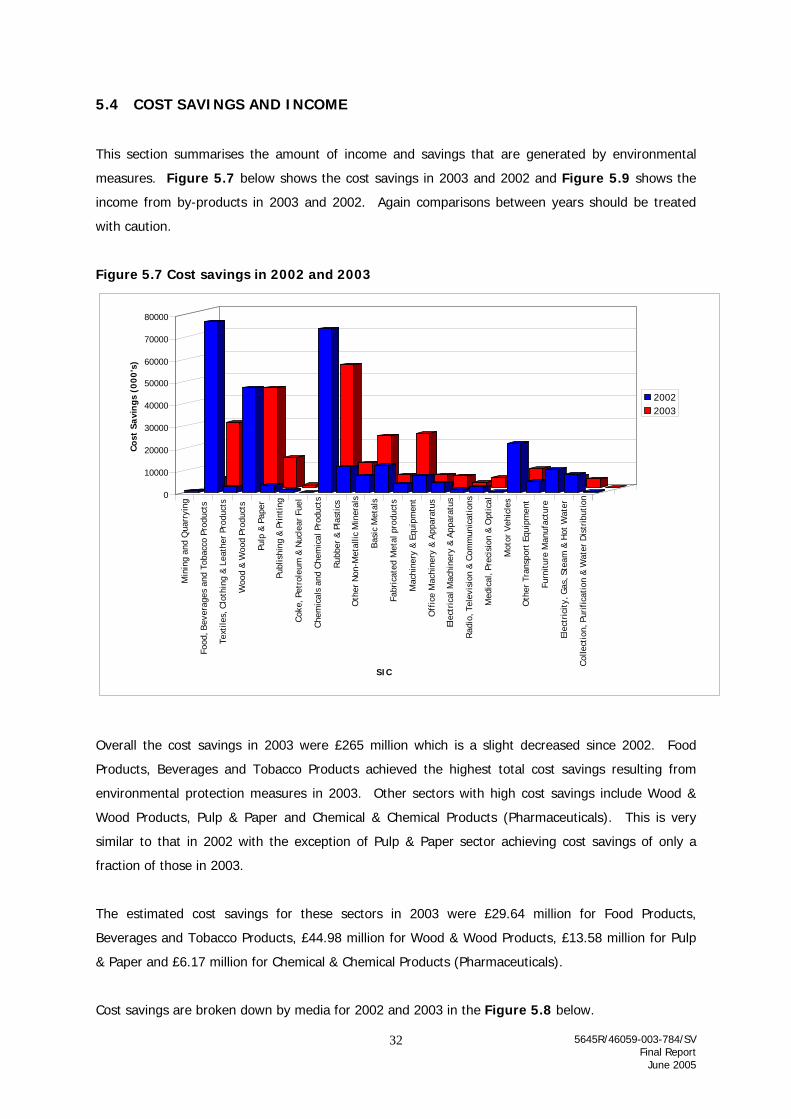
5.4 COST SAVINGS AND INCOME
This section summarises the amount of income and savings that are generated by environmental
measures. Figure 5.7 below shows the cost savings in 2003 and 2002 and Figure 5.9 shows the
income from by-products in 2003 and 2002. Again comparisons between years should be treated
with caution.
Figure 5.7 Cost savings in 2002 and 2003
0
10000
20000
30000
40000
50000
60000
70000
80000
Cost
Sa
vin
gs (
00
0's
)
Min
ing
and
Qua
rryi
ng
Food
, Bev
erag
es a
nd T
obac
co P
rodu
cts
Text
iles,
Clo
thin
g &
Lea
ther
Pro
duct
s
Woo
d &
Woo
d Pr
oduc
ts
Pulp
& P
aper
Publ
ishi
ng &
Pri
ntin
g
Cok
e, P
etro
leum
& N
ucle
ar F
uel
Che
mic
als
and
Che
mic
al P
rodu
cts
Rub
ber
& P
last
ics
Oth
er N
on-M
etal
lic M
iner
als
Bas
ic M
etal
s
Fabr
icat
ed M
etal
pro
duct
s
Mac
hine
ry &
Equ
ipm
ent
Off
ice
Mac
hine
ry &
App
arat
us
Elec
tric
al M
achi
nery
& A
ppar
atus
Rad
io, T
elev
isio
n &
Com
mun
icat
ions
Med
ical
, Pre
cisi
on &
Opt
ical
Mot
or V
ehic
les
Oth
er T
rans
port
Equ
ipm
ent
Furn
itur
e M
anuf
actu
re
Elec
tric
ity,
Gas
, Ste
am &
Hot
Wat
er
Col
lect
ion,
Pur
ific
atio
n &
Wat
er D
istr
ibut
ion
SIC
20022003
Overall the cost savings in 2003 were £265 million which is a slight decreased since 2002. Food
Products, Beverages and Tobacco Products achieved the highest total cost savings resulting from
environmental protection measures in 2003. Other sectors with high cost savings include Wood &
Wood Products, Pulp & Paper and Chemical & Chemical Products (Pharmaceuticals). This is very
similar to that in 2002 with the exception of Pulp & Paper sector achieving cost savings of only a
fraction of those in 2003.
The estimated cost savings for these sectors in 2003 were £29.64 million for Food Products,
Beverages and Tobacco Products, £44.98 million for Wood & Wood Products, £13.58 million for Pulp
& Paper and £6.17 million for Chemical & Chemical Products (Pharmaceuticals).
Cost savings are broken down by media for 2002 and 2003 in the Figure 5.8 below.
5645R/46059-003-784/SV Final Report
June 2005
32

Figure 5.8 Breakdown of cost savings
Cost savings (£M)
Raw
materials
Water
use
Energy
use
Waste Other Total
2003 Total 423.34 20.92 71.45 38.50 13.03 567.23
% Total 74.6 3.7 12.6 6.8 2.3 -
2002 Total 167.48 17.39 45.02 42.13 24.05 296.06
% Total 56.6 5.9 15.2 14.2 8.1 -
Highest cost savings were achieved from improved use or substitution of raw materials in 2003 as
well as in 2002. Cost savings as a result of reductions in energy use and savings in waste disposal
costs accounted for 12.6% and 6.8% in 2003 and 15.2% and 14.2% in 2002 respectively.
Income received as a result from by-products for 2003 as well as 2002 is shown in Figure 5.9 below.
Figure 5.9 Income from by-products (£ thousands) in 2002 and 2003
0
10000
20000
30000
40000
50000
60000
70000
80000
By-
Prod
ucts
(0
00's
)
Min
ing
and
Qua
rryi
ng
Food
, Bev
erag
es a
nd T
obac
co P
rodu
cts
Text
iles,
Clo
thin
g &
Lea
ther
Pro
duct
s
Woo
d &
Woo
d Pr
oduc
ts
Pulp
& P
aper
Publ
ishi
ng &
Pri
ntin
g
Cok
e, P
etro
leum
& N
ucle
ar F
uel
Che
mic
als
and
Che
mic
al P
rodu
cts
Rub
ber
& P
last
ics
Oth
er N
on-M
etal
lic M
iner
als
Bas
ic M
etal
s
Fabr
icat
ed M
etal
pro
duct
s
Mac
hine
ry &
Equ
ipm
ent
Off
ice
Mac
hine
ry &
App
arat
us
Elec
tric
al M
achi
nery
& A
ppar
atus
Rad
io, T
elev
isio
n &
Com
mun
icat
ions
Med
ical
, Pre
cisi
on &
Opt
ical
Mot
or V
ehic
les
Oth
er T
rans
port
Equ
ipm
ent
Furn
itur
e M
anuf
actu
re
Elec
tric
ity,
Gas
, Ste
am &
Hot
Wat
er
Col
lect
ion,
Pur
ific
atio
n &
Wat
er D
istr
ibut
ion
SIC
2002
2003
Income and savings resulting from the sale of by-products in 2003 was £178 million, which is a slight
decrease since 2002. Fabricated Metal Products (SIC 28) achieved the highest income resulting from
the sale of by-products in 2003 with a value of £48.5 million. This differs from 2002 when Food
5645R/46059-003-784/SV Final Report
June 2005
33

Products, Beverages and Tobacco Products achieved the highest income resulting from the sale of by-
products, (£77 million) closely followed by Fabricated Metal Products (£62 million).
5645R/46059-003-784/SV Final Report
June 2005
34

5.5 ENVIRONMENTAL PROTECTION EXPENDITURE BY INDIVIDUAL (SIC)
SECTOR
This section looks at each sector individually, identifies any notable features under the following
headings including a brief analysis discussing trends and drivers of environmental protection
expenditure in 2003:
• Key Expenditure – Summary of key data by operating expenditure (OPEX) and capital
expenditure (CAPEX) categories along with the expenditure in 2000 and 2002.
• Environmental Expenditure by Media – Expenditure has been subdivided according to media
type (i.e. water, solid waste, noise, air soil/groundwater, nature protection and ‘other’). This is
shown in bar chart form for external, in-house, integrated and end-of-pipe expenditure.
• Income and savings – Summary of key data by cost savings and by-product sales in
expenditure from 2000 to 2003.
When looking at the sector analyses it should be remembered that direct comparisons between
survey years are not possible because the estimates are subject to wide confidence intervals and
because of improvements made to the questionnaire design and estimation procedures. In light of
these discontinuities, comparisons will be shown as percentage shares of the total spending reported
in each year, rather than absolute figures. Comparisons between years should, however, still be
treated with caution. It should be noted that efforts are made each year to reduce confidence
intervals as well as to keep the questionnaire and methodology consistent.
5079R/46059-003-784/SV Final Report
June 2005
35
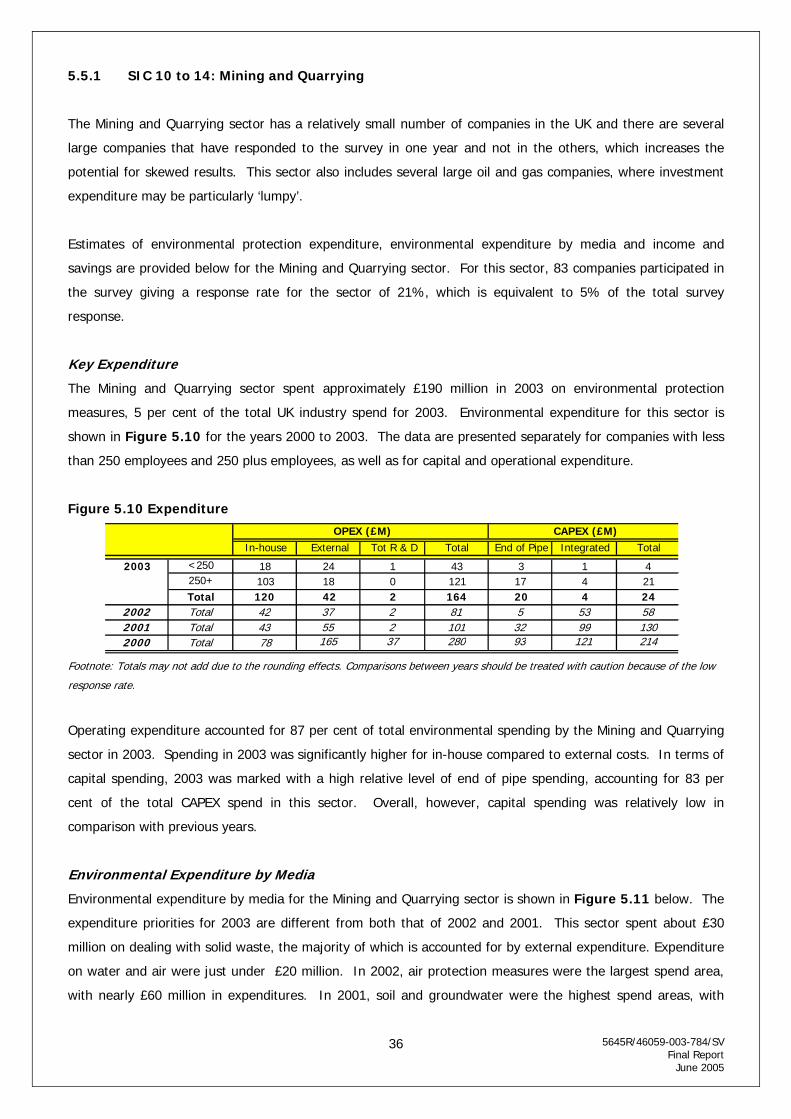
5.5.1 SIC 10 to 14: Mining and Quarrying
The Mining and Quarrying sector has a relatively small number of companies in the UK and there are several
large companies that have responded to the survey in one year and not in the others, which increases the
potential for skewed results. This sector also includes several large oil and gas companies, where investment
expenditure may be particularly ‘lumpy’.
Estimates of environmental protection expenditure, environmental expenditure by media and income and
savings are provided below for the Mining and Quarrying sector. For this sector, 83 companies participated in
the survey giving a response rate for the sector of 21%, which is equivalent to 5% of the total survey
response.
Key Expenditure
The Mining and Quarrying sector spent approximately £190 million in 2003 on environmental protection
measures, 5 per cent of the total UK industry spend for 2003. Environmental expenditure for this sector is
shown in Figure 5.10 for the years 2000 to 2003. The data are presented separately for companies with less
than 250 employees and 250 plus employees, as well as for capital and operational expenditure.
Figure 5.10 Expenditure
5645R/46059-003-784/SV Final Report
36
t f
Foo note: Totals may not add due to the rounding effects. Comparisons between years should be treated with caution because o the low
response rate.
Operating expenditure accounted for 87 per cent of total environmental spending by the Mining and Quarrying
sector in 2003. Spending in 2003 was significantly higher for in-house compared to external costs. In terms of
capital spending, 2003 was marked with a high relative level of end of pipe spending, accounting for 83 per
cent of the total CAPEX spend in this sector. Overall, however, capital spending was relatively low in
comparison with previous years.
Environmental Expenditure by Media
Environmental expenditure by media for the Mining and Quarrying sector is shown in Figure 5.11 below. The
expenditure priorities for 2003 are different from both that of 2002 and 2001. This sector spent about £30
million on dealing with solid waste, the majority of which is accounted for by external expenditure. Expenditure
on water and air were just under £20 million. In 2002, air protection measures were the largest spend area,
with nearly £60 million in expenditures. In 2001, soil and groundwater were the highest spend areas, with
June 2005
In-house External Tot R & D Total End of Pipe Integrated Total
<250 18 24 1 43 3 1 4 250+ 103 18 0 121 17 4 21Total 120 42 2 164 20 4 24
2002 Total 42 37 2 81 5 53 58 2001 Total 43 55 2 101 32 99 1302000 Total 78 165 37 280 93 121 214
OPEX (£M) CAPEX (£M)
2003

nearly £70 million in expenditure. The figures for 2003 indicate that there were other priorities for the year,
with over £115 million, mainly in-house expenditure, being spent on other areas.
Figure 5.11 Environmental Expenditure by Media
5645R/46059-003-784/SV Final Report
37
t f
Income and Savings
In 2003, income and savings for the Mining and Quarrying sector were approximately £7 million in 2003.
Income and savings for this sector are shown in the Figure 5.12 for the years 2000 to 2003. The data are
presented separately for companies with less than 250 employees and 250 plus employees.
Figure 5.12 Income and savings
Foo note: Totals may not add due to the rounding effects. Comparisons between years should be treated with caution because o the low
response rate.
Cost savings in the sector for 2003 were £4 million of which most are accounted for by companies with less
than 250 employees. As a proportion of the total capital expenditure, the cost savings are high for companies
with less than 250 employees. In line with previous years, most of the cost savings came from measures to
reduce waste and energy use. Approximately 80 per cent of income received from sale of by-products was by
companies with over 250 employees.
June 2005
0
20
40
60
80
100
120
Water Air Solid Soil/Groundwater
Noise Natureprotection
Other
Environmental Media
£M
End of PipeIntegratedExternalIn-House
By- products
Total
Raw material
Water use Energy use Waste Other Total
<250 0.70 0.04 0.79 2.24 0.00 3.77 0.44 4.22250+ 0.10 0.12 0.06 0.20 0.10 0.58 1.88 2.46Total 0.80 0.16 0.85 2.44 0.10 4.35 2.32 6.67
2002 Total 0.13 0.10 0.32 0.23 0.04 0.81 0.49 1.302001 Total - - - - - 0.79 10.37 11.162000 Total - - - - - 10.24 1.54 11.78
(£M) Cost savings
2003

The Mining and Quarrying sector has been under economic pressure in 2003, with a sharp fall in production in
mining and quarrying, mainly in respect of oil and gas extraction. It has been suggested that this fall was
primarily responsible for the overall contraction in manufacturing production figures in 2003 and this trend may
affect environmental expenditure levels that are not linked to legislative requirements in 2004.
5645R/46059-003-784/SV Final Report
38
June 2005
Nonetheless, the sector is responding to changes in waste management legislation and cost savings are being
realised. The sector is moving towards compliance with European laws and developments such as the Waste
Management Regulations of 2005 includes measures to extend existing waste management controls to non-
mineral mining and quarrying waste. Increased spending in the sector may also be seen in light of the UK
Climate Change Programme.

5.5.2 SIC 15 & 16: Food Products and Beverages, and Tobacco Products
The Food Products and Beverages, and Tobacco Products sector is one of the largest sectors in terms of
environmental protection expenditure in the 2003 survey and it is relatively water intensive.
Estimates of environmental protection expenditure, environmental expenditure by media and income and
savings are provided below for the Food Products and Beverages, and Tobacco Products sector. For this
sector, 250 companies participated in the survey giving a response rate for the sector of 19%, which is
equivalent to 16% of the total survey response.
Key Expenditure
The Food Products and Beverages, and Tobacco Products sector spent approximately £410 million in 2003 on
environmental protection measures, 12 per cent of the total UK industry spend for 2003. Environmental
expenditure for this sector is shown in Figure 5.13 for the years 2000 to 2003. The data are presented
separately for companies with less than 250 employees and 250 plus employees, as well as for capital and
operational expenditure.
Figure 5.13 Expenditure
5645R/46059-003-784/SV Final Report
39
tFoo note: Totals may not add due to the rounding effects. Comparisons between years should be treated with caution because of the low
response rate.
Operating expenditure accounted for nearly 80% of total environmental spending by the Food Products and
Beverages, and Tobacco Products sector in 2003. The spending in all years shown above was higher on
external than in-house expenditure.
The fact that integrated capital expenditure is greater than end of pipe may represent a more actual trend this
year unlike in 2002 when end-of-pipe expenditure was higher than integrated expenditure. It is of interest that
for the smaller companies, which may be less likely to be captured by the forthcoming Integrated Pollution
Prevention and Control (IPPC) requirements, end of pipe expenditure is greater than integrated expenditure.
This might suggest that the companies within the sector that are being caught by IPPC are preparing for likely
upgrades. We would expect to see this trend continuing as the IPPC licensing application period for the food
and beverages sector is June to August 2004 and January to March 2005.
June 2005
In-house External Tot R & D Total End of Pipe Integrated Total
<250 23 84 1 108 17 10 27 250+ 76 137 4 218 18 38 56 Total 99 221 5 326 35 48 83
2002 Total 149 273 7 429 40 26 66 2001 Total 110 320 3 432 60 102 161 2000 Total 77 242 9 329 137 31 168
OPEX (£M) CAPEX (£M)
2003

Environmental Expenditure by Media
Environmental expenditure by media for the Food Products and Beverages and Tobacco Products sector is
shown in Figure 5.14 below. This sector spent nearly £200 million on water protection measures and over
£100 million on dealing with solid waste in 2003, of which most is accounted for by external operating
expenditure. The pattern of expenditure by media in this sector is very consistent for 2000 to 2003 with water
and solid waste being the largest spending areas both years.
Figure 5.14 Environmental Spending by Media
5645R/46059-003-784/SV Final Report
40
t
Income and Savings
In 2003, income and savings for the Food Products and Beverages, and Tobacco Products sector were
approximately £48 million in total. Income and savings for this sector are shown in Figure 5.15 for the years
2000 to 2003. The data are presented separately for companies with less than 250 employees and 250 plus
employees.
Figure 5.15 Income and savings
Foo note: Totals may not add due to the rounding effects. Comparisons between years should be treated with caution because of the low
response rate.
Greatest cost savings are identified in energy use, which may be associated with the ever-increasing energy
costs and therefore focus in this area. Cost savings for the companies with plus 250 employees is
approximately half of the total capital expenditure for those companies. However, overall savings are
significantly less than for last year, possibly influenced by the change in raw material savings. A single
company that saved £500,000 heavily influenced the raw material savings in 2002.
June 2005
0
50
100
150
200
250
Water Air Solid Soil/Groundwater
Noise Natureprotection
Other
Environmental Media
£M
End of PipeIntegratedExternalIn-House
By- products
Total
Raw material
Water use Energy use Waste Other Total
<250 0.90 1.01 1.82 1.05 0.00 4.79 3.17 7.95250+ 5.77 3.29 11.18 1.89 2.74 24.86 15.05 39.90Total 6.67 4.30 13.00 2.93 2.74 29.64 18.21 47.85
2002 Total 26.87 7.79 9.05 21.93 1.26 66.89 77.16 144.052001 Total - - - - - 21.19 83.94 105.132000 Total - - - - - 20.14 22.42 42.57
2003
(£M) Cost savings

5.5.3 SIC 17, 18, and 19: Textiles, Clothing and Leather Products
Textiles, Clothing and Leather Products sector is a relatively small sector.
Estimates of environmental protection expenditure, environmental expenditure by media and income and
savings are provided below for the Textiles, Clothing and Leather Products sector. For this sector, 80
companies participated in the survey giving a response rate for the sector of 17%, which is equivalent to 5% of
the total survey response.
Key Expenditure
The Textiles, Clothing and Leather Products sector spent approximately £120 million in 2003 on environmental
protection measures, 3 per cent of the total UK industry spend for 2003. Environmental expenditure for this
sector is shown in Figure 5.16 for the years 2000 to 2003. The data are presented separately for capital and
operational expenditure. In a number of years, due to the low response rates, it has not been possible to
separately identify companies with less than 250 and plus 250 employees.
Figure 5.16 Expenditure
5645R/46059-003-784/SV Final Report
41
tFoo note: Totals may not add due to the rounding effects. Comparisons between years should be treated with caution because of the low
response rate.
Operating expenditure accounted for over 80% of total environmental spending by the Textiles, Clothing and
Leather Products sector in 2003. The external expenditure in 2003 was higher than in-house expenditure,
similar to previous years. Capital spending in 2003 was dominated by end-of-pipe expenditure.
Environmental Expenditure by Media
Environmental expenditure by media for the Textiles, Clothing and Leather Products sector is shown in Figure
5.17 below. This sector spent just over £50 million on water protection measures, of which most is accounted
for by external operating expenditure. Over £25 million was spent on dealing with solid waste. The pattern of
expenditure was similar in 2002, with highest spending areas being water and solid waste.
June 2005
In-house External Tot R & D Total End of Pipe Integrated Total
2003 Total 39 56 1 97 15 7 222002 Total 11 33 1 45 3 4 72001 Total 25 92 3 119 12 2 142000 Total 45 56 1 102 2 4 6
OPEX (£M) CAPEX (£M)

Figure 5.17 Environmental Spending by Media
5645R/46059-003-784/SV Final Report
42
Income and savings
In 2003 , income and savings for the Textiles, Clothing and Leather Products sector were approximately £6.9
million. Income and savings for this sector are shown in Figure 5.18 for the years 2000 to 2003. In a
number of years, due to the low response rates, it has not been possible to separately identify companies with
less than 250 and plus 250 employees.
Figure 5.18 Income and savings
Cost savings By- products
Total (£M)
Raw material
Water use Energy use Waste Other Total
2003Total 0.15 0.73 3.62 2.27 0.00 6.76 0.14 6.90 2002Total 0.84 0.97 0.66 0.17 0.00 2.64 0.03 2.68 2001Total - - - - - 1.83 0.57 2.40 2000Total - - - - - 2.08 0.62 2.69
tFoo note: Totals may not add due to the rounding effects. Comparisons between years should be treated with caution because of the low
response rate.
Cost savings in 2003 for the Textiles, Clothing and Leather Products sector were £6.8 million. The bulk of the
savings resulted from savings on waste disposal and the improved energy use.
June 2005
0
10
20
30
40
50
60
Water Air Solid Soil/Groundwater
Noise Natureprotection
Other
Environmental Media
£M
End of PipeIntegratedExternalIn-House

5.5.4 SIC 20: Wood and Wood Products
This is a relatively small sector with limited forestry operations in the UK harvesting trees to produce wood/
timber for construction or conversion into pulp and paper products. The industry tends to make efficient use of
its natural resource (both from an environmental as well as economic perspective) with a range of products
depending on raw material quality.
Estimates of environmental protection expenditure, environmental expenditure by media and income and
savings are provided below for the Wood and Wood Products sector. For this sector, 34 companies
participated in the survey giving a response rate for the sector of 21%, which is equivalent to 2% of the total
survey response.
Key Expenditure
The Wood and Wood Products sector spent approximately £50 million in 2003 on environmental protection
measures, 2 per cent of the total UK industry spend for 2003. Environmental expenditure for this sector is
shown in Figure 5.19 for the years 2000 to 2003. The data are presented separately for companies with less
than 250 employees and 250 plus employees, as well as for capital and operational expenditure.
Figure 5.19 Expenditure
5645R/46059-003-784/SV Final Report
43
tFoo note: Totals may not add due to the rounding effects. Comparisons between years should be treated with caution because of the low
response rate.
Operating expenditure accounted for over 80% of total environmental spending by the Wood and Wood
Products sector in 2003. The external spending in 2003 was higher than in-house costs, similar to 2002.
Capital spending in 2003 was evenly split between end-of-pipe and integrated expenditure, similar to previous
years.
Environmental Expenditure by Media
Environmental expenditure by media for the Wood and Wood Products sector is shown in Figure 5.20 below.
This sector spent over £30 million on dealing with solid waste, of which most is accounted for by external and
in-house operating expenditure. Approximately £14 million was spent on air and water protection measures in
total. The pattern of expenditure was fairly similar in 2002, where the highest spending area was also solid
waste.
June 2005
In-house External Tot R & D Total End of Pipe Integrated Total
<250 4 17 0 21 1 3 3250+ 10 12 1 23 4 2 6Total 15 28 1 44 5 5 10
2002 Total 20 29 1 49 2 2 42001 Total 25 25 1 50 4 4 82000 Total 18 19 2 39 3 15 18
2003
OPEX (£M) CAPEX (£M)

Figure 5.20 Environmental Spending by Media
5645R/46059-003-784/SV Final Report
44
t f
Income and Savings
In 2003, income and savings for the Wood and Wood Products sector were approximately £50 million. Income
and savings for this sector are shown in Figure 5.21 for the years 2000 to 2003. The data are presented
separately for companies with less than 250 employees and 250 plus employees.
Figure 5.21 Income and savings
Foo note: Totals may not add due to the rounding effects. Comparisons between years should be treated with caution because o the low
response rate.
Cost savings in 2003 were relatively high for the Wood and Wood Products sector, which reported a total of
over £45 million. The bulk of the savings resulted from measures to improve the use or substitution of raw
materials. Income from by-products sales were also high in 2003, approximately £4 million. Thinnings are the
main by-product in this sector, which is sold to the pulp and paper industry.
June 2005
0
5
10
15
20
25
30
35
Water Air Solid Soil/Groundwater
Noise Natureprotection
Other
Environmental Media
£MEnd of PipeIntegratedExternalIn-House
By- products
Total
Raw material
Water use Energy use Waste Other Total
<250 0.00 0.01 0.50 0.34 0.82 1.66 3.06 4.72250+ 33.45 0.07 3.82 2.20 3.78 43.31 0.93 44.24Total 33.45 0.08 4.32 2.54 4.59 44.98 3.99 48.96
2002 Total 36.17 0.11 0.35 0.83 9.72 47.17 2.01 49.182001 Total - - - - - 2.00 0.76 2.762000 Total - - - - - 12.63 8.77 21.40
2003
(£M) Cost savings
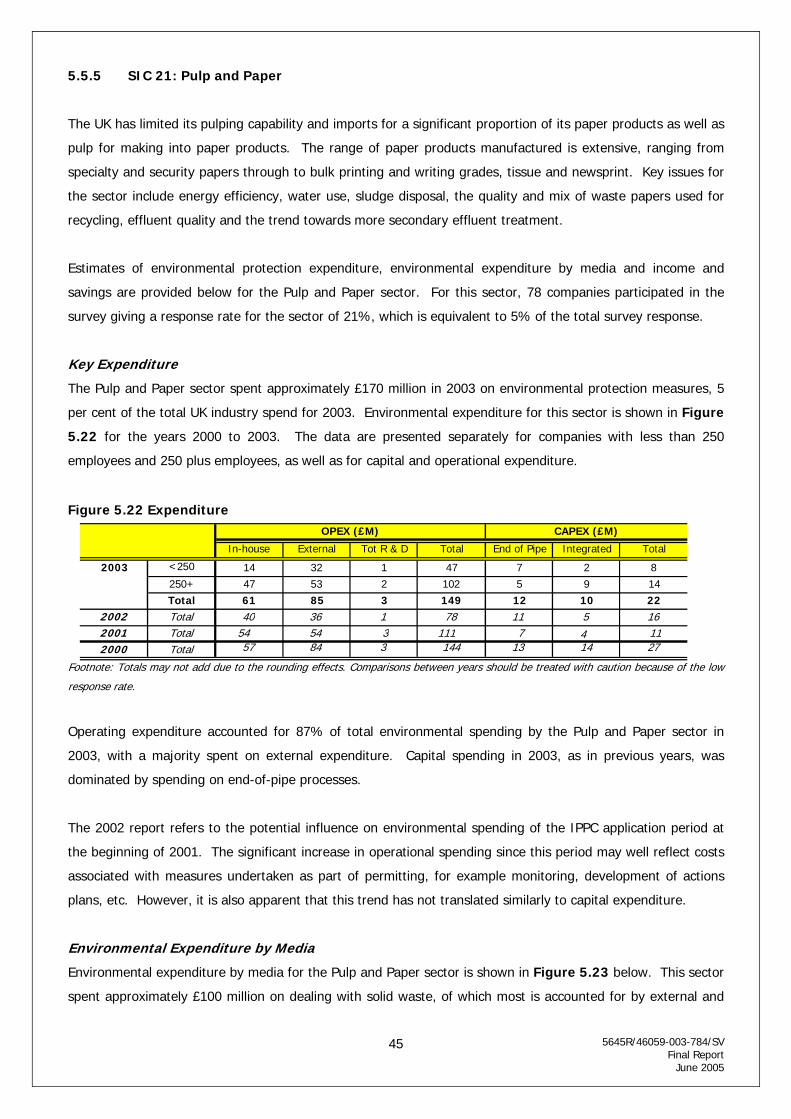
5.5.5 SIC 21: Pulp and Paper
The UK has limited its pulping capability and imports for a significant proportion of its paper products as well as
pulp for making into paper products. The range of paper products manufactured is extensive, ranging from
specialty and security papers through to bulk printing and writing grades, tissue and newsprint. Key issues for
the sector include energy efficiency, water use, sludge disposal, the quality and mix of waste papers used for
recycling, effluent quality and the trend towards more secondary effluent treatment.
Estimates of environmental protection expenditure, environmental expenditure by media and income and
savings are provided below for the Pulp and Paper sector. For this sector, 78 companies participated in the
survey giving a response rate for the sector of 21%, which is equivalent to 5% of the total survey response.
Key Expenditure
The Pulp and Paper sector spent approximately £170 million in 2003 on environmental protection measures, 5
per cent of the total UK industry spend for 2003. Environmental expenditure for this sector is shown in Figure
5.22 for the years 2000 to 2003. The data are presented separately for companies with less than 250
employees and 250 plus employees, as well as for capital and operational expenditure.
Figure 5.22 Expenditure
5645R/46059-003-784/SV Final Report
45
t fFoo note: Totals may not add due to the rounding effects. Comparisons between years should be treated with caution because o the low
response rate.
Operating expenditure accounted for 87% of total environmental spending by the Pulp and Paper sector in
2003, with a majority spent on external expenditure. Capital spending in 2003, as in previous years, was
dominated by spending on end-of-pipe processes.
The 2002 report refers to the potential influence on environmental spending of the IPPC application period at
the beginning of 2001. The significant increase in operational spending since this period may well reflect costs
associated with measures undertaken as part of permitting, for example monitoring, development of actions
plans, etc. However, it is also apparent that this trend has not translated similarly to capital expenditure.
Environmental Expenditure by Media
Environmental expenditure by media for the Pulp and Paper sector is shown in Figure 5.23 below. This sector
spent approximately £100 million on dealing with solid waste, of which most is accounted for by external and
June 2005
In-house External Tot R & D Total End of Pipe Integrated Total
<250 14 32 1 47 7 2 8250+ 47 53 2 102 5 9 14Total 61 85 3 149 12 10 22
2002 Total 40 36 1 78 11 5 162001 Total 54 54 3 111 7 4 112000 Total 57 84 3 144 13 14 27
2003
OPEX (£M) CAPEX (£M)
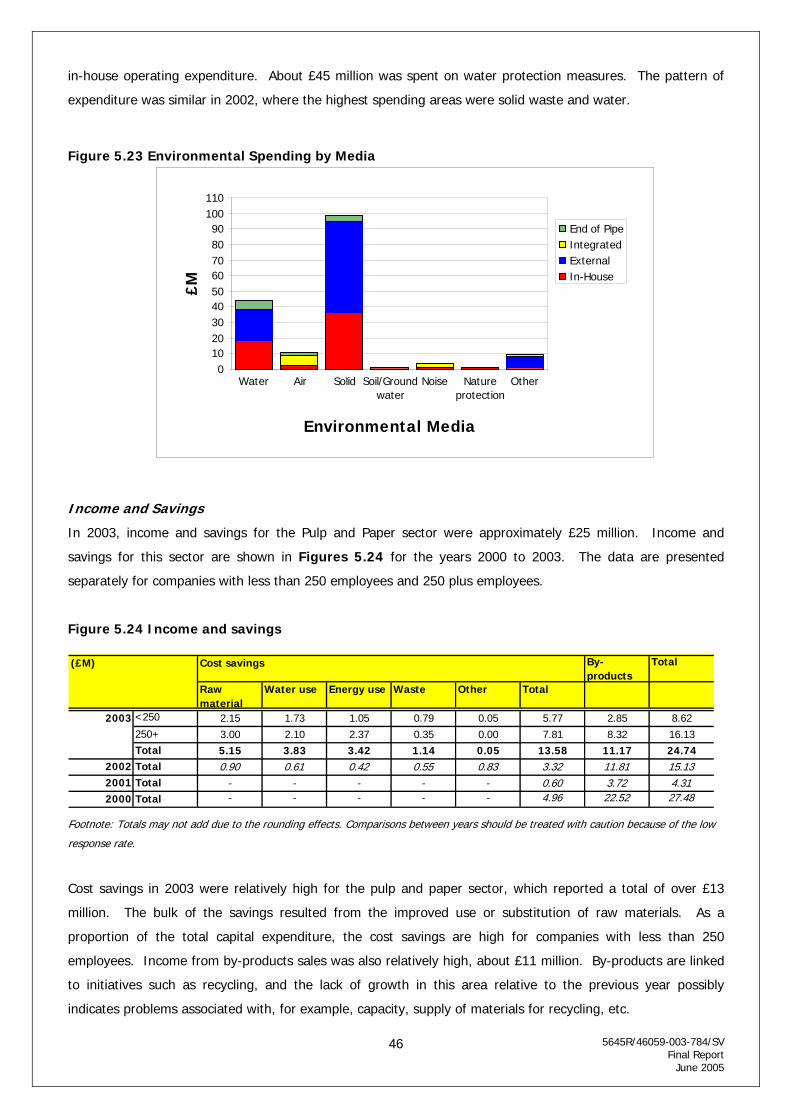
in-house operating expenditure. About £45 million was spent on water protection measures. The pattern of
expenditure was similar in 2002, where the highest spending areas were solid waste and water.
Figure 5.23 Environmental Spending by Media
5645R/46059-003-784/SV Final Report
46
t f
Income and Savings
In 2003, income and savings for the Pulp and Paper sector were approximately £25 million. Income and
savings for this sector are shown in Figures 5.24 for the years 2000 to 2003. The data are presented
separately for companies with less than 250 employees and 250 plus employees.
Figure 5.24 Income and savings
Foo note: Totals may not add due to the rounding effects. Comparisons between years should be treated with caution because o the low
response rate.
Cost savings in 2003 were relatively high for the pulp and paper sector, which reported a total of over £13
million. The bulk of the savings resulted from the improved use or substitution of raw materials. As a
proportion of the total capital expenditure, the cost savings are high for companies with less than 250
employees. Income from by-products sales was also relatively high, about £11 million. By-products are linked
to initiatives such as recycling, and the lack of growth in this area relative to the previous year possibly
indicates problems associated with, for example, capacity, supply of materials for recycling, etc.
June 2005
0102030405060708090
100110
Water Air Solid Soil/Groundwater
Noise Natureprotection
Other
Environmental Media
£M
End of PipeIntegratedExternalIn-House
By- products
Total
Raw material
Water use Energy use Waste Other Total
<250 2.15 1.73 1.05 0.79 0.05 5.77 2.85 8.62250+ 3.00 2.10 2.37 0.35 0.00 7.81 8.32 16.13Total 5.15 3.83 3.42 1.14 0.05 13.58 11.17 24.74
2002 Total 0.90 0.61 0.42 0.55 0.83 3.32 11.81 15.132001 Total - - - - - 0.60 3.72 4.312000 Total - - - - - 4.96 22.52 27.48
(£M) Cost savings
2003
5.5.6 SIC 22: Publishing and Printing
The Publishing and Printing sector is relatively small in the UK. Printing operations range from large publishing
houses to relatively small family owned businesses that have been in operation for several generations. Over
the years there has been a trend away from solvent based inks to water based inks as well as a greater use of
electronic technology to set the type face and create the lay out for printed materials. Issues in this sector
include the disposal of used plates which are used to set the type face, treatment and disposal of used inks as
well as atmospheric releases linked to solvent based inks.
Estimates of environmental protection expenditure, environmental expenditure by media and income and
savings are provided below for the Publishing and Printing sector. For this sector, 100 companies participated
in the survey giving a response rate for the sector of 18 %, which is equivalent to 6 % of the total survey
response.
Key Expenditure
The Publishing and Printing sector spent over £60 million in 2003 on environmental protection measures, 2 per
cent of the total UK industry spend for 2003. Environmental expenditure for this sector is shown in Figure
5.25 for the years 2000 to 2003. The data are presented separately for companies with less than 250
employees and 250 plus employees, as well as for capital and operational expenditure.
Figure 5.25 Expenditure
5645R/46059-003-784/SV Final Report
47
t f
Foo note: Totals may not add due to the rounding effects. Comparisons between years should be treated with caution because o the low
response rate.
Operating expenditure accounted for over 90% of total environmental spending by the Publishing and Printing
sector in 2003. The operational spending in 2003 was dominated by external expenditure, similar to previous
years. Capital spending in 2003 was fairly evenly split between end of pipe and integrated processes.
Environmental Expenditure by Media
Environmental expenditure by media for the Publishing and Printing sector is shown in Figure 5.26 below.
This sector spent nearly £30 million on dealing with solid waste, of which most is accounted for by external and
in-house operating expenditure. Over £20 million was spent on water protection measures. The pattern of
expenditure was fairly similar to previous years with highest spending areas being solid waste and water.
June 2005
In-house External Tot R & D Total End of Pipe Integrated Total
<250 18 17 0 35 0 1 1250+ 8 15 0 24 2 1 3Total 26 33 0 59 2 2 5
2002 Total 12 28 1 40 5 0 52001 Total 20 32 1 53 2 2 4 2000 Total 76 27 0.5 103 19 33 52
2003
OPEX (£M) CAPEX (£M)
Figure 5.26 Environmental Spending by Media
5645R/46059-003-784/SV Final Report
48
t f
Income and Savings
In 2003, income and savings for the Publishing and Printing sector were approximately £11 million. Income
and savings are shown for the years 2000 to 2003. The data are presented separately for companies with less
than 250 employees and 250 plus employees. (Figure 5.27).
Figure 5.27 Income and savings
Foo note: Totals may not add due to the rounding effects. Comparisons between years should be treated with caution because o the low
response rate.
Cost savings in 2003 for the Publishing and Printing sector were over £1 million. The bulk of the savings
resulted from reduced energy use. About two thirds of the income from sale of by-products was by companies
with less than 250 employees.
The trend of segregating trimmings increases the value of by-products because the consistency of the paper
type can be sold back at a higher price. This includes, for example, unsold greeting cards. Increasing trends
towards more recycling manufacture means that the trimmings market will increase in volume, although the
value can fluctuate due to the volatility of the recycled paper market.
June 2005
0
5
10
15
20
25
30
Water Air Solid Soil/Groundwater
Noise Natureprotection
Other
Environmental Media
£MEnd of PipeIntegratedExternalIn-House
By- products
Total
Raw material
Water use Energy use Waste Other Total
<250 0.06 0.01 0.02 0.03 0.00 0.12 6.54 6.65250+ 0.00 0.03 0.73 0.22 0.22 1.20 3.70 4.89Total 0.06 0.04 0.74 0.25 0.23 1.32 10.23 11.55
2002 Total 0.36 0.00 0.08 0.65 0.00 1.09 35.86 36.952001 Total - - - - - 0.24 10.40 10.652000 Total - - - - - 3.10 10.98 14.08
(£M) Cost savings
2003

5.5.7 SIC 23: Coke, Petroleum and Nuclear Fuel
Coke, Petroleum and Nuclear Fuel sector is relatively small in the UK.
Estimates of environmental protection expenditure, environmental expenditure by media and income and
savings are provided below for the Coke, Petroleum and Nuclear fuel sector. For this sector, 15 companies
participated in the survey giving a response rate for the sector of 24%, which is equivalent to 1% of the total
survey response.
Key Expenditure
The Coke, Petroleum & Nuclear Fuel sector spent approximately £90 million in 2003 on environmental
protection measures, 3 per cent of the total UK industry spend for 2003. Environmental expenditure for this
sector is shown in Figure 5.28 for the years 2000 to 2003. The data are presented separately for companies
with less than 250 employees and 250 plus employees, as well as for capital and operational expenditure.
Figure 5.28 Expenditure
5645R/46059-003-784/SV Final Report
49
t fFoo note: Totals may not add due to the rounding effects. Comparisons between years should be treated with caution because o the low
response rate.
Operating expenditure accounted for about 60% of total environmental spending by the coke, petroleum and
nuclear fuel sector in 2003. The spending on external measures was higher in 2003. Capital spending in 2003
was dominated by spending on end-of-pipe measures.
Environmental Expenditure by Media
Environmental expenditure by media for the Coke, Petroleum and Nuclear Fuel sector is shown in Figure 5.29
below. This sector spent about £30 million on water protection measures, of which most is accounted for by
end-of-pipe capital expenditure. Approximately £20 million was spent on both dealing with solid waste and soil
and groundwater protection. The pattern of expenditure differs from the pattern in 2002 when the air was the
highest spending area.
June 2005
In-house External Tot R & D Total End of Pipe Integrated Total
<250 10 6 0 17 0 0 1250+ 9 24 0 34 36 0 36Total 20 31 0 51 37 0 37
2002 Total 29 22 10 61 5 20 252001 Total 35 32 8 75 9 9 182000 Total 17 12 2 30 5 10 14
2003
OPEX (£M) CAPEX (£M)
Figure 5.29 Environmental Spending by Media
5645R/46059-003-784/SV Final Report
50
t f
Income and Savings
In 2003, income and savings for the Coke, Petroleum and Nuclear Fuel sector were approximately £1 million.
Income and savings for this sector are shown in Figure 5.30 for the years 2000 to 2003. The data are
presented separately for companies with less than 250 employees and 250 plus employees.
Figure 5.30 Income and savings
Foo note: Totals may not add due to the rounding effects. Comparisons between years should be treated with caution because o the low
response rate.
Cost savings in 2003 for the Coke, Petroleum and Nuclear Fuel sector were approximately £1 million. The bulk
of the savings resulted from waste disposal. Cost savings for the companies with less than 250 employees are
approximately the same as the total capital expenditure for those companies. No income from the sale by-
products was reported for this sector.
June 2005
0
5
10
15
20
25
30
35
Water Air Solid Soil/Groundwater
Noise Natureprotection
Other
Environmental Media
£M
End of PipeIntegratedExternalIn-House
By- products
Total
Raw material
Water use Energy use Waste Other Total
<2500.02 0.05 0.29 0.44 0.23 1.02 0.00 1.02
250+ 0.00 0.00 0.00 0.00 0.00 0.00 0.00 0.00Total 0.02 0.05 0.29 0.44 0.23 1.02 0.00 1.02
2002 Total 0.02 0.02 0.17 0.06 0.02 0.30 0.36 0.662001 Total - - - - - 1.98 0.88 2.85
2000 Total - - - - - 7.63 5.43 13.06
2003
(£M) Cost savings
5.5.8 SIC 24: Chemicals (Basic, Pharmaceuticals and Other)
This sector comprises of three sub-sectors (Basic, Pharmaceuticals and Other), which together make one of
the largest spending sectors. Basic chemicals are characterized by high volume and low margin bulk
chemicals. Pharmaceuticals sector provides high margin products manufactured in stringent clean conditions,
supported by substantial research and development. Other includes fine and specialty chemicals, which
operate in batch cycles with regular cleaning between product changes. Generally the sector in the UK is
struggling to remain competitive especially with competitors based in China for example and to a lesser extent
Eastern Europe.
Estimates of environmental protection expenditure, environmental expenditure by media and income and
savings are provided below for the Chemicals and Chemical Products sector. For this sector, 227 companies
participated in the survey giving a response rate for the sector of 23%, which is equivalent to 14% of the total
survey response.
Key Expenditure
The Chemicals and Chemical Products sector spent approximately £620 million in 2003 on environmental
protection measures, 18 per cent of the total UK industry spend for 2003. Environmental expenditure for this
sector is shown in Figure 5.31 for the years 2000 to 2003. The data are presented separately for companies
with less than 250 employees and 250 plus employees, as well as for capital and operational expenditure.
Figure 5.31 Expenditure
5645R/46059-003-784/SV Final Report
51
t fFoo note: Totals may not add due to the rounding effects. Comparisons between years should be treated with caution because o the low
response rate.
Operating expenditure accounted for 85% of the total environmental spending by the chemicals sector in 2003.
Capital spending in 2003, as in previous years, was dominated by spending on end-of-pipe processes.
The reduction in integrated expenditure may be linked to organisations not upgrading / investing in their
manufacturing process until they understood what was required as part of BAT (Best Available Technology)
within their PPC permit, the first tranche of PPC permit applications were made June – August 2003. End of
pipe expenditure is likely to be linked to ensuring ongoing compliance with required emission levels.
Other potential influences for environmental spending by the sector in 2003 are the Solvent Directive, the IPPC
permitting requirements and COMAH updates / requirements. In addition the 2004 expenditure is likely to be
June 2005
In-house External Tot R & D Total End of Pipe Integrated Total
<250 78 78 5 161 11 8 20250+ 157 175 31 364 57 17 73Total 235 254 36 525 68 25 93
2002 Total 110 178 17 305 64 42 1062001 Total 179 295 34 507 112 94 2062000 Total 197 206 22 426 92 109 202
2003
OPEX (£M) CAPEX (£M)

affected by the impact of the ban on hazardous liquids to landfill and the end of landfill co-disposal of
hazardous and non hazardous wastes (July 2004) as well as new Hazardous Waste Regulations due July 2005,
which will increase the amount of hazardous waste generated.
Environmental Expenditure by Media
Environmental expenditure by media for the Chemicals sector is shown in Figure 5.32 below. This sector
spent over £250 million on water protection measures, of which most is accounted for by external and in-house
operating expenditure. Approximately £150 million was spent on dealing with solid waste.
Figure 5.32 Environmental Spending by Media
Effluent treatment plant equipment and discharge costs may have increased as a result of the Urban Waste
Water Treatment Directive and also the need for more monitoring, testing and reporting to satisfy regulator
requirements. Solid may have increased as a result of an increase in waste disposal prices, as waste
management becomes more of a logistics business, with waste being transported around the country and the
impact of the ban on hazardous liquids to landfill and the end of landfill co-disposal of hazardous and non
hazardous wastes (July 2004). Air may have increased due to the need for more monitoring, testing and
reporting to satisfy regulator requirements.
5645R/46059-003-784/SV Final Report
52
Income and Savings
In 2003, income and savings for the Chemicals sector were approximately £80 million. Income and savings for
this sector are shown in Figure 5.33 for the years 2000 to 2003. The data are presented separately for
companies with less than 250 employees and 250 plus employees.
June 2005
0
50
100
150
200
250
300
Water Air Solid Soil/Groundwater
Noise Natureprotection
Other
Environmental Media
£M
End of PipeIntegratedExternalIn-House

Figure 5.33 Income and savings
5645R/46059-003-784/SV Final Report
53
t fFoo note: Totals may not add due to the rounding effects. Comparisons between years should be treated with caution because o the low
response rate.
Cost savings in 2003 for the Chemicals sector were approximately £56 million. The bulk of the savings resulted
from improved use of or substitution of raw materials. Income from the sale of by-products was dominated by
companies with less than 250 employees. As a proportion of the total capital expenditure the cost savings are
high for both companies with less than and plus 250 employees.
Overall income and savings has decreased from 2002. Energy savings have increased, which may be linked to
any climate change levy agreements in place. Waste savings have increased which may possibly be due to
waste reuse / recycling and better segregation, less cross contamination, better understanding and
characterisation of the composition of wastes generated, for example less special waste. Water savings may be
attributed to increased process efficiency, recycling / reuse of cooling water and process wastewater.
Income and savings are likely to increase in particular with regards to waste, water, energy and raw materials
in the future due to sites having new PPC permits conditions in place.
June 2005
By- products
Total
Raw material
Water use Energy use Waste Other Total
<250 5.54 2.14 5.02 2.21 0.68 15.60 26.21 41.80250+ 23.21 0.93 9.28 6.53 0.00 39.94 0.21 40.15Total 28.75 3.07 14.29 8.75 0.68 55.54 26.41 81.95
2002 Total 54.78 1.32 7.16 6.79 3.88 73.93 14.74 88.662001 Total - - - - - 6.76 26.39 33.162000 Total - - - - - 19.45 14.48 33.93
(£M) Cost savings
2003
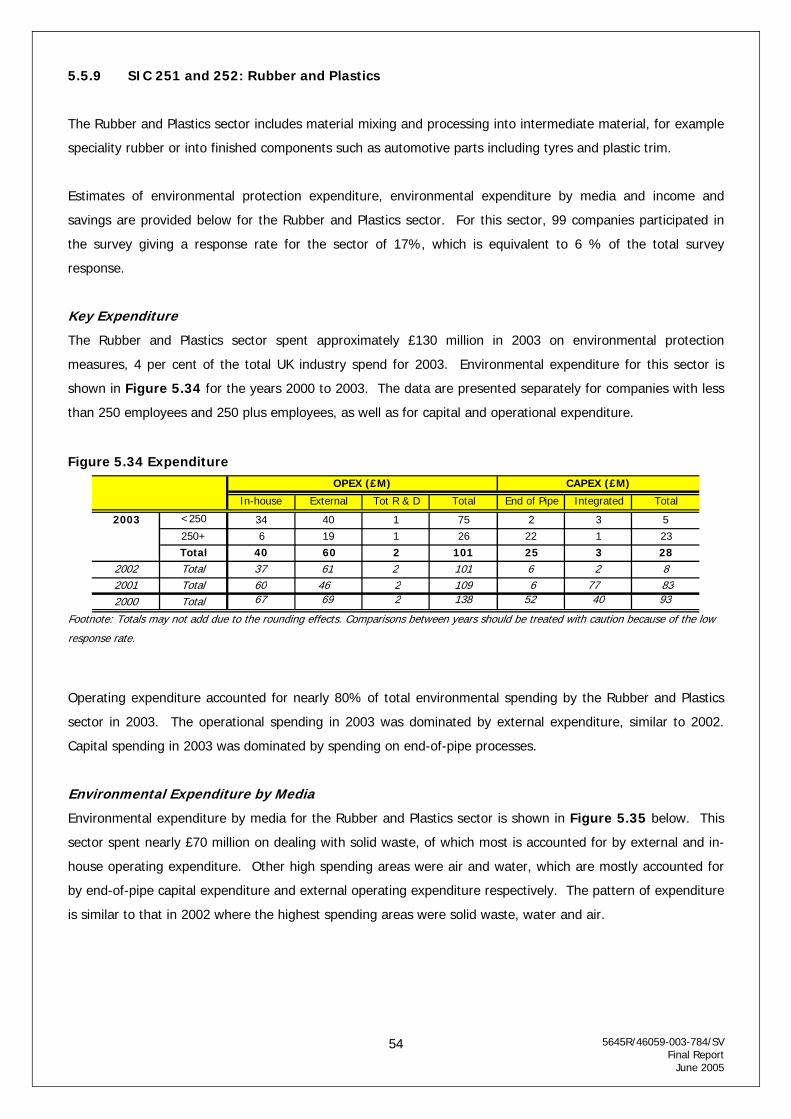
5.5.9 SIC 251 and 252: Rubber and Plastics
The Rubber and Plastics sector includes material mixing and processing into intermediate material, for example
speciality rubber or into finished components such as automotive parts including tyres and plastic trim.
Estimates of environmental protection expenditure, environmental expenditure by media and income and
savings are provided below for the Rubber and Plastics sector. For this sector, 99 companies participated in
the survey giving a response rate for the sector of 17%, which is equivalent to 6 % of the total survey
response.
Key Expenditure
The Rubber and Plastics sector spent approximately £130 million in 2003 on environmental protection
measures, 4 per cent of the total UK industry spend for 2003. Environmental expenditure for this sector is
shown in Figure 5.34 for the years 2000 to 2003. The data are presented separately for companies with less
than 250 employees and 250 plus employees, as well as for capital and operational expenditure.
Figure 5.34 Expenditure
5645R/46059-003-784/SV Final Report
54
t f
Foo note: Totals may not add due to the rounding effects. Comparisons between years should be treated with caution because o the low
response rate.
Operating expenditure accounted for nearly 80% of total environmental spending by the Rubber and Plastics
sector in 2003. The operational spending in 2003 was dominated by external expenditure, similar to 2002.
Capital spending in 2003 was dominated by spending on end-of-pipe processes.
Environmental Expenditure by Media
Environmental expenditure by media for the Rubber and Plastics sector is shown in Figure 5.35 below. This
sector spent nearly £70 million on dealing with solid waste, of which most is accounted for by external and in-
house operating expenditure. Other high spending areas were air and water, which are mostly accounted for
by end-of-pipe capital expenditure and external operating expenditure respectively. The pattern of expenditure
is similar to that in 2002 where the highest spending areas were solid waste, water and air.
June 2005
In-house External Tot R & D Total End of Pipe Integrated Total
<250 34 40 1 75 2 3 5250+ 6 19 1 26 22 1 23Total 40 60 2 101 25 3 28
2002 Total 37 61 2 101 6 2 82001 Total 60 46 2 109 6 77 832000 Total 67 69 2 138 52 40 93
2003
OPEX (£M) CAPEX (£M)
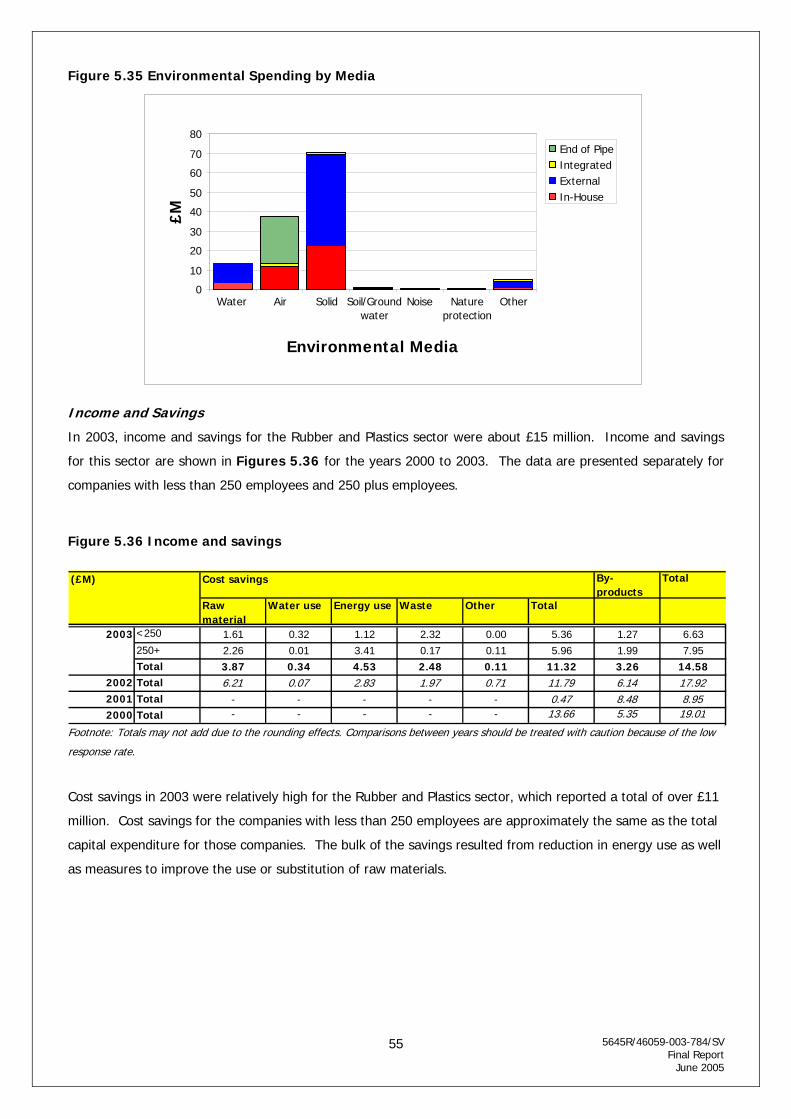
Figure 5.35 Environmental Spending by Media
5645R/46059-003-784/SV Final Report
55
t f
Income and Savings
In 2003, income and savings for the Rubber and Plastics sector were about £15 million. Income and savings
for this sector are shown in Figures 5.36 for the years 2000 to 2003. The data are presented separately for
companies with less than 250 employees and 250 plus employees.
Figure 5.36 Income and savings
Foo note: Totals may not add due to the rounding effects. Comparisons between years should be treated with caution because o the low
response rate.
Cost savings in 2003 were relatively high for the Rubber and Plastics sector, which reported a total of over £11
million. Cost savings for the companies with less than 250 employees are approximately the same as the total
capital expenditure for those companies. The bulk of the savings resulted from reduction in energy use as well
as measures to improve the use or substitution of raw materials.
June 2005
0
10
20
30
40
50
60
70
80
Water Air Solid Soil/Groundwater
Noise Natureprotection
Other
Environmental Media
£M
End of PipeIntegratedExternalIn-House
By- products
Total
Raw material
Water use Energy use Waste Other Total
<250 1.61 0.32 1.12 2.32 0.00 5.36 1.27 6.63250+ 2.26 0.01 3.41 0.17 0.11 5.96 1.99 7.95Total 3.87 0.34 4.53 2.48 0.11 11.32 3.26 14.58
2002 Total 6.21 0.07 2.83 1.97 0.71 11.79 6.14 17.922001 Total - - - - - 0.47 8.48 8.952000 Total - - - - - 13.66 5.35 19.01
(£M) Cost savings
2003
5.5.10 SIC 26: Other Non-Metallic Minerals
This sector is characterized by large furnaces requiring significant air pollution control, which in turn can
generate liquid and solid waste.
Estimates of environmental protection expenditure, environmental expenditure by media and income and
savings are provided below for the Other Non-Metallic Minerals sector. For this sector, 64 companies
participated in the survey giving a response rate for the sector of 21 %, which is equivalent to 4% of the total
survey response.
Key Expenditure
The Other Non-Metallic Minerals sector spent approximately £125 million in 2003 on environmental protection
measures, 4 per cent of the total UK industry spend for 2003. Environmental expenditure for this sector is
shown in Figure 5.37 for the years 2000 to 2003. The data are presented separately for companies with less
than 250 employees and 250 plus employees, as well as for capital and operational expenditure.
Figure 5.37 Expenditure
5645R/46059-003-784/SV Final Report
56
t fFoo note: Totals may not add due to the rounding effects. Comparisons between years should be treated with caution because o the low
response rate.
Operating expenditure accounted for approximately 70% of total environmental spending by the Other Non-
Metallic Minerals sector, which is similar to the proportions reported in 2001 and 2002. In-house and external
spending was evenly split for 2003, similar to the results from 2002. A shift towards end-of-pipe solutions
dominated capital expenditure in both 2002 and 2003.
Environmental Expenditure by Media
Environmental expenditure by media for the Other Non-Metallic Minerals sector is shown in Figure 5.38
below. This sector spent over £35 million on dealing with solid waste, with just over £30 million being spent on
air protection measures. Similarly, solid waste was for the highest expenditure by media for the industry in
2002. In 2001, the highest spending was towards air.
June 2005
In-house External Tot R & D Total End of Pipe Integrated Total
<250 21 21 4 46 7 3 9250+ 21 22 1 45 18 6 24Total 43 43 5 91 24 9 33
2002 Total 39 39 2 80 34 1 352001 Total 20 32 1 53 12 14 252000 Total 49 48 5 101 36 21 57
2003
OPEX (£M) CAPEX (£M)

Figure 5.38 Environmental Spending by Media
5645R/46059-003-784/SV Final Report
57
t f
Income and Savings
In 2003, income and savings for the other non-metallic minerals sector were approximately £35 million.
Income and savings for this sector are shown in Figure 5.39 for the years 2000 to 2003. The data are
presented separately for companies with less than 250 employees and 250 plus employees.
Figure 5.39 Income and savings
Foo note: Totals may not add due to the rounding effects. Comparisons between years should be treated with caution because o the low
response rate.
Cost savings of £23 million were relatively high for the other non-metallic metals sector with the bulk of savings
resulting from the substitution of raw materials. As a proportion of the total capital expenditure, the cost
savings are high for both companies with less than and plus 250 employees. Income from by-product was also
relatively high (£11 million), which was dominated by companies with less than 250 employees.
June 2005
0
5
10
15
20
25
30
35
40
Water Air Solid Soil/Groundwater
Noise Natureprotection
Other
Environmental Media
£MEnd of PipeIntegratedExternalIn-House
By- products
Total
Raw material
Water use Energy use Waste Other Total
<250 3.56 0.07 0.55 0.35 0.00 4.53 11.35 15.88250+ 10.59 0.18 6.61 1.39 0.00 18.77 0.04 18.81Total 14.15 0.25 7.16 1.75 0.00 23.31 11.38 34.69
2002 Total 2.16 0.23 4.13 1.08 0.00 7.59 0.41 8.012001 Total - - - - - 1.50 1.82 3.322000 Total - - - - - 10.50 1.02 11.51
2003
(£M) Cost savings
5.5.11 SIC 27: Basic Metals
Several industries make up the Basic Metals sector, including basic manufacture and first processing (e.g. steel
tube, strip or wire) of iron and steel, aluminium, copper lead zinc and tin, as well as foundries. The industry
supplies materials to other sectors such as motor vehicles, machinery and metal products and faces low cost
competition from overseas.
Estimates of environmental protection expenditure, environmental expenditure by media and income and
savings are provided below for the Basic Metals sector. For this sector, 67 companies participated in the
survey giving a response rate for the sector of 19%, which is equivalent to 4% of the total survey response.
Key Expenditure
The Basic Metals sector spent approximately £140 million in 2003 on environmental protection measures, 4 per
cent of the total UK industry spend for 2003. Environmental expenditure for this sector is shown in Figure
5.40 for the years 2000 to 2003. The data are presented separately for companies with less than 250
employees and 250 plus employees, as well as for capital and operational expenditure.
Figure 5.40 Expenditure
5645R/46059-003-784/SV Final Report
58
t f
Foo note: Totals may not add due to the rounding effects. Comparisons between years should be treated with caution because o the low
response rate.
Operating expenditure accounted for about 90% of the total environmental spending by the Basic Metals
sector, which is similar to the proportions reported in 2001 and 2002. In-house spending is higher than
external, which follows the spending pattern of 2002. Capital spending was dominated by integrated solutions,
which differs to 2002 where end-of-pipe solutions dominated spending.
The EU Emissions Trading scheme and the Large Combustion Plant directive will have further impacts on larger
companies in the iron and steel and aluminium sectors in 2004. Changes in hazardous waste classification, and
implementation of the Landfill Directive could have a substantial impact on solid waste costs in 2004/5.
Environmental Expenditure by Media
Environmental expenditure by media for the Basic Metals sector is shown in Figure 5.41 below. This sector
spent over £40 million on other and approximately £30 million on dealing with solid waste (mainly external
costs), air (mainly in-house) and water (split evenly between in-house and external). The pattern of
expenditure was fairly similar to 2002 except that expenditure on ‘other’ was not as high.
June 2005
In-house External Tot R & D Total End of Pipe Integrated Total
<250 46 21 2 70 1 1 2250+ 32 23 2 58 4 6 10Total 79 45 4 127 5 7 12
2002 Total 44 41 0 86 11 4 152001 Total 252 49 5 305 12 35 472000 Total 60 49 27 136 15 40 54
2003
OPEX (£M) CAPEX (£M)

Basic Metals sector has relatively high waste disposal costs (one of the highest spend per gross value added,
when compared to other sectors) and rising waste costs would be expected to impact particularly heavily on
this sector.
Figure 5.41 Environmental Spending by Media
5645R/46059-003-784/SV Final Report
59
t f
Income and Savings
In 2003, income and savings for the Basic Metals sector were approximately £17 million. Income and savings
for this sector are shown in Figure 5.42 for the years 2000 to 2003. The data are presented separately for
companies with less than 250 employees and 250 plus employees.
Figure 5.42 Income and savings
Foo note: Totals may not add due to the rounding effects. Comparisons between years should be treated with caution because o the low
response rate.
Cost savings in 2003 were approximately £6 million. The bulk of the savings resulted from improved energy
use. Income from by-products were approximately £12 million and were dominated by smaller companies.
June 2005
05
1015202530354045
Water Air Solid Soil/Groundwater
Noise Natureprotection
Other
Environmental Media
£M
End of PipeIntegratedExternalIn-House
By- products
Total
Raw material
Water use Energy use Waste Other Total
<250 0.40 0.01 2.16 0.48 0.08 3.12 11.29 14.42250+ 0.04 0.07 1.86 0.74 0.00 2.70 0.35 3.05Total 0.43 0.08 4.01 1.22 0.08 5.82 11.65 17.47
2002 Total 7.17 1.06 2.73 1.37 0.17 12.50 1.56 14.062001 Total - - - - - 3.14 9.19 12.332000 Total - - - - - 10.47 28.59 39.07
(£M) Cost savings
2003

5.5.12 SIC 28: Fabricated Metal Products
Operations within this sector include cutting and forming (generating noise), degreasing, rinsing (creating
waste water), coating and trimming (creating solid waste, together with packaging). This sector also includes
structural steel, which is used in construction, and the future performance of construction will influence future
spending in structural steel. The food and beverages industry is an important client for this sector (e.g.
beverage cans).
Estimates of environmental protection expenditure, environmental expenditure by media and income and
savings are provided below for the Fabricated Metal Products sector. For this sector, 88 companies
participated in the survey giving a response rate for the sector of 18 %, which is equivalent to 6% of the total
survey response.
Key Expenditure
5645R/46059-003-784/SV Final Report
60
t f
The Fabricated Metal Products sector spent approximately £180 million in 2003 on environmental protection
measures, 5 per cent of the total UK industry spend for 2003. Environmental expenditure for this sector is
shown in Figure 5.43 for the year 2000 to 2003. The data are presented separately for companies with less
than 250 employees and 250 plus employees, as well as for capital and operational expenditure.
Figure 5.43 Expenditure
Foo note: Totals may not add due to the rounding effects. Comparisons between years should be treated with caution because o the low
response rate.
Operating expenditure accounted for approximately 95% of total environmental spending by the fabricated
metal products sector. The spending in 2003 was dominated by in-house expenditure. This represents a shift
in priority from 2002 when in-house and external costs were approximately equal. Capital expenditure in both
2003 and 2002 was dominated by end-of-pipe solutions.
Environmental Expenditure by Media
Environmental expenditure by media for the Fabricated Metal Products sector is shown in Figure 5.44 below.
This sector spent nearly £90 million on dealing with solid waste, of which most is accounted for by in-house
operating costs. Just over £45 million was spent on water expenditure. Other significant contributors were air
and noise, both of which incur mostly in-house cost.
June 2005
In-house External Tot R & D Total End of Pipe Integrated Total
<250 113 32 2 147 4 2 6250+ 9 17 0 27 2 0 2Total 122 49 3 174 6 3 8
2002 Total 50 49 6 106 6 2 72001 Total 32 67 1 100 18 8 262000 Total 48 60 2 110 9 10 20
2003
OPEX (£M) CAPEX (£M)
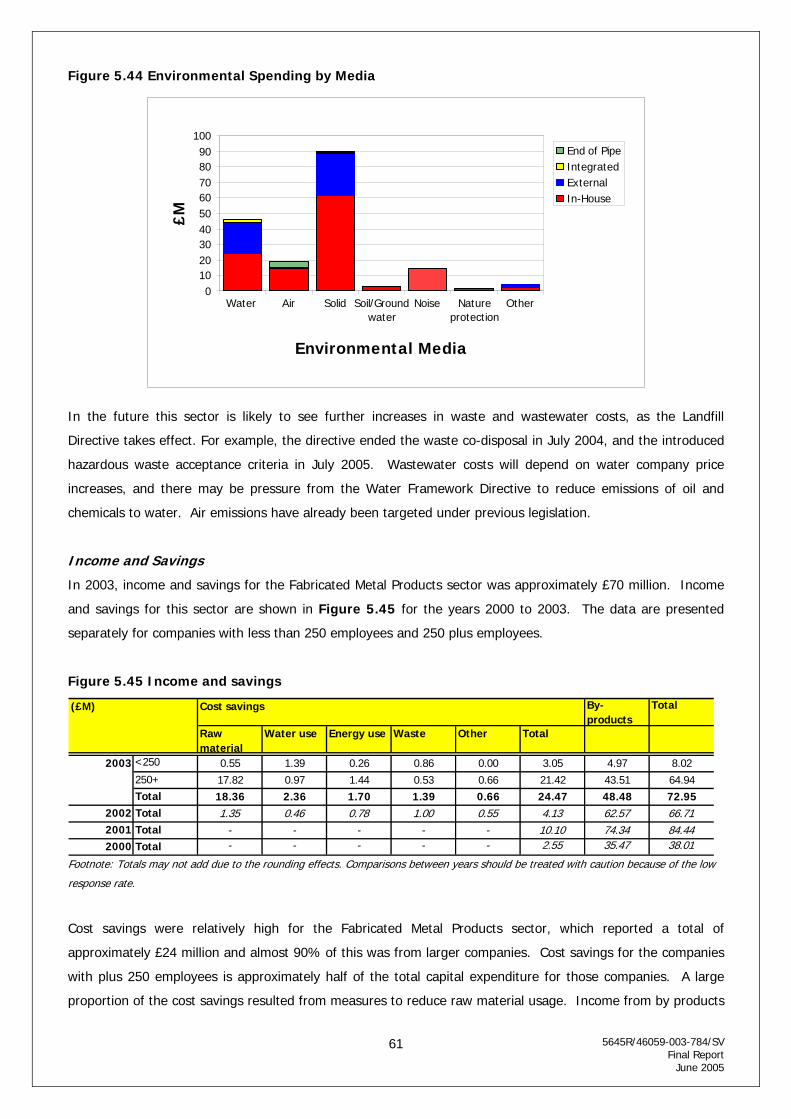
Figure 5.44 Environmental Spending by Media
In the future this sector is likely to see further increases in waste and wastewater costs, as the Landfill
Directive takes effect. For example, the directive ended the waste co-disposal in July 2004, and the introduced
hazardous waste acceptance criteria in July 2005. Wastewater costs will depend on water company price
increases, and there may be pressure from the Water Framework Directive to reduce emissions of oil and
chemicals to water. Air emissions have already been targeted under previous legislation.
Income and Savings
In 2003, income and savings for the Fabricated Metal Products sector was approximately £70 million. Income
and savings for this sector are shown in Figure 5.45 for the years 2000 to 2003. The data are presented
separately for companies with less than 250 employees and 250 plus employees.
Figure 5.45 Income and savings
5645R/46059-003-784/SV Final Report
61
t fFoo note: Totals may not add due to the rounding effects. Comparisons between years should be treated with caution because o the low
response rate.
Cost savings were relatively high for the Fabricated Metal Products sector, which reported a total of
approximately £24 million and almost 90% of this was from larger companies. Cost savings for the companies
with plus 250 employees is approximately half of the total capital expenditure for those companies. A large
proportion of the cost savings resulted from measures to reduce raw material usage. Income from by products
June 2005
0102030405060708090
100
Water Air Solid Soil/Groundwater
Noise Natureprotection
Other
Environmental Media
£M
End of PipeIntegratedExternalIn-House
By- products
Total
Raw material
Water use Energy use Waste Other Total
<250 0.55 1.39 0.26 0.86 0.00 3.05 4.97 8.02250+ 17.82 0.97 1.44 0.53 0.66 21.42 43.51 64.94Total 18.36 2.36 1.70 1.39 0.66 24.47 48.48 72.95
2002 Total 1.35 0.46 0.78 1.00 0.55 4.13 62.57 66.712001 Total - - - - - 10.10 74.34 84.442000 Total - - - - - 2.55 35.47 38.01
(£M) Cost savings
2003
5645R/46059-003-784/SV Final Report
62
June 2005
was £48 million of which nearly 90% was by companies with over 250 employees. By-products are expected
to include recycled metals.

5.5.13 SIC 29, 30 and 31: Machinery and Equipment, Office Machinery and Apparatus and
Electrical Machinery and Apparatus
Activities in this sector include basic metal and plastic forming operations, coating and assembly.
Estimates of environmental protection expenditure, environmental expenditure by media and income and
savings are provided below for the Machinery and Equipment, Office Machinery and Apparatus and Electrical
Machinery and Apparatus sector. For this sector, 160 companies participated in the survey giving a response
rate for the sector of 20%, which is equivalent to 10 % of the total survey response.
Key Expenditure
The Machinery and Equipment, Office Machinery and Apparatus and Electrical Machinery and Apparatus sector
spent approximately £330 million in 2003 on environmental protection measures, 9 per cent of the total UK
industry spend for 2003. Environmental expenditure for this sector is shown in Figure 5.46 for the years
2000 to 2003. The data are presented separately for companies with less than 250 employees and 250 plus
employees, as well as for capital and operational expenditure.
Figure 5.46 Expenditure
5645R/46059-003-784/SV Final Report
63
t f
Foo note: Totals may not add due to the rounding effects. Comparisons between years should be treated with caution because o the low
response rate.
Operating expenditure accounted for approximately 90% of total environmental spending by the machinery
and equipment sector, which is similar to the proportion reported in 2002. Capital spending in 2003 was
dominated by end-of-pipe solutions, which is similar to previous years.
Environmental Expenditure by Media
Environmental expenditure by media for the Machinery and Equipment, Office Machinery and Apparatus and
Electrical Machinery and Apparatus sector is shown in Figure 5.47 below. This sector spent about £170
million on dealing with solid waste, of which most is accounted for by external expenditure. Over £50 million
was spent on water and soil / groundwater protection. The increase in spending on soil and groundwater is
possibly as a result of the requirement for application site reports under IPPC for rubber and coating processes,
or increased acquisition activity. The pattern of expenditure was similar to 2002 with the exception of
expenditure on air declining, which may reflect that compliance has been achieved with legislation on solvent
releases.
June 2005
In-house External Tot R & D Total End of Pipe Integrated Total
<250 41 28 2 71 2 1 3250+ 77 145 2 223 26 2 28Total 117 173 4 294 28 3 31
2002 Total 82 91 10 183 11 6 172001 Total 75 105.9 9 189.9 25.6 16.1 41.72000 Total 109 214 37.4 360 55 39.5 93
2003
OPEX (£M) CAPEX (£M)

Figure 5.47 Environmental Spending by Media
5645R/46059-003-784/SV Final Report
64
t f
Income and Savings
In 2003, income and savings for the Machinery and Equipment, Office Machinery and Apparatus and Electrical
Machinery and Apparatus sector were approximately £27 million. Income and savings for this sector are shown
in Figure 5.48 for the years 2000 to 2003. The data are presented separately for companies with less than
250 employees and 250 plus employees.
Figure 5.48 Income and savings
Foo note: Totals may not add due to the rounding effects. Comparisons between years should be treated with caution because o the low
response rate.
Cost savings were relatively high for the Machinery and Equipment sector, which reported a total of
approximately £14 million. Cost savings for the companies with less than 250 employees is approximately half
of the total capital expenditure for those companies. The bulk of the savings resulted from substitution of raw
materials and measures to reduce energy usage. The costs appear to have switched from energy in 2002
(potentially to meet climate change agreement targets) to raw materials in 2003.
June 2005
0
20
40
60
80
100
120
140
160
180
Water Air Solid Soil/Groundwater
Noise Natureprotection
Other
Environmental Media
£MEnd of PipeIntegratedExternalIn-House
By- products
Total
Raw material
Water use Energy use Waste Other Total
<250 3.42 0.21 1.88 1.05 0.27 6.83 4.28 11.10250+ 4.36 0.21 1.47 0.45 0.69 7.19 8.78 15.97Total 7.78 0.42 3.35 1.50 0.96 14.01 13.06 27.07
2002 Total 3.95 1.39 6.08 2.04 0.12 13.59 10.87 24.462001 Total - - - - - 3.94 8.56 12.502000 Total - - - - - 13.37 13.21 26.58
(£M) Cost savings
2003
5645R/46059-003-784/SV Final Report
65
June 2005
Both large and small companies benefited from sales of by-products, which may include the recycling of scrap
metal and plastic. Income from the sale of by-products was £13 million for the Machinery and Equipment
sector.
5.5.14 SIC 32 & 33: Radio, TV and Comms, and Medical, Precision and Optical
This sector manufactures electronic components and equipment including television, sound and video
recording, instrumentation, optical equipment such as photographic and spectacle lenses, clocks and watches.
Estimates of environmental protection expenditure, environmental expenditure by media and income and
savings are provided below for the Radio, TV and Comms, and Medical, Precision and Optical sector. For this
sector, 86 companies participated in the survey giving a response rate for the sector of 24%, which is
equivalent to 5% of the total survey response.
Key Expenditure
The Radio, TV and Comms, and Medical, Precision and Optical sector spent approximately £60 million in 2003
on environmental protection measures, 2 percent of the total UK industry spend for 2003. Environmental
expenditure for this sector is shown in Figure 5.49 for the years 2000 to 2003. The data are presented
separately for companies with less than 250 employees and 250 plus employees, as well as for capital and
operational expenditure.
Figure 5.49 Expenditure
5645R/46059-003-784/SV Final Report
66
t fFoo note: Totals may not add due to the rounding effects. Comparisons between years should be treated with caution because o the low
response rate.
Operating expenditure accounted for approximately 90% of total environmental spending by the Radio, TV and
Comms, and Medical, Precision and Optical sector. External spending was slightly higher than in-house which is
consistent 2002. Capital spending in 2003 is dominated by end-of-pipe expenditure whilst it was split evenly
between end-of-pipe and integrated in 2002.
Environmental Expenditure by Media
Environmental expenditure by media for the Radio, TV and Comms, and Medical, Precision and Optical sector is
shown in Figure 5.50 below. Figures show that the major expenditure was on dealing with solid waste
(approximately £18 million), mainly as external costs for activities such as waste disposal. The pattern of
expenditure is similar to the expenditure in 2002.
June 2005
In-house External Tot R & D Total End of Pipe Integrated Total
<250 3 10 1 14 0 0 0250+ 18 17 1 36 7 0 7Total 21 27 3 50 7 0 7
2002 Total 17 23 0 40 2 2 42001 Total 28 30 2 60 2 7 92000 Total 41 35 2 79 10 95 106
2003
OPEX (£M) CAPEX (£M)
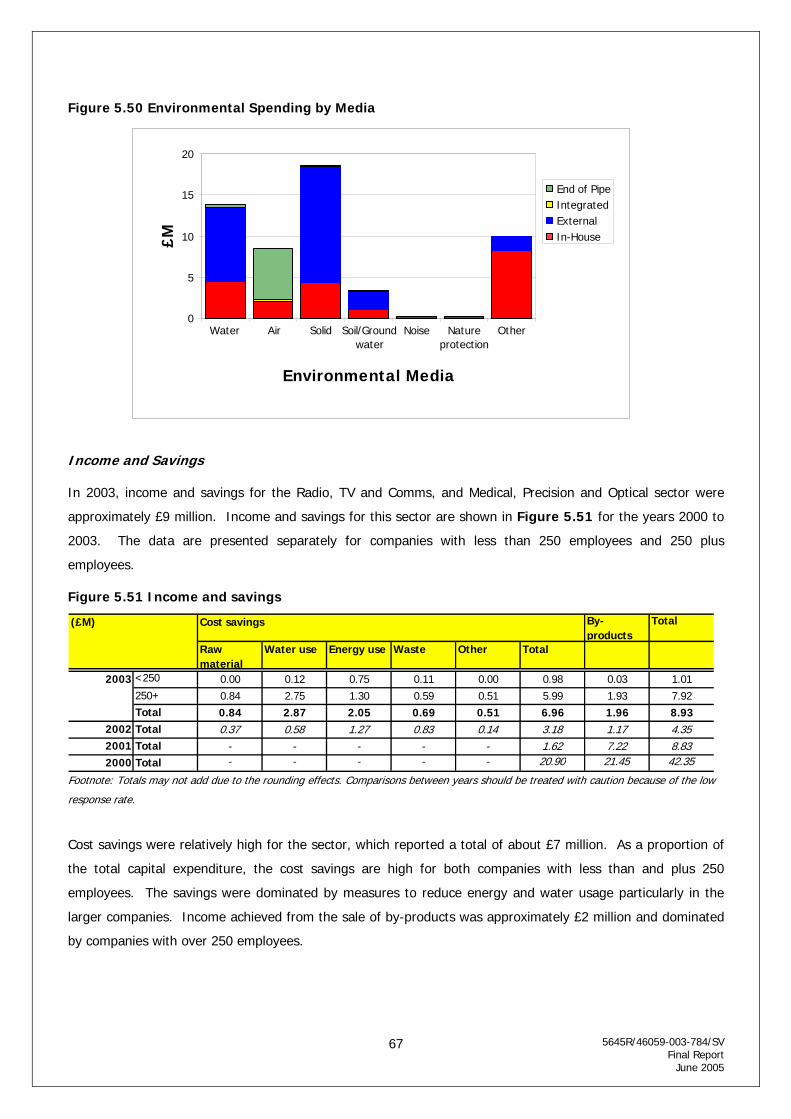
Figure 5.50 Environmental Spending by Media
5645R/46059-003-784/SV Final Report
67
t f
Income and Savings
In 2003, income and savings for the Radio, TV and Comms, and Medical, Precision and Optical sector were
approximately £9 million. Income and savings for this sector are shown in Figure 5.51 for the years 2000 to
2003. The data are presented separately for companies with less than 250 employees and 250 plus
employees.
Figure 5.51 Income and savings
Foo note: Totals may not add due to the rounding effects. Comparisons between years should be treated with caution because o the low
response rate.
Cost savings were relatively high for the sector, which reported a total of about £7 million. As a proportion of
the total capital expenditure, the cost savings are high for both companies with less than and plus 250
employees. The savings were dominated by measures to reduce energy and water usage particularly in the
larger companies. Income achieved from the sale of by-products was approximately £2 million and dominated
by companies with over 250 employees.
June 2005
0
5
10
15
20
Water Air Solid Soil/Groundwater
Noise Natureprotection
Other
Environmental Media
£MEnd of PipeIntegratedExternalIn-House
By- products
Total
Raw material
Water use Energy use Waste Other Total
<250 0.00 0.12 0.75 0.11 0.00 0.98 0.03 1.01250+ 0.84 2.75 1.30 0.59 0.51 5.99 1.93 7.92Total 0.84 2.87 2.05 0.69 0.51 6.96 1.96 8.93
2002 Total 0.37 0.58 1.27 0.83 0.14 3.18 1.17 4.352001 Total - - - - - 1.62 7.22 8.832000 Total - - - - - 20.90 21.45 42.35
(£M) Cost savings
2003

5.5.15 SIC 34 & 35: Motor Vehicles and Other Transport Equipment
This sector includes assemblers and manufacturers of components and panels used in assembly. In recent
years there has been a trend towards light weighting which has been counter-balanced by increases in weight
linked to increased safety features such as strengthened side impact bars and air bags, as well as greater
integration of ‘luxury features’ such as air conditioning. A number of manufacturers have started to use
different material types that lead to light weighting, for example replacing steel panels and parts (e.g. fuel
tank) with aluminium or plastic.
Estimates of environmental protection expenditure, environmental expenditure by media and income and
savings are provided below for the Motor Vehicles and Other Transport sector. For this sector, 90 companies
participated in the survey giving a response rate for the sector of 17%, which is equivalent to 6% of the total
survey response.
Key Expenditure
The Motor Vehicles and Other Transport Equipment sector spent approximately £200 million in 2003 on
environmental protection measures, 6 percent of the total UK industry spend for 2003. Environmental
expenditure for this sector is shown in Figure 5.52 for the years 2000 to 2003. The data are presented
separately for companies with less than 250 employees and 250 plus employees, as well as for capital and
operational expenditure.
Figure 5.52 Expenditure
5645R/46059-003-784/SV Final Report
68
t fFoo note: Totals may not add due to the rounding effects. Comparisons between years should be treated with caution because o the low
response rate.
Operating expenditure accounted for approximately 85% of total environmental spending by the Motor Vehicles
and Other Transport Equipment sector in 2003, which is similar to 2002. The spending in 2003 was higher for
in-house expenditure, whereas external expenditure was dominant in 2002. Capital spending in 2003 was
dominated by spending on integrated processes.
The relatively low level of capital expenditure shown may reflect the economic constraints on this sector within
the UK. It is interesting to note that for the smaller companies external operational expenditure is greatest
whereas for the larger companies in-house expenditure is greater. For the smaller companies, the external
expenditure might be due to greater use of external assistance brought on by down sizing of workforce, which
in turn is caused by pricing pressures imposed by the manufacturers further down the supply chain.
June 2005
In-house External Tot R & D Total End of Pipe Integrated Total
<250 14 23 1 37 0 0 1250+ 86 44 2 133 6 23 29Total 100 67 3 170 6 23 29
2002 Total 47 83 7 138 11 4 162001 Total 107 81 5 192 15 14 292000 Total 69 55 4 128 34 56 90
2003
OPEX (£M) CAPEX (£M)

Environmental Expenditure by Media
Environmental expenditure by media for the Motor Vehicles and Other Transport Equipment sector is shown in
Figure 5.53 below. This sector spent approximately £70 million on dealing with solid waste, of which most is
accounted for by in-house and external operating expenditure. About £40 million was spent on water, of which
most is accounted for by external and in-house operating expenditure. We expect the high costs for solid
waste to continue into 2004 due to the changes in landfill legislation with the majority of these costs being
associated with external processes. The pattern of expenditure is similar to that in 2002.
Figure 5.53 Environmental Spending by Media
5645R/46059-003-784/SV Final Report
69
t f
Income and Savings
In 2003, income and savings for the Motor Vehicles and Other Transport Equipment sector were approximately
£27 million. Income and savings for this sector are shown in Figure 5.54 for the year 2000 to 2003. The
data are presented separately for companies with less than 250 employees and 250 plus employees.
Figure 5.54 Income and savings
Foo note: Totals may not add due to the rounding effects. Comparisons between years should be treated with caution because o the low
response rate.
June 2005
0
10
20
30
40
50
60
70
80
Water Air Solid Soil/Groundwater
Noise Natureprotection
Other
Environmental Media
£M
End of PipeIntegratedExternalIn-House
By- products
Total
Raw material
Water use Energy use Waste Other Total
<250 0.00 0.83 1.36 1.99 0.06 4.25 0.58 4.82250+ 0.44 1.34 2.69 1.79 2.02 8.27 13.85 22.11Total 0.44 2.17 4.05 3.78 2.08 12.51 14.42 26.94
2002 Total 17.13 1.85 6.77 1.40 0.27 27.42 15.71 43.122001 Total - - - - - 2.35 5.02 7.372000 Total - - - - - 17.18 6.15 23.32
(£M) Cost savings
2003

Cost savings in 2003 were relatively high for the motor vehicles and other transport equipment sector, which
reported a total of almost £13 million. As a proportion of the total capital expenditure, the cost savings are
high for companies with less than 250 employees. The bulk of the savings resulted from savings achieved by
improved waste disposal and a reduction in energy use. Savings have decreased since 2002 with the main
change being a considerable decrease in savings from raw materials (only 2.5% of last year’s savings). This
may be due in part to the significant cost pressure that has been on this sector for some time driven
throughout the supply chain or a particular response from last year, which skewed the results.
The income from by-product sales in 2003 were also relatively high, about £14 million. These include metal,
leather and wood trimmings and scrap from testing. Income was dominated by companies with over 250
employees.
5645R/46059-003-784/SV Final Report
70
June 2005

5.5.16 SIC 36: Furniture Manufacture
The Furniture Manufacture sector is a small sector related to the wood and wood products industry – mainly
assembly operations. This sector faces strong competition from imports.
Estimates of environmental protection expenditure, environmental expenditure by media and income and
savings are provided below for the Furniture Manufacture sector. For this sector, 39 companies participated in
the survey giving a response rate for the sector of 16%, which is equivalent to 2% of the total survey
response.
Key Expenditure
The Furniture Manufacture sector spent approximately £100 million in 2003 on environmental protection
measures, 3 per cent of the total UK industry spend for 2003. Environmental expenditure for this sector is
shown in Figure 5.55 for the years 2000 to 2003. The data are presented separately for companies with less
than 250 employees and 250 plus employees, as well as for capital and operational expenditure.
Figure 5.55 Expenditure
5645R/46059-003-784/SV Final Report
71
t fFoo note: Totals may not add due to the rounding effects. Comparisons between years should be treated with caution because o the low
response rate.
Operating expenditure accounted for nearly 80% of total environmental spending by the Furniture Manufacture
sector in 2003. The spending in both 2002 and 2003 was dominated by external costs. Capital spending in
2003, unlike in 2002, was dominated by spending on end-of-pipe processes.
Environmental Expenditure by Media
Environmental expenditure by media for the Furniture Manufacture sector is shown in Figure 5.56 below.
This sector spent over £45 million on dealing with solid waste, of which most is accounted for by external
operating expenditure. About £25 million was spent on air protection measures. The pattern of expenditure
was slightly different in 2002 where the highest spending area was air.
June 2005
In-house External Tot R & D Total End of Pipe Integrated Total
<250 13 50 6 69 14 1 14250+ 4 7 0 11 3 6 9Total 17 57 6 80 16 7 24
2002 Total 17 39 8 65 0 8 82001 Total 14 32 1 47 5 9 142000 Total 7 28 1 35 7 10 17
2003
OPEX (£M) CAPEX (£M)
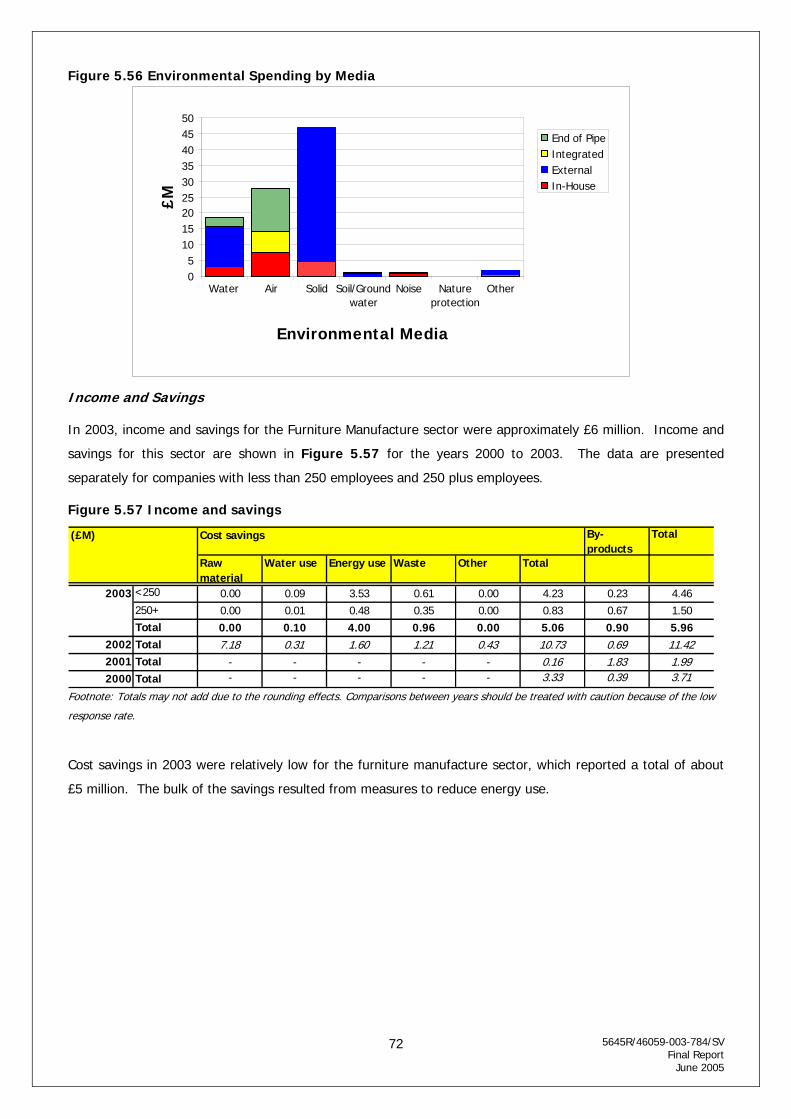
Figure 5.56 Environmental Spending by Media
5645R/46059-003-784/SV Final Report
72
t f
Income and Savings
In 2003, income and savings for the Furniture Manufacture sector were approximately £6 million. Income and
savings for this sector are shown in Figure 5.57 for the years 2000 to 2003. The data are presented
separately for companies with less than 250 employees and 250 plus employees.
Figure 5.57 Income and savings
Foo note: Totals may not add due to the rounding effects. Comparisons between years should be treated with caution because o the low
response rate.
Cost savings in 2003 were relatively low for the furniture manufacture sector, which reported a total of about
£5 million. The bulk of the savings resulted from measures to reduce energy use.
June 2005
05
101520253035404550
Water Air Solid Soil/Groundwater
Noise Natureprotection
Other
Environmental Media
£M
End of PipeIntegratedExternalIn-House
By- products
Total
Raw material
Water use Energy use Waste Other Total
<250 0.00 0.09 3.53 0.61 0.00 4.23 0.23 4.46250+ 0.00 0.01 0.48 0.35 0.00 0.83 0.67 1.50Total 0.00 0.10 4.00 0.96 0.00 5.06 0.90 5.96
2002 Total 7.18 0.31 1.60 1.21 0.43 10.73 0.69 11.422001 Total - - - - - 0.16 1.83 1.992000 Total - - - - - 3.33 0.39 3.71
2003
(£M) Cost savings

5.5.17 SIC 40: Electricity, Gas, Steam and Hot Water
Electricity, Gas, Steam and Hot Water is a relatively large sector in the UK and make one of the largest
spending sectors for this survey.
Estimates of environmental protection expenditure, environmental expenditure by media and income and
savings are provided below for the Electricity, Gas, Steam and Hot Water sector. For this sector, 21 companies
participated in the survey giving a response rate for the sector of 21 %, which is equivalent to 1% of the total
survey response.
Key Expenditure
The Electricity, gas, steam and hot water sector spent approximately £460 million in 2003 on environmental
protection measures, 13 per cent of the total UK industry spend for 2003. Environmental expenditure for this
sector is shown in Figure 5.58 for the years 2000 to 2003. The data are presented separately for companies
with less than 250 employees and 250 plus employees, as well as for capital and operational expenditure.
Figure 5.58 Expenditure
5645R/46059-003-784/SV Final Report
73
t fFoo note: Totals may not add due to the rounding effects. Comparisons between years should be treated with caution because o the low
response rate.
Operating expenditure accounted for over 85% of total environmental spending by the Electricity, Gas, Steam
and Hot Water sector in 2003, which is higher to the proportion reported in 2001 and 2002. The spending in
2003 was higher for in-house than external expenditure, which is similar to previous years. Capital spending in
2003, as in 2002, was dominated by spending on end-of-pipe processes.
Environmental Expenditure by Media
Environmental expenditure by media for the Electricity, Gas, Steam and Hot Water sector is shown in Figure
5.59 below. This sector spent approximately £300 million on dealing with solid waste, of which most is
accounted for by in-house and external operating expenditure. About £60 million was spent on air protection
measures and other. Pattern of expenditure is similar to that in 2002.
June 2005
In-house External Tot R & D Total End of Pipe Integrated Total
<250 12 6 4 22 0 1 1250+ 202 177 1 379 43 18 61Total 214 182 4 400 43 19 63
2002 Total 182 141 4 327 64 38 1022001 Total 166 158 2 326 171 151 3212000 Total 130 96 5 231 39 145 185
2003
OPEX (£M) CAPEX (£M)

Figure 5.59 Environmental Spending by Media
5645R/46059-003-784/SV Final Report
74
t f
Income and Savings
In 2003, income and savings for the Electricity, Gas, Steam and Hot Water sector were about £4 million.
Income and savings for this sector are shown in Figure 5.60 for the years 2000 to 2003. The data are
presented separately for companies with less than 250 employees and 250 plus employees.
Figure 5.60 Income and savings
Foo note: Totals may not add due to the rounding effects. Comparisons between years should be treated with caution because o the low response rate. Cost savings in 2003 were relatively low for the Electricity, Gas, Steam and Hot Water sector, which reported a
total of about £4 million. The bulk of the savings resulted from savings in waste disposal costs.
Income from by-product sales in 2003 were approximately £0.3 million, which is a sharp decrease from the
previous years.
June 2005
0
50
100
150
200
250
300
350
Water Air Solid Soil/Groundwater
Noise Natureprotection
Other
Environmental Media
£M
End of PipeIntegratedExternalIn-House
By- products
Total
Raw material
Water use Energy use Waste Other Total
<250 0.02 0.07 0.06 0.01 0.00 0.16 0.24 0.40250+ 0.00 0.00 0.00 3.99 0.00 3.99 0.07 4.06Total 0.02 0.07 0.06 4.00 0.00 4.15 0.31 4.45
2002 Total 1.86 0.28 0.38 0.00 5.94 8.46 16.46 24.922001 Total - - - - - 1.45 26.72 28.172000 Total - - - - - 7.87 8.50 16.37
(£M) Cost savings
2003
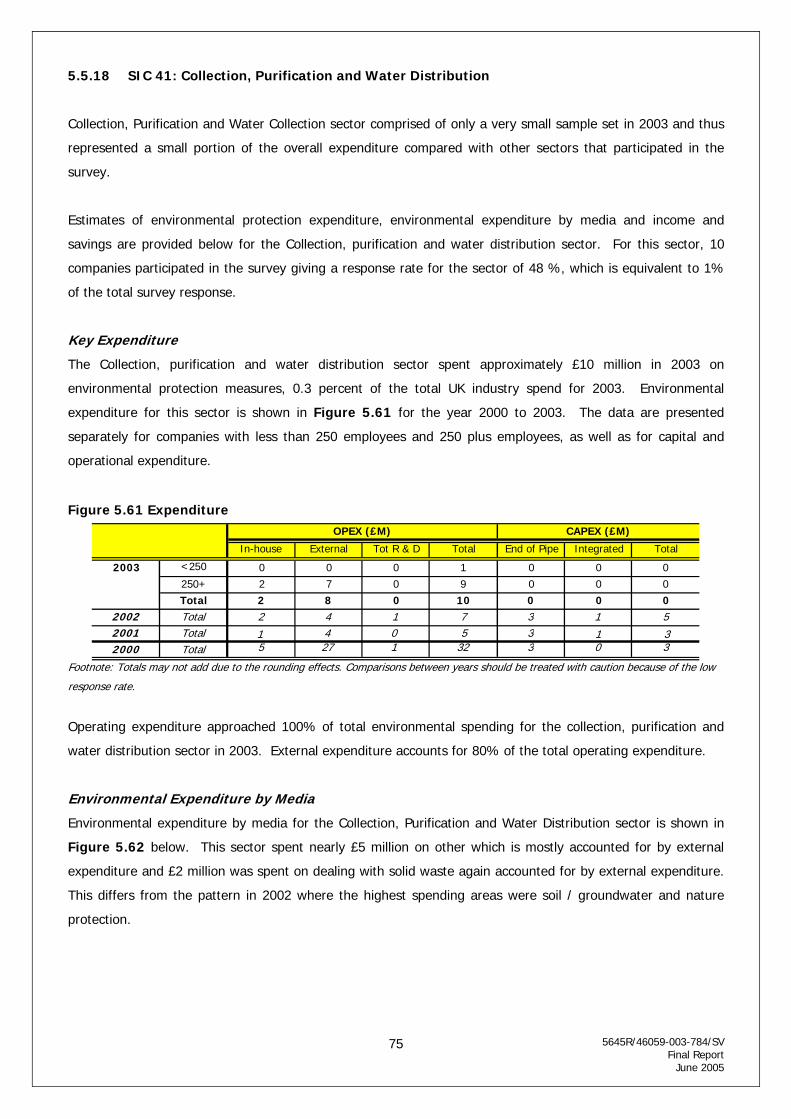
5.5.18 SIC 41: Collection, Purification and Water Distribution
Collection, Purification and Water Collection sector comprised of only a very small sample set in 2003 and thus
represented a small portion of the overall expenditure compared with other sectors that participated in the
survey.
Estimates of environmental protection expenditure, environmental expenditure by media and income and
savings are provided below for the Collection, purification and water distribution sector. For this sector, 10
companies participated in the survey giving a response rate for the sector of 48 %, which is equivalent to 1%
of the total survey response.
Key Expenditure
The Collection, purification and water distribution sector spent approximately £10 million in 2003 on
environmental protection measures, 0.3 percent of the total UK industry spend for 2003. Environmental
expenditure for this sector is shown in Figure 5.61 for the year 2000 to 2003. The data are presented
separately for companies with less than 250 employees and 250 plus employees, as well as for capital and
operational expenditure.
Figure 5.61 Expenditure
5645R/46059-003-784/SV Final Report
75
t f
Foo note: Totals may not add due to the rounding effects. Comparisons between years should be treated with caution because o the low
response rate.
Operating expenditure approached 100% of total environmental spending for the collection, purification and
water distribution sector in 2003. External expenditure accounts for 80% of the total operating expenditure.
Environmental Expenditure by Media
Environmental expenditure by media for the Collection, Purification and Water Distribution sector is shown in
Figure 5.62 below. This sector spent nearly £5 million on other which is mostly accounted for by external
expenditure and £2 million was spent on dealing with solid waste again accounted for by external expenditure.
This differs from the pattern in 2002 where the highest spending areas were soil / groundwater and nature
protection.
June 2005
In-house External Tot R & D Total End of Pipe Integrated Total
<250 0 0 0 1 0 0 0250+ 2 7 0 9 0 0 0Total 2 8 0 10 0 0 0
2002 Total 2 4 1 7 3 1 52001 Total 1 4 0 5 3 1 32000 Total 5 27 1 32 3 0 3
2003
OPEX (£M) CAPEX (£M)
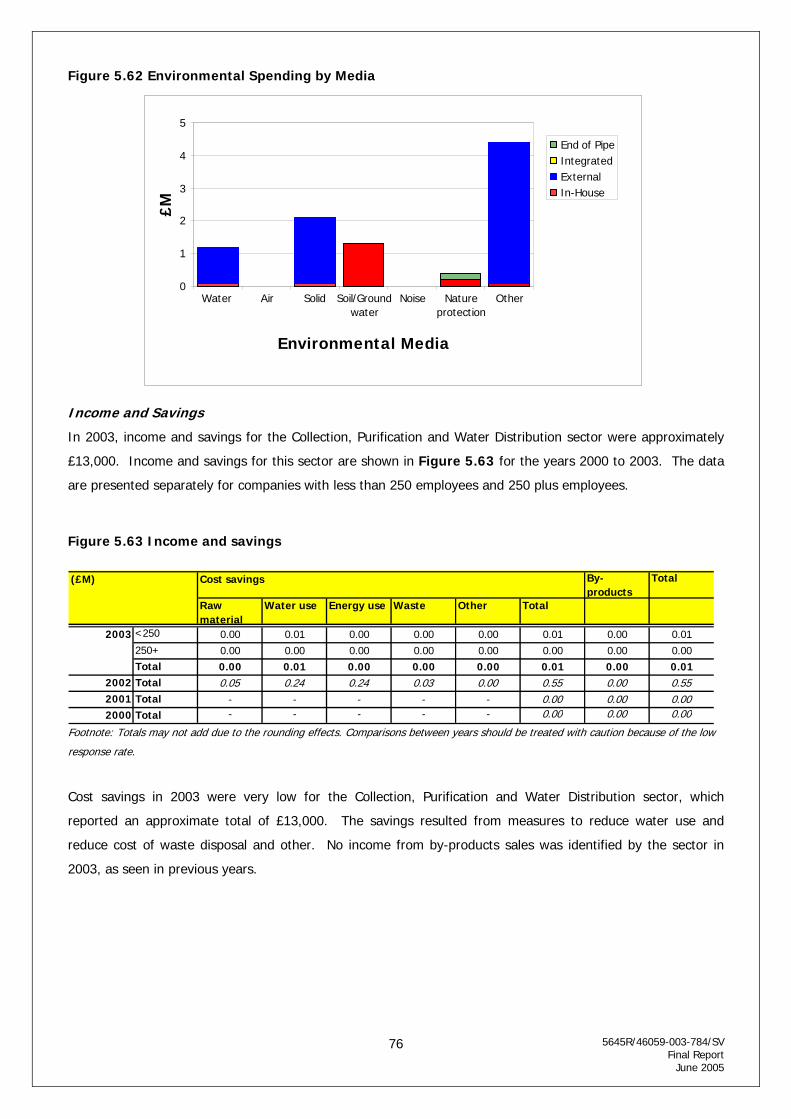
Figure 5.62 Environmental Spending by Media
5645R/46059-003-784/SV Final Report
76
t f
Income and Savings
In 2003, income and savings for the Collection, Purification and Water Distribution sector were approximately
£13,000. Income and savings for this sector are shown in Figure 5.63 for the years 2000 to 2003. The data
are presented separately for companies with less than 250 employees and 250 plus employees.
Figure 5.63 Income and savings
Foo note: Totals may not add due to the rounding effects. Comparisons between years should be treated with caution because o the low
response rate.
Cost savings in 2003 were very low for the Collection, Purification and Water Distribution sector, which
reported an approximate total of £13,000. The savings resulted from measures to reduce water use and
reduce cost of waste disposal and other. No income from by-products sales was identified by the sector in
2003, as seen in previous years.
June 2005
0
1
2
3
4
5
Water Air Solid Soil/Groundwater
Noise Natureprotection
Other
Environmental Media
£MEnd of PipeIntegratedExternalIn-House
By- products
Total
Raw material
Water use Energy use Waste Other Total
<250 0.00 0.01 0.00 0.00 0.00 0.01 0.00 0.01250+ 0.00 0.00 0.00 0.00 0.00 0.00 0.00 0.00Total 0.00 0.01 0.00 0.00 0.00 0.01 0.00 0.01
2002 Total 0.05 0.24 0.24 0.03 0.00 0.55 0.00 0.552001 Total - - - - - 0.00 0.00 0.002000 Total - - - - - 0.00 0.00 0.00
2003
(£M) Cost savings

5.6 COMPARISON OF CURRENT EXPENDITURE WITH SUPPLY SIDE ESTIMATES
To help validate the expenditure estimates from the Defra survey, comparisons have been made with
“supply-side” data; that is information on the value of environmental ‘services’ provided to UK
industry by the environmental industry and regulators (e.g. wastewater treatment and environmental
regulatory charges).
Environmen al regulatory charges t
Figure 5.64 shows that the regulatory charges of £100 million reported in the 2003 Defra survey for
the UK are broadly consistent with the charges reported by the Environment Agency for England and
Wales, £89.2 million. The table also shows that the consistency between the Defra survey figures
and those reported by the Environment Agency was also present in 2001 and 2002.
Figure 5.64 Comparison with supply-side expenditure on regulatory charges
Year Estimated expenditure
per Defra survey (£m)
Regulatory charges paid
by industry (£m)
Comments
2001 135 87.2
2002 104 86.4
2003 100 89.2
Environment Agency
income (England and
Wales)
The charges are broken down in Figure 5.65.
Figure 5.65 Regulatory charges for industry in England and Wales
Income (£m)
Type of fee 2001 2002 2003
Charging for discharges 53.9 55.6 58.7
IPC 17.4 15.2 12.8
Radioactive Substances 6.3 6.1 8.2
Producer Responsibility 2.7 2.7 2.7
Waste Management Licensing 6.9 6.8 6.8
Total 87.2 86.4 89.2
Source: Environment Agency (2004)
It should be noted that waste management licensing applies to both industry sites and the waste
management industry proper, which does not feature in this survey. The Environment Agency
estimates that 70 per cent of the waste management licence fee is attributable to the waste
management industry, not covered on this survey. Therefore, in Figure 5.65, for 2001 £6.9 million
5645R/46059-003-784/SV Final Report
June 2005
77

is 30 per cent of the Waste Management Licensing total of £22.9 million, and for 2002 and 2003 £6.8
million is 30 per cent of the £22.7 million total.
Wastewater t eatment r
The 2003 Defra survey indicates that UK industry paid £428 million to water companies for
wastewater treatment services. This compares with an estimate of £1259 million based on OFWAT
(Office for Water Services) data for trade effluent and metered sewerage shown in Figure 5.66. The
true comparable figure could either be higher or lower than £1259 million for the reasons given
below, but it does give an indication of the order of magnitude and suggests that the Defra survey
estimate is clearly well below i.e. that the Defra figure probably understates industry payments to
water companies. This understatement can also be seen in 2001 and 2002.
Figure 5.66 Comparison with supply-side expenditure on wastewater treatment
operating costs paid to the water industry
Year Estimated expenditure
per Defra survey (£m)
Wastewater treatment
operating cost paid to
water industry (£m)
Comments
2001 564 1204
2002 428 1202
2003 428 1259
Supply-side estimates
include trade effluent and
metered sewerage charges
for England and Wales
The supply-side estimates provided in Figure 5.66 are based on OFWAT data (Source – Financial
performance and expenditure of the water companies in England and Wales 2003-04 report) on
income received by English and Welsh water companies from trade effluent and sewerage activities.
The OFWAT data does not identify revenues received from different sources (e.g. industrial,
household) so it is not possible directly to identify payments to industry. The data does, however,
distinguish three types of sewerage revenues: trade effluent, metered sewerage charges and
unmetered sewerage. The first two categories of revenue are largely paid by firms in the industries
covered by the survey, but will include some charges from commercial consumers and households as
well. ‘Unmetered sewerage’ will almost entirely be paid by households and firms outside the
coverage of the survey. The figure of £1259 million shown in Figure 5.66 includes income earned
from the first two categories, trade effluent and metered sewerage, the bulk coming from metered
sewerage.
The costs are broken down in Figure 5.67.
5645R/46059-003-784/SV Final Report
June 2005
78
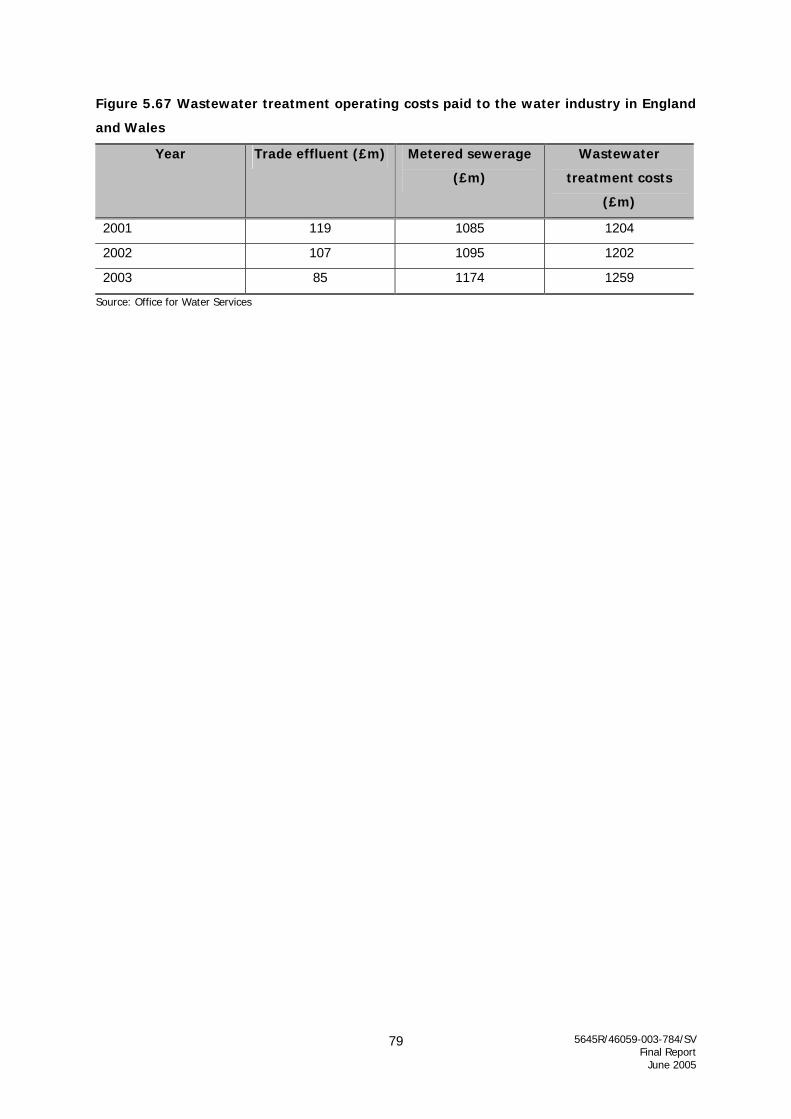
Figure 5.67 Wastewater treatment operating costs paid to the water industry in England
and Wales
Year Trade effluent (£m) Metered sewerage
(£m)
Wastewater
treatment costs
(£m)
2001 119 1085 1204
2002 107 1095 1202
2003 85 1174 1259
Source: Office for Water Services
5645R/46059-003-784/SV Final Report
June 2005
79

5.7 ENVIRONMENTAL REPORTING SYSTEMS
This section presents the results of the questions on Environmental Reporting Systems (Section 4 in
the questionnaire) that were introduced in the 2002 survey and continued for 2003. These questions
were introduced to provide greater information on the sources used to answer the main sections of
the questionnaire.
5.7.1 Separate Identification of Environmental Expenditure in information systems
The first question asks if environmental protection expenditure was separately identified within the
management accounting system, the financial accounts, environmental management system or any
other sources. Figure 5.68 presents a summary of the results of this question. There are three
possible answers that can be given - yes, no or unknown.
Figure 5.68 Separate Identification of Environmental Protection Expenditure in
information systems
Response by Company Numbers No Yes
< 250 ≥ 250 Total < 250 ≥ 250 Total
Management Accounting System
998 247 1245 78% 224 120 344 22%
The financial accounts 1063 281 1344 85% 159 86 245 15%
Data generated by an environmental management system
1140 270 1410 89% 82 97 179 11%
Other sources 1158 313 1471 93% 64 53 117 7%
Note, two companies did not answer the questions regarding the first three systems and 3 companies
did not answer the final question on other sources.
The key findings of the question are:
• 22% of companies surveyed separately identify environmental protection expenditure in their
management accounting system;
• 15% of companies surveyed separately identify environmental protection expenditure in the
financial accounts;
• 11% of companies surveyed separately identify environmental protection expenditure in data
generated by an environmental management system; and
5645R/46059-003-784/SV Final Report
June 2005
80
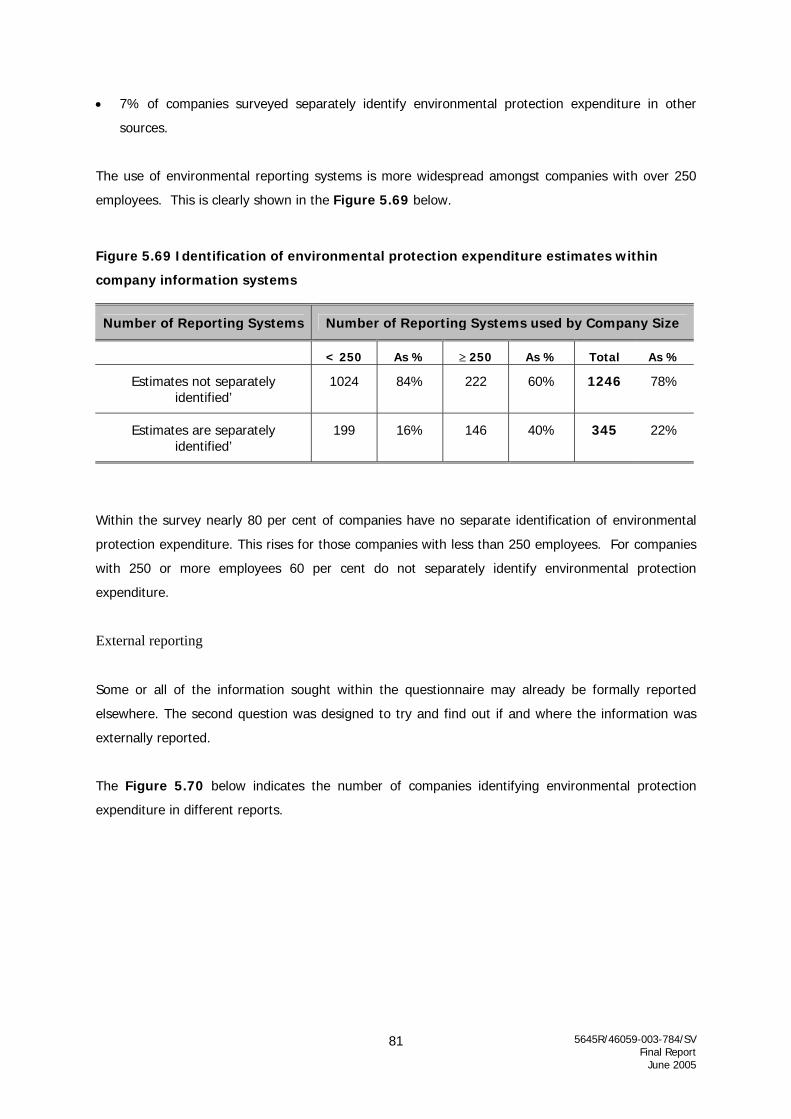
• 7% of companies surveyed separately identify environmental protection expenditure in other
sources.
The use of environmental reporting systems is more widespread amongst companies with over 250
employees. This is clearly shown in the Figure 5.69 below.
Figure 5.69 Identification of environmental protection expenditure estimates within
company information systems
Number of Reporting Systems Number of Reporting Systems used by Company Size
< 250 As % ≥ 250 As % Total As %
Estimates not separately identified’
1024 84% 222 60% 1246 78%
Estimates are separately identified’
199 16% 146 40% 345 22%
Within the survey nearly 80 per cent of companies have no separate identification of environmental
protection expenditure. This rises for those companies with less than 250 employees. For companies
with 250 or more employees 60 per cent do not separately identify environmental protection
expenditure.
External reporting
Some or all of the information sought within the questionnaire may already be formally reported
elsewhere. The second question was designed to try and find out if and where the information was
externally reported.
The Figure 5.70 below indicates the number of companies identifying environmental protection
expenditure in different reports.
5645R/46059-003-784/SV Final Report
June 2005
81

Figure 5.70 Number Companies Reporting in Various Media
Media External Reporting by Company Size
< 250 ≥ 250 Total
The annual reports and accounts 132 11% 74 20% 206 13%
The environmental Report 70 6% 79 21% 149 9%
A corporate social responsibility or sustainability report
34 3% 62 17% 96 6%
Other 38 3% 28 8% 66 4%
Not Reported at all 1024 84% 222 60% 1246 78%
Almost 80 per cent of companies indicated that the information that they had provided for the
questionnaire was not identified (either in partial or complete form) in other external reports. 22% of
companies surveyed publicly report on their environmental expenditure. The most frequent methods
of reporting information are in their annual accounts (13%) or an environmental / sustainability
report (6%). For companies with 250 or more employees, 40 per cent of those surveyed provide the
information in an external report.
Of those companies that externally report the information the most common media is within the
annual reports and accounts.
5.7.2 Findings
The majority of companies do not separately identify environmental protection expenditure in their
information systems. As this data is not separately recorded it is unsurprising that it is not externally
reported. This raises the question of how the majority of the people who filled in the questionnaire
obtained their information. In the past, when asked for the source of the data a common answer has
been that they are best guess or estimates. This raises issues regarding the accuracy and
consistency of the given figures.
5645R/46059-003-784/SV Final Report
June 2005
82

6 RECOMMENDATIONS FOR FUTURE SURVEYS
The following section provides recommendations for subsequent surveys based on the experience of
the URS team in conducting the 2003 study, feedback received from trade associations, and
comments from companies via the Helpdesk and interviews.
The main sources of feedback from the correspondence in 2003 were through phone calls to the Help
desk, phone calls made through dedicated Top Company Follow-up and phone calls made during data
validation. Useful feedback was also obtained from the letters that were returned to explain a
company’s non-participation. All the feedback was recorded and the text below discusses the main
findings, which should be taken into consideration for future surveys.
6.1 GENERAL
• Overall, fewer problems have been encountered by companies than during the previous surveys–
it is reasoned that the improvements made to the survey after the 1999, 2000, 2001, and 2002
survey review are responsible.
• The timing of the 2003 survey aimed to avoid the end of financial year as well as Christmas
periods and therefore, to reduce the burden on respondents. It was noted that the queries and
complaints about the survey timing were remarkably reduced from the previous year and it is
therefore recommended that similar timing would be applied in the future survey years. Some
confusion was caused in a few cases by the timing of the survey, for participants who were
surveyed for a second time and felt they had only recently completed the same survey. This
affected only a very small minority of participants.
• Reminder postcards, in general, were found to be a very efficient way of getting companies to
contact the Helpdesk and to participate, although some companies gave negative feedback
stating that it was unnecessary to send a reminder before the survey deadline. This and the
reminder letter, which was sent out three weeks later, increased the calls to the Helpdesk and the
response rate considerably.
• It is recommended that the different cover letters sent to companies according to their size be
reviewed to reflect the sampling methodology (i.e. large companies are not selected by random
sampling).
• A web-based questionnaire was used for the 2003 in order for companies to be able to fill in the
survey online. This method of responding was encouraged through the calls received at
5645R/46059-003-784/SV Final Report
June 2005
83
Helpdesk. Only handful of questionnaires filled in online were, however, received via e-mail by
the end of the survey period. It is recommended that this method be further encouraged during
the 2004 survey, in order to reduce the burden on respondents as well as the Helpdesk.
• Once again differences have arisen between the questionnaire returns and the IDBR company
turnover and number of employees. Addition of the question in the classification details of
whether the survey was, however, filled in for a site, division or the whole company made it
easier to validate figures.
• It is recommended that more use would be made of the end-of-pipe and integrated expenditure
items that are completed on the questionnaire. These are currently used for validation purposes,
but they could also assist in giving ideas of the drivers behind expenditure.
Broadly, the feedback about problems arising from the survey can be split into two areas as in
previous years:
• Firstly, the larger companies encounter more logistical problems such as the co-ordination of all
the data from different sites. In addition, the ‘large’ companies also experience more accounting
difficulties, as they tend to not separate the expenditures. It is noted that several companies are
willing to modify their accounting procedures in order to participate in the survey in following
years.
• In comparison the smaller companies tend to contact the Helpdesk with concerns that the survey
is not relevant to them, or seeking guidance and assistance with technical questions they were
experiencing difficulty with answering. The former of these concerns remained the most frequent
driver for calls from smaller companies this year, but in most cases it was possible to work
through the questions giving illustrative examples of the kinds of information required, thus
persuading the participant to complete some or all of the questionnaire. For example, the
Helpdesk requested all the companies to provide answers for at least for questions 1.2 Box B and
C and sections 4, 5, and 6. It is highly recommended that an additional postcard or leaflet,
addressing the concerns of small companies in non-technical language, be sent out in the 2004
survey pack. This should aim to lessen the confusion caused by the complex appearance of the
questionnaire for those unfamiliar with its terminology and directly encourage the participation of
smaller companies by clearly explaining the relevance of the survey to them, briefly explaining the
rationale behind it and outlining the long term benefits of participating for small businesses. This
may help to reduce the number of queries received by the Helpdesk in future surveys.
5645R/46059-003-784/SV Final Report
June 2005
84

6.2 QUESTIONNAIRE DESIGN
The only modification for the 2003 questionnaire was the introduction of the question asking ‘what is
the main product which generates the integrated expenditure. Several further modifications are
recommended for the 2004 questionnaire. These are outlined in the Figure 6.1 below.
Figure 6.1 Recommendations for Questionnaire Design
Question Number Question Problems and Recommendations
1.2 c Operating Costs paid to External organisations: Waste Water
Question on wastewater has caused continued confusion and low responses. It is recommended that the survey more clearly explain the split between water rates and sewage charges which businesses should see on their annual bills, and specify the requirement for a separately stated sewage charge in answer to this question. It is also recommended that a comment is added to the question itself stating the following N.B It is normal that all companies pay such a charge unless e.g. use septic tank, or cost included in leasing cost).
5. Classification Details In some cases information is given for a combination of sites, whole companies or divisions, which can confuse the results. It is recommended that to avoid this the questionnaire states at the beginning of the section that the information provided should relate to one site, division or company only, not to a mixture.
5. Classification Details: Total Capital Expenditure
A number of participants failed to understand that ’Capital Expenditure’ in section 5 does not refer to total costs, i.e. does not include running costs, nor does it refer to only environmentally related Cap EX as in section 2. It is recommended that an abbreviated definition of capital expenditure is included next to the question itself.
General – 1-6 All sections Validations continue to arise where answer boxes have been left blank or only a few filled in on the questionnaires. In an attempt to reduce these instances, it is recommended that the bullet point instructions from the front page of the survey with regards to entering zero or n/a or leaving blank and entering n/k should be moved, and placed in bold text after the definition of environmental protection expenditure on page 2 and before Section 1 on Operating Environmental Protection Expenditure.
5645R/46059-003-784/SV Final Report
June 2005
85

6.3 VALIDATION PROCESS
• The high number of validations resulting from this year’s survey response, suggest that the
validation checks have worked very effectively in picking up discrepancies and gaps in the data
provided by participants. This demonstrates the effectiveness of improvements and modifications
made to the validation process since last year’s survey and over previous years.
• The increased use of email for responses and reminders as well as in a few cases the online
questionnaire, facilitated the validation process this year, improving the efficiency of the Helpdesk
in chasing up late surveys and responses to validation queries. The emails also helped to reduce
the paper use from requested survey resends in the later stages of the survey period. The online
questionnaire is expected to yield an increased improvement in these areas in 2004.
5645R/46059-003-784/SV Final Report
June 2005
86
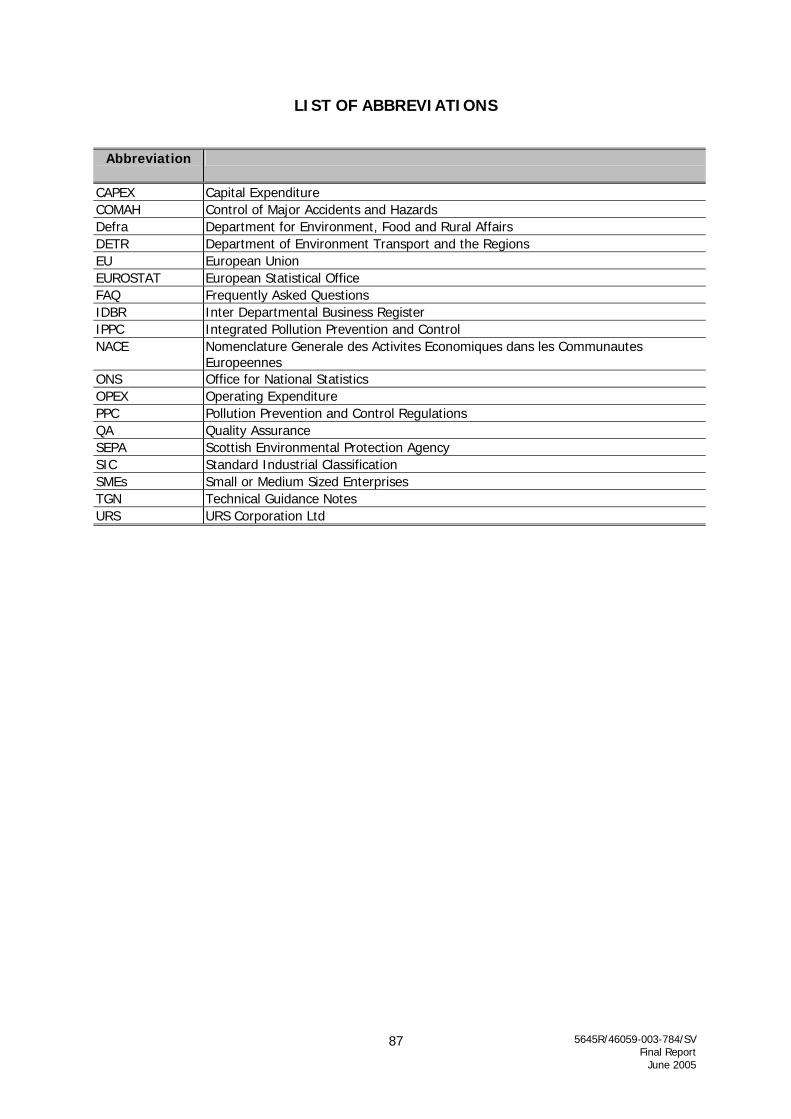
LIST OF ABBREVIATIONS
Abbreviation
CAPEX Capital Expenditure COMAH Control of Major Accidents and Hazards Defra Department for Environment, Food and Rural Affairs DETR Department of Environment Transport and the Regions EU European Union EUROSTAT European Statistical Office FAQ Frequently Asked Questions IDBR Inter Departmental Business Register IPPC Integrated Pollution Prevention and Control NACE Nomenclature Generale des Activites Economiques dans les Communautes
Europeennes ONS Office for National Statistics OPEX Operating Expenditure PPC Pollution Prevention and Control Regulations QA Quality Assurance SEPA Scottish Environmental Protection Agency SIC Standard Industrial Classification SMEs Small or Medium Sized Enterprises TGN Technical Guidance Notes URS URS Corporation Ltd
5645R/46059-003-784/SV Final Report
June 2005
87

LIST OF STANDARD INDUSTRIAL CLASSIFICATION (SIC) CODES
SIC Code
SIC Sector
10 to 14 Mining and Quarrying 15 Food Products & Beverages 16 Tobacco Products 17 Textiles 18 Clothing 19 Leather Products 20 Wood & Wood Products 21 Pulp & Paper 22 Publishing & Printing 23 Coke, Petroleum & Nuclear Fuel 241 Chemical & Chemical Products - Basic 244 Chemical & Chemical Products - Pharmaceuticals 24 other Chemical & Chemical Products - Other 251 Rubber 252 Plastics 26 Other Non-Metallic Minerals 27 Basic Metals 28 Fabricated Metal Products 29 Machinery & Equipment 30 Office Machinery & Apparatus 31 Electrical Machinery & Apparatus 32 Radio, Television & Communications 33 Medical, Precision & Optical 34 Motor Vehicles 35 Other Transport Equipment 36 Furniture Manufacture 40 Electricity, Gas, Steam & Hot Water 41 Collection, Purification & Water Distribution
5645R/46059-003-784/SV Final Report
June 2005
88