Embed Size (px)
Citation preview

49355201 Final Report May 2011
FINAL REPORT
ENVIRONMENTAL PROTECTION EXPENDITURE BY INDUSTRY: 2009 UK SURVEY
Department for Environment, Food and Rural Affairs
May 2011
Ref. 49355201

49355201 Final Report May 2011
The views and recommendations expressed in this report are those of the authors and do
not necessarily represent the views of the Department for Environment, Food and Rural
Affairs, its ministers or officials.

49355201 Final Report May 2011
Project Title: Environmental Protection Expenditure Survey by Industry 2009
Report Title: Environmental Protection Expenditure Survey by Industry 2009
Project Ref: 49355201
Status: Draft Report
Client Contact Name: Rocky Harris / Mohammad Ali
Client Company Name: Department for Environment, Food and Rural Affairs (Defra)
Issued By: URS Corporation Ltd
Document Production / Approval Record
Issue No: 1
Name Signature Date Position
Prepared by
Daniel Tuck
Laura Quinton
Consultant
Principal Consultant
Checked by
Kristelle Haslam
Project Manager
Approved by
Sally Vivian
Project Director
Document Revision Record
Issue No Date Details of Revisions
1 April 2011 First draft
2 May 2011 First revised
Final May 2011 Final draft

49355201 Final Report May 2011 i
TABLE OF CONTENTS
Page No
EXECUTIVE SUMMARY 1
1 INTRODUCTION 8 1.1 OBJECTIVES 8 1.2 DEFINITION OF ENVIRONMENTAL PROTECTION EXPENDITURE 9 1.3 SURVEY SCOPE AND BACKGROUND 9 1.4 REPORT STRUCTURE 10
2 SURVEY METHODOLOGY 12 2.1 MODIFICATIONS INTRODUCED IN THE 2009 SURVEY 13 2.2 SAMPLING METHODOLOGY 14 2.3 DATABASE DESIGN 14
3 CONDUCTING THE SURVEY 16 3.1 Methodology 16 3.2 TOP COMPANY FOCUS 17
3.2.1 Additional findings from the Top Company follow-up 17 3.3 HELPDESK SUPPORT 18
4 ANALYSIS OF RESPONSES 19 4.1 Response Rates 19
4.1.1 Weighted Response Rates 19 4.1.2 Response Bias 20
4.2 Methodology 20 4.3 Survey Completion Time 21
5 SURVEY RESULTS AND ANALYSIS 22 5.1 Total expenditure 22 5.2 EXPENDITURE BY ENVIRONMENTAL MEDIA 23 5.3 EXPENDITURE BY INDUSTRY SECTOR 26 5.4 COST SAVINGS AND INCOME 26 5.5 ENVIRONMENTAL PROTECTION EXPENDITURE BY INDIVIDUAL SECTOR 29
5.5.1 SIC 05 to 09: Mining and Quarrying 29 5.5.2 SIC 10 - 12: Food Products and Beverages, and Tobacco Products 31 5.5.3 SIC 17 : Paper and Pulp 33 5.5.4 SIC 19: Coke & Refined Petroleum 36 5.5.5 SIC 24 -25 Basic & Fabricated Metals 38 5.5.6 SIC 20 & 21: Chemicals and Pharmaceuticals 40 5.5.7 SIC 35 & 36: Electricity, Gas and Water 43
5.6 DRIVERS FOR CAPITAL EXPENDITURE 46 5.7 ENVIRONMENTAL MANAGEMENT SYSTEMS 46
6 RECOMMENDATIONS FOR FUTURE SURVEY 48 6.1 GENERAL 48 6.2 SAMPLE FRAME 48 6.3 VALIDATION 48

Environmental Protection Expenditure by UK Industry: 2009 Survey
49355201 Final Report May 2011 ii
6.3 ANALYSIS 49
ABBREVIATIONS & ACCRONYMS 50

49355201 Final Report 1 May 2011
EXECUTIVE SUMMARY
This report presents the findings of a research commissioned by the Department for Environment,
Food and Rural Affairs (Defra) and undertaken by URS Corporation Limited (URS), to estimate the
expenditure by UK industry on environmental protection in 2009.
The primary objectives of the study are:
• To provide Defra with annual estimates of environmental protection expenditure by UK
industry.
• To enable Defra to provide these estimates to the European Commission as required under
the EU Structural Business Statistics Regulation 58/97.
In addition to these broad objectives, annual data from the survey can be used to assess how
expenditure is changing and to compare the levels of expenditure of UK industries relative to those in
other EU countries. The data also enable companies and trade associations to benchmark their own
environmental spending against that of their sector and industry as a whole, both in the UK and the
EU. Furthermore, information on companies’ environmental expenditure and trends can be used to
support evidence based policy-making.
This is the thirteenth survey of this type; previous surveys were carried out in 1994 (a pilot survey),
1997, and annually between 1999 and 2008. The 2009 survey was conducted in three phases
between May 2010 and June 2011 and overseen by a steering group with representatives from Defra
and the Office for National Statistics (ONS).
Methodology
In 2009, the survey was provided to companies within the following Standard Industrial Classification
(SIC 2007) categories:
• Mining and Quarrying
• Food Products and Beverages and Tobacco Products
• Pulp and Paper
• Coke and Refined Petroleum
• Basic and Fabricated Metals
• Chemicals and Pharmaceuticals
• Electricity, Gas and Water
The UK Government’s Inter Departmental Business Register (IDBR) provided a stratified random
sample of 974 companies across these industries, who were invited to complete a postal or web
based questionnaire on a voluntary basis. The sampling procedure was designed to target sectors
where the expenditure was expected to be greatest, based on feedback and findings from previous
surveys. The total number of validated responses was 171, giving a valid response rate of 17.8 %.
The responses were subjected to a range of detailed validation checks.
The survey analysed the following expenditure patterns in UK industry:
• Operating expenditure (OPEX), which consists of in-house operating costs of a company’s own
environmental protection activities, and also payments to others for environmental protection
services including waste disposal.

Environmental Protection Expenditure by UK Industry: 2009 Survey
49355201 Final Report May 2011 2
• Capital expenditure (CAPEX), which consists of ‘end of pipe’ investments (expenditure on
equipment to clean up at the end of the production process) and integrated investment
expenditure (expenditure on equipment which reduces or eliminates emissions and discharges as
part of the production process).
The following were also identified:
• Income and savings resulting from environmental protection activities carried out in 2009
• The environmental media (areas) affected by the spending, namely waste water, air, solid waste,
soil/groundwater, noise/vibrations and nature protection.
• The use of Environmental Management Systems
Key findings for 2009
The main findings from the 2009 survey are as follows:
• Gross spending on environmental protection in 2009 by UK industry for the selected sectors was
an estimated £3.3 billion.
• Operating expenditure (OPEX) accounted for 58% of the total environmental protection
expenditure, with capital expenditure (CAPEX) making up the remaining 42%.
• The greatest operating spend comprised water protection measures accounting for 46% of total
environmental OPEX, followed by solid waste at 20% of total operating cost.
• Spend on wastewater accounted for 69% of total CAPEX, followed by air protection measures
with a 22% share of total CAPEX spend.
• This spending was offset by an estimated income from the sale of by-products of £17.5 million
and an estimated overall cost saving of £146 million.
• Of the industry sectors covered in the 2009 survey, the primary spending sector was, by far, the
Electricity, Gas, and Water sector (81% of total expenditure). Followed by Food Products and
Beverages and Tobacco Products with 10% share of total expenditure in 2009.
• In 2009, 81% of surveyed companies had implemented an environmental management system
(EMS). Of the EMS in place, 63% were ISO14001 certified, 37% were certified to another
recognised standard (e.g. BRC Global, BS8555), and the remaining 19% were not certified.
Year-on-year comparisons
Direct comparisons between survey years should not be made, due to the following reasons:
• The most important difference between the 2008 and 2009 surveys and previous surveys is the
SIC used; SIC 2007 was used to group 2008 and 2009 datasets, whilst previous survey data were
grouped using SIC 2003. While 2008 and 2009 survey methodology is broadly consistent with
that of the 2007 survey, there are a small number of companies which are reclassified into a
different main SIC grouping under the new classification.
• In addition, the coverage of the 2007, 2008 and 2009 surveys was restricted to a limited number
of industry sectors, which had previously been more comprehensive.
• Following a review of the survey methodology, outcomes and drivers in 2006, a number of
changes were made to the survey design and layout for subsequent surveys. The key change was
a reduction in the sample size and specific targeting of key sectors for the annual survey with a
more comprehensive survey on a four yearly basis.

Environmental Protection Expenditure by UK Industry: 2009 Survey
49355201 Final Report May 2011 3
• It is possible for one company’s expenditure to affect the final figure to a considerable degree; an
individual company may make a large “one-off” investment during the active survey period and
then return a small or even a zero response in the following survey. This variability along with the
smaller sample frame has led to larger confidence intervals during the reduced surveys in 2007,
2008 and 2009.
The 2007 survey did not include basic & fabricated metal sector, which was included in 2008 and
2009 surveys. Furthermore, the change to SIC 2007 may have affected the results. In light of this,
the following charts include confidence ranges as well as absolute figures for total spending reported
in 2007, 2008 and 2009.
A summary of total expenditure between 2007 and 2009 is presented in Figure E1.
Figure E1. Summary of environmental protection expenditure by UK businesses: 2007 to 2009
2009 2008 2007
Total expenditure (£M)
% of gross
Total expenditure (£M)
% of gross
Total expenditure (£M)
% of gross
Capital expenditure
End of pipe 947
(92 – 1,802)
29 652
(11 – 1,294)
20 185
(33 – 337)
6
Integrated processes 443
(0 – 918)
13 790
(29 – 1,551)
24 522
(0 – 1,139)
16
Sub-Total 1,389
(259 – 2,519)
42 1,442
(420 – 2,465)
45 707
(59 – 1,356)
21
Operational expenditure
In-house 1,222
(318 – 2,126)
37 606
(237 – 974)
19 811
(105 – 1,518)
24
External 628
(212 – 1,044)
19 1,065
(217 – 1,913)
33 1,709
(804 – 2,614)
51
R&D 72
(0 – 177)
2 118
(0 – 275)
4 116
(0 – 301)
3
Sub-Total 1,922
(935 – 2,909)
58 1,788
(779 – 2,797)
55 2,636
(1416 – 3,857)
79
Gross expenditure
Total gross spend 3,311
(1,600 – 5,022)
100 3,231
(1,368 – 5,093)
100 3,344
(1,814 – 4,873)
100
By-products income 18
(0 – 42)
1 11
(0 - 22)
0 104
(0 – 275)
3
Total net expenditure
3,293
(1,559 – 5,027)
- 3,220
(1,357 – 5,082)
- 3,239
(1,700 – 4,778))
-
Total cost savings 146 - 106 - 94 -
Note: Comparisons between years should be treated with caution.
End-of-pipe Capex shows an increase, but a larger decrease for integrated processes has resulted in
an overall decrease for total Capex. An increase in end of pipe expenditure may have resulted due to

Environmental Protection Expenditure by UK Industry: 2009 Survey
49355201 Final Report May 2011 4
process operators focussing their budget and spend on emissions abatement as apposed to investing
in new process / production plant and equipment due to economic uncertainty.
Total Opex has increased compared to 2008, with a shift in expenditure to in-house services and
away from external parties, but with a decrease in R&D spend. This shift may be attributed to less
outsourcing / buying in of services and more internal maintenance of equipment and an increase in
internal training, so having the in-house expertise as appose to needing to use a third party; together
with an increased focus on resource efficiency, including waste and water minimisation resulting in a
reduction in the disposal costs associated with solid and liquid waste and wastewater. The decrease
in research and development (R&D) spend may also be linked to economic uncertainty.
Cost savings show an increase which can be associated with campaigns and efforts associated with
resource efficiency, including waste and water minimisation, product reworking / reuse. The increase
in by-product revenue may be associated with Environment Agency/WRAP quality protocols end of
waste criteria being developed and Environment Agency Regulatory Position Statements providing
regulatory clarification on, if and when, a waste ceases to be a waste.
Industrial symbiosis may also have contributed to the by-product revenue increase, bringing together
separate industries and organisations from all business sectors with the aim of improving cross
industry resource efficiency and sustainability; for example involving the physical exchange of
materials and/or by-products.
A breakdown of total expenditure by key industry sectors between 2007 and 2009 is presented in
Figure E21.
Figure E2. Total environmental expenditure by industry sector: 2007 to 2009.
0
10
20
30
40
50
60
70
80
90
Min
ing a
nd
Quarr
yin
g
Food,
Bevera
ges
& T
obacco
Paper
Pro
ducts
Coke &
Refined
Petr
ole
um
Basic
&
Fabricate
d
Meta
ls
Chem
ical and
Pharm
aceuticals
Ele
ctr
city,
Gas
and W
ate
r
Pro
po
rtio
n o
f T
ota
l S
pen
d (
%)
2007
2008
2009
1 It is important to note that basic and fabricated metals was not included in 2007, resulting in a zero value in
figure E2.

Environmental Protection Expenditure by UK Industry: 2009 Survey
49355201 Final Report May 2011 5
Of the industry sectors covered in the 2009 survey, the primary spending sector was, by far, the
Electricity, Gas, and Water sector (81% of total expenditure). Followed by Food Products and
Beverages and Tobacco Products with 10% share of total expenditure in 2009.
Figures E3 and E4 show the expenditure across environmental media for operating and capital
expenditures between 2007 and 2009.
Figure E3. OPEX by environmental media: 2007 to 2009.
0
10
20
30
40
50
60
Water Air So lid Waste Soil/
Groundwater
No ise Nature Other
Media
Pro
po
rtio
n o
f T
ota
l S
pe
nd
(%
)
2007
2008
2009
Note: ‘Other’ includes, for instance, environmental regulatory charges.
Opex was the highest by media for water followed by solid waste. Water shows a large increase
compared to 2008 and ‘Other’ a large decrease, which may be associated with definition
interpretation, for example associated with site infrastructure/maintenance.

Environmental Protection Expenditure by UK Industry: 2009 Survey
49355201 Final Report May 2011 6
Figure E4. CAPEX by environmental media: 2007 to 2009.
0
10
20
30
40
50
60
70
80
Water A ir Solid Waste Soil/
Groundwater
Noise Nature Other
Media
Pro
po
rtio
n o
f T
ota
l S
pen
d (
%)
2007
2008
2009
Note: ‘Other’ includes, for instance, environmental regulatory charges.
Capex was the highest by media for water followed by air, which were also the highest for end of
pipe and integrated expenditure, end of pipe being the larger amounts for both media; suggesting
larger investments in wastewater/aqueous wastes treatment, possibly associated with meeting
compliance limits and water reuse and recycling in on site processes; and air emissions abatement to
meet compliance limits and possibly associated with continuous automated monitoring equipment.
The continuing increase of capital expenditure on water is likely to be driven by legislation - primarily
permitting regulations (e.g. the Water Framework Directive, and the Environmental Permitting
Regulations) - which imposed increasingly stringent environmental standards for emissions to air, and
water and wastewater treatment, and have also extended to the industry sectors that are subject to
process-related regulation.
Environmental Management Systems
In 2009, 81% of surveyed companies had implemented an environmental management system
(EMS). Of the EMS in place, 63% were ISO14001 certified, 37% were certified to another recognised
standard (e.g. BRC Global, BS8555), and the remaining 19% were not certified.
Figure E5 presents the types of environmental management systems used by different industries,
i.e. and where ISO14001-certified EMS, an EMS certified to another recognised standard, or an
uncertified (‘in-house’) EMS.

Environmental Protection Expenditure by UK Industry: 2009 Survey
49355201 Final Report May 2011 7
Figure E5. Types of EMS by SIC Sector
20% 30% 40% 50% 60% 70% 80% 90% 100%
Mining & Quarrying
Food, Beverages & Tobacco
Paper & Pulp
Coke & Refined Petrol
Chemical & Pharmaceuticals
Basic & Fabricated Metals
Electricity, Gas & Water
EMS Percentage Uptake
ISO14001
non-ISO
Other
Companies in the Basic & Fabricated Metal and Electricity, Gas & Water sectors were most likely to
have an EMS in place (100%). Of the sectors surveyed, the former were most likely to have their own
in-house system, whilst the latter were most likely to have a certified EMS (100%).

Environmental Protection Expenditure by UK Industry: 2009 Survey
49355201 Final Report May 2011
8
1 INTRODUCTION
This report presents the results of the thirteenth annual survey commissioned by the Department for
Environment, Food and Rural Affairs (Defra) and undertaken by URS Corporation Limited (URS), to
estimate expenditure by UK industry on environmental protection in 2009. Previous surveys were
carried out in 1994 (a pilot survey), 1997, and from 1999 to 2008.
In 2009, the survey was distributed to total of 974 companies across the Mining and Quarrying; Food
Products and Beverages and Tobacco Products; Pulp and Paper; Coke and Refined Petroleum; Basic
and Fabricated Metals; Chemicals and Pharmaceuticals and the Electricity, Gas and Water sectors, as
defined by the UK Standard Industry Classifications for Business (SIC) in 2007.
The following sections of the report summarise analysis findings from the 2009 questionnaires
returned by participating UK companies. The 2009 data is presented alongside 2007 and 2008
Direct comparisons between survey years should not be made, due to the following reasons:
• The most important difference between the 2008 and 2009 surveys and previous surveys was the
change to the SIC used. The main classification system used to analyse the 2008 and 2009
datasets was SIC 2007, which is the latest system available reflecting the changes in the UK
industry. In previous years, the SIC 2003 system had been used; while the survey methodology
is kept consistent with the 2007 survey, there are a small number of companies which are
reclassified into a different main SIC grouping under the new classification. This is not thought to
affect the main results and comparisons with previous years should generally be possible.
• In addition, the coverage of the 2007, 2008 and 2009 surveys was restricted to a limited number
of industry sectors, which had previously been more comprehensive.
• Following a review of the survey methodology, outcomes and drivers in 2006, a number of
changes were made to the survey design and layout for subsequent surveys. The key change was
a reduction in the sample size and specific targeting of key sectors.
• The process of generating estimates of sectoral expenditure means that it is possible for one
company’s expenditure to affect the final figure to a considerable degree; it is possible that an
individual company may make a large “one-off” investment during the active survey period and
then return a small or even a zero response in the following survey. This variability along with the
smaller sample frame has led to larger confidence intervals during the reduced surveys in 2007,
2008 and 2009.
The 2007 survey did not include the Basic & Fabricated Metal sector, which was included in 2008 and
2009 surveys. Furthermore, the change to SIC 2007 may have affected the results. In light of these
issues, comparisons include confidence ranges for the total spending reported in each year, as well as
absolute figures. However, comparisons between years should still be treated with caution.
Further information regarding modifications and changes is provided in Section 2.1.
1.1 OBJECTIVES
The primary objectives of the study are:
• To provide Defra with the data from which annual estimates of environmental protection
expenditure by UK industry could be calculated; and

Environmental Protection Expenditure by UK Industry: 2009 Survey
49355201 Final Report May 2011
9
• To enable the UK Government to meet the requirements of the European Union (EU) Structural
Business Statistics Regulation 58/97, which provides a tool for regular data collection on the
variables and economic activities and is designed to give information on the service sector.
In addition to these broad objectives, annual data from the survey can be used to assess how
expenditure is changing and to compare the levels of expenditure of UK industries relative to other
EU countries. The data enable companies and trade associations to benchmark their own
environmental spending against that of the industry as a whole, both in the UK and the EU.
1.2 DEFINITION OF ENVIRONMENTAL PROTECTION EXPENDITURE
The Statistical Office of the European Community defines environmental protection expenditure as:
‘…the sum of capital and current expenditure on environmental protection activities.
Environmental protection is an action or activity (involving the use of equipment, labour,
manufacturing techniques and practices, information networks or products) where the main
purpose is to collect, treat, reduce, prevent, or eliminate pollutants and pollution or any other
degradation of the environment resulting from the activity of the company. Environmental
protection expenditure may relate to activities that generate marketable by-products, or results
in savings, or are financed by subsidies or capital allowances. In such cases, environmental
protection expenditure should be reported gross of any such cost offsets.’
Environmental protection expenditure includes: expenditure to reduce or prevent emission to air and
water; expenditure to protect or clean up soil and groundwater; expenditure to prevent noise and
vibration; and expenditure to reduce, treat and dispose of waste materials. Expenditure may be
operating expenditure (OPEX) or capital expenditure (CAPEX).
OPEX includes the operating costs of a company’s own environmental protection equipment and
services and also payments to others for environmental protection services (including waste
disposal and sewage treatment).
CAPEX consists of end-of-pipe expenditure and expenditure on integrated processes. End-of-
pipe capital expenditure is defined as expenditure on equipment used to treat, handle, measure or
dispose of emissions and wastes from production. Examples include effluent treatment plants,
exhaust air scrubbing systems and solid waste compactors.
CAPEX on integrated processes relates to new or modified production facilities designed to
integrate environmental protection into the production process. This might include adaptation of an
existing installation/process whereby the integrated expenditure is then the total purchase cost of the
adaptation. It also includes installing a new process in which the design takes environmental
protection into account. In this case, the expenditure counted is only the extra cost compared with
installing a less environmental friendly alternative.
Energy costs are not included in the definition of environmental protection expenditure, except where
energy is specifically used to run environmental protection equipment or services. Expenditure on
health and safety equipment or services is also excluded.
1.3 SURVEY SCOPE AND BACKGROUND
The current 2009 survey covers expenditure incurred during the financial year April 2009 to March
2010. In accordance with the EU Regulations, industries that have been surveyed are those in NACE2
2 NACE: General Industrial Classification of Economic Activities within the European Communities (the EC statistical office (Eurostat) classification scheme of economic activities).

Environmental Protection Expenditure by UK Industry: 2009 Survey
49355201 Final Report May 2011
10
sections C, D and E (extraction, manufacturing, energy and water supply). Therefore, in 2009, 974
companies were invited to participate in the survey, across the following industry sectors:
• Mining & Quarrying
• Food Products & Beverages, and Tobacco Products
• Pulp and Paper
• Coke & Refined Petroleum
• Basic & Fabricated Metals
• Chemicals & Pharmaceuticals
• Electricity, Gas & Water
Expenditure estimates are presented for the following:
• In-house and external operating costs (e.g. research and development, regulatory charges etc)
• End-of-pipe capital investments;
• Integrated or ‘clean’ technology capital investments
• Income and savings (e.g. the sale of environmental protection by-products)
This expenditure is also reported by the environmental media to which they relate, as shown below:
• Wastewater: Collection and transport of wastewater, the prevention or reduction in quantity of
wastewater and of substances in wastewater, the prevention of incidental water pollution, the
treatment of cooling water before draining to the surface or groundwater and monitoring of
surface water.
• Air: Prevention or reduction of gaseous, liquid or particulate emissions to the atmosphere, and
the monitoring of air emissions.
• Solid Waste: Prevention or reduction of waste, including the collection, transport, treatment and
disposal and monitoring of waste.
• Soil/groundwater: Decontamination of polluted soils and cleansing of polluted groundwater.
Includes the protection of soil and groundwater against pollution infiltration, monitoring of soil
and groundwater, and the transport and disposal of contaminated soil.
• Noise/vibration: Measures to decrease noise and vibration levels at source, to isolate receivers
from noise/vibration and the monitoring of levels. Protection of the workplace is excluded.
• Nature protection: Protection of species, landscapes and habitats; rehabilitation of damaged
landscapes due to past or current actions. Reforestation is included.
This survey succeeds the Defra surveys carried out in 1997 and 1999 to 2008, and research on
environmental protection expenditure in 1994 (pilot study). The reports from these surveys can be
downloaded at: http://www.defra.gov.uk/statistics/environment/environmental-survey/survey-results/
1.4 REPORT STRUCTURE
This report consists of the following sections:
Section 1 Introduction
Section 2 Survey Methodology and Preparation
Section 3 Conducting the Survey

Environmental Protection Expenditure by UK Industry: 2009 Survey
49355201 Final Report May 2011
11
Section 4 Analysis of Responses
Section 5 Survey Results and Analysis
Section 6 Recommendations for Future Surveys
This main report is supplemented by detailed annexes, which are presented as separate documents:
Annex 1 Survey, Technical Guidance Note and Cover Letters
Annex 2 Validation of Responses
Annex 3 Response Codes for Sorting Correspondence
Annex 4 Drivers behind Participation
Annex 5 Output of Data Analysis
Annex 6 Grossing-up Procedure
Annex 7 Method for Derivation of Standard Error and Confidence Intervals
The report and annexes can be downloaded from Defra’s website:
http://www.defra.gov.uk/statistics/environment/environmental-survey/survey-results/
Environmental Protection Expenditure by UK Industry: 2009 Survey
49355201 Final Report May 2011
12
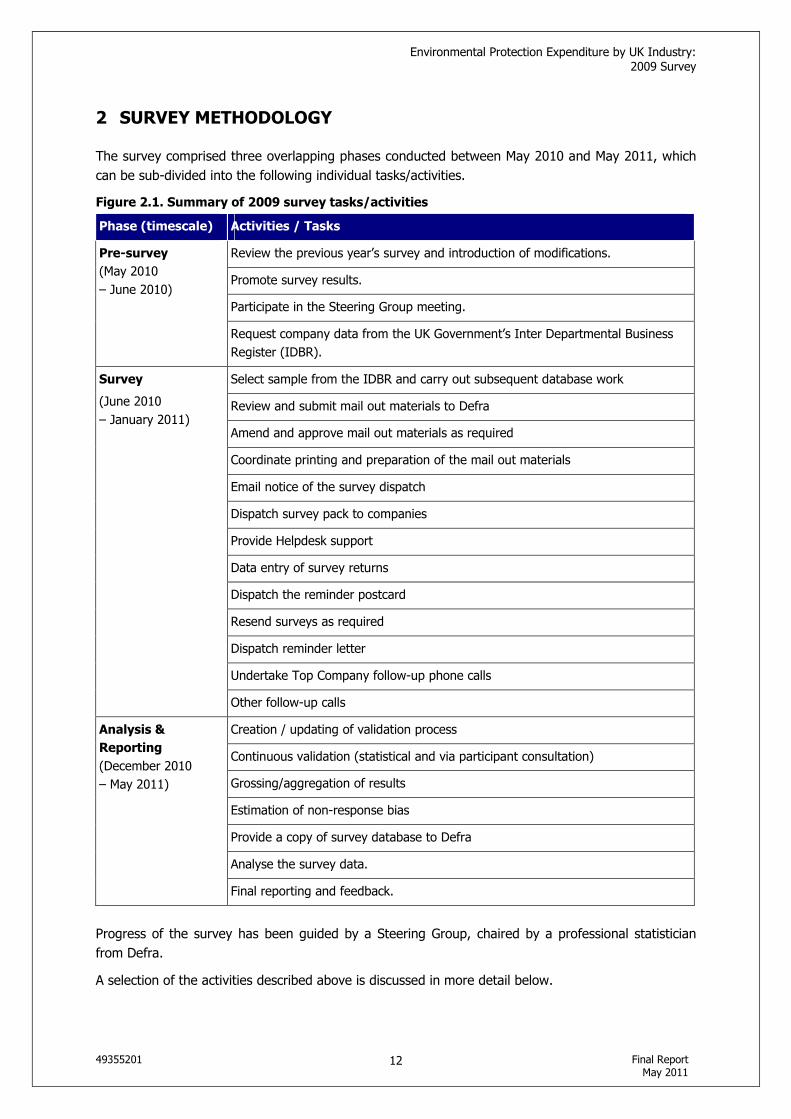
2 SURVEY METHODOLOGY
The survey comprised three overlapping phases conducted between May 2010 and May 2011, which
can be sub-divided into the following individual tasks/activities.
Figure 2.1. Summary of 2009 survey tasks/activities
Phase (timescale) Activities / Tasks
Review the previous year’s survey and introduction of modifications.
Promote survey results.
Participate in the Steering Group meeting.
Pre-survey
(May 2010
– June 2010)
Request company data from the UK Government’s Inter Departmental Business
Register (IDBR).
Select sample from the IDBR and carry out subsequent database work
Review and submit mail out materials to Defra
Amend and approve mail out materials as required
Coordinate printing and preparation of the mail out materials
Email notice of the survey dispatch
Dispatch survey pack to companies
Provide Helpdesk support
Data entry of survey returns
Dispatch the reminder postcard
Resend surveys as required
Dispatch reminder letter
Undertake Top Company follow-up phone calls
Survey
(June 2010
– January 2011)
Other follow-up calls
Creation / updating of validation process
Continuous validation (statistical and via participant consultation)
Grossing/aggregation of results
Estimation of non-response bias
Provide a copy of survey database to Defra
Analyse the survey data.
Analysis &
Reporting
(December 2010
– May 2011)
Final reporting and feedback.
Progress of the survey has been guided by a Steering Group, chaired by a professional statistician
from Defra.
A selection of the activities described above is discussed in more detail below.

Environmental Protection Expenditure by UK Industry: 2009 Survey
49355201 Final Report May 2011
13
2.1 MODIFICATIONS INTRODUCED IN THE 2009 SURVEY
Several modifications that were introduced during previous surveys were carried through to the 2009
survey, which in particular sought to improve awareness, help with definition issues and widen
ownership of the survey. These include, for example, the following activities:
• Top Companies (specifically selected based on their employee number and turnover as well as if
they had responded to a number of previous surveys) received a slightly different cover letter to
the other recipients, which emphasised different issues.
• Prior to the launch of the survey, an e-mail was sent out to all companies that had responded to
the 2008 survey. The e-mail invited each company to participate in the survey and also to
provide information from the previous survey. This enabled the company to prepare for the
survey and provided the Helpdesk with the right contact details.
In addition, 2009 survey questions relating to environmental management systems (EMS) were
slightly amended to enable more comparable responses. Other minor modifications made to the
survey are described in the Figure 2.2 below.
Figure 2.2 Changes to the 2009 Questionnaire Design
Section / Question Modification
Instructions Helpdesk email address Email address simplified to [email protected]
Contact details
Company name Space added for respondents to specify the company name.
Contact details
Company reference number
Company reference number added to ‘Contact Details’ section.
1.1 (a) In-house operating costs
Narrative added to remind respondents not to include wages and bills etc.
1.1 (a) In-house operating costs
Title amended to ‘In-House Environmental Operating Costs’.
1.2 Operating costs paid to external organisations
Boxes B and C indicated as ‘minimum responses”, and the information for them can be found on waste and water bills.
1.2 Operating costs paid to external organisations
Box added so companies can explain whether the cost includes water supply and removal of effluent.
1.2 Operating costs paid to external organisations
Reference amended from ‘IPC Authorisation’ to ‘Environmental Permit’.
2.1 - 2.2 Capital expenditure ‘Energy efficiency’ and ‘climate change’ tick-boxes added as a reason for Capex spends.
2.3 Reason for capital expenditure
‘Financial savings’ have been added as a potential reason for Capex spends.
2.3 Reason for capital expenditure
Title amended to ‘Main Reason for Environmental Capital Expenditure’.
3.1 Cost savings and income
Text clarified (‘annualised’ changed to ‘annual’)
3.1 Cost savings and income
Units of measurements amended to include financial cost.
4.3 a-c EMS costs Clarification of questions and amendments made to layout.

Environmental Protection Expenditure by UK Industry: 2009 Survey
49355201 Final Report May 2011
14
2.2 SAMPLING METHODOLOGY
The sampling procedure was designed to target the sectors where the expenditure would be greatest,
based on feedback and findings from previous surveys. In 2009, 974 companies across the relevant
SIC 2007 sectors were selected from the IBDR sample data (see Figure 2.2). The respective SIC
2003 codes are provided for reference only.
Figure 2.2. Industry sectors covered by the 2009 survey
SIC
2007
Industry SIC
2003
Industry
05 - 09 Mining & Quarrying 10 - 14 Mining & Quarrying
10 - 12 Food Products & Beverages, Tobacco
Products
15 - 16 Food Products & Beverages, Tobacco
Products
17 Paper and Pulp 21 - 22 Pulp & Paper, Publishing & Printing
19 Coke & Refined Petroleum 23 Coke, Petroleum & Nuclear Fuel
24 - 25 Basic & Fabricated Metals 27 - 28 Basic Metals & Metal Products
20 - 21 Chemicals & Pharmaceuticals 24 Chemicals & Chemical Products
35 - 36 Electricity, Gas & Water 40 - 41 Electricity, Gas & Water
To maintain a degree of comparability between surveys before and after the SIC revision in 2008, it
was decided that SICs 19 and 35-36 (Coke & Refined Petroleum and Electricity, Gas & Water) would
be sampled for all companies with 10 or more employees. SIC 05-09 (Mining & Quarrying) would be
sampled for companies with 50 or more employees and all the remaining sectors would be restricted
to just companies with 200 or more employees.
2.3 DATABASE DESIGN
Survey data has been collated and stored in an Access database. The database was intended for use
by URS personnel:
To gather information from postal questionnaires and other correspondence, to carry out continuous
validation checks of the data entry process and to record all the phone calls made to the responding
companies when confirming the data.
• To conduct statistical analysis of each year’s data
There are a number of advantages of building the validation checks into the data entry system:
• Checks could be run more frequently
• The results of any follow up calls or validation changes were recorded. The validation tests took
account of the data types and conversions
• There was no delay between the data entry and the return of the validation checks
• Companies could be contacted promptly after returning their completed questionnaires with any
queries.
After the validation tests were run, the results were stored for manual validation. The records within
the list would not change until the validation tests were run again.

Environmental Protection Expenditure by UK Industry: 2009 Survey
49355201 Final Report May 2011
15
Details of the validation process are presented in Annex 2.

Environmental Protection Expenditure by UK Industry: 2009 Survey
49355201 Final Report May 2011
16
3 CONDUCTING THE SURVEY
3.1 Methodology
The stages involved in the survey implementation are summarised in Figure 3.1.
Figure 3.1. Survey Implementation Summary
Activity Number of
companies involved
Description
Pre-survey email 69
Prior to the survey questionnaire being launched, an email was sent out to all companies that responded to the 2008 survey, were included in the 2009 survey and for whom email addresses were held. The email invited the company to participate in the current survey and also provided summary information from the previous survey.
Survey questionnaire 974 The questionnaire was distributed as a package comprising a cover letter, a questionnaire, a fax back form, relevant Technical Guidance Notes and a freepost envelope.
Post-survey postcard 893
This first reminder mail-out increased the volume of calls to the Helpdesk requesting assistance and survey resends.
The reminder postcard was not sent to companies that had already returned the survey or declined to participate.
Reminder letters 861 This reminder mail out represents 90% of the companies initially surveyed, and produced an increase in calls to the Helpdesk.
Top company questionnaire received
30 The Top Companies were approached via a series of dedicated telephone calls.
Number of questionnaires received
171
This equates to an overall response rate of 17.8%.
The volume of questionnaires returned was highest between the 8th and 9th weeks of the survey, corresponding with the written and phone call reminders.
Companies removed from sample
7 Seven companies were removed from the sample after validation checks.
* A number of companies were contacted more than once.
One of two types of cover letter was included in the survey package depending on the category of the
company:
• ‘Top Companies’: The 50 ‘top companies’ by turnover and the ‘top 50 companies’ by number of
employees were selected from the IBDR data (with some organisations featuring in both). In
addition, companies with over 250 employees in SICs 05-09, 10-12, 17, 19 and 35-36 were
included. In total, 164 ‘top companies’ were provided with a tailored cover letter.
• General companies: The letter emphasised potential benefits of participation, and also
highlighted that the information collated in the survey might be used to satisfy the corporate
governance requirements.
Examples of the questionnaire, all cover letters and the Technical Guidance Notes are provided in
Annex 1.

Environmental Protection Expenditure by UK Industry: 2009 Survey
49355201 Final Report May 2011
17
3.2 TOP COMPANY FOCUS
The focus on the Top Companies was changed from a ‘Top 100 interviews’ in 1999 to a ‘Dedicated
Top Company Follow-up’ for the 2000 survey. Owing to its success in increasing participation levels,
the dedicated Top Company follow-up (i.e. repeat calls etc) was continued for all subsequent surveys.
In order to increase the response rate, the Top Companies that had stated that they would fill in the
survey but had not sent it back, were contacted at the end of the survey period in order to let them
know the surveys would still be accepted.
Since the adoption of this Top Company follow up approach the following advantages have been
consistently identified which has led to this being an integral part of the survey design each year:
• Feedback received from companies is an integral part of the questionnaire design for the
following year.
• Organisations were pleased to be considered as Top Companies and owing to the classification
said that they would do their best to participate in the survey.
• The follow-up telephone conversations were helpful in data validation and quality control process.
• The calls also provided an insight into the way companies had interpreted the questions and
answered them.
• Key expenditure issues that were particularly relevant to the company were identified and might
be used for future reference during validation.
• The telephone calls enabled the survey team to build on their existing contact lists, and helped
minimise future issues normally experienced in identifying and contacting the right person within
the different organisations.
• The calls also helped to establish a good working relationship with the company to help the
survey process both for the current year and those years to come.
In previous years, the reasons for non-responses included a lack of interest or inability to complete
the survey. Therefore, in order to improve participation, efforts were made to increase the profile of
the survey during the Top Company telephone calls; for example, by explaining the purpose and
objectives of the survey and offering as much assistance as possible.
3.2.1 Additional findings from the Top Company follow-up
The following were the key findings from the reminder call phase for the Top Companies:
• The most common reason for declining to participate was a lack of available resources or time to
complete the survey. The second most common reason for declining was that the company did
not have the required accounting procedures in place.
• Requests for resends were particularly prevalent where questionnaires had been sent to unnamed
persons; calls made to the Top Company helped to establish named contacts.
Through making the following up calls 110 companies were successfully contacted and were ‘closed
out’ compared with 121 companies in 2008. Closed out means that the appropriate person was
contacted and it was confirmed that they had either:
• Returned their survey to the address given on the form
• Received the survey and would be returning it shortly and definitely by the extended
deadline.

Environmental Protection Expenditure by UK Industry: 2009 Survey
49355201 Final Report May 2011
18
• Not received a copy of the survey, or had mislaid the copy they were sent and would like to
be issued with a replacement (in the majority of these cases copies were issued by e-mail, a
few were issued by post or fax).
• Would not be returning their survey due to various factors including lack of time and
personnel, inability to obtain the information required and company policy not to complete
non-compulsory surveys.
3.3 HELPDESK SUPPORT
A Helpdesk, with direct phone line, fax and email, was available to participating companies
throughout the survey period. Companies were encouraged to use any or all of these methods to
contact a member of the URS survey team.
Contact made through the Helpdesk provided an insight into the information from which the data had
been derived, allowing the data to be validated more efficiently and feedback to be obtained from
companies regarding their individual experiences with the survey.
These facilities, in conjunction with the website, have proved to be a valuable part of the survey
process. The feedback provided has enabled the survey team to find the reasons for participation
and constraints identified by potential survey participants. Annex 4 identifies the main drivers
behind participation and also the reasons why companies declined to participate. This feedback will
be utilised when designing future surveys.
Companies that used the Helpdesk service commented that it had provided useful information,
clarification and assistance in completing the survey form. In addition, the Helpdesk phone calls were
utilised to persuade companies to respond to the questionnaire even if they had thought that the
survey was not relevant to them.
The website has been maintained and continually updated throughout the year. The website address
is: http://www.defra.gov.uk/statistics/environment/environmental-survey/.
The website has been used in conjunction with the Helpdesk to provide companies with additional
copies of the questionnaire, technical guidance notes and other information relating to the survey.
Where appropriate companies were directed to the website in order to obtain another copy of the
2009 survey or to download online a questionnaire. When survey resends were requested the
website was used as a primary source of providing another copy of the questionnaire, a copy sent by
e-mail and fax was used as a secondary source and a postal copy was only offered as a final resort.
A web-based questionnaire, created in 2007 and 2008 has continued to be used. This approach was
introduced in 2005, but not used due to technical problems for the 2006 survey.

Environmental Protection Expenditure by UK Industry: 2009 Survey
49355201 Final Report May 2011
19
4 ANALYSIS OF RESPONSES
4.1 Response Rates
From a sample of 974 companies, the total number of validated responses was 171, giving a
response rate of 18%. The response rates are summarised in Figure 4.1 below.
Figure 4.1. Survey response rates: 2007 to 2009
2009 2008 2007
Questionnaires sent out 974 1,008 955
Questionnaires returned* 171 204 175
Response rate (%) 18 20 18
*Only responses used for analysis are counted here.
A summary of response rates by individual sector is shown in Figure 4.2.
Figure 4.2. Response rates by industry sector: 2007 to 2009.
0 5 10 15 20 25 30
Mining and Quarrying
Food Products, Beverages
& Tobacco Products
Pulp & Paper
Coke & Refined Petrol
Basic and Fabricated
Metals
Chemicals and
Pharmaceuticals
Electricity, Gas and Water
Response %
2009
2008
2007
*The Basic and Fabricated Metals sectors were not surveyed in the 2007.
4.1.1 Weighted Response Rates
The overall response rate given above assumes each company as an equal contributor to the final
figures. The sample frame for previous survey years was designed to target higher spending sectors
and the largest employers. This meant that the effective response rate measures in some cases were
somewhat higher, in terms of expenditure covered.

Environmental Protection Expenditure by UK Industry: 2009 Survey
49355201 Final Report May 2011
20
The 2009 sample frame was designed to take a census of companies over a given size within a
smaller set of highest spending industry groups. The effective response rate measured by the
number of employees in the sampled companies was 21%, although it should be noted that this
might be influenced by the fluctuations in the numbers employed during the year of the survey. The
effective response rate measured by spending proportion was 65%; the sample frame was geared to
the largest employers in the highest spending sectors with the aim of increasing the coverage of
expenditure.
4.1.2 Response Bias
As in previous years’ surveys, the following potential response bias has been identified in the 2009
survey:
• Companies with zero or low expenditure are more likely to respond because they have less of the
questionnaire to complete.
• Companies with dedicated environmental resource are more likely to respond, and have greater
data availability.
• Companies that have completed the survey in previous years are more likely to participate and
submit a completed questionnaire.
The effect of these possible biases is likely to be reduced by the stratified sampling and grossing
arrangements (refer to Annex 6 for further details). This means that using a relatively large number
of cells (determined by size of company and SIC) to categorise companies with similar characteristics
that any bias is then ‘contained’ within the cell.
The repetition of the survey over a number of years has allowed for measures to be taken to obtain a
better understanding of the potential and likely significance of these response biases. For example, a
number of companies respond and state they will not participate, as they have zero environmental
expenditure.
4.2 Methodology
Caution should be exercised in comparing datasets from different survey years (e.g. 2007, 2008 and
2009) for a number of reasons. For instance:
• The ranges indicated by the confidence intervals for the total expenditure were relatively large,
owing to the small sample size. Hence, the absolute values should be compared with caution.
• The process of generating estimates of expenditure from the sample sets means that it is possible
for one company’s expenditure to affect the final figure to a considerable degree, e.g. through a
large ‘one-off’ investment (e.g. capital equipment upgrade). This principally relates to capital
expenditure rather than operating expenditure, which would be expected to be generally more
consistent from one year to the next.
Details of the derivation of standard error and confidence interval are presented in Annex 7.

Environmental Protection Expenditure by UK Industry: 2009 Survey
49355201 Final Report May 2011
21
Where a single response distorts the calculated total, the company has been excluded from the
grossing procedure and added back at a later stage. The decision to do this is undertaken on a case
by case basis. The 2009 data responses received from seven companies were identified as potential
outliers, which could potentially distort overall expenditure figures; these responses have been
grossed in accordance with Annex 6.
4.3 Survey Completion Time
Responses indicated that companies with less than 50 employees took an average of only 50 minutes
to complete the survey, whereas those with between 50 and 250 employees spent an of average 2
hours 17 minutes completing the questionnaire (comparative to the 2008 average of 2 hours 2
minutes). Companies with 250 or more employees took an average completion time of 2 hours 39
minutes.
The time taken to complete the questionnaire by company size (i.e. number of employees) can be
seen in Figure 4.3 below.
Figure 4.3. Completion time by company size: 2007 to 2009
0:00
0:30
1:00
1:30
2:00
2:30
3:00
3:30
4:00
4:30
5:00
<50 50-249 250-499 >500
Tim
e T
aken
(H
ou
rs a
nd
Min
ute
s)
2007
2008
2009

Environmental Protection Expenditure by UK Industry: 2009 Survey
49355201 Final Report May 2011
22
5 SURVEY RESULTS AND ANALYSIS
5.1 Total expenditure
An estimated total of £3.3 billion was spent by UK industry on environmental protection in 20093
In 2009, OPEX accounted for approximately 58% of the total, with CAPEX making up the remainder.
Spending on internal processes was 64% (34% in 2008). External operating costs accounted for 33%
of OPEX (60% in 2008). Spending on integrated processes accounted for 32% of CAPEX in 2009,
compared to 55% in 2008 for the comparable sectors.
A summary of total expenditure is presented in Figure 5.1 in conjunction with equivalent data from
the 2007 and 2008 surveys for comparison. Ranges indicating the 95% confidence intervals
associated with each value are provided in parenthesis where available. Detailed tables of the
expenditure can be found in Annex 5.
Direct comparisons between survey years should not be made because the estimates are subject to
wide confidence intervals; the sample size has changed considerably and because of changes made
over time to the questionnaire design and estimation procedures. In light of this, comparisons have
been shown as percentage shares of the total spending reported in each year, as well as absolute
figures.
Figure 5.1. Summary of total expenditure: 2007 to 2009
2009 2008 2007
Total expenditure (£M)
% of gross
Total expenditure (£M)
% of gross
Total expenditure (£M)
% of gross
Capital expenditure
End of pipe 947
(92 – 1,802)
29 652
(11 – 1,294)
20 185
(33 – 337)
6
Integrated processes 443
(0 – 918)
13 790
(29 – 1,551)
24 522
(0 – 1,139)
16
Sub-Total 1,389
(259 – 2,519)
42 1,442
(420 – 2,465)
45 707
(59 – 1,356)
21
Operational expenditure
In-house 1,222
(318 – 2,126)
37 606
(237 – 974)
19 811
(105 – 1,518)
24
External 628
(212 – 1,044)
19 1,065
(217 – 1,913)
33 1,709
(804 – 2,614)
51
R&D 72
(0 – 177)
2 118
(0 – 275)
4 116
(0 – 301)
3
Sub-Total 1,922
(935 – 2,909)
58 1,788
(779 – 2,797)
55 2,636
(1416 – 3,857)
79
Gross expenditure
Total gross spend 3,311
(1,600 – 5,022)
100 3,231
(1,368 – 5,093)
100 3,344
(1,814 – 4,873)
100
3 The estimate for 2008 was £3.2 billion for comparable sectors.

Environmental Protection Expenditure by UK Industry: 2009 Survey
49355201 Final Report May 2011
23
By-products income 18
(0 – 42)
1 11
(0 - 22)
0 104
(0 – 275)
3
Total net
expenditure
3,293
(1,559 – 5,027)
- 3,220
(1,357 – 5,082)
- 3,239
(1,700 – 4,778))
-
Total cost savings 146 - 106 - 94 -
Note: Direct comparisons between survey years should be treated with extreme caution.
End-of-pipe Capex shows an increase, but a larger decrease for integrated processes has resulted in
an overall decrease for total Capex. An increase in end of pipe expenditure may have resulted due to
process operators focussing their budget and spend on emissions abatement as apposed to investing
in new or upgraded process / production plant and equipment due to economic uncertainty.
Total Opex has increased overall compared to 2008, with a shift in expenditure to in-house services
and away from external parties, but with a decrease in R&D spend. This shift may be attributed to
less outsourcing / buying in of services and more internal maintenance of equipment and an increase
in internal training or retraining, so having the in-house expertise as appose to needing to use a third
party; together with an increased focus on resource efficiency, including waste and water
minimisation resulting in a reduction in the disposal costs associated with solid and liquid waste and
wastewater. The decrease in research and development (R&D) spend and the shift to internal
resourcing may be linked to economic uncertainty.
Cost savings show an increase which can be associated with campaigns and efforts associated with
resource efficiency, including waste and water minimisation, product reworking / reuse. The increase
in by-product revenue may be associated with Environment Agency/WRAP quality protocols end of
waste criteria being developed and Environment Agency Regulatory Position Statements providing
regulatory clarification on, if and when, a waste ceases to be a waste.
Industrial symbiosis may also have contributed to the by-product revenue increase, bringing together
separate industries and organisations from all business sectors with the aim of improving cross
industry resource efficiency and sustainability; for example involving the physical exchange of
materials and/or by-products.
5.2 EXPENDITURE BY ENVIRONMENTAL MEDIA
This section summarises the amount of expenditure allocated to various environmental protection
categories. Responses are classified under operating expenditure and capital expenditure (refer to
Figures 5.2 - 5.5).
Figure 5.2. Environmental OPEX by Media in 2009
2009 2008 2007
Environmental
media Internal
(£M)
External
(£M) Total (£M) % of total % of total* % of total*
Water 621.7 222.6 844.3 46% 22% 12%
Air 165.4 1.6 166.9 9% 13% 7%
Solid waste 201.3 161.1 362.3 20% 27% 50%
Soil / groundwater 88.4 103.2 191.6 10% 3% 2%
Noise 6.2 0.7 6.8 0% 0% 0%

Environmental Protection Expenditure by UK Industry: 2009 Survey
49355201 Final Report May 2011
24
2009 2008 2007
Environmental media
Internal
(£M)
External (£M)
Total (£M) % of total % of total* % of total*
Nature protection 105.8 0.6 106.5 6% 2% 1%
Other* 33.6 137.9 171.5 9% 32% 28%
Total (£M) 1,222.3 627.6 1,849.9 100% 100% 100%
* Includes regulator charges
The greatest operating spend comprised water protection measures accounting for 46% of total
environmental OPEX, followed by solid waste at 20% of total operating cost (excluding research and
development); these were also the top two media in 2008. Water shows a large increase compared to
2008 and ‘Other’ a large decrease, which may be associated with definition interpretation, for
example associated with site infrastructure/maintenance.
Figure 5.3. Environmental OPEX by Media: 2007 to 2009
0
10
20
30
40
50
60
Water A ir Solid Waste So il/
Groundwater
No ise Nature Other
Media
Pro
po
rtio
n o
f T
ota
l S
pe
nd
(%
)
2007
2008
2009
Note: ‘Other’ includes external expenditure, e.g. regulatory charges.
Figure 5.4. Environmental CAPEX by environmental media: 2009.
Capital Expenditure (£M)
Integrated Expenditure
Environmental
media Integrated End-of-Pipe Total
% of total % of total Integrated
Water 259.3 693.2 952.5 69% 59%
Air 93.2 206.4 299.7 22% 21%
Solid waste 14.7 31.3 46 3% 3%
Soil /groundwater 30.6 2 32.7 2% 7%
Noise 2.8 0.3 3.1 0% 1%

Environmental Protection Expenditure by UK Industry: 2009 Survey
49355201 Final Report May 2011
25
Nature
protection 36.9 0.7 37.6 3% 8%
Other 5.1 12.6 17.7 1% 1%
Total (£M) 442.6 946.5 1,389.20 100% 100%
*Please note that the zero percentages stated in the figure above, may be less than 0.5% due to rounding effects.
Capital expenditure on water management/disposal accounted for over two-thirds of total CAPEX
(69%, £953 million). Followed by air protection measures, with a 22% share of total spend (£300
million).
Figure 5.5. Environmental CAPEX by environmental media: 2007 to 2009
0
10
20
30
40
50
60
70
80
Water A ir Solid Waste Soil/
Groundwater
Noise Nature Other
Media
Pro
po
rtio
n o
f T
ota
l S
pen
d (
%)
2007
2008
2009
Note: ‘Other’ includes external expenditure, e.g. regulatory charges.
Capex was the highest by media for water followed by air, which were also the highest for end of
pipe and integrated expenditure, end of pipe being the larger amounts for both media; suggesting
larger investments in wastewater/aqueous wastes treatment, possibly associated with meeting
compliance limits and water reuse and recycling in on site processes; and air emissions abatement to
meet compliance limits and possibly associated with continuous automated monitoring equipment.
The continuing increase of capital expenditure on water and air is likely to be driven by legislation -
primarily permitting regulations (e.g. the Water Framework Directive, and the Environmental
Permitting Regulations) - which imposed increasingly stringent environmental standards for emissions
to air, and water and wastewater treatment, and have also extended to the industry sectors that are
subject to process-related regulation.
Predictions for future changes are likely to be associated with further implications and drivers
associated with the Environmental Permitting Regulations; Registration, Evaluation, Authorisation and
Restriction of Chemicals (REACH); the Environmental Damage (Prevention and Remediation)
Regulations 2009; Water Framework Directive, and implementing the requirements of the revised

Environmental Protection Expenditure by UK Industry: 2009 Survey
49355201 Final Report May 2011
26
Waste Framework Directive. Other than legislative drivers the cost of fuel both directly and indirectly,
for example waste management logistic transport costs may also have an impact.
5.3 EXPENDITURE BY INDUSTRY SECTOR
Of the industry sectors covered in the 2009 survey, the primary spending sector was, by far, the
Electricity, Gas, and Water sector (81% of total expenditure). Followed by Food Products and
Beverages and Tobacco Products with 10% share of total expenditure in 2009.
Figure 5.6. Total environmental expenditure by industry sector: 2007 to 2009
0
10
20
30
40
50
60
70
80
90
Min
ing a
nd
Quarr
yin
g
Food,
Bevera
ges
& T
obacco
Paper
Pro
ducts
Coke &
Refined
Petr
ole
um
Basic
&
Fabricate
d
Meta
ls
Chem
ical and
Pharm
aceuticals
Ele
ctr
city,
Gas
and W
ate
r
Pro
po
rtio
n o
f T
ota
l S
pen
d (
%)
2007
2008
2009
Note: The Basic and Fabricated Metals sector was not included in the 2007 survey.
5.4 COST SAVINGS AND INCOME
This section summarises the amount of income and savings generated by environmental measures.
Figure 5.7 and 5.8 show the cost savings in 2007, 2008 and 2009. As mentioned earlier,
comparisons between years should be treated with caution.

Environmental Protection Expenditure by UK Industry: 2009 Survey
49355201 Final Report May 2011
27
Figure 5.7. Cost savings: 2007 to 2009
0
10
20
30
40
50
60
70
80
Min
ing a
nd
Quarr
yin
g
Food,
Bevera
ges
& T
obacco
Pro
ducts
Pulp
& P
aper
Coke &
Refined
Petr
ole
um
Basic
&
Fabricate
d
Meta
ls
Chem
icals
&
Pharm
aceuticals
Ele
ctr
icity,
Gas
and W
ate
r
Co
st
Sa
vin
gs
(£
M's
)
2007
2008
2009
Note: The Basic and Fabricated Metals sector was not included in the 2007 survey.
Overall the total cost savings in 2009 were £146 million, significantly more than in 2007 and 2008.
Basic and Fabricated Metals sector recorded the highest level of savings at £69 million (47% of total
cost savings).
Annual cost savings are by environmental media are summarised in Figure 5.8 below.
Figure 5.8. Summary of cost savings: 2007 to 2009
2009 2008 2007
Environmental
Media Total cost
savings (£M) % of Total Total cost
Saving (£M) % of Total Total cost
Saving (£M) % of Total
Raw materials 15.2 10% 18.7 20% 13.1 14%
Water use 10.5 7% 9.4 10% 29.5 31%
Energy use 43.2 30% 26.1 28% 42.4 45%
Waste 72.6 50% 39.5 42% 8.9 10%
Other 4.5 3% 1.2 1% 0.1 0%
Total 145.9 - 95.1 - 94.0 -
The highest cost savings in 2009 were associated with waste management/disposal costs (50% of
total savings); similar to trends in 2008. This was, followed by improved energy usage (30%) and
improvements to the use or substitution of raw materials (10%); again, in line with 2008 trends.
Income received from the sale or redistribution of by-products between 2007 and 2009 is shown in
Figure 5.9 below.

Environmental Protection Expenditure by UK Industry: 2009 Survey
49355201 Final Report May 2011
28
Figure 5.9 Income from by-products (£M): 2007 to 2009.
10
25
40
55
70
85
100
2007
2008
2009
0
2
4
6
8
10
12
Min
ing
an
d
Qu
arr
yin
g
Fo
od
, B
eve
rag
es
& T
ob
acco
Pa
pe
r P
rod
ucts
Co
ke
& R
efin
ed
Pe
tro
leu
m
Ba
sic
&
Fa
bri
ca
ted
Me
tals
Ch
em
ica
l &
Ph
arm
ace
utica
ls
Ele
ctr
icity, G
as
an
d W
ate
r
Income and savings resulting from the sale of by-products in 2009 was £17.5 million, which is much
less than in previous years. The highest saving as a result of by-products was within the Basic and
Fabricated Metals sector (£7 million; 42% of total by-products sale).
Income from by-products (£M’s)

Environmental Protection Expenditure by UK Industry: 2009 Survey
49355201 Final Report May 2011
29
5.5 ENVIRONMENTAL PROTECTION EXPENDITURE BY INDIVIDUAL SECTOR
This section looks at each sector individually, identifies any notable features under the following
headings including a brief analysis discussing trends and drivers of environmental protection
expenditure in 2009:
• Key expenditure: Summary of key data by operating expenditure (OPEX) and capital
expenditure (CAPEX) categories along with the expenditure in 2007, 2008 and 2009.
• Environmental expenditure by media: Expenditure has been subdivided according to media
type (e.g. water, solid waste, noise etc). This is shown in graph form for external, in-house,
integrated and end-of-pipe expenditure.
• Income and savings: Summary of key data by cost savings and by-product sales in expenditure
for 2007, 2008 and 2009.
As mentioned earlier in this report, direct comparisons between survey years are not advisable, as
estimates are subject to wide confidence intervals, sample sizes have changed and modification have
been made to the questionnaire design and estimation procedures. In light of these discontinuities,
comparisons will still be shown but percentage shares of the total spending (e.g. as shown in Figure
E2) are preferable, but should also be treated with caution.
5.5.1 SIC 05 to 09: Mining and Quarrying
The Mining and Quarrying sector has a relatively small number of companies in the UK and there are
several large companies that have responded to the survey in one year and not in the others, which
increases the potential for skewed results.
Estimates of environmental protection expenditure, environmental expenditure by media and income
and savings are provided below for the Mining and Quarrying sector. For this sector, 18 companies
participated in the survey giving a response rate for the sector of 15%, which is equivalent to 11% of
the total survey response.
The most significant and recent regulatory drivers of change in the UK Mining and Quarrying industry
are the Mining Waste Directive, EU Landfill Directive, Integrated Pollution Prevention and Control
(IPPC) Directive and Water Framework Directive.
Key Expenditure
The Mining and Quarrying sector spent approximately £31 million in 2009 on environmental
protection measures, 1% of the total spend for 2009. Environmental expenditure for this sector is
shown in Figure 5.10 for the years 2007, 2008 and 2009. The data is presented separately for
capital and operational expenditure.
Figure 5.10. Expenditure: 2007 to 2009
OPEX (£M) CAPEX (£M) Survey year
In-house External R & D Total End of Pipe Integrated Total
2009 15.0 8.9 0.3 24.1 0.8 6.9 7.7
2008 7.6 25.1 0.8 33.5 31.7 108.0 139.7
2007 69.6 41.8 3.9 115.3 108.6 0.2 108.8
Note: Totals may not add due to the rounding effects. Comparisons between years should be treated with caution because of
the low response rate.

Environmental Protection Expenditure by UK Industry: 2009 Survey
49355201 Final Report May 2011
30
OPEX accounted for 76% of total environmental spending by the Mining and Quarrying sector in
2009. External expenditure in 2009 was higher than in-house costs, maintaining the unpredictability
within OPEX seen over recent years. OPEX reduced from the 2008 levels, maybe as companies
undertook the minimum to be in compliance with the law.
There was a significant reduction in the CAPEX spend in 2009, this could be due to the global
financial crisis
The main driver for environmental expenditure has been for companies to protect their balance
sheets, and so as and when the economy improves and confidence returns to the market the
investment in environment is expected to return.
It should also be noted that the change in survey design and the reduced number of companies
within the sample may be responsible for some variation within results from one survey to the next.
Environmental Expenditure by Media
Environmental expenditure by media for the Mining and Quarrying sector is shown below in Figure
5.11. In previous years, wastewater, solid waste and air quality management were areas where the
majority of spend occurred. The massive reduction in CAPEX means that investment in these areas
has reduced relative to the other areas, and it is considered that this is due to companies only
undertaking the minimum in all the media.
The Mining Waste Directive, currently being transposed into UK law, covers the management of
“extractive waste” resulting from the prospecting, extraction, treatment and storage of mineral
resources and the working of quarries. It may lead to the reduction in waste disposal costs observed
in future surveys as certain materials are no longer classified as waste.
Figure 5.11. Environmental expenditure by media
0
1
2
3
4
5
6
7
Water Air Solid Soil/ Ground
water
Noise Nature
protection
Other
£M
End of Pipe
Integrated
External
In-House
Income and Savings
In 2009, income and savings for the Mining and Quarrying sector was approximately £2.7 million.
This result is shown along with the 2008 and 2007 survey data in Figure 5.12. It should be noted
that the change in survey design and the reduced number of companies within the sample may be
responsible for the variation within results from one survey to the next.

Environmental Protection Expenditure by UK Industry: 2009 Survey
49355201 Final Report May 2011
31
Figure 5.12. Income (from by-products) and savings: 2007 to 2009
Cost savings (£000’s) Income
(£000’s) Survey
Year
Raw material
Water use
Energy use
Waste Other Total By- products
Total (£000’s)
2009 0.1 0.1 1.4 0.0 0.1 1.6 1.1 2.7
2008 0.2 0.3 0.0 0.1 0.1 0.7 0.5 1.2
2007 0.0 0.1 0.0 0.0 0.1 0.2 0.2 0.4
Note: Totals may not add due to the rounding effects. Comparisons between years should be treated with caution because of the low response rate.
Cost savings in the sector for 2009 were £1.6 million, of which the sale of by-products accounted for
approximately 41% of this saving. The magnitude increase in cost savings could be due to the
companies endeavouring to achieve a reduction driven by the economic climate
5.5.2 SIC 10 - 12: Food Products and Beverages, and Tobacco Products
The Food Products and Beverages, and Tobacco Products sector is the largest sector in terms of
response in the 2009 survey, and the sector is at least in part driven by its water intensive nature.
Estimates of environmental protection expenditure, environmental expenditure by media and income
and savings are provided below for the Food Products and Beverages, and Tobacco Products sector.
For this sector, 49 companies participated in the survey giving a response rate of 15%, which is also
equivalent to 29% of the total survey response.
Key Expenditure
The Food Products and Beverages and Tobacco Products sector spent approximately £322 million in
2009 on environmental protection measures, 10% of the total spend for 2009. Environmental
expenditure for this sector is shown in Figure 5.13 for the years 2007, 2008 and 2009. The data is
presented separately for capital and operational expenditure.
Figure 5.13. Environmental expenditure: 2009
OPEX (£M) CAPEX (£M) Survey year
In-house External R & D Total End of Pipe Integrated Total
2009 99.2 182.4 1.7 283.4 13.4 25.0 38.4
2008 135.3 186.9 2.8 325.0 127.8 28.5 156.2
2007 131.2 208.0 4.2 343.4 42.4 71.6 114.0
Note: Totals may not add, due to the rounding effects. Comparisons between years should be treated with caution due to low response rate.
Operating expenditure accounted for approximately 88% of total environmental spending by the Food
Products and Beverages, and Tobacco Products sector in 2009.
With regards to operating expenditure, the external expenditure level observed in 2009 is consistent
with the levels observed in the two previous years. This reflects that, despite a down turn in the
economy, the industry has defined externally provided fixed operating costs such as effluent
treatment costs by third party trade effluent treatment service providers.

Environmental Protection Expenditure by UK Industry: 2009 Survey
49355201 Final Report May 2011
32
Of note is that the level of in-house operating expenditure has reduced. This is thought to be due to
optimisation of operations, due to the tight economic constraints in 2009, and also due to increased
regulator pressure under environmental legislation, e.g. the Environmental Permitting Regulations etc.
The level of capital expenditure for integrated activities, on areas such as process improvements or
manufacturing optimisation, has remained steady from 2008 into 2009. This indicates that there is a
constant baseline of internal process improvements that can be undertaken to streamline and
improve inherent manufacturing operations.
Of particular note is that the level of capital expenditure for end of pipe solutions has shrunk by 90%
from 2008 levels. This is in line with the worsening state of the economy and that the industry, with
low profit margins, was capital averse in 2009.
Owing to the poor economic situation, moving forward into 2010, it is highly likely that the low level
of capital expenditure will continue and that the level of in-house operating expenditure will fall
further.
Environmental Expenditure by Media
Environmental expenditure by media for the Food Products and Beverages and Tobacco Products
sector is shown in Figure 5.14 below. This sector spent £151 million on water protection measures
and £99 million dealing with solid waste in 2009, of which most is accounted for by external operating
expenditure (£91 million). The distribution of expenditure by media in this sector is consistent with
previous years; water and solid waste remain the dominant environmental issues for the industry.
Figure 5.14 Environmental Spending by Media
0
20
40
60
80
100
120
140
160
Water Air Solid Soil/ Ground
water
Noise Nature
protection
Other
£M
End of Pipe
Integrated
External
In-House
The largest spending by media is water, which the sector uses in both the production phase and in
cleaning processes. Most was accounted for by external spending which includes wastewater/effluent
treatment plant equipment, maintenance and discharge costs. A similar result for this sector was
observed in 2007 and 2008.
Similarly, expenditure for solid waste is dominated by external expenditure, which is consistent with
the disposal of solid wastes off site by third party waste disposal providers. Again this result was
observed in the 2007 and 2008 survey.

Environmental Protection Expenditure by UK Industry: 2009 Survey
49355201 Final Report May 2011
33
It is likely that the dominance of spending in the water and solid waste areas will continue into 2010
and beyond, as these areas are an integral part of the manufacturing processes within the industry.
Income and Savings
In 2009, income and savings for the Food Products and Beverages, and Tobacco Products sector was
approximately £30 million in total. Income and savings for this sector are shown in Figure 5.15 for
the years 2007, 2008 and 2009.
Figure 5.15 Income (from by-products) and savings: 2007 to 2009
Cost savings (£000’s) Income (£000’s)
Survey Year
Raw material
Water use
Energy use
Waste Other Total By- products
Total (£000’s)
2009 6.1 2.9 6.5 8.7 2.4 26.6 3.4 30.0
2008 2.2 1.8 2.0 3.8 0.1 9.9 1.0 11.0
2007 2.9 26.5 34.6 4.1 0.0 68.1 97.2 165.3
Note: Totals may not add, due to the rounding effects. Comparisons between years should be treated with caution due to low response rate.
The greatest cost savings are identified in waste disposal costs at a value of approximately £8.7m.
This year’s survey indicates that there is an improvement in savings in each of the cost saving
categories. This may be attributed to improving manufacturing operations against a back-drop of low
profit margins for the industry and also relative to the poor economic position observed in 2009.
It is likely that a greater or similar level of cost savings will be observed in the coming years, owing to
the projected slow economic recovery, as manufacturers may try and consolidate savings through
environmental improvements and process optimisation.
5.5.3 SIC 17: Paper and Pulp
The UK has reduced its pulping capability and imports pulp for a significant proportion of its paper
manufacture. The range of paper products manufactured is extensive, ranging from specialty and
security papers through to bulk printing and writing grades, tissue and newsprint. Key issues for the
sector include energy efficiency, water use, sludge disposal, the quality and mix of waste papers used
for recycling, effluent quality and the trend towards more secondary effluent treatment.
Estimates of environmental protection expenditure, environmental expenditure by media and income
and savings are provided below for the Pulp and Paper sector. For this sector, nine companies
participated in the survey giving a response rate for the sector of 18%, which is equivalent to
approximately 5% of the total survey response.
Key Expenditure
The Pulp and Paper sector spent approximately £48 million in 2009 on environmental protection
measures, slightly more than 1 per cent spent in 2009. Environmental expenditure for this sector is
shown in Figure 5.16 for the years 2007, 2008 and 2009. The data is presented separately for
capital and operational expenditure.

Environmental Protection Expenditure by UK Industry: 2009 Survey
49355201 Final Report May 2011
34
Figure 5.16. Environmental expenditure: 2009
OPEX (£M) CAPEX (£M) Survey year
In-house External R & D Total End of Pipe Integrated Total
2009 16.5 24.4 0.0 40.9 3.1 3.7 6.8
2008 4.0 34.6 0.1 38.7 7.3 0.0 7.3
2007 15.7 30.2 0.9 46.8 0.0 2.1 2.1
Note: Totals may not add, due to the rounding effects. Comparisons between years should be treated with caution due to low response rate.
OPEX accounted for approximately 86% of total environmental spending for the Pulp and Paper
sector in 2009; and showed a small increase on comparison with the 2008 expenditure. Expenditure
is primarily due to external processes, continuing the pattern seen in 2008 and 2007, but to a lesser
extent, as in-house OPEX increased four-fold on the expenditure in 2008, also showing a slight
increase to that in 2007. No expenditure was incurred for R&D, which is a slight reduction to that in
2008.
The sector continues to out source some of its environmental protection services and use third parties
for monitoring and managing their solid and liquid waste disposal. The significant increase in in-house
expenditure combined with the decrease in external Opex may be linked to undertaking more in-
house maintenance and monitoring; and the operation of directly associated activities to the main
production processes, associated with for example waste water treatment, water reuse and recycling
and water minimisation.
In 2009, CAPEX shows a slight reduction compared to the level in 2008, but is still approximately
three-times greater than in 2007. The focus has moved away from the 100% end of pipe expenditure
in 2008 to similar expenditure amounts for both integrated and end of pipe expenditure in 2009.
An increase in integrated expenditure and a reduction in end of pipe expenditure may be linked to
sector process operators focussing their expenditure on modified production facilities, for example
incorporating water reuse; having previously incurred expenditure on the treatment and reuse of
waste water, for example treatment plant and equipment.
Environmental Expenditure by Media
Environmental expenditure by media for the Pulp and Paper sector is shown in Figure 5.17 below.
This sector spent in excess of £26 million on water, waste water and aqueous liquid waste, with the
focus of the expenditure on external OPEX costs. Approximately £12 million was spent dealing with
solid waste, which is the second largest media spend of which most again is accounted for by
external OPEX.
The sector continues to out source some of its environmental protection services and use third parties
for managing their solid and liquid waste disposal, as well as providing water as a process raw
material and for uses associated with utilities. External and in-house OPEX costs comprise the
majority of the expenditure in the two highest spending media, water and solid waste.

Environmental Protection Expenditure by UK Industry: 2009 Survey
49355201 Final Report May 2011
35
Figure 5.17 Environmental Spending by Media
0
5
10
15
20
25
30
Water Air Solid Soil/ Ground
water
Noise Nature
protection
Other
£M
End of Pipe
Integrated
External
In-House
Income and Savings
In 2009, income and savings for the Pulp and Paper sector was approximately £24.7 million; this is
over a three fold increase to the total income and savings in 2008 and 2007. Income and savings for
this sector are shown in Figures 5.18 for the years 2007, 2008 and 2009.
Figure 5.18. Income (from by-products) and savings: 2007 to 2009
Cost savings (£000’s) Income
(£000’s) Survey
Year
Raw material
Water use
Energy use
Waste Other Total By- products
Total (£000’s)
2009 3.2 7.2 13.8 0.1 0.0 24.2 0.5 24.7
2008 6.6 0.0 0.0 0.2 0.0 6.8 0.8 7.6
2007 0.2 0.0 2.4 0.3 0.0 2.9 5.0 7.9
Note: Totals may not add, due to the rounding effects. Comparisons between years should be treated with caution due to low response rate.
Raw material and waste cost savings have halved on comparison to those in 2008, but water use and
energy use have both increased significantly from zero savings in 2008, particularly from
improvements and efficiency gains related to energy use.
Sales of by-products have decreased generating an income of £0.5 million, compared to £0.8 million
in 2008. This may increase in the future as the Environment Agency is currently working on a quality
protocol for end of waste criteria for Paper Sludge Ash (PSA). UK paper mills generate approximately
125,000 tonnes of PSA annually. Currently approximately 70% (approximately 88,000 tonnes) goes to
end uses, such as brick and cement manufacturers, and the remainder is landfilled. Hence waste cost
savings could also increase.
Other than the quality protocol mentioned above predictions for future changes are likely to be linked
with further implications and drivers associated with the Environmental Permitting Regulations and
implementing the requirements of the revised Waste Framework Directive. The cost of fuel is likely to

Environmental Protection Expenditure by UK Industry: 2009 Survey
49355201 Final Report May 2011
36
have both a direct and indirect impact, for example energy use and waste management logistic
transport costs.
Future spend is likely to focus on the requirement to maintain compliance and to increase cost
savings, e.g. thorough resource efficiency and the application of end of waste criteria to waste, to
increase the use and sale of by-products and to increase waste cost savings.
Despite the current economic climate, the size of the UK paper market is growing. Expansion is
planned at existing mills and two new newsprint mills are or will soon be operating.
5.5.4 SIC 19: Coke & Refined Petroleum
Estimates of environmental protection expenditure, environmental expenditure by media and income
and savings are provided below for the Coke and Refined Petroleum sector. For this sector, 13
companies participated in the survey giving a response rate of 2%, which is equivalent to
approximately 8% of the total survey response.
Key Expenditure
The Coke and Refined Petroleum sector spent approximately £23 million in 2009 on environmental
protection measures, slightly less than 1 per cent of the total spend for all of the sectors in 2009.
Environmental expenditure for this sector is shown in Figure 5.19 for 2007, 2008 and 2009. The
data is presented separately for capital and operational expenditure.
Figure 5.19. Environmental expenditure: 2009
OPEX (£M) CAPEX (£M) Survey year
In-house External R & D Total End of Pipe Integrated Total
2009 9.7 11.5 0.8 22.0 0.8 0.1 0.8
2008 105.6 242.4 6.5 354.5 118.1 27.3 145.3
2007 84.6 32.2 0.3 117.1 4.5 0.0 4.5
Note: Totals may not add, due to the rounding effects. Comparisons between years should be treated with caution due to low response rate.
Operating expenditure accounted for the vast majority of the environmental spending by the Coke
and Refined Petroleum sector in 2009 at £22 million (96.5%). This is believed to be associated with a
base load of operating costs associated with the disposal and treatment of solid wastes and liquid
effluents arising from manufacturing operations.
The large drop in operating expenditure from £354.5 million in 2008 to £22 million in 2009 is unclear,
although some of the reduction could have been a result of the capital expenditure in 2008. It is
more likely, however that the observed reduction is a consequence of the data presented from the
candidate companies within the sector, i.e. from thirteen companies covering coke manufacture,
petroleum refining, petroleum storage and distribution etc. The data will be strongly influenced and
biased by which companies responded to the survey, i.e. which sub-sector.
The level of capital expenditure fell steeply from £145.3 million in 2008, down to only £1 million in
2009. This is believed to be a combination of the poor state of the economy and the variability of the
data associated with the sample set of companies feeding back into the survey. It should be noted
that the capital expenditure seen in 2009 is of a similar scale to that observed in 2007 (at £4.5
million).
There is currently low investment in this sector which could account for operating expenditure being
larger than capital expenditure at this time.
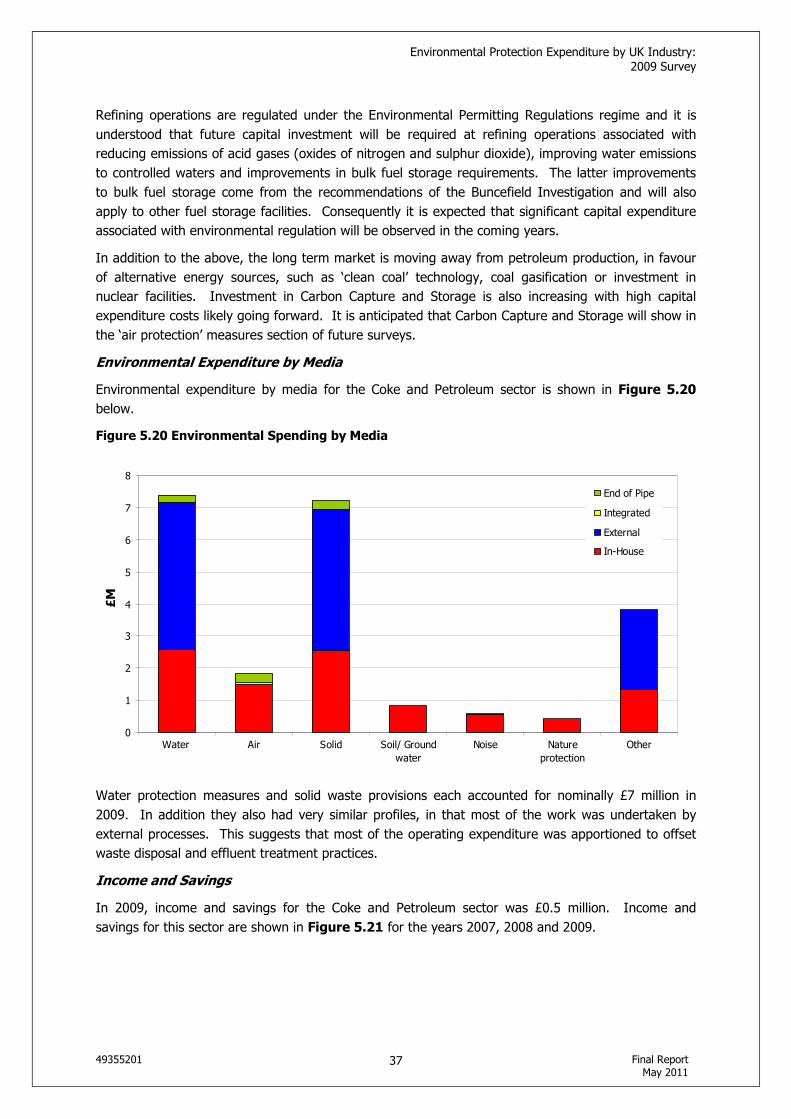
Environmental Protection Expenditure by UK Industry: 2009 Survey
49355201 Final Report May 2011
37
Refining operations are regulated under the Environmental Permitting Regulations regime and it is
understood that future capital investment will be required at refining operations associated with
reducing emissions of acid gases (oxides of nitrogen and sulphur dioxide), improving water emissions
to controlled waters and improvements in bulk fuel storage requirements. The latter improvements
to bulk fuel storage come from the recommendations of the Buncefield Investigation and will also
apply to other fuel storage facilities. Consequently it is expected that significant capital expenditure
associated with environmental regulation will be observed in the coming years.
In addition to the above, the long term market is moving away from petroleum production, in favour
of alternative energy sources, such as ‘clean coal’ technology, coal gasification or investment in
nuclear facilities. Investment in Carbon Capture and Storage is also increasing with high capital
expenditure costs likely going forward. It is anticipated that Carbon Capture and Storage will show in
the ‘air protection’ measures section of future surveys.
Environmental Expenditure by Media
Environmental expenditure by media for the Coke and Petroleum sector is shown in Figure 5.20
below.
Figure 5.20 Environmental Spending by Media
0
1
2
3
4
5
6
7
8
Water Air Solid Soil/ Ground
water
Noise Nature
protection
Other
£M
End of Pipe
Integrated
External
In-House
Water protection measures and solid waste provisions each accounted for nominally £7 million in
2009. In addition they also had very similar profiles, in that most of the work was undertaken by
external processes. This suggests that most of the operating expenditure was apportioned to offset
waste disposal and effluent treatment practices.
Income and Savings
In 2009, income and savings for the Coke and Petroleum sector was £0.5 million. Income and
savings for this sector are shown in Figure 5.21 for the years 2007, 2008 and 2009.
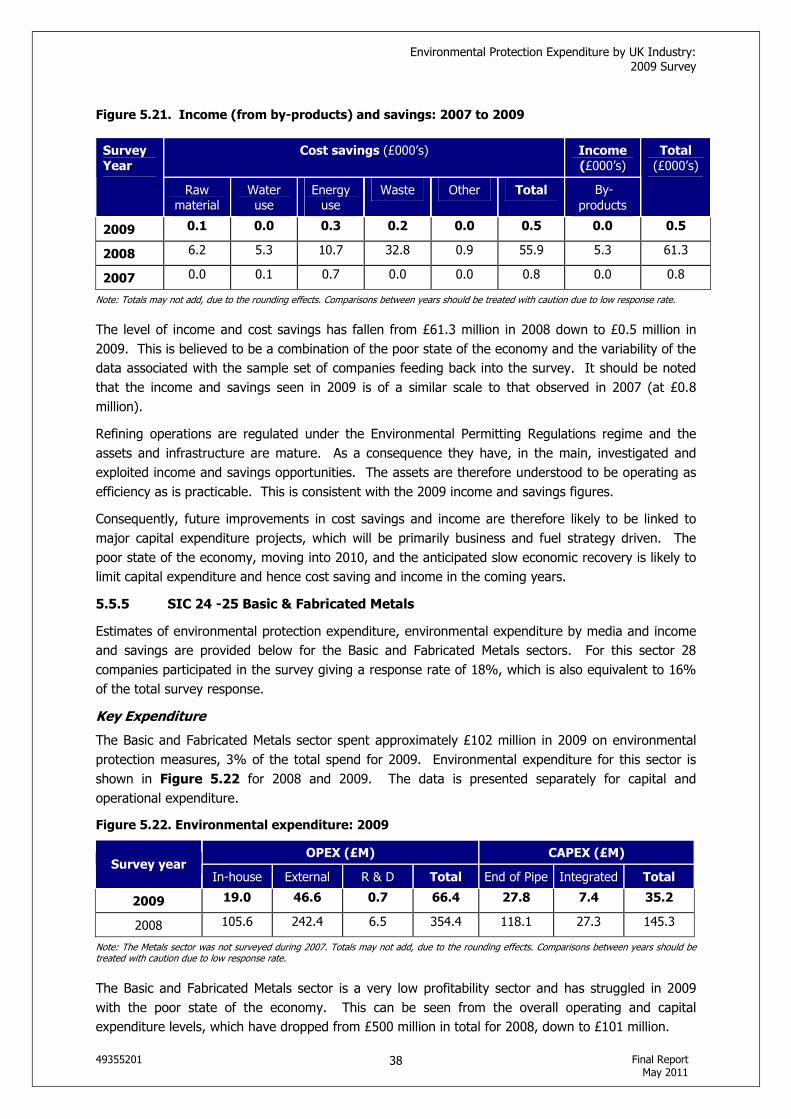
Environmental Protection Expenditure by UK Industry: 2009 Survey
49355201 Final Report May 2011
38
Figure 5.21. Income (from by-products) and savings: 2007 to 2009
Cost savings (£000’s) Income
(£000’s) Survey
Year
Raw material
Water use
Energy use
Waste Other Total By- products
Total (£000’s)
2009 0.1 0.0 0.3 0.2 0.0 0.5 0.0 0.5
2008 6.2 5.3 10.7 32.8 0.9 55.9 5.3 61.3
2007 0.0 0.1 0.7 0.0 0.0 0.8 0.0 0.8
Note: Totals may not add, due to the rounding effects. Comparisons between years should be treated with caution due to low response rate.
The level of income and cost savings has fallen from £61.3 million in 2008 down to £0.5 million in
2009. This is believed to be a combination of the poor state of the economy and the variability of the
data associated with the sample set of companies feeding back into the survey. It should be noted
that the income and savings seen in 2009 is of a similar scale to that observed in 2007 (at £0.8
million).
Refining operations are regulated under the Environmental Permitting Regulations regime and the
assets and infrastructure are mature. As a consequence they have, in the main, investigated and
exploited income and savings opportunities. The assets are therefore understood to be operating as
efficiency as is practicable. This is consistent with the 2009 income and savings figures.
Consequently, future improvements in cost savings and income are therefore likely to be linked to
major capital expenditure projects, which will be primarily business and fuel strategy driven. The
poor state of the economy, moving into 2010, and the anticipated slow economic recovery is likely to
limit capital expenditure and hence cost saving and income in the coming years.
5.5.5 SIC 24 -25 Basic & Fabricated Metals
Estimates of environmental protection expenditure, environmental expenditure by media and income
and savings are provided below for the Basic and Fabricated Metals sectors. For this sector 28
companies participated in the survey giving a response rate of 18%, which is also equivalent to 16%
of the total survey response.
Key Expenditure
The Basic and Fabricated Metals sector spent approximately £102 million in 2009 on environmental
protection measures, 3% of the total spend for 2009. Environmental expenditure for this sector is
shown in Figure 5.22 for 2008 and 2009. The data is presented separately for capital and
operational expenditure.
Figure 5.22. Environmental expenditure: 2009
OPEX (£M) CAPEX (£M) Survey year
In-house External R & D Total End of Pipe Integrated Total
2009 19.0 46.6 0.7 66.4 27.8 7.4 35.2
2008 105.6 242.4 6.5 354.4 118.1 27.3 145.3
Note: The Metals sector was not surveyed during 2007. Totals may not add, due to the rounding effects. Comparisons between years should be treated with caution due to low response rate.
The Basic and Fabricated Metals sector is a very low profitability sector and has struggled in 2009
with the poor state of the economy. This can be seen from the overall operating and capital
expenditure levels, which have dropped from £500 million in total for 2008, down to £101 million.

Environmental Protection Expenditure by UK Industry: 2009 Survey
49355201 Final Report May 2011
39
The sector is dominated by the level of solid waste that is generated and its disposal. Consequently
operating expenditure accounted for the majority of the environmental spend for the Basic and
Fabricated Metals sectors in 2009 (65%).
The level of capital investment in 2009 has shrunk by 76% from 2008.The capital averse nature of
the sector is in line with the worsening state of the economy and the very low profit margins (and
hence re-investment) of the sector.
Owing to the poor economic situation, moving forward into 2010, it is highly likely that the low level
of operating and capital expenditure will continue in the coming years.
Environmental Expenditure by Media
Environmental expenditure by media for the Basic and Fabricated Metals sectors is shown in Figure
5.23 below.
The largest spend was over £60 million on solid waste, the majority of which was due to external
processes, e.g. the disposal of solid waste. The amount spent on water protection measures has
reduced since the last survey to an estimated £10 million. The remaining media groups of air,
soil/groundwater, noise, nature and other protection measures have remained consistently low and
make up the remaining £26 million.
Figure 5.23 Environmental Spending by Media
0
10
20
30
40
50
60
70
Water Air Solid Soil/ Ground
water
Noise Nature
protection
Other
£M
End of Pipe
Integrated
External
In-House
Income and Savings
In 2009, the figure for income and savings for the Basic and Fabricated Metals sectors was £71
million. Levels of 68.5% were observed for 2008 indicating a steady baseline of savings. However it
should be recognised that there has been a shift in the origin of the savings, moving from energy
savings in favour of waste treatment/disposal savings and income.
Income and savings for this sector are shown in Figure 5.24 for the years 2006, 2008 and 2009.

Environmental Protection Expenditure by UK Industry: 2009 Survey
49355201 Final Report May 2011
40
Figure 5.24. Income (from by-products) and savings: 2008 to 2009
Cost savings (£000’s) Income
(£000’s) Survey
Year
Raw material
Water use
Energy use
Waste Other Total By- products
Total (£000’s)
2009 3.6 0.1 1.8 61.2 2.0 68.7 1.9 70.6
2008 6.2 5.3 10.6 32.7 0.9 55.7 5.3 61.1
Note: Totals may not add, due to the rounding effects. Comparisons between years should be treated with caution due to low response rate. The sector was not surveyed in 2007.
Whilst the level of income and savings has remained at a fairly constant level of between £61 million
and £71 million, the composition of the savings has changed markedly in the last four years.
Operators within the sector that are governed by Integrated Pollution Prevention and Control (IPPC)
legislation (now the Environmental Permitting Regulations or EPR) were required to review and
implement energy and water savings in the early years of regulation. Following the review and
implementation of water and energy efficiency improvements, the legislation has focused on waste
minimisation improvements, co-incident with the increasing level of savings through 2008 and 2009.
In addition to the above; energy and water efficiency improvements were targeted post 2006 for
readily achievable improvements, which could provide immediate costs savings to the low profit
margin industry. It can be seen from the low cost savings for raw material, water use and energy
use for 2009 that the readily achievable improvements have been achieved and possibly major capital
expenditure would be required to make future bigger cost savings.
The rising costs associated with disposal of solid waste have resulted in the trend of increasing
savings through minimising waste generation and disposal, between 2008 and 2009. Moving forward
it is likely that the low level of savings arising from raw material, water and energy use will continue
as potential significant investment would be needed to make more savings. It is likely that a similar
level of waste savings will be likely in 2010, to combat rising waste disposal costs.
Income from the sale of by-products has reduced from £5.3 million in 2008 to an estimated £1.9
million in 2009. It is expected that the sale of by-products will remain low as the industry aims to
prevent the occurrence of by-products though operational costs related to waste disposal and energy
use, which is expected to increase with ever more stringent legislation (e.g. landfill tax, climate
change levy). There is likely to be a drive in the market to develop alternative disposal routes or
even reuse options for by-products.
5.5.6 SIC 20 & 21: Chemicals and Pharmaceuticals
This sector comprises two sub-sectors and is fairly similar, in terms of its makeup, to the SIC 2003
classification used for analysis in the 2007 survey (Chemicals and Chemical Products). The basic
characteristics of these sub-sectors can be summarised as:
• Basic chemicals: high volume and low margin bulk chemicals; and
• Pharmaceuticals: high-margin products manufactured in stringent clean conditions, supported by
substantial research and development.
Generally this sector in the UK is struggling to remain competitive especially with competitors based
in China and to a lesser extent, Eastern Europe.

Environmental Protection Expenditure by UK Industry: 2009 Survey
49355201 Final Report May 2011
41
Estimates of environmental protection expenditure, environmental expenditure by media and income
and savings are provided below for the Chemicals and Chemical Products sector. For this sector, 22
companies participated in the survey giving a response rate for the sector of 14%, which is similar to
13% for the total survey.
Key Expenditure
The Chemicals and Pharmaceuticals sector spent approximately £105 million in 2009 on
environmental protection measures, 3% of the total spend for 2009. Environmental expenditure for
this sector is shown in Figure 5.25 for the years 2007, 2008 and 2009. The data is presented
separately for capital and operational expenditure.
Figure 5.25. Environmental expenditure: 2009
OPEX (£M) CAPEX (£M) Survey year
In-house External R & D Total End of Pipe Integrated Total
2009 34.6 51.7 2.1 88.4 10.7 5.6 16.3
2008 43.5 52.4 95.4 191.3 9.5 11.2 20.6
2007 410.9 106.1 105.0 622.0 25.0 7.0 32.0
Note: Totals may not add, due to the rounding effects. Comparisons between years should be treated with caution due to low response rate.
OPEX accounted for 84% of the total environmental spending by the Chemicals and Pharmaceuticals
sector in 2009, although OPEX has reduced by more than 50% compared to that in 2008. External
expenditure, although as in 2008 is still the major contributor to OPEX, has continued to decrease
slightly from that in 2008 and by more than 50% in comparison to 2007.
In-house expenditure has also continued to decrease compared to expenditure in 2008 and has
significantly decreased since 2007. The most marked change in expenditure is for R&D which shows a
very big decrease compared to 2008 and 2007. The sector continues to out source some of its
environmental protection services and use third parties for monitoring and managing their waste
disposal. The big reduction in R&D expenditure may be linked to the economic climate and may
reflect some nervousness around future investments.
CAPEX has continued to decrease from that in 2008 and is approximately 50% of the expenditure in
2007. The focus has moved away from integrated expenditure in 2008 to end of pipe expenditure for
2009. The overall decrease in CAPEX to that in 2008 is associated with integrated expenditure, as end
of pipe expenditure slightly increased.
An increase in end of pipe expenditure may be linked to sector process operators focussing their
expenditure on emissions abatement as apposed to investing in new process / production plant and
equipment due to economic uncertainty.
Environmental Expenditure by Media
Environmental expenditure by media for the Chemicals and Pharmaceuticals sector is shown in
Figure 5.26 below. This sector spent approximately £45 million on solid-waste, the majority of
which was due to external Opex costs. Water, waste water and aqueous liquid waste at just over £25
million is the second largest media spend with the focus of the expenditure again on external Opex
costs. The sector continues to out source some if its environmental protection services and use third
parties for managing their solid and liquid waste disposal, as well as providing water as a process raw
material and for uses associated with utilities. External and in-house Opex costs comprise the
majority of the expenditure in the 2 highest spending media, solid waste and water.

Environmental Protection Expenditure by UK Industry: 2009 Survey
49355201 Final Report May 2011
42
Figure 5.26 Environmental Spending by Media
0
5
10
15
20
25
30
35
40
45
50
Water Air Solid Soil/ Ground
water
Noise Nature
protection
Other
£M
End of Pipe
Integrated
External
In-House
Income and Savings
In 2009, income and savings for the Chemicals sector was approximately £22 million. Income and
savings for this sector are shown in Figure 5.27 for the years 2007, 2008 and 2009.
Figure 5.27 Income (from by-products) and savings: 2007 to 2009
Cost savings (£000’s) Income (£000’s)
Survey Year
Raw material
Water use
Energy use
Waste Other Total By- products
Total (£000’s)
2009 0.0 0.2 12.9 1.2 0.1 14.3 7.4 21.7
2008 2.6 2.0 11.3 2.0 0.0 18.0 0.3 18.3
2007 9.4 2.8 4.0 4.4 0.0 20.7 0.3 20.9
Note: Totals may not add, due to the rounding effects. Comparisons between years should be treated with caution due to low response rate.
Again as in 2008, the bulk of the cost savings are from improvements and efficiency gains related to
energy use. The total cost savings has fallen since 2007 Sales of by-products has significantly
increased and generated an income of £7.4 million, compared to £0.3 million in 2008 and 2007. The
increase in by-product revenue may be associated with industrial symbiosis, bringing together
separate industries and organisations from all business sectors with the aim of improving cross
industry resource efficiency and sustainability; for example involving the physical exchange of
materials and/or by-products.
Predictions for future changes are likely to be associated with further implications and drivers
associated with the Environmental Permitting Regulations; Registration, Evaluation, Authorisation and
Restriction of Chemicals (REACH); the Environmental Damage (Prevention and Remediation)
Regulations 2009; Water Framework Directive; and, implementing the requirements of the revised
Waste Framework Directive. Other than legislative drivers the cost of fuel both directly and indirectly,
for example energy use and waste management logistic transport costs may also have an impact.

Environmental Protection Expenditure by UK Industry: 2009 Survey
49355201 Final Report May 2011
43
Future spend is likely to focus on the requirement to maintain compliance and to save money, e.g.
resource efficiency, solid and liquid waste minimisation and water use efficiencies.
5.5.7 SIC 35 & 36: Electricity, Gas and Water
Electricity, Gas, and Water is a relatively large sector in the UK by spending and also comprises a
wide range of companies both in terms of size and activity focus. For instance, the electricity sector
comprises power generation, both in terms of traditional power plants to renewable forms, as well as
providers of services and innovative technologies. Similar ranges of activities are seen in the other
sub-sectors: this has an influence on the conclusions that can be drawn and in particular the
comparability year on year as different sample ranges within the sector may be important.
Estimates of environmental protection expenditure, environmental expenditure by media and income
and savings are provided below for this sector. In total 32 companies participated in the survey
giving a response rate for the sector of approximately 20 per cent, which is equivalent to 19 per cent
of the total survey response.
Key Expenditure
The Electricity, Gas and Water sector spent £2,681 million in 2009 on environmental protection
measures, 81% of the total spend. It is, therefore, proportionally a very high environmental ‘spender’
potentially linked to high levels of environmental impact and associated regulatory requirements.
Environmental expenditure for this sector is shown in Figure 5.28 for the years 2007, 2008 and
2009. The data is presented separately for capital and operational expenditure.
Figure 5.28 Environmental expenditure: 2009
OPEX (£M) CAPEX (£M) Survey year
In-house External R & D Total End of Pipe Integrated Total
2009 1,028.2 302.1 66.9 1,397.2 890.0 394.0 1,284.0
2008 309.8 523.4 12.2 845.4 381.1 591.9 1,818.4
2007 99.2 1,290.5 1.6 1,391.3 4.7 441.4 446.1
Note: Totals may not add, due to the rounding effects. Comparisons between years should be treated with caution due to low response rate.
Operating expenditure accounted for approximately 52% of total environmental spending for the
Electricity, Gas and Water sector in 2009; with the vast majority of operating expenditure being in-
house costs. There has been unpredictability within OPEX figures returned by the survey in the past
years, but generally there has been a greater level of spending on external sources for operational
issues; the 2009 figures therefore present a significant shift. However, given the range of size and
activities within the sector and the sampling nature of the survey, comparisons between years may
not be meaningful.
It has also been noted that individual companies have dominated the outputs in this sector; for
instance in the 2007 survey results, a single company dominated the spending and, in 2009 whilst
one individual company has not dominated, in each category a number of the larger entities have
influenced output data.
The level of CAPEX appears to have been maintained at a more consistent level than other sectors.
This may be in part due to the regulatory oversight on expenditure in some parts of the sector (e.g.
utilities). Furthermore, the general UK wide momentum for low carbon energy general developments
may have resulted in this sector being less exposed to the global economic recession than others.
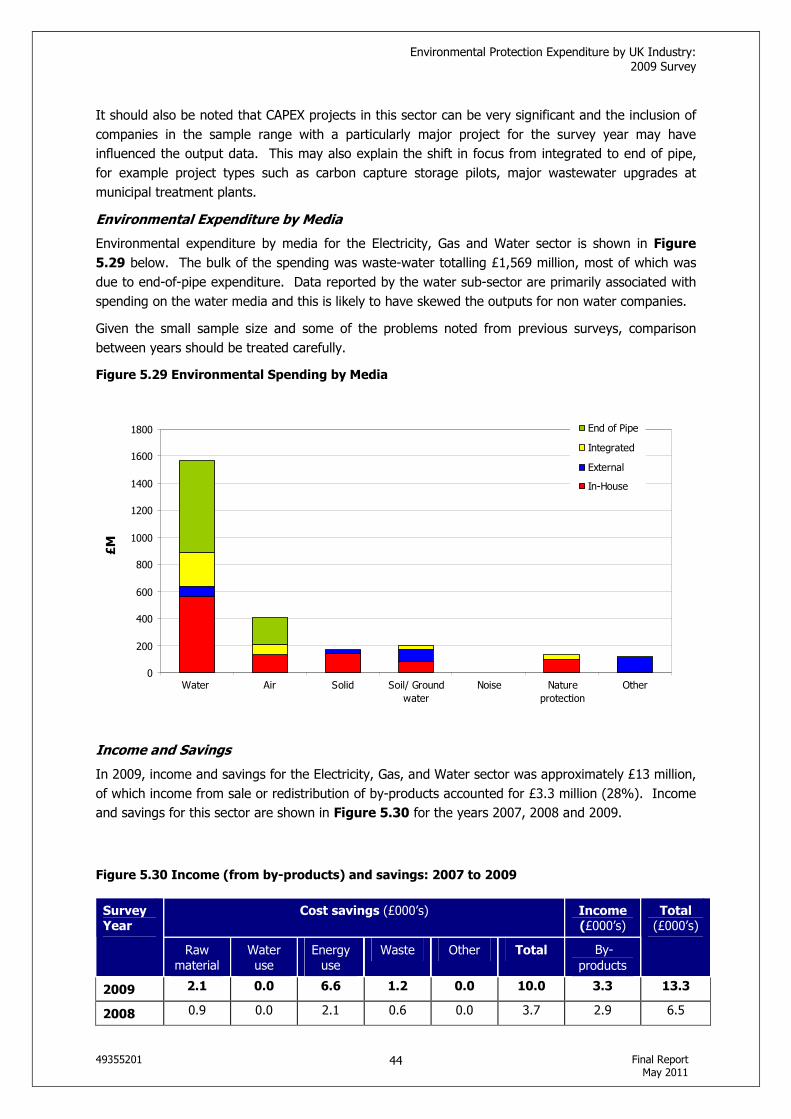
Environmental Protection Expenditure by UK Industry: 2009 Survey
49355201 Final Report May 2011
44
It should also be noted that CAPEX projects in this sector can be very significant and the inclusion of
companies in the sample range with a particularly major project for the survey year may have
influenced the output data. This may also explain the shift in focus from integrated to end of pipe,
for example project types such as carbon capture storage pilots, major wastewater upgrades at
municipal treatment plants.
Environmental Expenditure by Media
Environmental expenditure by media for the Electricity, Gas and Water sector is shown in Figure
5.29 below. The bulk of the spending was waste-water totalling £1,569 million, most of which was
due to end-of-pipe expenditure. Data reported by the water sub-sector are primarily associated with
spending on the water media and this is likely to have skewed the outputs for non water companies.
Given the small sample size and some of the problems noted from previous surveys, comparison
between years should be treated carefully.
Figure 5.29 Environmental Spending by Media
0
200
400
600
800
1000
1200
1400
1600
1800
Water Air Solid Soil/ Ground
water
Noise Nature
protection
Other
£M
End of Pipe
Integrated
External
In-House
Income and Savings
In 2009, income and savings for the Electricity, Gas, and Water sector was approximately £13 million,
of which income from sale or redistribution of by-products accounted for £3.3 million (28%). Income
and savings for this sector are shown in Figure 5.30 for the years 2007, 2008 and 2009.
Figure 5.30 Income (from by-products) and savings: 2007 to 2009
Cost savings (£000’s) Income (£000’s)
Survey Year
Raw material
Water use
Energy use
Waste Other Total By- products
Total (£000’s)
2009 2.1 0.0 6.6 1.2 0.0 10.0 3.3 13.3
2008 0.9 0.0 2.1 0.6 0.0 3.7 2.9 6.5

Environmental Protection Expenditure by UK Industry: 2009 Survey
49355201 Final Report May 2011
45
2007 0.5 0.0 0.7 0.1 0.0 1.3 1.8 3.1
Note: Totals may not add, due to the rounding effects. Comparisons between years should be treated with caution due to low response rate.
Cost savings in this sector continue to show significant growth with a generally similar pattern to
previous years. Although the nature of these is not clear, the sector is expected to have been
significantly exposed to both EU ETS and the Carbon Reduction Commitment which will have
increased focus on energy reduction resulting in cost savings.

Environmental Protection Expenditure by UK Industry: 2009 Survey
49355201 Final Report May 2011
46
5.6 DRIVERS FOR CAPITAL EXPENDITURE
Approximately 57% of the surveyed companies listed at least one reason for their capital expenditure.
The most common drivers described were compliance with government regulation/legislation (51%,
and equipment upgrades (27%), both of which are comparable to 2008 CAPEX trends.
Other defined drivers for CAPEX in 2009 included compliance with the requirements of parent
companies (8%), as well as those of customers (6%). The remaining 10% of CAPEX related to taxes
(2%) and ‘other drivers’ (8%)
The Food Products & Beverages, Tobacco Products sector provided the greatest number of responses
for this section of the questionnaire, with 30 reasons identified from 49 companies.
While there are some differences between the sectors in terms of the drivers for CAPEX, it is not
possible to be sure any difference is not owing to random variation within the sample frame,
especially some of the sectors involving less than 20 companies.
5.7 ENVIRONMENTAL MANAGEMENT SYSTEMS
This section presents the findings in relation to environmental management systems (EMS), which
may be described as structured frameworks for managing an organisation's significant environmental
impacts. Related questions asked whether the business has an EMS, the type of EMS certification
(e.g. ISO14001) and costs associated with implementation and maintenance.
In 2009, 81% of surveyed companies had implemented an environmental management system
(EMS); this represents a 23% reduction from that identified in 2008. Of the EMS in place in 2009,
63% were ISO14001 certified, 37% were certified to another recognised standard (e.g. BRC Global,
BS8555), and the remaining 19% were not certified. These levels are relatively comparable to those
in 2008.
Figure 5.31 presents the types of environmental management systems used by different industries,
i.e. and where ISO14001-certified EMS, an EMS certified to another recognised standard, or an
uncertified (‘in-house’) EMS.

Environmental Protection Expenditure by UK Industry: 2009 Survey
49355201 Final Report May 2011
47
Figure 5.31 Types of EMS by Industry Sector
20% 30% 40% 50% 60% 70% 80% 90% 100%
Mining & Quarrying
Food, Beverages & Tobacco
Paper & Pulp
Coke & Refined Petrol
Chemical & Pharmaceuticals
Basic & Fabricated Metals
Electricity, Gas & Water
EMS Percentage Uptake
ISO14001
non-ISO
Other
Companies in the Basic & Fabricated Metal and Electricity, Gas & Water sectors were most likely to
have an EMS in place (100%). The former were most likely to have their own in-house system, whilst
the latter were most likely to have a certified EMS (100%).
The sectors with the greatest proportion of ISO14001-certified EMS were those of Mining &
Quarrying, and Paper & Pulp (100% for both).
In 2009, the average estimated cost of a large company (more than 250 employees) maintaining an
existing EMS was £27,400 per business, comparable to a 2008 average spend of £29,200. The
average cost to businesses implementing a new system in 2009 was estimated at £10,500, again
close to the 2008 average cost of £10,350.
Due to the small base sample used in these estimations, EMS figures provided should be treated with
caution.

Environmental Protection Expenditure by UK Industry: 2009 Survey
49355201 Final Report May 2011
48
6 RECOMMENDATIONS FOR FUTURE SURVEY
The following section provides general recommendations for the forthcoming 2010 survey based on
the experience of the URS team and feedback received during previous surveys.
6.1 GENERAL
• As the 2010 survey is based on a larger sample frame, we recommend that the process is
started earlier this year with the aim that all questionnaires have been sent out and
completed before Christmas.
• It has been agreed that the 2010 survey should align as closely as possible with the last large
survey performed in 2006, whilst at the same time all changes that have been made to the
sample frame, design of the questionnaire, mail out materials, validation process and analysis
should be carried through to 2010.
6.2 SAMPLE FRAME
• This year, as in previous surveys, the water (SIC 36) and electricity and gas (SIC 35) sectors
were grouped together, primarily due to the small number of companies. Due to the different
nature of companies in these groupings, the impact that this is expected to have on the
nature of environmental expenditure and the significance of these in the overall numbers, it is
recommended that the two sectors are treated separately for the 2010 survey if at all
possible.
6.3 VALIDATION
• Further review of the validation process should be carried out to ensure that more
information is obtained on one off expenditure. More clarity is needed on whether this
expenditure will lead to a direct impact on the environmental performance of the company
completing the questionnaire or whether the project has been conducted on behalf of an
another organisation (for example, as part of its core business, the participating company
may sell environmentally related products and services). This additional information will
enable better analysis.

Environmental Protection Expenditure by UK Industry: 2009 Survey
49355201 Final Report May 2011
49
6.3 ANALYSIS
• The last full scale survey conducted in 2006 was based on SIC 2003, whereas the 2010
survey will use classification based on SIC 2007. This means that for a select number of
sectors, comparison and analysis will not be meaningful. It has been agreed that despite this
limitation, the 2006 survey will not be updated to reflect changes in the SIC codes, instead in-
depth analysis will only be conducted for those sectors which have remained unchanged
between SIC 2003 and 2007. Additional comparison will also be conducted for those sectors
included in the 2008 and 2009 surveys (both of which are based on SIC 2007).

Environmental Protection Expenditure by UK Industry: 2009 Survey
49355201 Final Report May 2011
50
ABBREVIATIONS & ACCRONYMS
CAPEX Capital Expenditure
COMAH Control of Major Accidents and Hazards
Defra Department for Environment, Food and Rural Affairs
DETR Department of Environment Transport and the Regions
EC European Commission
EMS Environmental Management System
EU European Union
EUROSTAT European Statistical Office
FAQ Frequently Asked Questions
IDBR Inter Departmental Business Register
IPPC Integrated Pollution Prevention and Control
NACE Nomenclature Générale des Activités Economiques dans les Communautés
Européennes [General Industrial Classification of Economic Activities within the
European Communities].
ONS Office for National Statistics
OPEX Operating Expenditure
PPC Pollution Prevention and Control
QA Quality Assurance
SEPA Scottish Environment Protection Agency
SIC Standard Industrial Classification
SME Small- or Medium-sized Enterprise
TGN Technical Guidance Note
URS URS Corporation Ltd