Embed Size (px)
Citation preview
EVALUATION OF SUBSTITUTE MATERIALSFOR SILICA SAND IN ABRASIVE BLASTING
CONTRACT No. 200-95-2946
Prepared For:
Department of Health and Human ServicesCenters for Disease Control and Prevention
National Institute for Occupational Safety and Health
Prepared By:
KTA-Tator, Inc.115 Technology Drive
Pittsburgh, PA 16275-1085
December 21, 1998

Evaluation of Substitute Materials forSilica Sand in Abrasive Blasting
i
DISCLAIMER
The contents of this report are reproduced herein as received from the contractor.The opinions, findings, and conclusions expressed herein are not necessarily those of theNational Institute for Occupational Safety and Health, nor does mention of companynames or products constitute endorsement by the National Institute for OccupationalSafety and Health.

Evaluation of Substitute Materials forSilica Sand in Abrasive Blasting
ii
ACKNOWLEDGMENT
Project: Evaluation of Substitute Materials for Silica Sand in Abrasive Blasting
Department of Health and Human ServicesCenters for Disease Control and PreventionNational Institute for Occupational Safety and HealthContract Number 200-95-2946
This is to acknowledge the extensive effort of the Project Officer, Mr. Mark Greskevitch andContracting Hazard Surveillance Team Leader, Mr. Dennis Groce. Mr. Greskevitch providedextensive direction throughout the project and participated in the overall design and startup ofeach phase of the project.
The project team who worked closely with Mr. Greskevitch was headed by Principal InvestigatorMr. Kenneth A. Trimber, Vice President of KTA-Tator, Inc., immediate past-President of theSociety of Protective Coatings (SSPC, an industry trade organization), and Chairman of theSurface Preparation Committee C-2 of the SSPC. Mr. Trimber was assisted by Project TechnicalAdvisor, Mr. Daniel P. Adley CIH, CSP, in all matters relating to industrial hygiene and workersafety.
Project Manager and Supervisor for Phase 2, Mr. William D. Corbett coordinated overall projectmanagement and worked closely with Mr. Greskevitch in the design and startup phases of theproject. Mr. Corbett, who was assisted by Mr. Michael F. MeLampy, Phase 1 Project Manager,also provided the day to day supervision of this phase and ensured that all material and personnelwere ready at the appointed time and that the project progressed smoothly.
All industrial hygiene procedures were designed by Project Certified Industrial Hygienist,Mr. Daniel P. Adley, and approved by Mr. Greskevitch. Implementation of these procedures wasperformed primarily by Industrial Hygiene Technician, Mr. Robert D. Moody, and assisted byMr. Corbett. These men provided for thorough record keeping, pre-run cleanliness, and assuredthe least amount of health and safety risk to those who participated in this project.
Blast Cleaning Technician, Mr. Leon Farbotnik, was the selected operator throughout the project.Mr. Farbotnik provided the least variability in work practices to ensure reliable data collectionand repeatability of the test procedures. Mr. Corbett and Mr. Farbotnik were assisted by projectstaff Mr. Donald Points and Mr. Stanford Galloway. Data entry and verification was performedby Ms. Carol Gileot, and data analysis was undertaken by Mr. Stanford Liang, CIH, together withMessrs. Adley and MeLampy.
Consolidation Coal Company, River Division provided substrate materials, site access, andmobilization/demobilization equipment and personnel throughout the project. Port Captain,Deane Orr, and General Manager, David Kreutzer, are acknowledged for their assistance andcooperation.
Containment design and equipment supplier coordination for Phase 2 was performed byMs. Jocelyn Wojcikewicz, P.E. and Mr. Joseph Kauffman, draftsman.
Additional acknowledgement is due to the various suppliers of abrasive blast cleaning media fortheir patience and efforts in providing data and comments for this project.

Evaluation of Substitute Materials forSilica Sand in Abrasive Blasting
iii
TABLE OF CONTENTS
INTRODUCTION............................................................................................................. 1
EXECUTIVE SUMMARY............................................................................................... 2
STUDY DESIGN AND TEST METHODS .................................................................... 4
DESCRIPTION ................................................................................................................................................................ 4PRODUCTS AND MATERIALS....................................................................................................................................... 4
Test Surfaces............................................................................................................................................................4Abrasive Selection..................................................................................................................................................4
OPERATOR SELECTION................................................................................................................................................ 5BLAST CLEANING EQUIPMENT AND FACILITIES...................................................................................................... 5ABRASIVE MEDIA TEST METHODS............................................................................................................................ 6
Blast Cleaning Procedure.....................................................................................................................................7Cleaning Rate..........................................................................................................................................................7Consumption Rate ..................................................................................................................................................7Surface Profile.........................................................................................................................................................8Abrasive Particle Size Distribution.....................................................................................................................8Abrasive Breakdown Rate.....................................................................................................................................9Abrasive Embedment..............................................................................................................................................9Abrasive Bulk Samples ..........................................................................................................................................9
INDUSTRIAL HYGIENE SAMPLING............................................................................................................................ 10Protection of Human Subjects ............................................................................................................................10Sample Collection Methodology and Filter Media Positioning ...................................................................11Calibration of Sampling Pumps.........................................................................................................................12Background Monitoring ......................................................................................................................................13Preparation of Containment Facility ................................................................................................................13Sample Collection During Abrasive Trials ......................................................................................................13Post Sample Collection Procedure....................................................................................................................14
DOCUMENTATION...................................................................................................................................................... 15CONCERNS................................................................................................................................................................... 16
Abrasive Metering Valve.....................................................................................................................................16Production Rates ..................................................................................................................................................16Ventilation Rate ....................................................................................................................................................18
TEST RESULTS AND DISCUSSION .......................................................................... 19
PHYSICAL PROPERTY EVALUATIONS...................................................................................................................... 19Abrasive Cleaning and Consumption Rates.....................................................................................................20
CLEANING AND CONSUMPTION RATE SUMMARY................................................................................................. 22Surface Profile.......................................................................................................................................................23Breakdown Rate (pre-blast and post-blast average particle size comparison) .........................................24Abrasive Embedment............................................................................................................................................25
COMPARISONS BETWEEN ABRASIVE TYPES .......................................................................................................... 25Coal Slag................................................................................................................................................................26Nickel Slag.............................................................................................................................................................26Staurolite................................................................................................................................................................27Silica Sand with Dust Suppressant ....................................................................................................................27Copper Slag...........................................................................................................................................................27Garnet.....................................................................................................................................................................28Steel Grit ................................................................................................................................................................28
CALCULATION OF OPERATING COSTS..................................................................................................................... 29

Evaluation of Substitute Materials forSilica Sand in Abrasive Blasting
iv
Cleaning and Consumption Rates .....................................................................................................................29Abrasive Flow (Consumption) Rate ..................................................................................................................29Abrasive Material Cost........................................................................................................................................29Abrasive Disposal Cost .......................................................................................................................................30Equipment Costs ...................................................................................................................................................30Labor Costs............................................................................................................................................................30Number Of Recycles .............................................................................................................................................31Abrasive Cleaning Rate .......................................................................................................................................31Cost Analysis .........................................................................................................................................................31
INDUSTRIAL HYGIENE RESULTS.............................................................................................................................. 34Air Sample Results................................................................................................................................................34Airborne Sample Data Analysis .........................................................................................................................34Bulk Elemental Analysis ......................................................................................................................................34Comparison of Airborne Dust Concentrations to Bulk Concentrations.....................................................35Health-Related Agent Summary.........................................................................................................................35Arsenic....................................................................................................................................................................36Beryllium................................................................................................................................................................37Cadmium................................................................................................................................................................38Chromium...............................................................................................................................................................40Lead.........................................................................................................................................................................41Manganese.............................................................................................................................................................42Nickel ......................................................................................................................................................................43Respirable Quartz.................................................................................................................................................45Silver .......................................................................................................................................................................46Titanium.................................................................................................................................................................46Vanadium...............................................................................................................................................................47
INDUSTRIAL HYGIENE DISCUSSION......................................................................................................................... 59Coal Slag................................................................................................................................................................59Nickel Slag.............................................................................................................................................................60Staurolite................................................................................................................................................................62Silica Sand .............................................................................................................................................................63Silica Sand with Dust Suppressant ....................................................................................................................64Copper Slag...........................................................................................................................................................66Garnet.....................................................................................................................................................................67Steel Grit ................................................................................................................................................................69Treated Versus Untreated Abrasives.................................................................................................................72
BULK SAMPLE DISCUSSION...................................................................................................................................... 72RADIATION.................................................................................................................................................................. 73
Results.....................................................................................................................................................................74
CONCLUSIONS AND RECOMMENDATIONS........................................................ 89
CONCLUSIONS............................................................................................................................................................. 89Abrasive Performance Issues..............................................................................................................................89Industrial Hygiene-Related Issues.....................................................................................................................90
RECOMMENDATIONS.................................................................................................................................................. 91
REFERENCES................................................................................................................ 93
Evaluation of Substitute Materials forSilica Sand in Abrasive Blasting
v
LIST OF APPENDICES
Appendix
1 Study Design – Phase 2 Protocol
2 Containment Drawings/Blast Run Conditions and Productivity Data
3 Sample Inspection Reports
4 Sample Pre- and Post-Medical Report Forms
A Tables of Abrasive Performance
B Tables of Industrial Hygiene Data
C Graphs of Statistical Attributes
D Cost Calculation Tables
E Photographs
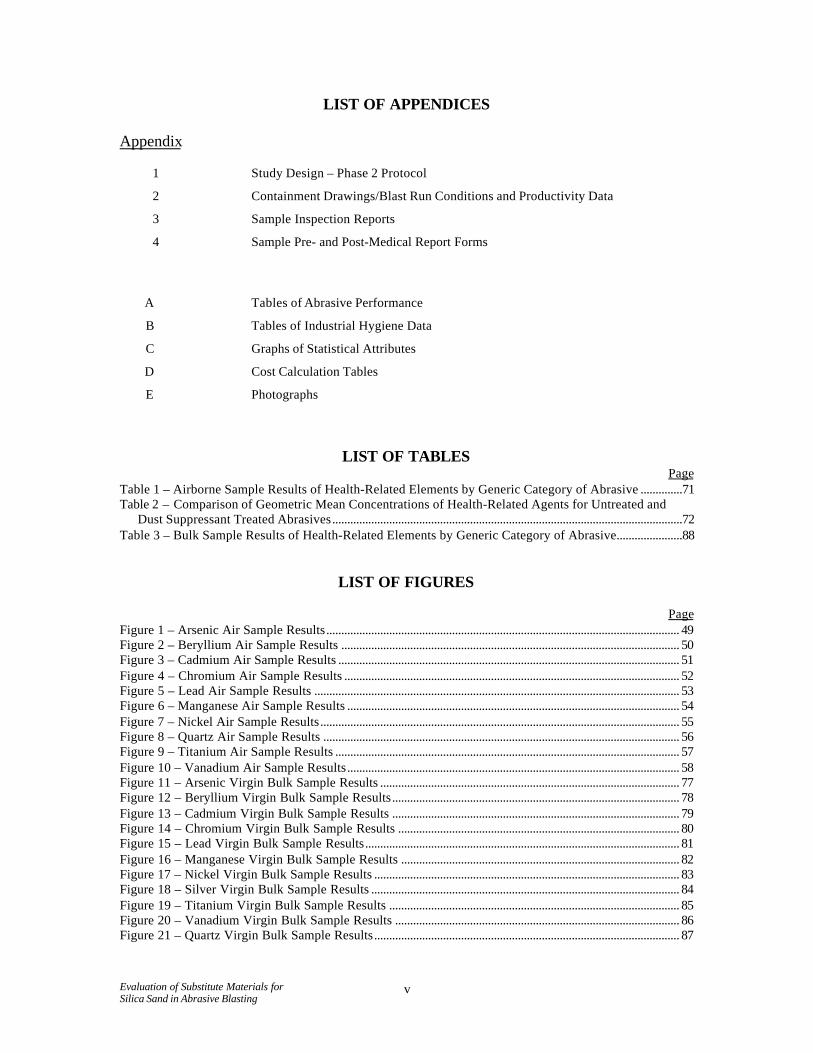
LIST OF TABLESPage
Table 1 – Airborne Sample Results of Health-Related Elements by Generic Category of Abrasive ..............71Table 2 – Comparison of Geometric Mean Concentrations of Health-Related Agents for Untreated and
Dust Suppressant Treated Abrasives.....................................................................................................................72Table 3 – Bulk Sample Results of Health-Related Elements by Generic Category of Abrasive......................88
LIST OF FIGURES
PageFigure 1 – Arsenic Air Sample Results...................................................................................................................... 49Figure 2 – Beryllium Air Sample Results ................................................................................................................. 50Figure 3 – Cadmium Air Sample Results .................................................................................................................. 51Figure 4 – Chromium Air Sample Results ................................................................................................................ 52Figure 5 – Lead Air Sample Results .......................................................................................................................... 53Figure 6 – Manganese Air Sample Results ............................................................................................................... 54Figure 7 – Nickel Air Sample Results........................................................................................................................ 55Figure 8 – Quartz Air Sample Results ....................................................................................................................... 56Figure 9 – Titanium Air Sample Results ................................................................................................................... 57Figure 10 – Vanadium Air Sample Results............................................................................................................... 58Figure 11 – Arsenic Virgin Bulk Sample Results .................................................................................................... 77Figure 12 – Beryllium Virgin Bulk Sample Results................................................................................................ 78Figure 13 – Cadmium Virgin Bulk Sample Results ................................................................................................ 79Figure 14 – Chromium Virgin Bulk Sample Results .............................................................................................. 80Figure 15 – Lead Virgin Bulk Sample Results......................................................................................................... 81Figure 16 – Manganese Virgin Bulk Sample Results ............................................................................................. 82Figure 17 – Nickel Virgin Bulk Sample Results ...................................................................................................... 83Figure 18 – Silver Virgin Bulk Sample Results ....................................................................................................... 84Figure 19 – Titanium Virgin Bulk Sample Results ................................................................................................. 85Figure 20 – Vanadium Virgin Bulk Sample Results ............................................................................................... 86Figure 21 – Quartz Virgin Bulk Sample Results...................................................................................................... 87

Evaluation of Substitute Materials forSilica Sand in Abrasive Blasting
vi
APPENDED TABLES
Table
A1 Abrasive Cleaning and Consumption Rates
A2 Surface Profile
A3 Breakdown Rate
A4 Embedment Results
D1 Cleaning Costs (Non-hazardous Waste)
D2 Cleaning Costs (Hazardous Waste)
Evaluation of Substitute Materials forSilica Sand in Abrasive Blasting
1
INTRODUCTION
This report represents Phase 2 of a study commissioned by the Centers forDisease Control and Prevention (CDC) and the National Institute for Occupational Safetyand Health (NIOSH). The study was outlined in an Invitation for Proposal entitled,“Evaluation of Substitute Materials for Silica Sand in Abrasive Blasting”, dated June 9,1995. KTA-Tator, Inc. (KTA) responded to the invitation with a proposal entitled,“Technical Proposal for Evaluation of Substitute Materials for Silica Sand in AbrasiveBlasting”, dated July 14, 1995. On September 29, 1995, Contract No. 200-95-2946,issued by the Centers for Disease Control and Prevention (Atlanta, Georgia), wasawarded to KTA. The Contract directed KTA to conduct a three-phase study for thepurpose of investigating relative levels of 30 different health-related agents and otherattributes of surface preparation of the alternative abrasives to silica sand.
Phase 1 involved a laboratory study. The Phase 1 results are contained in a KTAreport to CDC/NIOSH dated September 1998. This Phase 2 report addresses the datacollected during the field study of the contract. Phase 3, which will be prepared at a laterdate, is a comparison of the data collected during Phases 1 and 2.
Phase 2 was conducted at the Consolidation Coal Company Shipyard, located inElizabeth, Pennsylvania. The blast cleaning portions of Phase 2 began September 16,1997, and were completed on September 25, 1997. Upon completion of blast cleaning,airborne particulate and bulk abrasive samples were analyzed, data entered and evaluated,and the report prepared.
The objective of the study was to collect (in a partially-controlled field site)industrial hygiene airborne levels and bulk ingredient data for thirty health-related agents;and economic and technical data; and compare the alternative abrasives’ results to silicasand’s results. The study entailed the collection of airborne particulate (total andrespirable fractions) generated during open nozzle dry abrasive blast cleaning operationsconducted on the exterior hull of a coal barge. The hull was free of any coating andconsisted of heavily rusted and pitted steel. The study investigated the productioncharacteristics of silica sand, silica sand treated with dust suppressant and six (6)alternative abrasive materials for surface cleanliness (visual), cleaning and consumptionrates, breakdown rates, surface profile generation, and abrasive particle embedment. Thespecific abrasives evaluated in Phase 2 were selected by NIOSH from the 40 abrasivestested in Phase 1. They consisted of 5 expendable abrasives and 3 abrasives classified asrecyclable for the purpose of the testing. Note that the recyclable abrasives were usedonly once in Phase 2.
This report presents the methodologies employed during data collection, theresults of the abrasive media production characteristics, and the bulk abrasive andairborne sample data acquired.

Evaluation of Substitute Materials forSilica Sand in Abrasive Blasting
2
EXECUTIVE SUMMARY
The Centers for Disease Control and Prevention (CDC), through the NationalInstitute for Occupational Safety and Health (NIOSH), commissioned KTA-Tator, Inc. toconduct a study entitled “Evaluation of Substitute Materials for Silica Sand in AbrasiveBlasting”. In conjunction with NIOSH, a project design protocol was developed toevaluate the characteristics that influence abrasive performance from a surfacepreparation viewpoint and the potential for worker exposures to airborne contaminants.The project involved a Phase 1 laboratory study and a Phase 2 field study, which is thesubject of this report. The protocol for Phase 2 of the study was used to evaluate 8generic types of abrasives:
• coal slag• copper slag• garnet• nickel slag
• silica sand• silica sand with dust suppressant• staurolite• steel grit
One product from each of these generic categories was tested. Each of theabrasives was evaluated for 5 performance related characteristics, including:
• cleaning rate• consumption rate• surface profile
• breakdown rate• abrasive embedment
Bulk samples of the 8 abrasive products were analyzed for 30 potentialcontaminants prior to and following use. During use, they were evaluated for airborneconcentrations of the same 30 contaminants:
aluminum calcium lead* nickel* sodium yttriumarsenic* chromium* lithium phosphorous tellerium zincbarium cobalt magnesium platinum thallium zirconiumberyllium* copper manganese* selenium titanium* quartz*cadmium* iron molybdenum silver* vanadium* cristobalite
* While data was collected for 30 contaminants, eleven of them were selected by NIOSHfor detailed analysis.
In order to ensure that the only significant variable being evaluated for each of theperformance characteristics and airborne contaminants was the individual abrasive,stringent controls over operator work practices and equipment operation wereimplemented and maintained.
Evaluation of Substitute Materials forSilica Sand in Abrasive Blasting
3
It is important to recognize that the Phase 1 results demonstrated that individualabrasives within each generic category exhibited characteristics that were often quitedifferent than their counterparts. As a result, these Phase 2 conclusions apply only to thespecific abrasives evaluated and do not represent the entire generic category of abrasive.Each abrasive must be evaluated individually for its own characteristics.
The alternative abrasives evaluated were all capable of producing the desireddegree of cleaning and a surface profile suitable for paint performance. Productivity ofthe abrasives evaluated was both better and worse than silica sand. Based on the specificabrasives tested, the operational controls imposed on the project, and the hypotheticalproject conditions established for cost estimating, the cost to use the various abrasivesranged from $0.69 per square foot to $1.02 per square foot. The cost of coal slagabrasive was comparable to silica sand ($0.69 per square foot versus $0.72 for silicasand). Other abrasives were more expensive to use based on the test results (e.g., from 14to 42% more expensive than silica sand), although without the constraints imposed on theequipment operator during the study, they will be more competitive to use in actual fieldapplications. In addition, if hazardous waste is assumed to be present, the cost of usechanges dramatically, from $0.91/square foot to $1.67/square foot, with silica sand at$1.37 per square foot. Steel grit becomes the most cost-effective abrasive at $0.91/squarefoot.
While this study collected data on 30 potential contaminants, the analysis focusedon eleven health-related agents selected by NIOSH including: arsenic, beryllium,cadmium, chromium, lead, manganese, nickel, respirable quartz, silver, titanium, andvanadium. While no single abrasive category had reduced levels of all eleven health-related agents, all the substitutes offer advantages over silica sand with regard torespirable quartz. However, all of the alternative abrasives have higher levels of four ormore of the other health-related agents, as compared to silica sand.
The overall findings of this study are eye opening and potentially far reaching. Inrecent years, much of the industry focus has been directed at protecting workers from thehazards of lead and other metals in the coatings removed during abrasive blasting.NIOSH and OSHA have also directed increased attention to the hazards of silica sand.The findings of this study suggest that a much broader and holistic approach to protectingworkers performing any form of abrasive blast cleaning needs to be taken. In addition toa continued focus on alternatives to silica sand abrasives or the hazard of lead in paint,consideration should be given to the establishment of a broad, vertical health standardencompassing all health hazards associated with abrasive blasting operations.

Evaluation of Substitute Materials forSilica Sand in Abrasive Blasting
4
STUDY DESIGN AND TEST METHODS
Description
The study was performed in strict accordance with the NIOSH-approved Phase 2Study Design/Protocol developed specifically for this project (copy attached as Appendix1). The protocol provided controls and documentation forms for:
• Collection of bulk abrasive samples for additional analysis by NIOSH. A total of 8different abrasives were included in the study (refer to the Products and Materialssection of this report for a listing of the specific abrasives),
• Consistent operation of all blast cleaning and ventilation equipment,
• Consistent blast cleaning technique and cleanliness (SSPC SP-10/NACE No. 2, “NearWhite1”),
• Consistent cleaning of all equipment and containment facilities to prevent cross-contamination between runs,
• Analysis of particle size distribution, abrasive break-down rates, cleaning rates,abrasive consumption rates, surface profile, and embedment,
• Collection of samples for respirable crystalline silica, respirable radiochemicalactivity, total airborne radiochemical activity, and total airborne elements. A total of28 metals/elements, and respirable quartz and cristobalite were evaluated by KTA.Refer to the Industrial Hygiene Sampling portion of this report for a listing of theelements analyzed, and for information on the number of samples collected, locationsof the sampling media, the type of media used, and pump flow rates. The analysis ofthe filters was managed by NIOSH (using other testing laboratories), and
• Developing total cost calculations.
Products and Materials
Test Surfaces
The study was performed on the side of a coal barge which was subdivided intoeight (8) sections measuring approximately 5' x 14', resulting in a maximum surface areaof approximately 72 square feet (per abrasive) available for abrasive blast cleaning.
Abrasive Selection
The study involved eight (8) different abrasives. All products were commerciallyavailable materials. The silica sand abrasive containing dust suppressant had already been

Evaluation of Substitute Materials forSilica Sand in Abrasive Blasting
5
treated prior to purchase. The generic types of abrasive, and the alpha code assigned toeach type, are as follows:
Abrasives
Coal Slag (CS-06) 1 productCopper Slag (CP-2A) 1 productGarnet (G-3A) 1 productNickel Slag (N-01) 1 productSilica Sand (SS-04) 1 productSilica Sand with Dust Suppressant (SSDS-03) 1 productStaurolite (S-02) 1 productSteel Grit (SG-2A) 1 product
The specific abrasive used within each of the above categories was selected byNIOSH from the cross-section of products used in Phase 1.
Operator Selection
In order to help ensure consistency between the Phase 1 (laboratory) and Phase 2(field) studies, the operator chosen to conduct Phase 1 also conducted the Phase 2 blastcleaning work.
Blast Cleaning Equipment and Facilities
A portable containment was constructed on a barge at the Consolidation CoalCompany Shipyard in Elizabeth, Pennsylvania. Throughout all abrasive trials, variabilityof the blast cleaning environment was controlled by moving the same blast containmentand abrasive blast cleaning equipment to each new test area. Diagrams of this facility areprovided in Appendix 2 and photographs of the facility and equipment are provided inAppendix E. The equipment utilized for the study included:
• A clean, enclosed, 16' long by 8' wide by 8' high containment constructed of plywoodand Visqueen. Tarpaulins were used to cover the floor inside containment (seedrawings in Appendix 2). The containment was equipped with a Lunardini ServiceCompany, 5,000 cubic feet per minute (cfm), dust collection system. Air flowthrough the containment was controlled at 25 to 45 feet per minute with an averagecrossdraft approximately 40 feet per minute for each trial run. Air flow wasmeasured using an Alnor Model RV rotating vane anemometer.
• A Clemco 6 cubic feet gravity feed abrasive hopper fitted with a specially designedabrasive metering valve. The metering valve plate designed by KTA utilized fivefixed settings ranging from 1/4" to 1/2" in 1/16" increments. This allowed for the useof a precise valve setting for each trial run. Prior to each trial, the blast pot wasloaded with a sample of abrasive, and the blast pot metering valve adjusted as
Evaluation of Substitute Materials forSilica Sand in Abrasive Blasting
6
required to achieve optimum flow (as judged by the blast operator). The meteringvalve opening was documented and is presented in appended Table A1.
• An Atlas Copco 375 cfm air compressor. The compressed air line was equipped withmoisture and oil separators, and a desiccant air dryer. Prior to each abrasive trial, thesupplied air was evaluated for moisture and oil in accordance with ASTM D4285,“Standard Test Method for Indicating Oil or Water in Compressed Air”2. Nomoisture, oil, or other visible contamination was detected during any of the blottertests.
• One 15 foot length of reinforced air/abrasive hose (7/8" inside diameter), and oneBoride brand No. 7 (7/16 inch orifice size) venturi blast nozzle. After each abrasivetrial, the blast hose was flushed, washed inside and out with potable water, then driedwith compressed air before the next day’s trial.
• A Clemco nozzle orifice gage. The gage was used to monitor the nozzle orifice sizeprior to each abrasive blasting trial. The nozzle maintained a consistent 7/16" sizethroughout the field study.
• A Clemtex Model 352-02 hypodermic needle pressure gage. The gage was used tomeasure the blasting pressure at the nozzle prior to each abrasive trial. The pressurewas maintained at approximately 100 pounds per square inch (psi) throughout theabrasive study. A fixed pressure of approximately 100 psi was selected in order tominimize the number of variables involved with the collection of the data, in an effortto enhance the reproducibility of the test methods.
• A Dickson Model THDX 24 hour recording hygrometer for continuous monitoring ofrelative humidity and dew point, and an Atkins Model 33035-F digital thermocouplefor monitoring the surface temperature of the steel substrate. Barometric pressurewas also documented. A sample inspection report is attached as Appendix 3, Exhibit1 – “Blast Cleaning Inspection Report”. The completed reports are providedseparately from this report.
• A Nor-Tech abrasive debris vacuum system. The equipment was used to clean theinterior surfaces of the containment after each trial. After thorough vacuuming andcleaning, industrial hygiene personnel inspected the containment in accordance withthe procedures described later in this section.
• A 208 volt, 3 phase, 50 amp, 30 kilowatt diesel generator to supply power to thecompressor, dust collector, and other miscellaneous electrical equipment/tools.
Abrasive Media Test Methods
A series of test methods was used to control the abrasive blast cleaning processand to evaluate the physical characteristics and performance of the abrasives. Eachmethod is described below:
Evaluation of Substitute Materials forSilica Sand in Abrasive Blasting
7
Blast Cleaning Procedure
A maximum of approximately 72 square feet (6 feet x 12 feet) was available forblast cleaning during each of the eight (8) trials. Approximately 50% of the surface ineach test area was rusted with minor pitting (top half) and the remaining 50% wasseverely rusted and pitted (bottom half).
The distance that the blast nozzle was held from the surface was maintained at aconstant 18 inches for all abrasive blast trials. This was accomplished through the use ofa small rod attached to the blast hose that extended to the surface. The operator kept theblast nozzle perpendicular to the steel substrate at all times. This was done to provide themaximum amount of abrasive ricochet, simulating a worst case airborne dust condition.All cleaning was performed to SSPC-SP 10/NACE No. 2 “Near-White Metal BlastCleaning”1 or better.
Cleaning Rate
Abrasive cleaning rate was calculated from the measured amount of area blastcleaned divided by the total time needed to clean the area (square feet per hour). Thesurface cleanliness was verified using SSPC VIS1-893 pictorial standards (photographsCSP10 and DSP10 [see photographs 11 and 12 in Appendix E for an example ofphotographs CSP10 and DSP10]). The time required to clean the surface was measured tothe nearest second using a digital stopwatch. The time to blast clean the “smooth”surfaces and the “pitted” surfaces was recorded separately, but the total combined timewas used to calculate the overall cleaning rate.
In all cases, the entire surface area allotted for cleaning was completed prior todepleting the quantity of media originally loaded into the abrasive hopper. In order toprovide for sufficient airborne particulate sampling time, the blaster continued to cleanthe prepared steel until the supply of abrasive was exhausted. However, the additionaltime was not reported in order to establish accurate cleaning rates.
Consumption Rate
A measured (weighed) amount of abrasive media was loaded into the abrasiveblast pot for each abrasive trial. The abrasives were stored in a climate controlled shopprior to use to minimize differences that residual moisture may have on weight. Theinitial weight of abrasive media varied due to differences in the bulk density of the typesof abrasive, but a sufficient quantity of media was loaded to permit a continuous 30 to 40minute blast sequence. In all cases, the allotted surface area was blast cleaned withoutdepleting the supply of abrasive. The actual amount of abrasive consumed during eachtrial to blast clean the square footage provided was calculated as follows:
Evaluation of Substitute Materials forSilica Sand in Abrasive Blasting
8
1. The weight of abrasive used per second of blast cleaning was calculated by dividingthe total time that abrasive flowed from the nozzle (in seconds), by the weight of theabrasive loaded into the pot.
2. The total amount (weight) of abrasive used for cleaning the surface was determinedby multiplying the amount of abrasive used per second by the time required toprepare the test area.
3. The abrasive consumption rate was determined by dividing the weight of abrasiveused during the trial, by the surface area prepared (e.g., 72 square feet). This providesabrasive usage in pounds per square feet.
Surface Profile
The surface profile resulting from each abrasive trial was measured in accordancewith Method C of ASTM D4417-93 “Standard Test Method for Field Measurement ofSurface Profile of Blast Cleaned Steel.”4 X-Coarse Testex replica tape and a springmicrometer were used. Fourteen (14) surface profile measurements were obtained foreach abrasive trial. Surface profile measurements were obtained on the top half of thebarge only, as the bottom half was severely pitted. The top portion, while smoother thanthe bottom, also contained pitting and was too rough to obtain accurate surface profiledata. Accordingly, the surface profile data is more likely to be due to the irregular textureof the substrate, than the abrasive.
Abrasive Particle Size Distribution
A one hundred pound sample of each abrasive, as received from the supplier ordistributor, was riffled three times to ensure a homogeneous mixture of abrasive particlesizes. A one hundred gram sample of this virgin abrasive was removed from thehomogeneous mix and analyzed for particle size distribution in accordance with ASTMC136 “Standard Test Method for Sieve or Screen Analysis of Fine and Coarse
5. The abrasive sample was tamped and shaken through a series of sieves forseven minutes. The sieve sizes used were 10, 12, 16, 20, 30, 40, 50, 60, 70, 100, 140,200, 270, with a pan at the bottom. An electric Ro-Tap Model B aggregate shaker wasused. See example KTA Sieve Analysis Report Form (Appendix 3 – Exhibit 2).
The abrasive retained on each screen was emptied into numbered and tarredsample cups. The underside of each screen was cleaned with a brass brush to loosentrapped particulate, and the particulate was added to the appropriate sample cups. Thecontent of each sample cup was weighed to the nearest tenth of a gram and documented.This value (weight of particles retained on each screen) was multiplied by the screen sizeopening (in millimeters). These numbers were summed and divided by the cumulativeweight of the sample to establish an average particle size for each lot of abrasive. Theaverage value represents the size, above which and below which, approximately 50 % ofthe mass of the abrasive is found.
Evaluation of Substitute Materials forSilica Sand in Abrasive Blasting
9
A statistical process control was used to ensure repeatability and validity of thesieve analysis portion of the abrasive testing. Since the screens used for sieve analysisare constructed of fine wires with very close tolerance spacing, it was critical to verifythat the screen size openings were not affected by repeated use. Three 100 gram sampleswere drawn from the same riffled mixture of one of the abrasives at the beginning ofPhase 1 of this study. The samples were sieved five times to develop a control capabilityanalysis for each sample. One sample (Sample A) was used for this study. The samplehad an average particle size of 0.43 mm with no variation. Once before and once after thePhase 2 study, Sample A was sieved using the identical process. The results of the sieveanalysis were identical at the beginning of Phase 2, and at the end of Phase 2 (after a totalof 16 sieve analysis on 8 abrasives).
Abrasive Breakdown Rate
At the completion of each abrasive run, a one hundred pound sample of the spentabrasive was collected from several areas of the containment floor and riffled three timesto obtain a homogeneous mixture. A 100 gram sample was removed and analyzed forparticle size distribution using the identical process as described in the section titled“Abrasive Particle Size Distribution”. The amount of abrasive breakdown wasdetermined by comparing the average particle size of the pre-blast (virgin) abrasive to theaverage particle size of the post-blast abrasive. The abrasive breakdown rate wascalculated and is reported as the percentage change in average particle size.
Abrasive Embedment
Abrasive embedment is defined as the percentage of abrasive particles that remainaffixed to the prepared substrate and cannot be removed by cleaning with a stiff bristlebrush or a focused stream of compressed air. The amount of abrasive embedment wasevaluated only on the top (unpitted) portions of the barge (similar to the locationsselected for the surface profile measurements). A 12.7 mm (1/2") x 12.7 mm (1/2")piece of transparent mylar with a printed grid of 100 squares (each 1.3 mm x 1.3 mm insize) was placed on the surface and viewed through a 10X illuminated magnifier to makethe determination. Each of the 100 squares was evaluated for the presence of embeddedabrasive particles. In the event an embedded particle fell between two or more squares,only one of the squares was counted. The number of squares containing one or moreembedded particles was summed to determine the number of squares out of 100 thatexhibited embedded abrasive particles. This number was reported as a percentage.Thirty-five (35) locations were evaluated on each prepared surface.
Abrasive Bulk Samples
One pound bulk samples of both pre-blast (virgin) abrasive material and post-blast abrasive material were obtained for each abrasive trial and submitted to NIOSH foranalysis. Homogeneous pre-blast samples were collected as described above in thesection entitled “Abrasive Particle Size Distribution.” Homogeneous post-blast sampleswere collected as described in the section entitled “Abrasive Breakdown Rate.”
Evaluation of Substitute Materials forSilica Sand in Abrasive Blasting
10
Industrial Hygiene Sampling
A proposed exposure monitoring protocol was developed to ensure collection ofadequate data on airborne total particulate, total dust levels for 28 metals/elements, andrespirable quartz and cristobalite. At the direction of NIOSH, the total particulatesamples were not required for Phase 2. The specific analytes tested in Phase 2 included:
aluminum calcium lead nickel sodium yttriumarsenic chromium lithium phosphorous tellerium zincbarium cobalt magnesium platinum thallium zirconiumberyllium copper manganese selenium titanium quartzcadmium iron molybdenum silver vanadium cristobalite
The protocol was also designed to ensure the reproducibility of the test methodsand to prevent cross-contamination from abrasive media. The elements of the approvedassessment protocol included:
• Protection of Human Subjects• Sample Collection Methodology and Filter Media Positioning• Calibration of Sampling Pumps• Background Monitoring• Preparation of Test Facilities• Sample Collection During Abrasive Trials• Post Sample Collection Procedure
Protection of Human Subjects
Protection of human subjects (e.g., blasters, laborers, quality control personnel)was monitored throughout the study. Prior to initiation of Phase 2, assigned projectpersonnel were trained in the health effects of arsenic, cadmium, chromium, copper, iron,lead, nickel, silica, and zinc 6. Proper use of personal protective equipment, respiratoryprotection, and decontamination procedures were also reviewed. Finally, a medicalsurveillance program was initiated to help ensure that project personnel were adequatelyprotected during the study. Medical surveillance consisted of: blood lead and zincprotoporphyrn (ZPP) levels; cadmium in blood and in urine (grams of creatinine andbeta-2 microglobulin); spirometry testing (FEV and FVC); blood chemistry profile; andcomplete blood count with differential. Pre- and post-project medical surveillance testingwas performed by Mobile Medical Screening Corporation of Pittsburgh, Pennsylvania.Appendix 4 represents sample pre- (Exhibit 1) and post-medical (Exhibit 2) forms used intesting.
Personal protective equipment utilized by the blaster included a Bullard Model 77Type CE supplied air helmet (APF, assigned by OSHA for worker exposures to airbornelead particulate, of 1000 and an APF of 25, assigned by NIOSH, for all other airborneparticulates) with Grade D breathing air supply, cotton coveralls, gloves, boots and
Evaluation of Substitute Materials forSilica Sand in Abrasive Blasting
11
hearing protection (NRR 29). Separate work clothing was worn beneath coveralls, andno food, beverages, tobacco or cosmetics were permitted in the test area, which wasdemarcated using signage and yellow caution tape. Support personnel were similarlyoutfitted, except that half-face, negative-pressure, air-purifying respirators with HEPAfiltration were worn, (APF of 10), instead of the blast helmet. All project personnelwashed hands and face prior to eating, drinking or smoking.
Sample Collection Methodology and Filter Media Positioning
During each abrasive trial, airborne samples were collected inside thecontainment as well as on the operator. Containment area samples consisted of: 28airborne metals/elements; respirable crystalline silica and cristobalite; respirableradiochemically active materials; and total airborne radiochemically active materials.Head loss was tested for the 32' 4" length tubes and compared to standard length 3' tubesat flow rates of 1.0, 1.7, and 2.0 liters per minute. The comparative head loss wasdetermined to be minimal. Sampling was conducted under the NIOSH methods7: 7500for respirable quartz, 7300 for elements, 0600 for respirable dust; and the WR-IN-3148
standard operating procedures entitled “The Determination of Radium-226 in Solids byAlpha Spectrometry” for respirable radioactivity.
A total of fourteen (14) samples (4 make-up air area; 4 operator area; 4 exhaustarea; and 2 within the operator's breathing zone) were collected for each abrasive trial.The following samples were collected at each area (or fixed station) for each abrasivetrial: one elemental sample, one respirable crystalline silica sample, one respirableradioactivity sample, and one total airborne radioactivity sample. One elemental sampleand one respirable crystalline silica sample were collected within the operator’s breathingzone for each abrasive trial. One virgin and spent bulk sample were collected for eachabrasive trial and analyzed for thirty health-related agents. The airborne and bulksamples were analyzed by the following NIOSH methods: 7500 (x-ray diffraction) forrespirable quartz; 7300 for all elements, except the graphite furnace method for arsenic,beryllium, cadmium, and lead; the WR-EP-3259 standard operating procedure titled“Determination of Gamma Emitting Isotopes” for radioactivity in bulk samples and theWR-IN-314 standard operating procedures titled “The Determination of Radium-226 inSolids by Alpha Spectrometry” for respirable radioactivity in airborne samples.
Area airborne sampling was conducted using Gilian, SKC and GAST Hi-Flowsampling pumps, tygon tubing and the appropriate collection device/filter media. Inorder to prevent pump damage from airborne dust concentrations inside the containment,all area sampling was performed remotely (pumps positioned outside of the containment)by traversing 32' 4" lengths of tygon tubing (3/8" O.D.) across the top and down throughthe ceiling of the containment to three fixed station locations. Four sample holders werepositioned inside the containment in each of three (3) areas, identified as the make-up airarea (fixed station #1), operator area (fixed station #2), and exhaust area (fixed station#3). Sample holders were mounted 12" from the containment wall, at breathing zoneheight (5- 6 feet). Individual samples were separated from each other by a clearance of 6inches. The sampling pumps were positioned on the opposite side of the containment
Evaluation of Substitute Materials forSilica Sand in Abrasive Blasting
12
wall, on a shelf attached to the containment wall. Each tygon tubing was identified usinga unique number (1-14); and each pump was identified using a unique letter (A-N).Independent of pump location and filter media position, all tygon tubing was of the samelength and diameter, and was identical to the length of tubing used during Phase 1.
Sampling within the blaster’s breathing zone was conducted using two (2) SKCprogrammable sampling pumps mounted on the waist of the blaster. Tygon tubingtraversed from the pump up the worker's back, over the shoulders and into the breathingzone, defined as a 6-9" hemisphere from the nose downward, and forward of theshoulders. All tygon tubing for the breathing zone sampling was the same length anddiameter (3' x 3/8" O.D.). The filter media for elemental sample collection waspositioned over the right shoulder for each abrasive trial. A 10mm nylon cycloneequipped with PVC filter media for collection of respirable crystalline silica waspositioned over the left shoulder, and centered beneath the chin area on the worker. Allfilter media was positioned outside the blast helmet in a downward position, forward ofthe shoulder, and attached to the blast helmet cape using collar clips.
Calibration of Sampling Pumps
The Gilian, SKC and GAST sampling pumps were calibrated prior to eachsampling period (through the filter media) using a Gilian Model 800271 Gilibratorprecision flow bubble meter equipped with a standard flow cell (20cc to 6 l/m). Eachsampling pump was equipped with the respective filter media, then connected to theGilibrator. Adjustments to each pump were made using the flow adjustment screw orflow restrictor valve (GAST pumps) until the target flow was achieved. Subsequently,five (5) flow measurements were recorded, then averaged for each sampling pump. Thedata was recorded on a Pump Calibration Report (example attached in Appendix 3,Exhibit 3).
The sampling pumps equipped with 10mm cyclones for collection of respirablecrystalline silica and respirable radiochemically active material were calibrated inaccordance with the Occupational Safety and Health Administration (OSHA) TechnicalManual Chapter 1, “Personal Sampling for Air Contaminants”; Section C, Technique 310.Briefly, the filter media was mounted in MSA 10mm nylon cyclones. The filter mediaand cyclone were then placed in a one liter vessel with two (2) ports in the screw top lid.A 12" section of tygon tubing was connected from one port on the glass vessel to theGilibrator precision flow bubble meter. The sampling pump was connected to the secondport on the vessel using the appropriate length of tygon tubing (32' 4" for area samplingin the containment and 3' for breathing zone monitoring on the worker) and the samplingpump adjusted to maintain a flow rate of 1.7 L/min.
The sampling pumps for collection of metals/elements were targeted forcalibration at 2.0 liters per minute through 0.8 micron pore size, 37mm diameter, mixedcellulose ester (MCE) membrane filter media, encased in 37mm plastic cassettes. Thesampling pumps for collection of respirable dust and respirable radiochemically activematerial were targeted for calibration at 1.7 liters per minute through pre-weighted, 0.5
Evaluation of Substitute Materials forSilica Sand in Abrasive Blasting
13
micron pore size, 37mm diameter PVC filter media, also encased in 37mm plasticcassettes. Finally, the sampling pumps for collection of total radiochemically activematerial were targeted for calibration at 4.0 liters per minute through pre-weighed, 0.5micron pore size, 37mm diameter, PVC filter media encased in 37mm plastic cassettes.
Background Monitoring
Prior to initiation of the study, background sampling was conducted for eight (8)hours to determine the existing airborne concentrations of the targeted metals/elements,respirable crystalline silica and radiochemically active materials, and totalradiochemically active materials. The ventilation system was activated, drawing cross-sectional air flow through the facility. Otherwise, the containment remained undisturbedduring background monitoring.
Preparation of Containment Facility
To prevent cross-contamination of abrasive media after each abrasive trial, thecontainment floor, dust clinging to the walls, ceiling, floor, sample holders, test platerack, and other surfaces were vacuumed to collect spent abrasive debris and dust.Subsequently, prior to each abrasive trial, the containment was visually inspected for thepresence of abrasive debris from the previous blast trial. Additionally, a “white glove”examination was conducted on a minimum of five (5) random surfaces. The presence of“swipe marks” left by the glove was case for rejection and recleaning as necessary.
In addition to the containment, support equipment used for the blast cleaningprocess was also cleaned and visually examined for residual dust. This equipmentincluded the blast nozzle and hoses, blast pot, personal protective equipment (blasthelmet and cape), and protective clothing.
After the cleanliness inspection, a ventilation system inspection was performed bymeasuring the cross-sectional air flow through the containment using an Alnor Model RVRotating Vane Anemometer. Twelve (12) measurements of cross-draft air flow wereobtained midway through the containment. Four (4) measurements were obtained nearthe ceiling (7-8' above floor level), four (4) measurements were obtained at the breathingzone height (5' above floor level), and four (4) measurements were obtained 6-12" fromthe floor. The twelve measurements were averaged, and the results of the ventilationassessment and containment cleanliness recorded on a Mechanical Ventilation EvaluationForm and Industrial Hygiene Report Form, respectively (examples attached in Appendix3, Exhibit 4 and Exhibit 5).
Sample Collection During Abrasive Trials
Prior to initiating each blast trial, the unique number assigned to each filter mediaby NIOSH was transcribed to the Industrial Hygiene Report Form. Concurrently, aposition number was assigned to each filter media to ensure proper positioning/tygontubing connection once inside the containment. Each filter cassette/cyclone assembly
Evaluation of Substitute Materials forSilica Sand in Abrasive Blasting
14
was carefully mounted in the holders inside the containment. The inlet ports of thecassettes remained plugged until the operator was ready to begin blast cleaning(exception - cyclone-mounted media). Subsequently, the personal pumps were mountedon the blaster and the cassette inlet port plugs were removed.
The two (2) personal sampling pumps mounted on the blaster were programmableSKC personal sampling pumps. The pumps were programmed to initiate sampling 3minutes after the abrasive trial began in order to provide time to allow airborneconcentrations of dust to equilibrate, and to stop sampling 24 minutes into the samplingperiod (to prevent overloading of the filter media). The total elapsed time of 27 minuteswas based on information collected in a pilot study conducted prior to the Phase 1laboratory study to estimate the best sampling rates to avoid overloading of the samplefilters for elemental dust and to allow enough time to collect a minimum of respirablecrystalline silica dust.
Similarly, the sampling pumps collecting airborne debris in the make-up air,operator, and exhaust areas were also turned on after 3 minutes had elapsed and stopped24 minutes later.
Post Sample Collection Procedure
Post sample collection procedures included sample security, removal of samplesfrom the operator and containment, pump flow rate verification and sampling equipmentcleaning. Sample security was accomplished by plugging the inlet port of the filtermedia, then removing the media from the sampling hose and plugging the outlet port.This procedure was conducted on the operator first, then the containment area samples.Support personnel were prohibited from entering the blast facility until all inlet portswere sealed. Subsequently, the cyclones were carefully removed, kept in a verticalposition, then placed in a customized holder. The holder kept the cyclones vertical toensure the large debris which accumulated in the grit pot at the base of the cyclones didnot come in contact with the PVC filter media. The filter cassettes were removed fromthe containment, and the cassettes sealed using 9/16" x 3-7/16" labels, each containingthe date and technician's initials. This was done to prevent tampering with the samples,as well as accidental dislodging of the inlet port caps. The samples were sorted accordingto required analysis, then boxed for transportation by KTA personnel to NIOSH inMorgantown, West Virginia for analysis in accordance with the appropriate NIOSHanalytical methods. A Sample Submittal Form and Chain-of-Custody accompanied thesamples (example included in Appendix 3, Exhibit 6 and Exhibit 7). Additionally, 20%field “blank” samples were added to the shipment (also categorized by type of analysis).Four field blanks were submitted for respirable quartz and cristobalite analysis and onefield blank each was submitted for respirable and total radium-226. Neither respirablequartz, cristobalite, respirable radium-226, nor total radium-226 were detected in any ofthe field blanks, so the sample results did not need to be adjusted for the field blanks.
After all samples were secure, post-sampling pump flow rate verification wasconducted by connecting each pump to the Gilian Gilibrator precision flow bubble meter

Evaluation of Substitute Materials forSilica Sand in Abrasive Blasting
15
(through the respective media) and recording five flow rates as well as the average flowrate (in LPM) on the Pump Flow Verification Report Form (example included inAppendix 3, Exhibit 8). The pre- and post-sampling flow rates for each pump wereaveraged to create an average flow rate for the actual sampling period. This flow ratewas reported to NIOSH to calculate the total volume of air sampled on each filtercassette.
After post-calibration, operator breathing zone pumps and hoses were wiped witha dampened cloth to remove residual dust. The 10mm nylon cyclones were cleaned inaccordance with the OSHA Technical Manual, Chapter 1, Section C.3(6)e. “cyclonecleaning”. The grit pot was removed from the base of the cyclone and gently tapped on acounter top to remove the large particles. The size selective inlet was disassembled andthe components were thoroughly rinsed using tepid tap water. Subsequently, all nyloncomponents were cleaned in a 22-watt ultrasonic bath manufactured by Fisher Scientific(Model FS-3). A mild solution of Alconox detergent powder in tap water was used toclean the parts for approximately ten (10) minutes. Each component was then thoroughlyrinsed with tepid tap water and dried. After drying, the cyclones were inspected for wear,then reassembled for the next abrasive trial.
Documentation
The following documentation report forms were used for the collection of all data.Examples of each form are included in Appendix 3. Actual forms completed during thestudy were provided to NIOSH under separate cover.
Blast Cleaning Inspection Report # QPF-WDC345R.1 – Report form is for collectionand record keeping of all data and variables associated with first and last runs duringabrasive testing.
Sieve Analysis Report # MATF 100R.2 – Report form is for the collection and recordkeeping of data associated with screening for particle size. Calculations to developaverage particle size and charting results are also included on report form.
Industrial Hygiene Report – Report form is for collection of data and acts as a checklistto ensure completion of pretest industrial hygiene practices. The report records air filtercassette sample numbers, type of filter media, duration of air flow over cassette, and totalvolume of air to flow over air sample media.
Pump Calibration Report – Report of calibration and actual air flow prior to test.
Pump Flow Verification Report – Report to verify post run actual air flow.
Mechanical Ventilation Evaluation – Form used for collection and calculation of airflow through the blast room.
Evaluation of Substitute Materials forSilica Sand in Abrasive Blasting
16
Sample Submittal Form – Used to provide sample identification and sample collectionparameters for submission to NIOSH for corresponding industrial hygiene analysis.
Chain-of-Custody – Used to verify the integrity of the samples and resulting datathroughout the collection, transport, and analysis activities.
Concerns
The size and scope of the testing program resulted in a few deficiencies in boththe development of the testing protocol and execution of the abrasive blasting trials.Each concern, its cause, and resolution is described in the sections that follow.
Abrasive Metering Valve
The abrasive metering valve is an integral part of any blast cleaning pressure pot.The purpose of the valve is to meter the amount of abrasive that is fed into the stream ofcompressed air, which propels the abrasive particles.
For the Phase 2 study, KTA fabricated a metering valve plate with five (5) fixedsettings in order to achieve a greater consistency in valve adjustment than is possible withthe standard valve. The valve was adjusted by the “feel” of the operator prior to each runfor each abrasive. This was done without any input from the abrasive manufacturers.The valve settings are documented in Table A1.
Production Rates
The factors that effect abrasive blast cleaning productivity are:
• Abrasive Type – The specific abrasive selected from within a given generic categorycan effect the results. As was demonstrated in the Phase 1 laboratory study, theresults between the individual abrasives varied (e.g., the cleaning rate of 4 copper slagabrasives ranged from 28 to 61 square feet/hour). Only one of each abrasive type wasselected for the Phase 2 study. Depending upon which abrasive was selected, theresults for the generic category may appear to be better or worse than the otherabrasives on a relative basis.
• Metering Valve Setting – Each operator and abrasive supplier will likely have theirown “feel” as to the appropriate setting to optimize productivity. Small adjustmentsmay have a significant effect on abrasive consumption and productivity.
• Nozzle Size – Abrasive blast nozzles with larger openings produce a larger blastpattern on the surface being cleaned. Blast nozzles typically range in size from 1/8inch to 1/2 inch orifice diameter, in 1/16 inch increments. Larger sized nozzles alsopermit more abrasive impacts per unit area since more abrasive particles exit thenozzle over a given unit of time. During this Phase 2 study, KTA used a 7/16 inchnozzle which is reasonably typical of production work.
Evaluation of Substitute Materials forSilica Sand in Abrasive Blasting
17
• Nozzle Type – There are currently two types of blast nozzles used during fieldblasting operations. These are categorized by the nozzle geometry. Straight borenozzles have a constant orifice diameter for the length of the nozzle. Venturi nozzlesconverge to the nozzle’s size at a point approximately half of the nozzle’s length andthen diverge for the remainder of the nozzle. The converging portion of the nozzleaccelerates the air and abrasive particles resulting in increased impact energy which,in turn, enhances productivity. The diverging portion of the venturi nozzle alsoprovides an increased blast pattern. KTA used the same venturi nozzle for allabrasive trials.
• Standoff Distance – The standoff distance is the distance that the nozzle is held inrelation to the item being cleaned. This distance is critical to abrasive blastingproduction. Blast operators typically optimize the distance to achieve the desiredblast pattern and cleaning rate. This distance could range from 6 inches to 24 inches.Generally, nozzles are held closer to the substrate to clean tightly adherent mill scaleor coatings which require a smaller blast pattern to achieve the specified surfacecleanliness. When surfaces being cleaned exhibit loosely adherent coatings or flakingmill scale and rust, the larger blast pattern produced at greater standoff distancesallows for faster cleaning. The standoff distance was held constant for all abrasivetrials at 18 inches to measure the effectiveness of the different abrasives independentof the operators’ skill or experience. This would also provide consistent, repeatableresults, but the fixed distance will affect the ability of different abrasives to clean.
• Angle of Attack – The angle of attack is the angle that the nozzle is held to the work-piece. Most field abrasive blast cleaning is performed with the nozzle held between60o to 120o to the surface. Nozzles held perpendicular (90o) to the surface providemore impact energy, which fractures tightly adherent coatings and mill scale.Nozzles held at angles greater than or less than 90o scour the surface. Experiencedabrasive blast operators use a combination to achieve high productivity. During thisabrasive study, the KTA operator held the nozzle perpendicular to the surface beingcleaned so that the greatest amount of dust would be produced for industrial hygienemonitoring. Such restrictions, however, can affect cleaning rates.
• Dwell Time – Dwell time is the amount of time required to achieve the desiredsurface cleanliness before the nozzle can be moved to the next area on the substrate.This factor is highly influenced by the size of the blast pattern. For small blastpatterns, where the nozzle is held close to the surface being cleaned, the dwell time isvery short. When a larger blast pattern is used, the dwell time may be longer. Onceagain, the operator’s skill and knowledge of the cleanliness specification help toreduce dwell time, thus increase productivity. Some of this control was removedfrom the operator during the study by fixing the nozzle distance and angle of attack.
• Nozzle Pressure – The pressure of the air/abrasive stream during blasting operationsgreatly influence cleaning productivity. For most abrasives, increased pressureresults in increased production. Generally, abrasive blasting pressure is increased to

Evaluation of Substitute Materials forSilica Sand in Abrasive Blasting
18
the maximum capacity of the air compressor used. With the exception of abrasivessuch as steel grit, diminishing returns occur at pressures significantly above 100 psi.Some abrasives however, efficiently produce the desired surface cleanliness at lowerpressures. The garnet supplier used during the study preferred nozzle pressures in therange 60 to 80 psi in order to reduce breakdown rate and improve the reusecharacteristics. During each abrasive trial run conducted as a part of this study, thenozzle pressure was held constant at 100 psi. This was necessary to limit the numberof variables in the study.
• Substrate Type – The type and condition of the substrate will effect productivity. Inthis case, the barge was heavily pitted, which will reduce productivity compared withsmooth steel, by virtue of the time required to clean the pits and rust scale.
Each of these factors affected the cleaning rate and consumption rate results.Many of the factors are dependent on the skill or experience of the blast nozzle operator.The goal of this study design was to produce comparable abrasive blast cleaning resultswith the abrasive type being the variable. As compared to Phase 1, the Phase 2 fieldstudy had less control over environmental variables (wind velocity and direction, relativehumidity, air temperature, temperature of the substrate blasted, etc.) and less control oversome blast conditions (barge steel substrate blasted on, metering valve setting varied),and were therefore more representative of real-world conditions. Also, the operator usedfor the study was chosen based upon consistent results obtained during the operatorvariability study, which was conducted in the Phase 1 laboratory study to determine theoperator with the lowest variability based on productivity results, not the operatordisplaying the highest productivity or having the most experience.
Ventilation Rate
The protocol called for a nominal cross-sectional flow rate (velocity) of air of 50to 75 feet per minute (fpm). Due to the size and configuration of the requiredcontainment and the capacity of the available dust collector, the actual average cross-sectional flow rate was 40 fpm. This reduction in air flow could result in concentrationsslightly above those in Phase 1, where air flow was maintained at the target 50 to 75 fpm.
In conclusion, the Study Design/Protocol was developed to measure the healtheffects and effectiveness of 8 different abrasives. The factors affecting the abrasive blastcleaning process were held constant so that a comparative evaluation of the abrasivescould be made independent of the substrate, surface cleanliness, equipment setup, oroperator. KTA did not deviate from the Study Design/Protocol during the entire field sitetesting phase of the project.
Evaluation of Substitute Materials forSilica Sand in Abrasive Blasting
19
TEST RESULTS AND DISCUSSION
This section discusses and analyzes the results of the physical property evaluationof the abrasives and the industrial hygiene data that was collected. A total of 8 differentabrasives were evaluated in this study. For convenience, the generic abrasive type, analpha code assigned to each, and the number of individual products evaluated under eachtype are as follows:
Expendable Abrasives
Coal Slag (CS-06) 1 productNickel Slag (N-01) 1 productStaurolite (S-02) 1 productSilica Sand (SS-04) 1 productSilica Sand with Dust Suppressant (SSDS-03) 1 product
Recyclable Abrasives (used only one time for Phase 2)
Copper Slag (CP-2A) 1 productGarnet (G-3A) 1 productSteel Grit (SG-2A) 1 product
The testing clearly demonstrated that a wide range in physical properties and inheavy metal content exists between the abrasive types tested.
Physical Property Evaluations
The results of abrasive media testing are summarized from the “Blast CleaningInspection Reports” prepared for each abrasive trial. The data was obtained in order toquantify the production and performance-related attributes of each of the abrasives tested.The specific attributes examined were:
• Abrasive cleaning rate• Abrasive consumption rate• Surface profile• Abrasive breakdown rate (pre and post blast average particle size comparison)• Abrasive embedment
Many of these attributes affect the amount of time that abrasive blast operators aresubject to possible inhalation and ingestion hazards. Additionally, these attributes affectthe cleanliness of prepared surfaces, the amount of waste generated, and cost of abrasiveblast cleaning operations. Since abrasive blast cleaning is most often used for preparingsurfaces to properly accept coating systems, an evaluation of particle embedment wasperformed because contaminants carried from abrasives to the surface being preparedmay lead to premature coating failures. Premature failures of the paint system will
Evaluation of Substitute Materials forSilica Sand in Abrasive Blasting
20
unnecessarily subject workers to additional exposures by virtue of the unscheduled repairwork that will be required.
The results of the testing for each of the individual abrasives are presented in thetables attached as Appendix A. Separate tables have been prepared for each of theattributes evaluated. This section describes the type of information found in each of thetables, and provides a general summary and discussion of the results.
The results are categorized by generic abrasive type. Five (5) expendableabrasives and three (3) abrasives classified as recyclable were used. The recyclableabrasives were used only one time for this Phase 2 study. Refer to the Abrasive MediaTest Methods section of this report for a description of the test methods and associatedindustrial standards used for each of the evaluations.
Abrasive Cleaning and Consumption Rates
Table A1 (Appendix A) provides the results of the cleaning and consumptionrates for each of the abrasives tested. The table presents the cleaning rate in squarefeet/hour and the abrasive consumption rate in pounds per square foot.
As indicated in the Study Design and Test Methods section of this report, the blastcleaning trials were conducted using a 7/16" orifice nozzle at 100 psi. Blast distance wasfixed at 18" from the surface with the nozzle maintained at right angles at all times. Suchrestrictions were invoked in order to control as many variables as possible between eachof the runs. One variable that was not held constant involved the metering valve setting.The metering valve was set uniquely for each abrasive prior to use. The setting wasbased on the “feel” of the operator.
While all of the controls previously described were designed to allow for a moreaccurate comparison of the properties between abrasives, a disadvantage also occurs.The equipment and operational controls can restrict productivity and adversely affectabrasive consumption rates. Despite these concerns, the cost data that is calculated in theCost Evaluation section of this Discussion is based on the consumption rates obtained. Itis important to recognize that the Phase 1 Study demonstrated that the cleaning ratebetween various abrasives within a given class was variable. For example, the laboratorycleaning rate for the four copper slag abrasives ranging from 28 to 61 square feet/hourand the two steel grit abrasives were 29 and 39 square feet/hour. For Phase 2, only 1 ofthe abrasives within each generic type was selected. As a result, conclusions regardingan entire class of abrasives based on the specific abrasive evaluated are inappropriate. Inaddition, when optimum operating conditions for each abrasive is selected for field use,dramatically different cleaning and consumption rates will result, both in an absolute andrelative sense.
Cleaning Rates – As can be seen in Table A1, the cleaning rates derived from the studyshow:
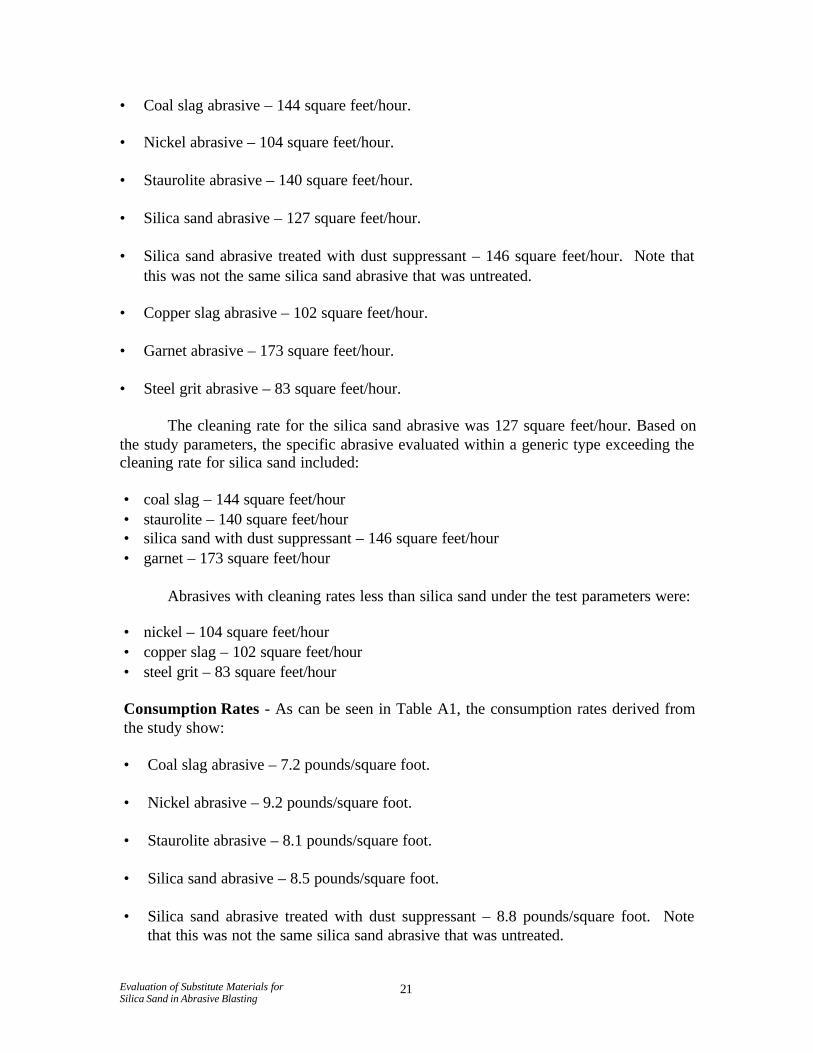
Evaluation of Substitute Materials forSilica Sand in Abrasive Blasting
21
• Coal slag abrasive – 144 square feet/hour.
• Nickel abrasive – 104 square feet/hour.
• Staurolite abrasive – 140 square feet/hour.
• Silica sand abrasive – 127 square feet/hour.
• Silica sand abrasive treated with dust suppressant – 146 square feet/hour. Note thatthis was not the same silica sand abrasive that was untreated.
• Copper slag abrasive – 102 square feet/hour.
• Garnet abrasive – 173 square feet/hour.
• Steel grit abrasive – 83 square feet/hour.
The cleaning rate for the silica sand abrasive was 127 square feet/hour. Based onthe study parameters, the specific abrasive evaluated within a generic type exceeding thecleaning rate for silica sand included:
• coal slag – 144 square feet/hour• staurolite – 140 square feet/hour• silica sand with dust suppressant – 146 square feet/hour• garnet – 173 square feet/hour
Abrasives with cleaning rates less than silica sand under the test parameters were:
• nickel – 104 square feet/hour• copper slag – 102 square feet/hour• steel grit – 83 square feet/hour
Consumption Rates - As can be seen in Table A1, the consumption rates derived fromthe study show:
• Coal slag abrasive – 7.2 pounds/square foot.
• Nickel abrasive – 9.2 pounds/square foot.
• Staurolite abrasive – 8.1 pounds/square foot.
• Silica sand abrasive – 8.5 pounds/square foot.
• Silica sand abrasive treated with dust suppressant – 8.8 pounds/square foot. Notethat this was not the same silica sand abrasive that was untreated.
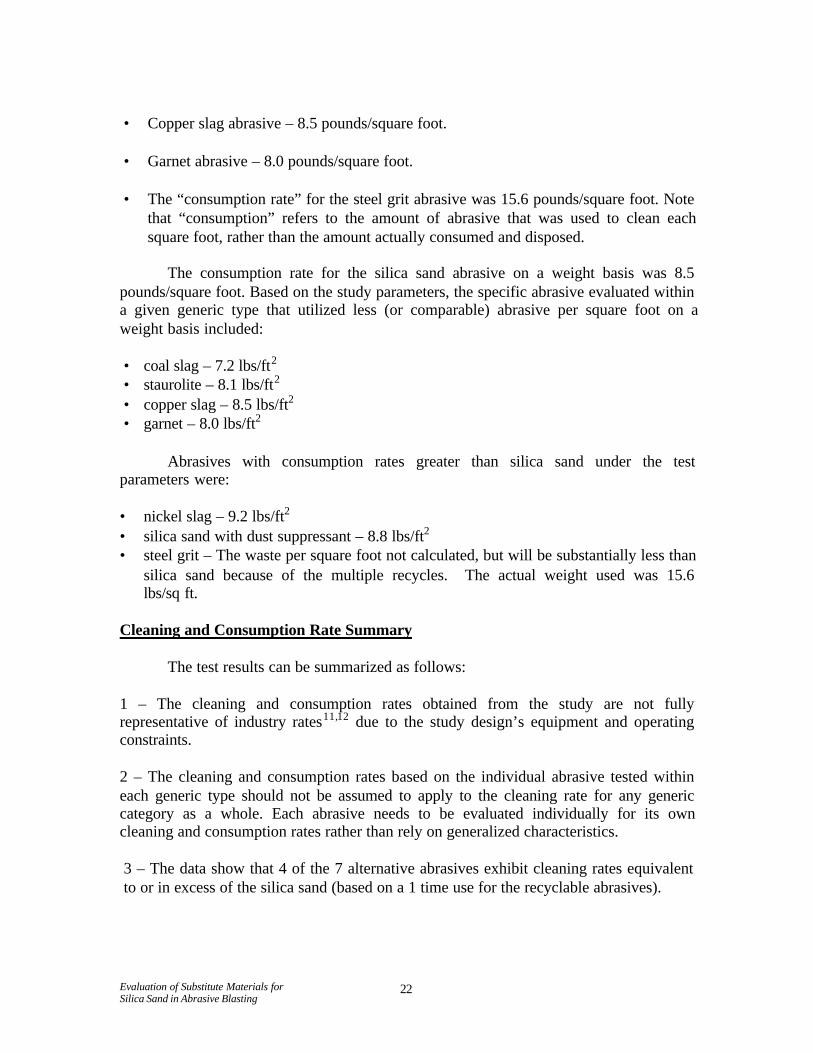
Evaluation of Substitute Materials forSilica Sand in Abrasive Blasting
22
• Copper slag abrasive – 8.5 pounds/square foot.
• Garnet abrasive – 8.0 pounds/square foot.
• The “consumption rate” for the steel grit abrasive was 15.6 pounds/square foot. Notethat “consumption” refers to the amount of abrasive that was used to clean eachsquare foot, rather than the amount actually consumed and disposed.
The consumption rate for the silica sand abrasive on a weight basis was 8.5pounds/square foot. Based on the study parameters, the specific abrasive evaluated withina given generic type that utilized less (or comparable) abrasive per square foot on aweight basis included:
• coal slag – 7.2 lbs/ft2
• staurolite – 8.1 lbs/ft2
• copper slag – 8.5 lbs/ft2
• garnet – 8.0 lbs/ft2
Abrasives with consumption rates greater than silica sand under the testparameters were:
• nickel slag – 9.2 lbs/ft2
• silica sand with dust suppressant – 8.8 lbs/ft2
• steel grit – The waste per square foot not calculated, but will be substantially less thansilica sand because of the multiple recycles. The actual weight used was 15.6lbs/sq ft.
Cleaning and Consumption Rate Summary
The test results can be summarized as follows:
1 – The cleaning and consumption rates obtained from the study are not fullyrepresentative of industry rates11,12 due to the study design’s equipment and operatingconstraints.
2 – The cleaning and consumption rates based on the individual abrasive tested withineach generic type should not be assumed to apply to the cleaning rate for any genericcategory as a whole. Each abrasive needs to be evaluated individually for its owncleaning and consumption rates rather than rely on generalized characteristics.
3 – The data show that 4 of the 7 alternative abrasives exhibit cleaning rates equivalentto or in excess of the silica sand (based on a 1 time use for the recyclable abrasives).
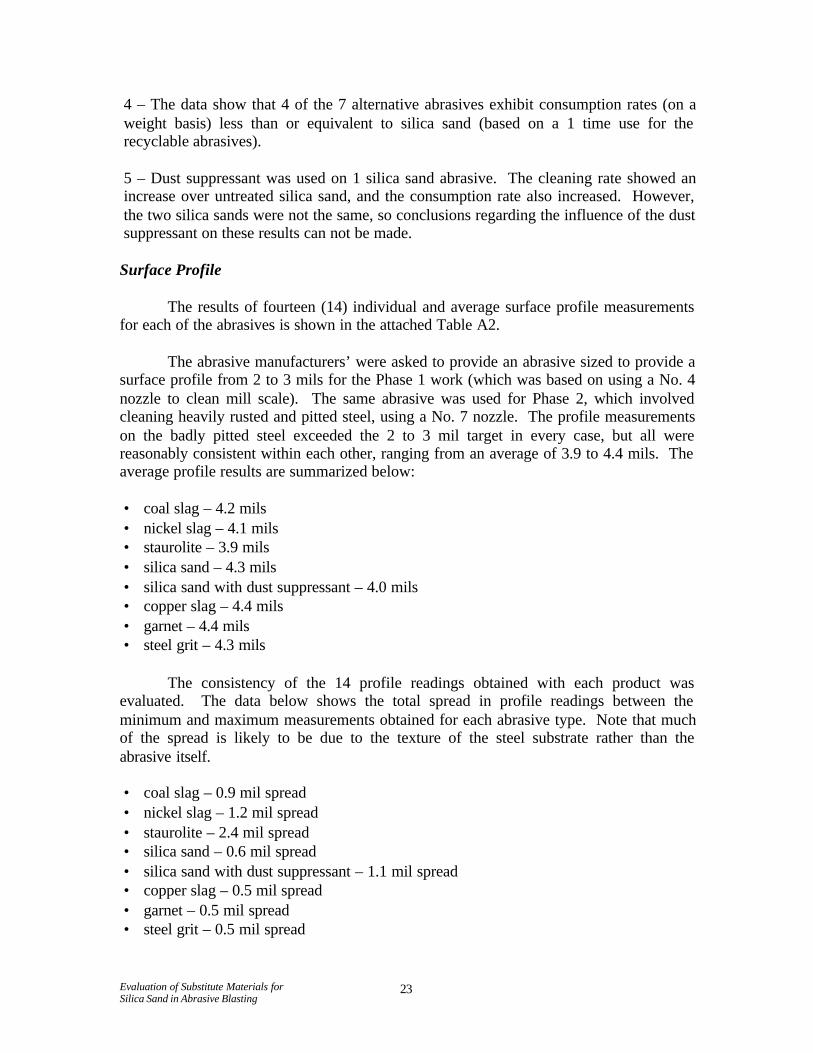
Evaluation of Substitute Materials forSilica Sand in Abrasive Blasting
23
4 – The data show that 4 of the 7 alternative abrasives exhibit consumption rates (on aweight basis) less than or equivalent to silica sand (based on a 1 time use for therecyclable abrasives).
5 – Dust suppressant was used on 1 silica sand abrasive. The cleaning rate showed anincrease over untreated silica sand, and the consumption rate also increased. However,the two silica sands were not the same, so conclusions regarding the influence of the dustsuppressant on these results can not be made.
Surface Profile
The results of fourteen (14) individual and average surface profile measurementsfor each of the abrasives is shown in the attached Table A2.
The abrasive manufacturers’ were asked to provide an abrasive sized to provide asurface profile from 2 to 3 mils for the Phase 1 work (which was based on using a No. 4nozzle to clean mill scale). The same abrasive was used for Phase 2, which involvedcleaning heavily rusted and pitted steel, using a No. 7 nozzle. The profile measurementson the badly pitted steel exceeded the 2 to 3 mil target in every case, but all werereasonably consistent within each other, ranging from an average of 3.9 to 4.4 mils. Theaverage profile results are summarized below:
• coal slag – 4.2 mils• nickel slag – 4.1 mils• staurolite – 3.9 mils• silica sand – 4.3 mils• silica sand with dust suppressant – 4.0 mils• copper slag – 4.4 mils• garnet – 4.4 mils• steel grit – 4.3 mils
The consistency of the 14 profile readings obtained with each product wasevaluated. The data below shows the total spread in profile readings between theminimum and maximum measurements obtained for each abrasive type. Note that muchof the spread is likely to be due to the texture of the steel substrate rather than theabrasive itself.
• coal slag – 0.9 mil spread• nickel slag – 1.2 mil spread• staurolite – 2.4 mil spread• silica sand – 0.6 mil spread• silica sand with dust suppressant – 1.1 mil spread• copper slag – 0.5 mil spread• garnet – 0.5 mil spread• steel grit – 0.5 mil spread
Evaluation of Substitute Materials forSilica Sand in Abrasive Blasting
24
The surface profile results can be summarized as follows:
1 – One abrasive (staurolite) provided an average profile less than 4.0 mils (3.9 mils).The remaining 7 abrasives provided profiles ranging from 4.0 to 4.4 mils.
2 - Dust suppressant was used on 1 silica sand abrasive. The surface profile compared tountreated silica sand was less (4.0 mils vs. 4.3 mils). However, since the silica sandswere not the same, the influence of the dust suppressant on profile can not be ascertained.
3 – The consistency in surface profile readings across the surface varied considerablywith the specific product (from a range of 0.5 mils to 2.4 mils). However, it is believedthat the rough, pitted texture of the substrate, rather than the abrasive itself, is responsiblefor the apparent lack of consistency, and formal conclusions should not be drawn.
Breakdown Rate (pre-blast and post-blast average particle size comparison)
Table A3 shows the change in average abrasive particle size after use. Thebreakdown percentages are reflected in two different manners in the last two columns ofthe tables. One column shows the spent abrasive in terms of percent reduction in averageparticle size (Average Particle Size is Reduced by X%). The other shows the averageparticle size of the spent abrasive as a percent of the original particle size (AverageParticle Size is X% of Original). For the purpose of the discussion below, the dataentitled, “Average Particle Size is Reduced by X%” is used. The lower the percentage,the more conducive is the abrasive for multiple uses. The lower percentages may alsoproduce less airborne dust. The percent reduction in average particle size for eachabrasive is as follows:
• coal slag – 58.82% reduction• nickel slag – 57.69% reduction• staurolite – 29.41% reduction• silica sand – 54.17% reduction• silica sand with dust suppressant – 41.03% reduction• copper slag – 65.82% reduction• garnet – 50.00% reduction• steel grit – 3.92% reduction
The results can be summarized as follows:
1 – The breakdown percentage (average particle size reduction) for silica sand was54.17%. Using this value, the abrasives showing lower breakdown percentages arestaurolite (29.45% reduction in particle size), silica sand treated with dust suppressant(41.03%), garnet (50.00% reduction), and steel grit (3.92% reduction).
2 – Based on breakdown percentages after first use, the hierarchy of abrasives most likelyto be used more than one time under the conditions of the test (arbitrarily using 40.00%

Evaluation of Substitute Materials forSilica Sand in Abrasive Blasting
25
reduction in average particle size as the threshold) are: steel grit (3.92% reduction inaverage particle size) and staurolite (29.41% reduction). It should be noted that thesupplier of the garnet abrasive recommends that pressures less than 100 psi be used inorder to reduce breakdown for recyclibility.
Abrasive Embedment
A total of 35 individual abrasive embedment evaluations were made for each blastcleaning run. The results are attached in Table A4. The results represent the number of1.3 mm x 1.3 mm squares out of 100 (covering a surface area of one-half square inch)which contained embedded abrasive particulate. The results are presented as apercentage, summarized as follows (the lower the number, the less is the embedment):
• coal slag – 16.6% embedment• nickel slag – 2.7% embedment• staurolite – 1.6% embedment• silica sand – 4.5% embedment• silica sand with dust suppressant – 1.8% embedment• copper slag – 11.0% embedment• garnet – 5.0% embedment• steel grit – 11.1% embedment
The results can be summarized as follows:
1 – The percentage of embedment for silica sand is 4.5%. Using 4.5% as the targetembedment, the abrasives showing comparable or lower embedment percentages arenickel slag (2.7%), staurolite (1.6%), and silica sand with dust suppressant (1.8%). Theremaining abrasives exhibited greater embedment.
2 - The use of dust suppressant on the silica sand abrasive showed reduced embedmentthan untreated silica sand (1.8% vs. 4.5%). However, since the silica sands were not thesame, the influence of dust suppressant on embedment can not be ascertained.
Comparisons Between Abrasive Types
A comparison of the general performance characteristics of the 8 abrasives ispresented below. Since many characteristics of an abrasive effect its performance,selection of abrasive type should not be restricted to only a single characteristic.Experimental results were graphed in order to determine the influence that one abrasiveattribute has on another. A linear regression was performed for various combinations ofattributes to determine trends. These graphs are attached in Appendix C. Theconclusions presented below are based upon this analysis for the removal of heavy rustfrom pitted steel.
Evaluation of Substitute Materials forSilica Sand in Abrasive Blasting
26
• Surface profile was directly proportional to the abrasive particle size (the larger theabrasive particle size, the deeper the profile, but the heavily pitted steel may have hada significant influence on these results)
• Cleaning rate was inversely proportional to the abrasive particle size (the larger theabrasive particle size, the slower the cleaning rate)
• Consumption rate was directly proportional to the abrasive particle size (the larger theabrasive, the greater was the abrasive consumption on a weight per square foot basis)
• Breakdown rate was directly proportional to microhardness (the harder the abrasive,the greater its friability). The microhardness values were obtained during Phase 1.
Based upon these observations, optimal abrasive materials for the removal of rustand for cleaning pitted steel would be as small as possible while maintaining the surfaceprofile requirements. (It should be noted that when removing heavy rust scale and heavypaint, the size of the abrasive is often increased to benefit from the greater mass of theabrasive in removing the heavy material, rather than “wearing it” away as would be thecase with the smaller abrasive.) If the objective is to reuse the abrasive and/or reducedusting, the hardness should be considered. Harder abrasives (with the exception ofsteel) tend to break down more rapidly than softer abrasives. Abrasives should also below in soluble contaminants in order to minimize negative effects on coatingsperformance.
With consideration of the above, the attributes of the 7 alternative genericabrasive types are reviewed.
Coal Slag
Prior to use, the specific abrasive of interest should be investigated individuallyfor its own merits rather than relying on the results of only one coal slag abrasive. Basedon the product evaluated, the cleaning and consumption rates (144 square feet/hour and7.2 pounds/square foot) are better than silica sand (127 square feet/hour and 8.5pounds/square foot). The surface profile averaged 4.2 mils, with the variation in profileacross the surface (spread of 0.9 mils) outside of the tolerances of silica sand (0.6 mils),but this is more likely due to the substrate than the abrasive. The breakdown rate(58.82%) was slightly greater than silica sand (54.17%). The amount of embedment(16.6%) was in excess of silica sand (4.5%).
Nickel Slag
Prior to use, the specific abrasive of interest should be investigated individuallyfor its own merits rather than relying on the results of only one nickel slag abrasive.Based on the product evaluated, the cleaning and consumption rates (104 square feet/hourand 9.2 pounds/square foot) are not as favorable as silica sand (127 square feet/hour and8.5 pounds/square foot). The surface profile averaged 4.1 mils, with a variation across

Evaluation of Substitute Materials forSilica Sand in Abrasive Blasting
27
the surface (spread of 1.2 mils) outside of the tolerances of silica sand (0.6 mils).However, this is more likely due to the substrate than the abrasive. The breakdown rate(57.69%) was slightly greater than silica sand (54.17%). The amount of embedment(2.7%) was slightly better than silica sand (4.5%).
Staurolite
Prior to use, the specific abrasive of interest should be investigated individuallyfor its own merits rather than relying on the results of only one staurolite abrasive. Basedon the product evaluated, the cleaning and consumption rates (140 square feet/hour, and8.1 pounds/square foot) are an improvement over silica sand (127 square feet/hour and8.5 pounds/square foot). The surface profile averaged 3.9 mils, with a variation in profileacross the surface (spread of 2.4 mils) outside of the tolerances of silica sand (0.6 mils).However, this is more likely due to the substrate than the abrasive. The breakdown rate(29.41%) was better than silica sand (54.17%). The amount of embedment (1.6%) wasbetter than silica sand (4.5%).
Silica Sand with Dust Suppressant
Prior to use, the specific abrasive of interest should be investigated individuallyfor its own merits rather than relying on the results of only one silica sand with dustsuppressant. Based on the product evaluated, the cleaning rate (146 square feet/hour) isan improvement over silica sand (127 square feet/hour). The consumption rate (8.8pounds/square foot) is slightly greater than untreated silica sand (8.5 pounds/square foot).The surface profile averaged 4.0 mils, with a variation in profile across the surface(spread of 1.1 mils) outside the tolerances of silica sand (0.6 mils). However, this is morelikely due to the substrate than the abrasive. The breakdown rate (41.03%) was betterthan silica sand (54.17%). The amount of embedment (1.8%) was better than silica sand(4.5%).
The silica sand with dust suppressant could not be compared directly withuntreated silica sand because the silica sands were different.
Copper Slag
Copper slag was classified as a recyclable abrasive for the purpose of the study,but it was used only one time in Phase 2. Prior to use, the specific abrasive of interestshould be investigated individually for its own merits rather than relying on the results ofonly one copper slag.
Based on the products evaluated, the cleaning rate (102 square feet/hour) is lessthan silica sand (127 square feet/hour). The consumption rate (8.5 pounds/square foot) iscomparable to silica sand (8.5 pounds/square foot), but may not be a valid comparisonsince the abrasive can be recycled a few times, and as such, the value represents theamount of abrasive that impacts the surface rather than the amount of abrasive“consumed.”

Evaluation of Substitute Materials forSilica Sand in Abrasive Blasting
28
The surface profile averaged 4.4 mils with a variation in profile across the surface(spread of 0.5 mils) that was within the tolerances of silica sand (0.6 mils). Note that thesubstrate most likely had a greater influence on the consistency of the profile than theabrasive. The breakdown rate (65.82%) was worse than silica sand (54.17%). Theamount of embedment (11.0%) exceeded silica sand (4.5%).
Garnet
Garnet was classified as a recyclable abrasive for the purpose of the study, but itwas used only one time in Phase 2. Prior to use, the specific abrasive of interest shouldbe investigated individually for its own merits rather than relying on the results of onlyone garnet.
Based on the product evaluated, the cleaning rate (173 square feet/hour) is greaterthan silica sand (127 square feet/hour). The consumption rate (8.0 pounds/square foot) isless than silica sand (8.5 pounds/square foot), but even then may not be a validcomparison since the abrasive can be recycled a few times, and as such, the valuerepresents the amount of abrasive that impacts the surface rather than the amount ofabrasive “consumed.”
The surface profile averaged 4.4 mils, with a variation in profile across thesurface (spread of 0.5 mils) that was within the tolerances of silica sand (0.6 mils). Notethat the substrate most likely had a greater influence on the consistency of the profile thanthe abrasive. The breakdown rate (50.00%) was slightly better than silica sand (54.17%).The amount of embedment (5.0%) was comparable to silica sand (4.5%).
Steel Grit
Steel grit was classified as a recyclable abrasive for the purpose of the study, butit was used only one time in Phase 2. Prior to use, the specific abrasive of interest shouldbe investigated individually for its own merits rather than relying on the results of onlyone steel grit.
Based on the product evaluated, the cleaning rate (83 square feet/hour) was lessthan silica sand (127 square feet/hour). The consumption rate (15.6 pounds/square foot)is not a valid comparison since the abrasive is capable of being recycled over 100 times,and as such, the value represents the amount of abrasive that impacts the surface ratherthan the amount of abrasive “consumed.” As a point of reference, the consumption ratefor silica sand in Phase 2 was 8.5 pounds/square foot.
The surface profile averaged 4.3 mils with a variation in profile across the surface(spread of 0.5 mils) which was within the tolerances of silica sand (0.6 mils). Note thatthe substrate most likely had a greater influence on the consistency of the profile than theabrasive. The breakdown rate (3.92%) was far less than silica sand (54.17%). Theamount of embedment (11.1%) exceeded silica sand (4.5%).
Evaluation of Substitute Materials forSilica Sand in Abrasive Blasting
29
Calculation of Operating Costs
In order to develop comparative costs for the use of the abrasives, a hypotheticalproject has been developed. The project involves 40,000 to 50,000 square feet of rusty,pitted steel. The crew size for the project consists of three workers: two abrasive blastnozzle operators, and one laborer. The key factors effecting surface preparation costwere taken into account. A discussion of these factors, as well as a brief description ofhow each factor effects the costs, follows.
Cleaning and Consumption Rates
As discussed in the “Concerns” section of this report, because of the restrictionsplaced on the equipment used for the Phase 2 testing, the cleaning and consumption ratesmay not be completely representative of field work. Despite this concern, costs wereevaluated using the data obtained from the study. The cleaning and consumption ratesbased on the hypothetical project are shown on Table D1, together with costs/square foot.
Abrasive Flow (Consumption) Rate
The abrasive flow rate is the amount of abrasive actually used during the blastcleaning operations. This is commonly expressed in units of tons of abrasive used perhour of operation. This factor is highly dependent on the abrasive material itself, theblast cleaning equipment utilized, nozzle sizes, pressures, equipment adjustments, thenumber of blast nozzle operators, the type and integrity of the paint coating beingremoved, and the configuration of the structure being cleaned. The rates obtained underthe study parameters were used.
Abrasive Material Cost
The cost of abrasive materials varies by generic type, manufacturer, geographiclocation, and the quantity of material purchased. Each manufacturer and/or supplier ofabrasive media used for the Phase 1 study was interviewed to determine material costs.The unit cost was based on approximately 20 tons without any delivery charge. SeeTable D1 for an itemization of material costs.
The material costs ranged from $13.00 per ton to $494.00 per ton. Within a singleclass or type of abrasive, the cost of the most expensive material was up to 64 percentgreater than the cost of the least expensive. For the purpose of this cost analysis, theaverage material cost for each of the generic abrasive types from Phase 1 was used.Many factors could affect the final purchase price of the products, but they were notinvestigated as part of this project.
Evaluation of Substitute Materials forSilica Sand in Abrasive Blasting
30
Abrasive Disposal Cost
The cost to properly dispose of the surface preparation waste varies somewhat bylocation, but is not dependent on abrasive type. The disposal cost used for this economicanalysis was for solid material categorized as non-hazardous. A non-hazardousclassification was used since historically abrasive waste free of paint or other constituentshas not been tested by the Toxicity Characteristic Leaching Procedure (TCLP)13. SinceTCLP was not used on the abrasive waste from this study, there is no basis under this costanalysis for assuming that any of the abrasives would test hazardous for disposal. Avalue of $30.00 per ton was used based upon previous experience with painting projectcost estimating and the actual cost for disposal of the abrasive waste generated during thisphase of the study.
Equipment Costs
The equipment used for dry abrasive blast cleaning operations is contingent uponwhether abrasive recycling will be employed. The surface preparation equipment usedfor expendable abrasives is less sophisticated than for recycled abrasives. For the purposeof this economic analysis, the equipment used for expendable abrasives was assumed toinclude:
120 cubic feet (six ton) abrasive blast pot..................$1,587 per month14
750 cfm of air for the two #7 nozzles.........................$2,534 per month14
When abrasives are recycled during field surface preparation work, highlyspecialized equipment is typically used to reclaim and clean the abrasive, as well as toremove fine particles in an effort to maintain consistent surface profile. The equipmentused for steel grit abrasive blast cleaning typically involves the use of an integral pressurepot, vacuum, and reclaiming blast machine equipped with air driers ($3,00015 per monthrental rate) requiring the use of a 1200 cfm compressed air supply ($3,95614 per monthrental rate). Recyclable abrasives other than steel grit require the same equipment usedfor expendable abrasives, and a less sophisticated reclaiming system ($1,50016 per monthrental rate) than is necessary for steel grit.
Equipment costs were obtained from rental rates published in the 1998 AEDGreen Book14, published by the Machinery Information Division of K-III Directory Corp.The Green Book averages national rental rates for construction equipment (the 1998version was the latest book in print at the time of the writing of this report). The costsused for the analysis were based on a rental term of one month, and values wereconverted to units of dollars per hour assuming a 40-hour workweek and a monthconsisting of four weeks.
Labor Costs
Labor rates for two abrasive blast cleaning nozzle operators and one laborer wereaveraged from eleven cities. The published prevailing wage rates for Pittsburgh, Pa. were
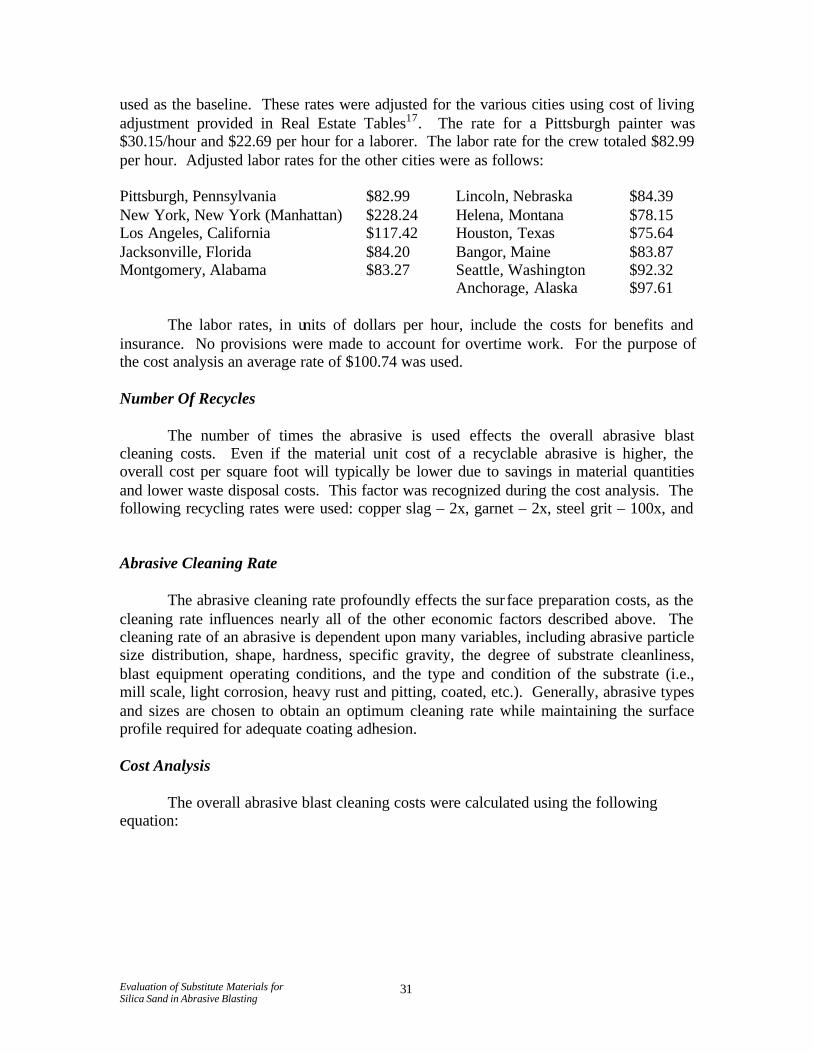
Evaluation of Substitute Materials forSilica Sand in Abrasive Blasting
31
used as the baseline. These rates were adjusted for the various cities using cost of livingadjustment provided in Real Estate Tables17. The rate for a Pittsburgh painter was$30.15/hour and $22.69 per hour for a laborer. The labor rate for the crew totaled $82.99per hour. Adjusted labor rates for the other cities were as follows:
Pittsburgh, Pennsylvania $82.99 Lincoln, Nebraska $84.39New York, New York (Manhattan) $228.24 Helena, Montana $78.15Los Angeles, California $117.42 Houston, Texas $75.64Jacksonville, Florida $84.20 Bangor, Maine $83.87Montgomery, Alabama $83.27 Seattle, Washington $92.32
Anchorage, Alaska $97.61
The labor rates, in units of dollars per hour, include the costs for benefits andinsurance. No provisions were made to account for overtime work. For the purpose ofthe cost analysis an average rate of $100.74 was used.
Number Of Recycles
The number of times the abrasive is used effects the overall abrasive blastcleaning costs. Even if the material unit cost of a recyclable abrasive is higher, theoverall cost per square foot will typically be lower due to savings in material quantitiesand lower waste disposal costs. This factor was recognized during the cost analysis. Thefollowing recycling rates were used: copper slag – 2x, garnet – 2x, steel grit – 100x, and
Abrasive Cleaning Rate
The abrasive cleaning rate profoundly effects the sur face preparation costs, as thecleaning rate influences nearly all of the other economic factors described above. Thecleaning rate of an abrasive is dependent upon many variables, including abrasive particlesize distribution, shape, hardness, specific gravity, the degree of substrate cleanliness,blast equipment operating conditions, and the type and condition of the substrate (i.e.,mill scale, light corrosion, heavy rust and pitting, coated, etc.). Generally, abrasive typesand sizes are chosen to obtain an optimum cleaning rate while maintaining the surfaceprofile required for adequate coating adhesion.
Cost Analysis
The overall abrasive blast cleaning costs were calculated using the followingequation:
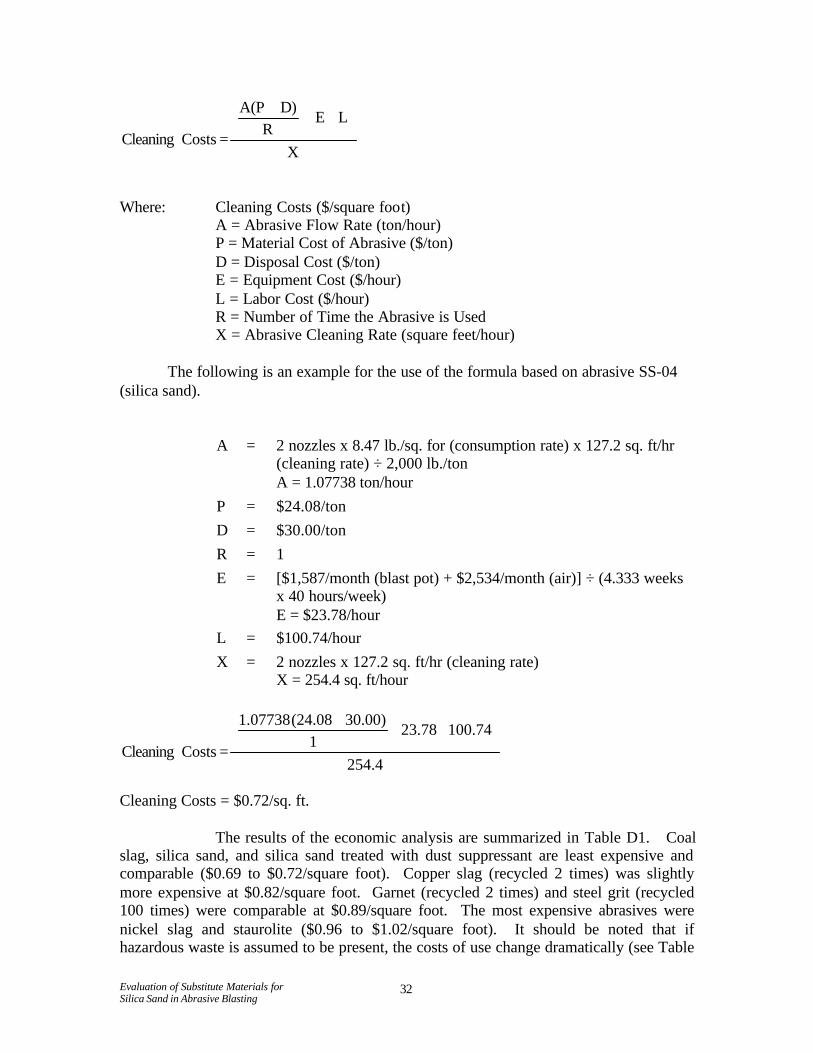
Evaluation of Substitute Materials forSilica Sand in Abrasive Blasting
32
Where: Cleaning Costs ($/square foot)A = Abrasive Flow Rate (ton/hour)P = Material Cost of Abrasive ($/ton)D = Disposal Cost ($/ton)E = Equipment Cost ($/hour)L = Labor Cost ($/hour)R = Number of Time the Abrasive is UsedX = Abrasive Cleaning Rate (square feet/hour)
The following is an example for the use of the formula based on abrasive SS-04(silica sand).
A = 2 nozzles x 8.47 lb./sq. for (consumption rate) x 127.2 sq. ft/hr(cleaning rate) ÷ 2,000 lb./tonA = 1.07738 ton/hour
P = $24.08/ton
D = $30.00/ton
R = 1
E = [$1,587/month (blast pot) + $2,534/month (air)] ÷ (4.333 weeksx 40 hours/week)E = $23.78/hour
L = $100.74/hour
X = 2 nozzles x 127.2 sq. ft/hr (cleaning rate)X = 254.4 sq. ft/hour
Cleaning Costs = $0.72/sq. ft.
The results of the economic analysis are summarized in Table D1. Coalslag, silica sand, and silica sand treated with dust suppressant are least expensive andcomparable ($0.69 to $0.72/square foot). Copper slag (recycled 2 times) was slightlymore expensive at $0.82/square foot. Garnet (recycled 2 times) and steel grit (recycled100 times) were comparable at $0.89/square foot. The most expensive abrasives werenickel slag and staurolite ($0.96 to $1.02/square foot). It should be noted that ifhazardous waste is assumed to be present, the costs of use change dramatically (see Table
X
LER
D)A(P
CostsCleaning
+++
=
254.4
100.7423.781
30.00)(24.081.07738
CostsCleaning
+++
=
Evaluation of Substitute Materials forSilica Sand in Abrasive Blasting
33
D2) The average cost of hazardous waste disposal per ton based on an SSPC study18 is$184.00. When the hypothetical example is modified to include hazardous wastedisposal, the costs range from $0.91/square foot to $1.67/square foot, with silica sandcosting $1.37/square foot. Steel grit is the least costly at $0.91/square foot.
Evaluation of Substitute Materials forSilica Sand in Abrasive Blasting
34
Industrial Hygiene Results
KTA collected a total of 64 airborne dust samples and 16 bulk samples ofabrasives (pre and post run) for this study in accordance with the protocol described inthe Study Design and Methods portion of this report. Thirty-two of the airborne sampleswere analyzed for up to 28 metals/elements. In addition, 32 air samples of respirable dustwere analyzed gravimetrically and for quartz and cristobalite. The samples weresubmitted directly to NIOSH for analysis by their contract laboratory.
The results of all airborne dust and bulk abrasive sample results are presented inAppendix B, with tabs for each analyte evaluated. Within each tab, the results for asingle specific analyte (e.g., arsenic) are summarized for all of the eight abrasivesincluded in this study. In addition to a brief description of health hazards andrecommended exposure limits, a total of 4 tables are used to present all of the dataassociated with each analyte. The general content of each table, and the sequence, inwhich they occur, is as follows.
Air Sample Results
The Air Sample Results table for each contaminant provides basic information onsampling parameters (e.g., sample number, sample volume, and abrasive code), as well aslaboratory analytical results (e.g., mass per filter, detection/quantification limits, andconcentration). The results are reported as average concentrations over the samplingperiod. Any data reported in the “Filter Notes” column 7 as “<LOQ” means that theassociated result reported in column 8 is less than the limit of quantification (LOQ), butgreater than the limit of detection (LOD). These results are “semi-quantitative”, meaningthe respective agent could be detected, but the result can only be accurately quantified asbeing in a range between the LOD and LOQ.
Airborne Sample Data Analysis
The Airborne Sample Data Analysis table is used to present a comparison of theairborne sample results collected at three fixed stations (Make-up Air Area, OperatorArea, and Exhaust Area), and Operator’s Breathing Zone (OBZ), for each uniqueabrasive used in the study. While the data presented is not for an 8 hour (time weightedaverage) period, it provides an indication of the relative concentrations collected duringthe sampling period.
Bulk Elemental Analysis
The Bulk Elemental Analysis table within each tab provides data on theconcentration of the specific analyte (as well as laboratory limits ofdetection/quantification) in the virgin abrasive and in the post-blast abrasive for each ofthe individual abrasive media evaluated. Any data reported in the “Filter Notes” columnsas “<LOQ” means that the associated result reported in column 8 is less than the limit ofquantification (LOQ), but greater than the limit of detection (LOD). These results are

Evaluation of Substitute Materials forSilica Sand in Abrasive Blasting
35
“semi-quantitative”, meaning the respective agent could be detected, but the result canonly be accurately quantified as being in a range between the LOD and LOQ.
Comparison of Airborne Dust Concentrations to Bulk Concentrations
The Comparison of Airborne Dust Concentrations to Bulk Concentrations tablewithin each tab provides a comparison of the airborne concentrations recorded for thespecific analyte at all of the fixed sampling stations (i.e., Make-up Air Area, OperatorArea, and Exhaust Area) and the Operator’s Breathing Zone to the concentration of theanalyte in the virgin abrasive. This table provides an indication of the range ofconcentrations of the analyte in virgin bulk materials that might be associated withairborne exposure levels.
Identical tabular presentations of all of the data for each of the 28metals/elements, as well as respirable quartz and cristobalite, are presented in AppendixB.
Health-Related Agent Summary
The goal of the field study was to collect airborne samples under partiallycontrolled field site conditions. As a result, there was less control over certainenvironmental factors (e.g., wind velocity and direction, relative humidity, airtemperature, temperature of the substrate blasted, etc.) and some blast conditions (e.g.,barge steel substrate blasted on, metering valve setting, etc.) than in the prior Phase 1laboratory study. However, the Study Design/Protocol followed by KTA during the fieldstudy was designed to produce comparable abrasive blast cleaning results, with theabrasive type being the primary variable. Therefore, the different abrasives canconfidently be compared to each other, and specifically with the silica sand abrasive. Forcomparison purposes, NIOSH selected 12 health-related agents for comparative analysis,including: arsenic, beryllium, cadmium, chromium, lead, manganese, nickel, respirablequartz, silver, titanium, vanadium, and radium-226. The results of all backgroundsamples were largely non-detectable or below the limit of quantification. No adjustmentswere made due to any measurable background concentrations.
Figures 1 to 10 on pages 49 to 58 show the range of measured and geometricmean concentrations for the airborne levels of eleven hazardous health-related agents foreach of the 8 generic categories of abrasives tested. The airborne levels, derived from theairborne sample data analysis tables in Appendix B, included results of four samples thatwere collected for each blast run conducted for each abrasive product: make-up areasample, operator area sample, exhaust or dust collector area sample, and the personalsample collected in the operator’s breathing zone, but outside of the blasting helmet. Therange and geometric mean are indicated by a bar chart and a small square, respectively.Radium-226 is reported separately.
Any abrasive product or generic category of abrasive with all airborne sampleshaving results below the limit of detection (LOD) for the given health-related agent arerepresented by only a small square (these abrasives will have no bar since there is no
Evaluation of Substitute Materials forSilica Sand in Abrasive Blasting
36
range to display). For abrasives having any samples below the limit of detection for thegiven health-related agent, the geometric mean was calculated by using LOD÷2, which isthe method used to estimate the average concentration in the presence of nondetectablevalues described by Hornung and Reed19. The limits of detection for abrasive productssometimes varied slightly when analyzing a given health-related agent. Therefore, it ispossible that an airborne concentration for one abrasive detected above the limit ofdetection could be less than the LOD÷2 for another abrasive which had a higher limit ofdetection associated with its analysis. The standard for comparison of all health-relatedagents will use the geometric mean for the silica sand generic abrasive category.
Arsenic
Figure 1 illustrates the range and geometric mean for the airborne levels ofarsenic for each of eight generic categories of abrasive.
All eight of the generic abrasive categories had at least one airborne sample withresults above the limit of detection for arsenic. In order from the highest to the lowestgeometric mean level, the generic abrasive can be ranked as follows: steel grit, copperslag, garnet, coal slag, silica sand with dust suppressant, nickel slag, silica sand, andstaurolite.
The silica sand generic abrasive category had 3 out of 4 airborne samples withresults above the limit of detection for arsenic. The arsenic results for these samples were0.645 to 11.28 µg/m3. The geometric mean concentration of arsenic for the silica sandgeneric abrasive category was 4.225 µg/m3. This will be used as the standard ofcomparison.
The steel grit generic abrasive category had all 4 airborne samples with resultsabove the limit of detection for arsenic. The arsenic levels for these samples ranged from6.834 to 185.8 µg/m3, with a geometric mean level of 22.654 µg/m3. The geometric meanlevel of arsenic for the steel grit generic abrasive category is nearly 5.4 times higher thansilica sand’s geometric mean level of 4.225 µg/m3.
The copper slag generic abrasive category had all 4 airborne samples with resultsabove the limit of detection for arsenic. The arsenic levels for these samples ranged from10.92 to 33.13 µg/m3, with a geometric mean level of 21.82 µg/m3. The geometric meanlevel of arsenic for the copper slag generic abrasive category is over 5 times higher thansilica sand’s geometric mean level of 4.225 µg/m3.
The garnet generic abrasive category had all 4 airborne samples with resultsabove the limit of detection for arsenic. The arsenic levels for these samples ranged from5.605 to 11.89 µg/m3, with a geometric mean level of 9.292 µg/m3. The geometric meanlevel of arsenic for the treated garnet generic abrasive category is nearly 2.2 times higherthan silica sand’s geometric mean level of 4.225 µg/m3.

Evaluation of Substitute Materials forSilica Sand in Abrasive Blasting
37
The coal slag generic abrasive category had all 4 airborne samples with resultsabove the limit of detection for arsenic. The arsenic levels for these samples ranged from7.182 to 10.54 µg/m3, with a geometric mean level of 8.588 µg/m3. The geometric meanlevel of arsenic for the treated coal slag generic abrasive category is about 2 times higherthan silica sand’s geometric mean level of 4.225 µg/m3.
The silica sand with dust suppressant generic abrasive category had all 4 airbornesamples with results above the limit of detection for arsenic. The arsenic levels for thesesamples ranged from 4.196 to 7.937 µg/m3, with a geometric mean level of 6.190 µg/m3.The geometric mean level of arsenic for the treated silica sand with dust suppressantgeneric abrasive category is about 1.5 times higher than silica sand’s geometric meanlevel of 4.225 µg/m3.
The nickel slag generic abrasive category had all 4 airborne samples with resultsabove the limit of detection for arsenic. The arsenic levels for these samples ranged from2.099 to 6.114 µg/m3, with a geometric mean level of 4.306 µg/m3. The geometric meanlevel of arsenic for the nickel slag generic abrasive category is slightly higher than silicasand’s geometric mean level of 4.225 µg/m3.
The staurolite generic abrasive category had 2 out of 4 airborne samples withresults above the limit of detection for arsenic. The arsenic levels for these samplesranged from 0.615 to 1.446 µg/m3. The geometric mean level for this category is 1.229µg/m3. The geometric mean level of arsenic for the staurolite generic abrasive category isless than 30% of silica sand’s geometric mean level of 4.225 µg/m3.
Beryllium
Figure 2 illustrates the range and geometric mean for the airborne levels ofberyllium for each of the eight generic categories of abrasive. The steel grit genericcategory of abrasive had all airborne beryllium results below the limit of detection.
The following generic abrasive categories had at least one airborne sample withresults above the limit of detection for beryllium, and in order from the highest to thelowest geometric mean level include: coal slag, silica sand, copper slag, staurolite, garnet,nickel slag, silica sand with dust suppressant.
The silica sand generic abrasive category had 3 out of 4 airborne samples withresults above the limit of detection for beryllium. The concentration of beryllium levelsfor these samples ranged from 0.108 to 4.83 µg/m3. The geometric mean concentrationof beryllium for the silica sand generic abrasive category was 0.792 µg/m3. This will beused as the standard of comparison.
The coal slag generic abrasive category had all 4 airborne samples with resultsabove the limit of detection for beryllium. The beryllium levels for these samples rangedfrom 0.86 to 5.87 µg/m3, with a geometric mean level of 3.334 µg/m3. The geometric
Evaluation of Substitute Materials forSilica Sand in Abrasive Blasting
38
mean level of beryllium for the coal slag generic abrasive category is about 4.2 timeshigher than silica sand’s geometric mean level of 0.792 µg/m3.
The copper slag generic abrasive category had all 4 airborne samples with resultsabove the limit of detection for beryllium. The beryllium levels for these samples rangedfrom 0.38 to 1.24 µg/m3, with a geometric mean level of 0.766 µg/m3. The geometricmean level of beryllium for the copper slag generic abrasive category is slightly lowerthan silica sand’s geometric mean level of 0.792 µg/m3.
The staurolite generic abrasive category had all 4 airborne samples with resultsabove the limit of detection for beryllium. The beryllium levels for these samples rangedfrom 0.33 to 0.80 µg/m3, with a geometric mean level of 0.577 µg/m3. The geometricmean level of beryllium for the steel grit generic abrasive category is about 72% of silicasand’s geometric mean level of 0.792 µg/m3.
The garnet generic abrasive category had all 4 airborne samples with resultsabove the limit of detection for beryllium. The beryllium levels for these samples rangedfrom 0.39 to 0.64 µg/m3, with a geometric mean level of 0.505 µg/m3. The geometricmean level of beryllium for the garnet generic abrasive category is less than two-thirds ofsilica sand’s geometric mean level of 0.792 µg/m3.
The nickel slag generic abrasive category had all 4 airborne samples with resultsabove the limit of detection for beryllium. The beryllium levels for these samples rangedfrom 0.08 to 0.23 µg/m3, with a geometric mean level of 0.150 µg/m3. The geometricmean level of beryllium for the steel grit generic abrasive category is less than 20% ofsilica sand’s geometric mean level of 0.792 µg/m3.
The silica sand with dust suppressant generic abrasive category had 3 out of 4airborne samples with results above the limit of detection for beryllium. The berylliumlevels for these samples ranged from 0.042 to 0.14 µg/m3, with a geometric mean level of0.094 µg/m3. The geometric mean level of beryllium for the silica sand with dustsuppressant generic abrasive category is about 12% of silica sand’s geometric mean levelof 0.792 µg/m3.
Cadmium
Figure 3 illustrates the range and geometric mean for the airborne levels ofcadmium for each of the eight generic categories of abrasive.
All eight categories had results above the detection. In order from the highest tothe lowest geometric mean level, the generic categories of abrasive can be categorized asfollows: garnet, coal slag, copper slag, steel grit, nickel slag, staurolite, silica sand withdust suppressant, and silica sand.
The silica sand generic abrasive category had all 4 airborne samples with resultsabove the limit of detection for cadmium. The concentration of cadmium levels for these

Evaluation of Substitute Materials forSilica Sand in Abrasive Blasting
39
samples ranged from 0.065 to 0.316 µg/m3. The geometric mean concentration ofcadmium for the silica sand generic abrasive category was 0.185 µg/m3. This will beused as the standard of comparison.
The garnet generic abrasive category had all 4 airborne samples with resultsabove the limit of detection for cadmium. The cadmium levels for these samples rangedfrom 0.685 to 1.507 µg/m3, with a geometric mean level of 1.105 µg/m3. The geometricmean level of cadmium for the garnet generic abrasive category is nearly 6 times higherthan silica sand’s geometric mean level of 0.185 µg/m3.
The coal slag generic abrasive category had all 4 airborne samples with resultsabove the limit of detection for cadmium. The cadmium levels for these samples rangedfrom 0.275 to 1.032 µg/m3, with a geometric mean level of 0.496 µg/m3. The geometricmean level of cadmium for the coal slag generic abrasive category is about 2.7 timeshigher than silica sand’s geometric mean level of 0.185 µg/m3.
The copper slag abrasive category had all 4 airborne samples with results abovethe limit of detection for cadmium. The cadmium levels for these samples ranged from0.119 to 3.73 µg/m3, with a geometric mean level of 0.448 µg/m3. The geometric meanlevel of cadmium for the copper slag generic abrasive category is about 2.4 times higherthan silica sand’s geometric mean level of 0.185 µg/m3.
The steel grit generic abrasive category had all 4 airborne samples with resultsabove the limit of detection for cadmium. The cadmium levels for these samples rangedfrom 0.084 to 12.25 µg/m3, with a geometric mean level of 0.426 µg/m3. The geometricmean level of cadmium for the steel grit generic abrasive category is 2.3 times higherthan silica sand’s geometric mean level of 0.185 µg/m3.
The nickel slag generic abrasive category had all 4 airborne samples with resultsabove the limit of detection for cadmium. The cadmium levels for these samples rangedfrom 0.231 to 0.569 µg/m3, with a geometric mean level of 0.344 µg/m3. The geometricmean level of cadmium for the steel grit generic abrasive category is nearly 2 timeshigher than silica sand’s geometric mean level of 0.185 µg/m3.
The staurolite generic abrasive category had all 4 airborne samples with resultsabove the limit of detection for cadmium. The cadmium levels for these samples rangedfrom 0.205 to 0.307 µg/m3, with a geometric mean level of 0.248 µg/m3. The geometricmean level of cadmium for the staurolite generic abrasive category is slightly higher(approximately 1.34 times) than silica sand’s geometric mean level of 0.185 µg/m3.
The silica sand with dust suppressant category had all 4 airborne samples withresults above the limit of detection for cadmium. The cadmium levels for these samplesranged from 0.105 to 0.511 µg/m3, with a geometric mean level of 0.216 µg/m3. Thegeometric mean level of cadmium for the silica with dust suppressant generic abrasivecategory is slightly higher than silica sand’s geometric mean level of 0.185 µg/m3.

Evaluation of Substitute Materials forSilica Sand in Abrasive Blasting
40
Chromium
Figure 4 illustrates the range and geometric mean for the airborne levels ofchromium for each of the eight generic categories of abrasives.
All eight generic abrasive categories had at least one airborne sample with resultsabove the limit of detection for chromium, and in order from the highest to the lowestgeometric mean level include: nickel slag, steel grit, coal slag, garnet, staurolite, copperslag, silica sand, and silica sand with dust suppressant.
The silica sand generic abrasive category had 3 out of 4 airborne samples withresults above the limit of detection for chromium. The chromium concentrations forthese samples ranged from 5.375 to 94.53 µg/m3. The geometric mean concentration ofchromium for the silica sand generic abrasive category was 36.08 µg/m3. This will beused as the standard of comparison.
The nickel slag category had all 4 airborne samples with results above the limit ofdetection for chromium. The chromium levels for these samples ranged from 1931 to5435 µg/m3, with a geometric mean level of 3513.1 µg/m3. The geometric mean level ofchromium for the nickel slag generic abrasive category is over 97 times higher than silicasand’s geometric mean level of 36.08 µg/m3.
The steel grit category had all 4 airborne samples with results above the limit ofdetection for chromium. The chromium levels for these samples ranged from 310.6 to8756 µg/m3, with a geometric mean level of 1025 µg/m3. The geometric mean level ofchromium for the steel grit generic abrasive category is about 28 times higher than silicasand’s geometric mean level of 36.08 µg/m3.
The coal slag category had all 4 airborne samples with results above the limit ofdetection for chromium. The chromium levels for these samples ranged from 62.37 to162.4 µg/m3, with a geometric mean level of 111.4 µg/m3. The geometric mean level ofchromium for the coal slag generic abrasive category is about 3 times higher than silicasand’s geometric mean level of 36.08 µg/m3.
The garnet category had all 4 airborne samples with results above the limit ofdetection for chromium. The chromium levels for these samples ranged from 56.05 to131.6 µg/m3, with a geometric mean level of 94.37 µg/m3. The geometric mean level ofchromium for the garnet generic abrasive category is about 2.6 times higher than silicasand’s geometric mean level of 36.08 µg/m3.
The staurolite category had all 4 airborne samples with results above the limit ofdetection for chromium. The chromium levels for these samples ranged from 54.26 to98.18 µg/m3, with a geometric mean level of 74.08 µg/m3. The geometric mean level ofchromium for the staurolite generic abrasive category is about 2 times higher than silicasand’s geometric mean level of 36.08 µg/m3.

Evaluation of Substitute Materials forSilica Sand in Abrasive Blasting
41
The copper slag category had all 4 airborne samples with results above the limitof detection for chromium. The chromium levels for these samples ranged from 39.7 to101.5 µg/m3, with a geometric mean level of 73.7 µg/m3. The geometric mean level ofchromium for the copper slag generic abrasive category is just over 2 times higher thansilica sand’s geometric mean level of 36.08 µg/m3.
The silica sand with dust suppressant category had all 4 airborne samples withresults above the limit of detection for chromium. The chromium levels for these samplesranged from 14.69 to 46.81 µg/m3, with a geometric mean level of 33.52 µg/m3. Thegeometric mean level of chromium for the silica sand with dust suppressant genericabrasive category is slightly lower than silica sand’s geometric mean level of 36.08µg/m3.
Lead
Figure 5 illustrates the range and geometric mean for the airborne levels of leadfor each of the eight generic categories of abrasives.
All of the generic abrasive categories had at least one airborne sample with resultsabove the limit of detection for lead, and in order of the highest to the lowest geometricmean level include: staurolite, coal slag, silica sand with dust suppressant, garnet, steelgrit, nickel slag, copper slag, and silica sand.
The silica sand generic abrasive category had three out of four airborne sampleswith results above the limit of detection. The lead levels for these samples ranged from1.075 to 14.21 µg/m3. The geometric mean concentration of lead for the silica sandgeneric abrasive category was 6.052 µg/m3. This will be used as a standard of allcomparisons.
The staurolite category had all 4 airborne samples with results above the limit ofdetection for lead. The lead levels for these samples ranged from 31.3 to 57.86 µg/m3,with a geometric mean level of 42.82 µg/m3. The geometric mean level of lead for thestaurolite generic abrasive category is 7 times higher than silica sand’s geometric meanlevel of 6.052 µg/m3.
The coal slag category had all 4 airborne samples with results above the limit ofdetection for lead. The lead levels for these samples ranged from 9.93 to 12.04 µg/m3,with a geometric mean level of 11.33 µg/m3. The geometric mean level of lead for thecoal slag generic abrasive category is nearly 1.9 times higher than silica sand’s geometricmean level of 6.052 µg/m3.
The silica sand with dust suppressant category had all 4 airborne samples withresults above the limit of detection for lead. The lead levels for these samples rangedfrom 4.62 to 11.24 µg/m3, with a geometric mean level of 8.563 µg/m3. The geometricmean level of lead for the silica sand with dust suppressant generic abrasive category isabout 1.4 times higher than silica sand’s geometric mean level of 6.052 µg/m3.
Evaluation of Substitute Materials forSilica Sand in Abrasive Blasting
42
The garnet category had all 4 airborne samples with results above the limit ofdetection for lead. The lead levels for these samples ranged from 5.19 to 11.67 µg/m3,with a geometric mean level of 8.558 µg/m3. The geometric mean level of lead for thegarnet generic abrasive category is about 1.4 times higher than silica sand’s geometricmean level of 6.052 µg/m3.
The steel grit category had all 4 airborne samples with results above the limit ofdetection for lead. The lead levels for these samples ranged from 1.92 to 24.5 µg/m3, witha geometric mean level of 7.137 µg/m3. The geometric mean level of lead for the steelgrit generic abrasive category is slightly higher than silica sand’s geometric mean level of6.052 µg/m3.
The nickel slag category had all 4 airborne samples with results above the limit ofdetection for lead. The lead levels for these samples ranged from 5.04 to 8.38 µg/m3, witha geometric mean level of 6.880 µg/m3. The geometric mean level of lead for the nickelslag generic abrasive category is slightly higher than silica sand’s geometric mean levelof 6.052 µg/m3.
The copper slag category had all 4 airborne samples with results above the limitof detection for lead. The lead levels for these samples ranged from 3.18 to 10.14 µg/m3,with a geometric mean level of 6.785 µg/m3. The geometric mean level of lead for thecopper slag generic abrasive category is slightly higher than silica sand’s geometric meanlevel of 6.052 µg/m3.
Manganese
Figure 6 illustrates the range and geometric mean for the airborne levels ofmanganese for each of the eight generic categories of abrasive.
All of the generic categories of abrasives had at least 1 airborne sample resultabove the limit of detection for manganese, and in order of the highest to lowestgeometric mean level include: garnet, steel grit, copper slag, nickel slag, coal slag,staurolite, silica sand, and silica sand with dust suppressant.
The silica sand generic category had all four airborne samples with results abovethe limit of detection. The results ranged from 64.52 to 947.5 µg/m3. The geometricmean level of manganese for the silica sand generic abrasive category is 383.6 µg/m3.This will be used as the standard of comparison.
The garnet category had all 4 airborne samples with results above the limit ofdetection for manganese. The manganese levels for these samples ranged from 5,813 to13,585 µg/m3, with a geometric mean level of 9,489 µg/m3. The geometric mean level ofmanganese for the garnet generic abrasive category is nearly 25 times higher than silicasand’s geometric mean level of 383.6 µg/m3.
Evaluation of Substitute Materials forSilica Sand in Abrasive Blasting
43
The steel grit category had all 4 airborne samples with results above the limit ofdetection for manganese. The manganese levels for these samples ranged from 1,595 to38,798 µg/m3, with a geometric mean level of 4,943 µg/m3. The geometric mean level ofmanganese for the steel grit generic abrasive category is nearly 13 times higher than silicasand’s geometric mean level of 383.6 µg/m3.
The copper slag category had all 4 airborne samples with results above the limitof detection for manganese. The manganese levels for these samples ranged from 1,092to 3,313 µg/m3, with a geometric mean level of 2,182 µg/m3. The geometric mean levelof manganese for the copper slag generic abrasive category is about 5.7 times higher thansilica sand’s geometric mean level of 383.6 µg/m3.
The nickel slag category had all 4 airborne samples with results above the limit ofdetection for manganese. The manganese levels for these samples ranged from 881.6 to2,264 µg/m3, with a geometric mean level of 1,576 µg/m3. The geometric mean level ofmanganese for the nickel slag generic abrasive category is about 4 times higher thansilica sand’s geometric mean level of 383.6 µg/m3.
The coal slag category had all 4 airborne samples with results above the limit ofdetection for manganese. The manganese levels for these samples ranged from 633.7 to903.2 µg/m3, with a geometric mean level of 746.8 µg/m3. The geometric mean level ofmanganese for the coal slag generic abrasive category is nearly 2 times higher than silicasand’s geometric mean level of 383.6 µg/m3.
The staurolite category had all 4 airborne samples with results above the limit ofdetection for manganese. The manganese levels for these samples ranged from 480 to818.2 µg/m3, with a geometric mean level of 638.7 µg/m3. The geometric mean level ofmanganese for the staurolite generic abrasive category is about 1.7 times higher thansilica sand’s geometric mean level of 383.6 µg/m3.
The silica sand with dust suppressant category had all 4 airborne samples withresults above the limit of detection for manganese. The manganese levels for thesesamples ranged from 102.8 to 325.6 µg/m3, with a geometric mean level of 226.6 µg/m3.The geometric mean level of manganese for the silica sand with dust suppressant genericabrasive category is about 60% of silica sand’s geometric mean level of 383.6 µg/m3.
Nickel
Figure 7 illustrates the range and geometric mean for the airborne levels of nickelfor each of the eight generic categories of abrasive.
All of the generic abrasive categories had at least one airborne sample with resultsabove the limit of detection for nickel, and in order from the highest to the lowestgeometric mean level include: nickel slag, steel grit, coal slag, copper slag, silica sand,staurolite, garnet, and silica sand with dust suppressant.

Evaluation of Substitute Materials forSilica Sand in Abrasive Blasting
44
The silica sand generic abrasive category had all 4 airborne samples with resultsabove the limit of detection. The nickel level in these samples ranged from 10.8 to 46.21µg/m3. The geometric mean level of nickel for the silica sand generic abrasive categorywas 28.33 µg/m3. This will be used as the standard for comparison.
The nickel slag category had all 4 airborne samples with results above the limit ofdetection for nickel. The nickel levels for these samples ranged from 483 to 1,540 µg/m3,with a geometric mean level of 948.4 µg/m3. The geometric mean level of nickel for thenickel slag generic abrasive category is nearly 34 times higher than silica sand’sgeometric mean level of 28.33 µg/m3.
The steel grit category had all 4 airborne samples with results above the limit ofdetection for nickel. The nickel levels for these samples ranged from 130 to 4,697 µg/m3,with a geometric mean level of 523.6 µg/m3. The geometric mean level of nickel for thenickel generic abrasive category is nearly 19 times higher than silica sand’s geometricmean level of 28.33 µg/m3.
The coal slag category had all 4 airborne samples with results above the limit ofdetection for nickel. The nickel levels for these samples ranged from 33.6 to 101.5 µg/m3,with a geometric mean level of 70.6 µg/m3. The geometric mean level of nickel for thecoal slag generic abrasive category is about 2.5 times higher than silica sand’s geometricmean level of 28.33 µg/m3.
The copper slag category had all 4 airborne samples with results above the limitof detection for nickel. The nickel levels for these samples ranged from 15.9 to 47.62µg/m3, with a geometric mean level of 33.39 µg/m3. The geometric mean level of nickelfor the copper slag generic abrasive category is slightly higher (about 1.2 times) thansilica sand’s geometric mean level of 28.33 µg/m3.
The staurolite category had all 4 airborne samples with results above the limit ofdetection for nickel. The nickel levels for these samples ranged from 12.3 to 42.96 µg/m3,with a geometric mean level of 23.94 µg/m3. The geometric mean level of nickel for thestaurolite generic abrasive category is about 85% of silica sand’s geometric mean level of28.33 µg/m3.
The garnet category had three out of four airborne samples with results above thelimit of detection for nickel. The nickel levels for these samples ranged from 5.19 to29.72 µg/m3, with a geometric mean level of 16.38 µg/m3. The geometric mean level ofnickel for the garnet generic abrasive category is about 60% of silica sand’s geometricmean level of 28.33 µg/m3.
The silica sand with dust suppressant category had 3 out of 4 airborne sampleswith results above the limit of detection for nickel. The nickel levels for these samplesranged from 5.25 to 23.55 µg/m3, with a geometric mean level of 14.58 µg/m3. Thegeometric mean level of nickel for the silica sand with dust suppressant generic abrasivecategory is about 50% of silica sand’s geometric mean level of 28.33 µg/m3.
Evaluation of Substitute Materials forSilica Sand in Abrasive Blasting
45
Respirable Quartz
Figure 8 illustrates the range and geometric mean for the airborne levels ofrespirable quartz for each of the eight generic categories of abrasives. The followinggeneric categories of abrasives had all airborne results below the limit of detection forrespirable quartz: copper slag, nickel slag, and steel grit. NIOSH did not detectcristobalite in any of the airborne or bulk samples.
The following generic abrasive categories had at least 1 airborne sample withresults above the limit of detection for respirable quartz, and in order of the highest tolowest geometric mean level, include: silica sand, silica sand with dust suppressant,garnet, staurolite, and coal slag.
The silica sand generic abrasive category had all four airborne samples withresults above the limit of detection for respirable quartz. The respirable quartz levels forthese samples ranged from 9.91 to 50.52 mg/m3 The geometric mean level of respirablequartz for the silica sand generic abrasive category was 27.6 mg/m3. This will be used asthe standard for comparison.
The silica sand with dust suppressant category had all 4 airborne samples withresults above the limit of detection for respirable quartz. The respirable quartz levels forthese samples ranged from 9.18 to 28.2 mg/m3, with a geometric mean level of 19.04mg/m3. The geometric mean level of respirable quartz for the silica sand with dustsuppressant generic abrasive category is about 68% of silica sand’s geometric mean levelof 27.6 mg/m3.
The garnet category had all 4 airborne samples with results above the limit ofdetection for respirable quartz. The respirable quartz levels for these samples ranged from0.87 to 7.28 mg/m3, with a geometric mean level of 2.6 mg/m3. The geometric mean levelof respirable quartz for the garnet generic abrasive category is less than 10% of silicasand’s geometric mean level of 27.6 mg/m3.
The staurolite category all 4 airborne samples with results above the limit ofdetection for respirable quartz. The respirable quartz levels for these samples ranged from1.01 to 5.03 mg/m3, with a geometric mean level of 2.306 mg/m3. The geometric meanlevel of respirable quartz for the staurolite generic abrasive category is about 8% of silicasand’s geometric mean level of 27.6 mg/m3.
The coal slag category had one airborne sample with results above the limit ofdetection for respirable quartz. The respirable quartz level for this sample was 0.25mg/m3. The geometric mean for this category was 0.148 mg/m3. The geometric meanlevel of respirable quartz for the coal slag generic abrasive category is less than 1% ofsilica sand’s geometric mean level of 27.6 m g/m3.
Evaluation of Substitute Materials forSilica Sand in Abrasive Blasting
46
Silver
The silica sand generic abrasive category had no measured results above the limitof detection. The geometric mean for the silica sand generic abrasive category equals thelimit of detection for each abrasive divided by two, which is 0.861 µg/m3. This will beused as the standard for comparison.
The only generic abrasive category with at least one airborne sample with resultsabove the limit of detection for silver was silica sand with dust suppressant. There wasone result above the detection limit, with a concentration of 2.04 µg/m3. The geometricmean for this category was 1.045 µg/m3, which is slightly higher than silica sand’sgeometric mean of 0.861 µg/m3.
Titanium
Figure 9 illustrates the range and geometric mean for the airborne levels oftitanium for each of eight generic categories of abrasives.
All of the generic abrasive categories had airborne samples with results above thelimit of detection for titanium, and in order of the highest to the lowest geometric meanlevel include: staurolite, coal slag, copper slag, silica sand, garnet, nickel slag, silica sandwith dust suppressant, and steel grit.
The silica sand generic category of abrasive had all 4 samples with results abovethe limit of detection for titanium. The results ranged from 103.2 to 2,731 µg/m3. Thegeometric mean level of titanium for the silica sand generic abrasive category was 749.6µg/m3. This will be used as the standard for comparison.
The staurolite category had all 4 airborne samples with results above the limit ofdetection for titanium. The titanium levels for these samples ranged from 4,591 to 5,166µg/m3, with a geometric mean level of 4,892 µg/m3. The geometric mean level oftitanium for the staurolite generic abrasive category is about 6.5 times higher than silicasand’s geometric mean level of 749.6 µg/m3.
The coal slag category had all 4 airborne samples with results above the limit ofdetection for titanium. The titanium levels for these samples ranged from 1,011 to 2,933µg/m3, with a geometric mean level of 1,786 µg/m3. The geometric mean level oftitanium for the coal slag generic abrasive category is about 2.4 times higher than silicasand’s geometric mean level of 749.579 µg/m3.
The copper slag category had all 4 airborne samples with results above the limitof detection for titanium. The titanium levels for these samples ranged from 635.2 to2,070 µg/m3, with a geometric mean level of 1,289 µg/m3. The geometric mean level oftitanium for the copper slag generic abrasive category is about 1.7 times higher than silicasand’s geometric mean level of 749.6 µg/m3.
Evaluation of Substitute Materials forSilica Sand in Abrasive Blasting
47
The garnet category had all 4 airborne samples with results above the limit ofdetection for titanium. The titanium levels for these samples ranged from 228.4 to 339.6µg/m3, with a geometric mean level of 284.3 µg/m3. The geometric mean level oftitanium for the garnet generic abrasive category is about 40% of silica sand’s geometricmean level of 749.6 µg/m3.
The nickel slag category had all 4 airborne samples with results above the limit ofdetection for titanium. The titanium levels for these samples ranged from 90.26 to 217.4µg/m3, with a geometric mean level of 150.8 µg/m3. The geometric mean level oftitanium for the nickel slag generic abrasive category is about 20% of silica sand’sgeometric mean level of 749.6 µg/m3.
The silica sand with dust suppressant category had all 4 airborne samples withresults above the limit of detection for titanium. The titanium levels for these samplesranged from 15.74 to 38.82 µg/m3, with a geometric mean level of 27.79 µg/m3. Thegeometric mean level of titanium for the silica sand with dust suppressant genericabrasive category is less than 4% of silica sand’s geometric mean level of 749.6 µg/m3.
The steel grit category had all 4 airborne samples with results above the limit ofdetection for titanium. The titanium levels for these samples ranged from 6.26 to 81.68µg/m3, with a geometric mean level of 21.7 µg/m3. The geometric mean level of titaniumfor the steel grit generic abrasive category is less than 3% of silica sand’s geometric meanlevel of 749.6 µg/m3.
Vanadium
Figure 10 illustrates the range and geometric mean for the airborne levels ofvanadium for each of the eight generic categories of abrasives.
All of the generic abrasive categories had at least one airborne sample with resultsabove the limit of detection for vanadium, and in order from the highest to the lowestgeometric mean level include: coal slag, copper slag, steel grit, nickel slag, silica sand,staurolite, garnet, and silica sand with dust suppressant.
The silica sand generic abrasive category had all four airborne samples withresults above the limit of detection for vanadium. The results ranged from 4.3 µg/m3 to109.2 µg/m3. The geometric mean for the silica sand generic abrasive category was32.62 µg/m3. This will be used as the standard for comparison.
The coal slag category had all 4 airborne samples with results above the limit ofdetection for vanadium. The vanadium levels for these samples ranged from 45.16 to171.5 µg/m3, with a geometric mean level of 106.3 µg/m3. The geometric mean level ofvanadium for the coal slag generic abrasive category is nearly 3.3 times higher than silicasand’s geometric mean level of 32.62 µg/m3.

Evaluation of Substitute Materials forSilica Sand in Abrasive Blasting
48
The copper slag category had all 4 airborne samples with results above the limitof detection for vanadium. The vanadium levels for these samples ranged from 39.7 to122.2 µg/m3, with a geometric mean level of 77.16 µg/m3. The geometric mean level ofvanadium for the copper slag generic abrasive category is approximately 2 times higherthan silica sand’s geometric mean level of 32.62 µg/m3.
The steel grit category had all 4 airborne samples with results above the limit ofdetection for vanadium. The vanadium levels for these samples ranged from 19.05 to490.1 µg/m3, with a geometric mean level of 59.16 µg/m3. The geometric mean level ofvanadium for the steel grit generic abrasive category is about 1.8 times higher than silicasand’s geometric mean level of 32.62 µg/m3.
The nickel slag category had all 4 airborne samples with results above the limit ofdetection for vanadium. The vanadium levels for these samples ranged from 23.09 to58.88 µg/m3, with a geometric mean level of 39.56 µg/m3. The geometric mean level ofvanadium for the nickel slag generic abrasive category is slightly higher than silica sand’sgeometric mean level of 32.62 µg/m3.
The staurolite category had all 4 airborne samples with results above the limit ofdetection for vanadium. The vanadium levels for these samples ranged from 18.78 to28.93 µg/m3, with a geometric mean level of 24.88 µg/m3. The geometric mean level ofvanadium for the staurolite generic abrasive category is approximately 76% of silicasand’s geometric mean level of 32.62 µg/m3.
The garnet category had all 4 airborne samples with results above the limit ofdetection for vanadium. The vanadium levels for these samples ranged from 14.53 to25.47 µg/m3, with a geometric mean level of 20.37 µg/m3. The geometric mean level ofvanadium for the garnet generic abrasive category is about 60% of silica sand’sgeometric mean level of 32.62 µg/m3.
The silica with dust suppressant category had all 4 airborne samples with resultsabove the limit of detection for vanadium. The vanadium levels for these samples rangedfrom 2.04 to 4.71 µg/m3, with a geometric mean level of 3.01 µg/m3. The geometricmean level of vanadium for the silica sand with dust suppressant generic abrasivecategory is less than 10% of silica sand’s geometric mean level of 32.62 µg/m3.

Evaluation of Substitute Materials forSilica Sand in Abrasive Blasting
49
FIGURE 1 – ARSENIC AIR SAMPLE RESULTS

Evaluation of Substitute Materials forSilica Sand in Abrasive Blasting
50
FIGURE 2 – BERYLLIUM AIR SAMPLE RESULTS

Evaluation of Substitute Materials forSilica Sand in Abrasive Blasting
51
FIGURE 3 – CADMIUM AIR SAMPLE RESULTS

Evaluation of Substitute Materials forSilica Sand in Abrasive Blasting
52
FIGURE 4 – CHROMIUM AIR SAMPLE RESULTS

Evaluation of Substitute Materials forSilica Sand in Abrasive Blasting
53
FIGURE 5 – LEAD AIR SAMPLE RESULTS

Evaluation of Substitute Materials forSilica Sand in Abrasive Blasting
54
FIGURE 6 – MANGANESE AIR SAMPLE RESULTS

Evaluation of Substitute Materials forSilica Sand in Abrasive Blasting
55
FIGURE 7 – NICKEL AIR SAMPLE RESULTS

Evaluation of Substitute Materials forSilica Sand in Abrasive Blasting
56
FIGURE 8 – QUARTZ AIR SAMPLE RESULTS

Evaluation of Substitute Materials forSilica Sand in Abrasive Blasting
57
FIGURE 9 – TITANIUM AIR SAMPLE RESULTS

Evaluation of Substitute Materials forSilica Sand in Abrasive Blasting
58
FIGURE 10 – VANADIUM AIR SAMPLE RESULTS
Evaluation of Substitute Materials forSilica Sand in Abrasive Blasting
59
Industrial Hygiene Discussion
Eight generic types of abrasives were evaluated for 28 metals/elements, andrespirable quartz and cristobalite, through the analysis of airborne dust and bulkmaterials. For comparison purposes, NIOSH selected twelve health-related agents forcomparative analysis, including: arsenic, beryllium, cadmium, chromium, lead,manganese, nickel, respirable quartz, silver, titanium, vanadium, and radium-226. Table(-), found at the end of this discussion on page (-), summarizes the airborne monitoringresults for each of these health-related agents by generic category of abrasive, exceptradium-226, which is discussed elsewhere. The following is a discussion of keyobservations concerning this data. It is summarized by generic type of abrasive.
Coal Slag
All four of the airborne samples of coal slag had a measured concentration abovethe LOD for arsenic. The geometric mean concentration of 8.558 µg/m3 for the coal slaggeneric abrasive category was about 2 times higher than that of silica sand at 4.225µg/m3. Coal slag has the fourth highest geometric mean concentration of arsenic; steelgrit, copper slag, and garnet were higher.
All four airborne samples of coal slag had a measured concentration above theLOD for beryllium. The geometric mean concentration of 3.334 µg/m3 for the coal slaggeneric abrasive category was about 4 times higher than that of silica sand at 0.792µg/m3. Coal slag had the highest geometric mean concentration of beryllium
All four of the airborne samples of coal slag had a measured concentration abovethe LOD for cadmium. The geometric mean concentration of 0.496 µg/m3 for the coalslag generic abrasive category was 2.7 times greater than that of silica sand at 0.185µg/m3. Coal slag had the second highest geometric mean concentration of cadmiumbehind garnet.
All four of the airborne samples of coal slag had a measured concentration abovethe LOD for chromium. The geometric mean concentration of 111.4 µg/m3 for the coalslag generic abrasive category was over 3 times higher than that of silica sand at 36.08µg/m3. Coal slag had the third highest geometric mean concentration of chromiumbehind nickel slag and steel grit.
All four of airborne samples of coal slag had a measured concentration above theLOD for lead. The geometric mean concentration of 11.33 µg/m3 for the coal slaggeneric abrasive category is 1.9 times higher than that of silica sand at 6.05 µg/m3. Coalslag had the second highest geometric mean concentration of lead behind staurolite.
All four airborne samples of coal slag had a measured concentration above theLOD for manganese. The geometric mean concentration of 746.8 µg/m3 for the coal slaggeneric abrasive category was nearly 2 times higher than that of silica sand at 383.6µg/m3. Garnet, steel grit, copper slag, and nickel slag had higher geometric mean
Evaluation of Substitute Materials forSilica Sand in Abrasive Blasting
60
concentrations while staurolite, silica sand, and silica sand with dust suppressant werelower.
All four of the airborne samples of coal slag had a measured concentration abovethe LOD for nickel. The geometric mean concentration of 70.6 µg/m3 for the coal slaggeneric abrasive category was nearly 2.5 times higher than that of silica sand at 28.3µg/m3. Coal slag had the third highest geometric mean concentration of nickel; steel gritand nickel slag were higher.
One out of four coal slag airborne samples was above the LOD for respirablequartz. Coal slag’s geometric mean concentration 0.148 mg/m3 was less than 1% ofsilica sand at 27.96 mg/m3. Coal slag had the lowest geometric mean concentration ofrespirable quartz for the generic abrasives with results above the LOD.
All four airborne samples of coal slag had a measured concentration above theLOD for titanium. Coal slag’s geometric mean concentration of 1,786 µg/m3 was about2.4 times higher than that of silica sand at 749.6 µg/m3. Coal slag had the second highestgeometric mean concentration of titanium behind staurolite.
All four airborne samples of coal slag had a measured concentration above theLOD for vanadium. Coal slag’s geometric mean concentration of 106.3 µg/m3 was about3 times higher than that of silica sand at 32.62 µg/m3. Coal slag had the highestgeometric mean concentration of vanadium.
Silver was not detected above the LOD for the coal slag generic abrasive categoryBased on the industrial hygiene results in the field study, substituting coal slag for silicasand in abrasive blasting should reduce airborne respirable quartz concentrations.However, the coal slag generic abrasive category is not without potential hazardoushealth-related agent concerns.
Coal slag, as a generic category of abrasives, has the highest geometric meanconcentration of beryllium and vanadium, and the second highest geometric mean forcadmium, lead, and titanium. All of the airborne data from the field study must beviewed as indicative only of relative potential for the presence of health-related agents,since the field conditions were not necessarily representative of actual work siteconditions. In addition, variability between individual abrasives within a generic categorymust also be considered prior to drawing any broad health-based conclusions.
Nickel Slag
All four of the airborne samples of nickel slag had a measured concentrationabove the LOD for arsenic. The geometric mean concentration of 4.306 µg/m3 wasslightly higher than that of silica sand at 4.225 µg/m3. The geometric mean concentrationof nickel slag was the third lowest; silica sand and staurolite were lower.
All four airborne samples of nickel slag had measured concentrations of berylliumabove the LOD. The geometric mean concentration of 0.150 µg/m3 was less than 20% of
Evaluation of Substitute Materials forSilica Sand in Abrasive Blasting
61
silica sand at 0.792 µg/m3. Nickel slag had the third lowest geometric meanconcentration of beryllium; silica sand with dust suppressant and steel grit were lower.
All four airborne samples of nickel slag had measured concentrations above theLOD for cadmium. The geometric mean concentration of 0.344 µg/m3 is about 1.8 timeshigher than silica sand at 0.185 µg/m3. Garnet, coal slag, copper slag, and steel grit hadhigher geometric mean concentrations of cadmium while staurolite, silica sand with dustsuppressant, and silica sand were lower.
All four airborne samples of nickel slag had measured concentrations above theLOD for chromium. The geometric mean concentration of 3,513 is about 97 times higherthan that of silica sand at 36.08 µg/m3. Nickel slag had the highest geometric meanconcentration of chromium.
All four airborne samples of nickel slag had measured concentrations of leadabove the LOD for lead. The geometric mean concentration of 6.880 µg/m3 was slightlyhigher than silica sand at 6.052 µg/m3. Nickel slag had the third lowest geometric meanconcentration of lead; copper slag and silica sand was lower.
All four airborne samples of nickel slag had measured concentrations above theLOD for manganese. The geometric mean concentration of 1,575 µg/m3 was about 4times higher than silica sand at 383.6 µg/m3. Nickel slag had the fourth highestgeometric mean concentration for manganese; garnet, steel grit, and copper slag werehigher.
All four of the airborne samples of nickel slag had measured concentrations abovethe LOD for nickel. The geometric mean concentration of 948.4 µg/m3 was nearly 34times higher than silica sand at 28.33 µg/m3. Nickel slag had the highest geometric meanconcentration of nickel.
All four airborne samples of nickel slag had a measured concentration above theLOD for titanium. The geometric mean concentration of 150.8 µg/m3 was about 20% ofsilica sand at 749.6 µg/m3. Nickel slag had the third lowest geometric meanconcentration of titanium; silica sand with dust suppressant and steel grit were lower.
All four airborne samples of nickel slag had measured concentrations above theLOD for vanadium. The geometric mean concentration of 39.56 µg/m3 was slightlyhigher (1.2 times) than silica sand at 32.62 µg/m3. Nickel slag had the fourth highestgeometric mean concentration of vanadium; coal slag, steel grit, and copper slag werehigher.
Respirable quartz and silver were not detected above the LOD in any of the nickelslag airborne samples. Based on the industrial hygiene results in the field study,substituting nickel slag for silica sand in abrasive blasting should reduce airbornerespirable quartz concentrations. However, the nickel slag generic abrasive category isnot without potential hazardous health-related agent concerns.

Evaluation of Substitute Materials forSilica Sand in Abrasive Blasting
62
Nickel slag as a generic category of abrasives had the highest geometric meanconcentration of chromium and nickel. All of the airborne data from the field must beviewed as indicative only of relative potential for the presence of health-related agents,since the field conditions were not necessarily representative of actual work siteconditions. In addition, variability between individual abrasives within a generic categorymust also be considered prior to drawing any broad health-based conclusions.
Staurolite
Two out of four of the airborne samples of staurolite had a measuredconcentration above the LOD for arsenic. The geometric mean concentration of 1.229µg/m3 was approximately 30% that of silica sand at 4.225 µg/m3. Staurolite had thelowest geometric mean concentration of arsenic.
All four of the airborne samples of staurolite had a measured concentration abovethe LOD for beryllium. The geometric mean concentration of 0.577 µg/m3 wasapproximately 73% that of silica sand at 0.792 µg/m3. Staurolite had the fourth highestgeometric mean concentration of beryllium; coal slag, silica sand, and copper slag werehigher.
All four airborne samples of staurolite had a measured concentration above theLOD for cadmium. The geometric mean concentration of 0.248 µg/m3 was slightlyhigher (approximately 1.3 times) than silica sand at 0.185 µg/m3. Staurolite had the thirdlowest geometric mean concentration of cadmium; silica sand and silica sand with dustsuppressant were lower.
All four airborne samples of staurolite had a measured concentration above theLOD for chromium. The geometric mean concentration of 74.08 µg/m3 was about 2times higher than of silica sand at 36.08 µg/m3. Staurolite was the fifth highest geometricmean for chromium; nickel slag, steel grit, coal slag, and garnet were higher.
All four of the airborne results of staurolite had measured concentrations abovethe LOD for lead. The geometric mean concentration of 42.82 µg/m3 was 7 times higherthan silica sand at 6.05 µg/m3. Staurolite had the highest geometric mean concentrationof lead.
All four of the airborne sample results for staurolite had measured concentrationsabove the LOD for manganese. The geometric mean concentration of 638.7 µg/m3 wasabout 1.7 times higher than silica sand at 383.6 µg/m3. Staurolite had the third lowestgeometric mean concentration for manganese; silica sand and silica sand with dustsuppressant were lower.
All four of the airborne sample results for staurolite had measured concentrationsabove the LOD for nickel. The geometric mean concentration of 23.94 µg/m3 wasapproximately 85% that of silica sand at 28.33 µg/m3. Staurolite had the third lowest
Evaluation of Substitute Materials forSilica Sand in Abrasive Blasting
63
geometric mean concentration for nickel; garnet and silica sand with dust suppressantwere lower.
All four of the airborne samples of staurolite had a measured concentration abovethe LOD for respirable quartz. The geometric mean concentration of 2.306 mg/m3 was8% of that of silica sand at 27.96 mg/m3. Of the five generic categories of abrasives withdetectable concentrations of respirable quartz (silica sand, silica sand with dustsuppressant, garnet, staurolite, and coal slag), staurolite had the second lowest geometricmean concentration; coal slag was lower.
All four of the airborne sample results of staurolite had a measured concentrationabove the LOD for titanium. The geometric mean concentration of 4,892 µg/m3 wasabout 6.5 times higher than that of silica sand at 749.6 µg/m3. Staurolite had the highestgeometric mean concentration of titanium.
All four airborne samples of staurolite had measured concentrations above theLOD for vanadium. The geometric mean concentration of 24.88 µg/m3 was 76% that ofsilica sand at 32.62 µg/m3. Staurolite had the third lowest geometric mean concentrationof vanadium; garnet and silica sand with dust suppressant were lower.
Silver was not detected above the LOD for the staurolite generic category ofabrasives. Staurolite had the highest geometric mean concentration for lead and titanium.Based on the industrial hygiene results in the field study, substituting staurolite for silicasand in abrasive blasting should reduce airborne respirable quartz concentrations. All ofthe airborne data from the field study must be viewed as indicative only of relativepotential for the presence of health-related agents, since the field conditions were notnecessarily representative of actual work site conditions. In addition, variability betweenindividual abrasives within a generic category must also be considered prior to drawingany broad health-based conclusions.
Silica Sand
Three out of four airborne samples of silica sand had measured concentrationsabove the LOD for arsenic. The geometric mean concentration was 4.225 µg/m3. Silicasand had the second lowest geometric mean concentration of arsenic for the eight genericabrasive categories. Only staurolite was lower.
Three out of four airborne samples of silica sand had measured concentrationsabove the LOD for beryllium. The geometric mean concentration was 0.792 µg/m3. Thisplaced silica sand second highest of the eight generic abrasive categories, with coal slagabrasives having a higher geometric mean concentration.
All four of the airborne results of silica sand had measured concentrations abovethe LOD for cadmium. The geometric mean concentration was 0.185 µg/m3. Silica sandhad the lowest geometric mean concentration of cadmium within the eight genericabrasives.
Evaluation of Substitute Materials forSilica Sand in Abrasive Blasting
64
Three out of four airborne samples of silica sand had measured concentrationsabove the LOD for chromium. The geometric mean concentration was 36.082 µg/m3.This places silica sand second lowest among the eight generic abrasives. Silica sand withdust suppressant had a lower geometric mean concentration.
Three out of four airborne samples of silica sand had measured concentrationsabove the LOD for lead. The geometric mean concentration was 6.052 µg/m3. Silicasand had the lowest geometric mean concentration out of the eight generic abrasives.
All four airborne samples of silica sand had measured concentrations above theLOD for manganese. The geometric mean concentration was 383.573 µg/m3. This wasthe second lowest geometric mean concentration for manganese out of the eight genericabrasives. The lowest geometric concentration was silica sand with dust suppressant.
All four airborne sample results had a measured concentration above the LOD fornickel. The geometric mean concentration was 28.326 µg/m3. This placed silica sandfifth out of eight generic abrasives. Staurolite, garnet, and silica sand with dustsuppressant had lower geometric mean concentrations of nickel.
All four airborne samples of silica sand had measured concentrations above theLOD for respirable quartz. The geometric mean concentration was 27.959 mg/m3. Silicasand had the highest geometric mean concentration of respirable quartz of all the genericcategories of abrasives.
All four airborne samples of silica sand had measured concentrations above theLOD for titanium. The geometric mean concentration was 749.579 µg/m3. This placedsilica sand fourth out of eight generic abrasives. Garnet, nickel slag, steel grit, and silicasand with dust suppressant had lower geometric mean concentrations of titanium.
All four airborne samples had a measured concentration above the LOD forvanadium. The geometric mean concentration for silica sand was 32.622 µg/m3. Thisplaced silica sand fifth out of eight generic abrasives. Staurolite, garnet, and silica sandwith dust suppressant had lower geometric mean concentrations of vanadium.
There were no detectable concentrations of silver within the silica sand genericabrasive category.
Silica Sand with Dust Suppressant
All four airborne results of silica sand with dust suppressant had measuredconcentrations above the LOD for arsenic. The geometric mean concentration of 6.190µg/m3 was about 1.5 times that of silica sand at 4.225 µg/m3. Silica sand with dustsuppressant had the fifth highest geometric mean concentration of arsenic; steel grit,copper slag, garnet, and coal slag were higher.
Three out of the four airborne results of silica sand with dust suppressant hadmeasured concentrations above the LOD for beryllium. The geometric mean

Evaluation of Substitute Materials forSilica Sand in Abrasive Blasting
65
concentration of 0.094 µg/m3 was about 12 % that of silica sand at 0.792 µg/m3. Silicasand with dust suppressant had the second lowest geometric mean concentration ofberyllium. The lowest geometric mean concentration (0.041 µg/m3) was that of steel grit.
All four airborne samples of silica sand with dust suppressant had a measuredconcentration above the LOD for cadmium. The geometric mean concentration of 0.216µg/m3 was similar to silica sand (1.2 times higher) at 0.185 µg/m3. Silica sand with dustsuppressant had the second lowest geometric mean concentration of cadmium; silica sandwas lower.
All four airborne samples of silica sand with dust suppressant had measuredconcentrations above the LOD for chromium. The geometric mean concentration of33.52 µg/m3 was approximately 93% that of silica sand at 36.08 µg/m3. Silica sand withdust suppressant had the lowest geometric mean concentration for chromium.
All four airborne samples of silica sand with dust suppressant had measuredconcentrations above the LOD for lead. The geometric mean concentration of 8.563µg/m3 was slightly higher (1.4 times) than silica sand at 6.052 µg/m3. Silica sand withdust suppressant had the third highest geometric mean concentration of lead; coal slagand staurolite were higher.
All four airborne sample results for silica sand with dust suppressant hadmeasured concentrations above the limit of detection for manganese. The geometricmean concentration of 226.6 µg/m3 was approximately 60% that of silica sand at 383.6µg/m3. Silica sand with dust suppressant was the lowest geometric mean concentrationof manganese.
Three out of four airborne sample results for silica sand with dust suppressant hadmeasured concentrations above the limit of detection for nickel. The geometric meanconcentration of 14.58 µg/m3 was approximately 50% that of silica sand at 28.33 µg/m3.Silica sand with dust suppressant was the lowest geometric mean concentration of nickel.
All four airborne samples of silica sand with dust suppressant had measuredconcentrations above the LOD for respirable quartz. The geometric mean of 19.04mg/m3 was approximately 68% that of silica sand at 27.96 mg/m3. The silica sand withdust suppressant abrasive category had the second highest geometric mean concentrationof respirable quartz of all eight generic abrasive types; silica sand was higher.
Only one of 4 airborne samples of silica sand with dust suppressant had measuredconcentration above the LOD for silver. The geometric mean of silica sand with dustsuppressant was1.045 µg/m3, which is approximately 1.2 times that of silica sand at 0.861mg/m3. Silica sand with dust suppressant was the only abrasive with a sample resultabove the limit of detection for silver.
All four airborne samples of silica sand with dust suppressant had measuredconcentrations above the LOD for titanium. The geometric mean concentration of 27.789
Evaluation of Substitute Materials forSilica Sand in Abrasive Blasting
66
µg/m3 was about 4% of silica sand at 749.58 µg/m3. Silica sand with dust suppressanthad the second lowest geometric mean concentration of titanium; steel grit was lower.
All four airborne samples of silica sand with dust suppressant had measurableconcentrations above the LOD for vanadium. The geometric mean concentration of3.010 µg/m3 was about 9% that of silica sand at 32.62 µg/m3. Silica sand with dustsuppressant had the lowest geometric mean concentration of the eight generic abrasives.
Copper Slag
All four airborne samples of copper slag had a measured concentration above theLOD for arsenic. The geometric mean concentration of 21.82 µg/m3 for the copper slaggeneric abrasive category was more than 5 times higher than that of silica sand at 4.225µg/m3. Copper slag had the second highest geometric mean concentration of arsenic.Only steel grit with a geometric mean concentration of 22.65 µg/m3 was higher.
All four airborne samples of copper slag had a measured concentration above theLOD for beryllium. The geometric mean concentration of 0.766 µg/m3 for the copperslag generic abrasive category was 97% that of silica sand at 0.792 µg/m3. Copper slaghad the third highest geometric mean concentration of beryllium; only coal slag and silicasand were higher.
All four airborne samples of copper slag had a measured concentration above theLOD for cadmium. The geometric mean concentration of 0.448 µg/m3 for the copperslag generic abrasive category was about 2.4 times higher than that of silica sand at 0.185µg/m3. Copper slag had the third highest geometric mean concentration of cadmium;coal slag, and garnet were higher.
All four airborne samples of copper slag had a measured concentration above theLOD for chromium. The geometric mean concentration of 73.7 µg/m3 for the copperslag generic abrasive category was about 2 times higher than that of silica sand at 36.08µg/m3. Copper slag had the third lowest geometric mean concentration of chromium;silica sand and silica sand with dust suppressant were lower.
All four airborne samples of copper slag had a measured concentration above theLOD for lead. The geometric mean concentration of 6.785 µg/m3 for the copper slaggeneric abrasive category was slightly higher than that of silica sand at 6.052 µg/m3. Thecopper slag generic abrasive category had the second lowest geometric concentration oflead; only silica sand was lower.
All four airborne samples of copper slag had a measured concentration above theLOD for manganese. The geometric mean concentration of 2,181 µg/m3 for the copperslag generic abrasive category was about 5.7 times higher than that of sand at 383.6µg/m3. Copper slag had the third highest geometric mean concentration of manganese;garnet and steel grit were higher.
Evaluation of Substitute Materials forSilica Sand in Abrasive Blasting
67
All four airborne samples of copper slag had a measured concentration above theLOD for nickel. The geometric mean concentration of 33.39 µg/m3 for the copper slaggeneric abrasive category was slightly higher than that of silica sand at 28.33 µg/m3.Copper slag has the fourth highest geometric mean concentration of nickel; coal slag,steel grit, and nickel slag were higher.
All four airborne samples of copper slag had a measured concentration above theLOD for titanium. Copper slag’s geometric mean concentration of 1,289 µg/m3 wasabout 1.7 times higher than that of silica sand at 749.6 µg/m3. Copper slag had the thirdhighest geometric mean concentration of titanium; coal slag and staurolite were higher.
All four airborne samples of copper slag had a measured concentration above theLOD for vanadium. Copper slag’s geometric mean concentration of 77.157 µg/m3 wasabout 2.4 times higher than that of silica sand at 32.62 µg/m3. Copper slag had thesecond highest geometric mean concentration of vanadium; coal slag was higher.
Respirable quartz and silver were not detected above the LOD for the copper slaggeneric abrasive category. Based on the industrial hygiene results in the field study,substituting copper slag for silica sand in abrasive blasting should reduce airbornerespirable quartz concentrations. However, the copper slag generic abrasive category isnot without potentially hazardous health-related agent concerns.
Out of the eight generic abrasive categories, copper slag has the second highestgeometric mean airborne concentration of arsenic and vanadium. All of the airborne datafrom the field study must be viewed as indicative only of relative potential for thepresence of health-related agents, since the field conditions were not necessarilyrepresentative of actual work site conditions. In addition, variability between individualabrasives within a generic category must also be considered prior to drawing any broadhealth-based conclusions.
Garnet
All four airborne samples of garnet had a measured concentration above the LODfor arsenic. The geometric mean concentration of 9.292 µg/m3 was about 2.2 times thatof silica sand at 4.225 µg/m3. Garnet had the third highest geometric mean concentrationof arsenic of all the generic abrasives; copper and steel grit were higher.
All four airborne samples had measured concentrations above the LOD forberyllium. The geometric mean concentrations of 0.505 µg/m3 was slightly less than63% that of silica sand at 0.792 µg/m3. Garnet had the fifth highest geometric meanconcentration of beryllium; staurolite, copper slag, silica sand, and coal slag were higher.
All four airborne samples of garnet had measured concentration above the LODfor cadmium. The geometric mean concentration of 1.105 µg/m3 was nearly 6 timeshigher than silica sand at 0.185 µg/m3. Garnet had the highest geometric meanconcentration of cadmium.

Evaluation of Substitute Materials forSilica Sand in Abrasive Blasting
68
All four airborne samples of garnet had measured concentrations above the LODfor chromium. The geometric mean concentration of 94.37 µg/m3 was approximately 2.6times higher than silica sand at 36.08 µg/m3. Garnet had the fourth highest geometricmean concentration of chromium; nickel slag, steel grit, and coal slag were higher.
All four airborne samples of garnet had measured concentrations above the LODfor lead. The geometric mean concentration of 8.558 µg/m3 was slightly higher (1.4times) than silica sand at 6.052 µg/m3. Garnet had the fourth highest geometric meanconcentration of lead; staurolite, coal slag, and silica sand with dust suppressant werehigher.
All four airborne samples of garnet had measured concentrations above the LODfor manganese. The geometric mean of 9,486 µg/m3 was approximately 25 times higherthan silica sand at 383.6 µg/m3. Garnet had the highest geometric mean concentration ofmanganese.
Three out of four airborne samples of garnet had a measured concentration abovethe LOD for nickel. The geometric mean concentration of 16.38 µg/m3 was about 60%that of silica at 28.33 µg/m3. Garnet had the second lowest geometric meanconcentration of nickel; only silica sand with dust suppressant was lower.
All four airborne samples of garnet had measured concentrations above the LODfor respirable quartz. The geometric mean concentration of 2.6 mg/m3 was aboutapproximately 9% that of silica sand at 27.96 mg/m3. Of the eight generic abrasives,garnet had the third highest measured geometric mean concentration; silica sand andsilica sand with dust suppressant were higher.
All four airborne samples of garnet had measured concentrations above the LODfor titanium. The geometric mean concentration of 284.3 µg/m3 was less than 40% thatof silica sand at 749.6 µg/m3. Staurolite, coal slag, copper slag, and silica sand hadhigher geometric mean concentrations while nickel slag, steel grit, and silica sand withdust suppressant were lower.
All four airborne samples of garnet had measured concentrations above the LODfor vanadium. The geometric mean of 20.37 µg/m3 was approximately 63% that of silicasand at 32.62 µg/m3. Of the eight generic abrasives, garnet had the second lowestmeasured concentration; silica sand with dust suppressant was lower.
None of the airborne samples had measured concentrations above the LOD forsilver. Based on the industrial hygiene results in the laboratory study, substituting garnetin abrasive blasting should reduce airborne respirable quartz concentrations. However,the garnet generic abrasive category is not without potential hazardous health-relatedagent concerns.
Garnet had the highest geometric mean concentration of cadmium andmanganese. All of the airborne data from the laboratory must be viewed as indicative

Evaluation of Substitute Materials forSilica Sand in Abrasive Blasting
69
only of the relative potential for the presence of health-related agents, since the fieldconditions were not necessarily representative of actual work site conditions. In addition,variability between individual abrasives within a generic category must also beconsidered prior to drawing any broad health-based conclusions.
Steel Grit
All four airborne samples of steel grit had measured concentrations above theLOD for arsenic. The geometric mean concentration of 22.65 µg/m3 was over 5 timeshigher than silica sand at 4.225 µg/m3. Steel grit had the highest geometric meanconcentration of arsenic.
All four airborne samples of steel grit had measured concentrations above theLOD for cadmium. The geometric mean concentration of 0.426 µg/m3 was 2.3 timeshigher than silica sand at 0.185 µg/m3. Steel grit had the fourth highest geometric meanconcentration of cadmium; garnet, coal slag, and copper slag were higher.
All four airborne samples of steel grit had measured concentrations above theLOD for chromium. The geometric mean concentration of 1,025 µg/m3 wasapproximately 28 times that of silica sand at 36.08 µg/m3. Steel grit had the secondhighest geometric mean concentrations of chromium, while nickel slag was higher.
All four airborne samples of steel grit had measured concentrations above theLOD for lead. The geometric mean concentration of 7.137 µg/m3 was slightly higherthan silica sand at 6.052 µg/m3. Steel grit had the fourth lowest geometric meanconcentration of lead; nickel slag, copper slag and silica sand were lower.
All four airborne samples of steel grit had measured concentrations above theLOD for manganese. The geometric mean concentration of 4,942 µg/m3 wasapproximately 13 times higher than silica sand at 383.6 µg/m3. Steel grit has the secondhighest geometric mean concentration of manganese; garnet was higher.
All four airborne samples of steel grit had measured concentrations above theLOD for nickel. The geometric mean concentration of 523.6 µg/m3 was approximately18.5 times higher than silica sand at 28.3 µg/m3. Steel grit had the second highestgeometric mean concentration of nickel; nickel slag was higher.
All four airborne samples of steel grit had measured concentrations above theLOD for titanium. The geometric mean concentration of 21.7 µg/m3 was approximately3% that of silica sand at 749.6 µg/m3. Steel grit had the lowest geometric meanconcentration of titanium.
All four airborne samples of steel grit had a measured concentration above theLOD for vanadium. The geometric mean concentration of 59.16 µg/m3 wasapproximately 1.8 times higher than silica sand at 32.62 µg/m3. Steel grit had the third

Evaluation of Substitute Materials forSilica Sand in Abrasive Blasting
70
highest geometric mean concentration of vanadium; coal slag and copper slag werehigher.
All of steel grit’s airborne samples were less than the LOD for beryllium,respirable quartz, and silver. Based upon the industrial hygiene results in the field study,substituting steel grit for silica sand in abrasive blasting should reduce airborne respirablequartz concentrations. However, the steel grit generic abrasive category is not withoutpotential health-related agent concerns.
Steel grit as a generic category of abrasives had the highest geometric meanconcentration of arsenic, and the second highest geometric mean concentrations ofchromium, manganese, and nickel. All of the airborne data from the field must beviewed as indicative only of the relative potential for the presence of health-relatedagents, since the field conditions were not necessarily representative of actual work siteconditions. In addition, variability between individual abrasives within a generic categorymust also be considered prior to drawing any broad health-based conclusions.

Evaluation of Substitute Materials forSilica Sand in Abrasive Blasting
71
TABLE 1

Evaluation of Substitute Materials forSilica Sand in Abrasive Blasting
72
Treated Versus Untreated Abrasives
Table 2 presents a comparison of the geometric mean concentrations for each ofthe 11 health-related agents for silica sand abrasive treated with dust suppressant and anuntreated silica sand abrasive. While the data is presented as a paired set, the abrasivesare not from the same supplier. Therefore, any variability noted may be due more to thevariation between silica sand abrasives than the effect of the dust suppressant.Nonetheless, a review of the data shows that the geometric mean concentration for fourof the health-related agents (arsenic, cadmium, lead and silver) increased for the silicasand with dust suppressant abrasive, while it decreased for the remaining seven health-related agents.
TABLE 2Comparison of Geometric Mean Concentrations of Health-Related Agents
for Untreated and Dust Suppressant Treated AbrasivesNote: Unless noted, all concentrations in micrograms per gram
PairAbrasive Arsenic Beryllium Cadmium Chromium Lead Manganese Nickel
RespirableQuartz
(mg/m 3)Silver Titanium Vanadium
SS 4.23 0.79 0.18 36.1 6.05 383.6 28.3 28.0 0.86 749.6 32.6
SSDS 6.19 0.09 0.22 33.5 8.56 226.6 14.6 19.1 1.04 27.8 3.0
Bulk Sample Discussion
Figures 11 to 21 on pages 77 to 87 and Table 3 on page 88 show theconcentrations for the virgin bulk levels of eleven hazardous health-related agents foreach of the 8 abrasive products tested. These are the same hazardous health-relatedagents that were used for comparative analysis of the airborne concentrations. Theconcentrations are indicated by a small square.
For abrasive having results below the limit of detection for the given health-related agent, the concentration was calculated by using LOD/2, which is the methodused to estimate the average concentration in the presence of non-detectable valuesdescribed by Hornung and Reed.H&R20
These figures 11 to 21 and Table 3 provide some indication of the source of theairborne concentrations described previously in the industrial hygiene results anddiscussion sections. The metal content in the steel surface, which was blasted, isunknown.

Evaluation of Substitute Materials forSilica Sand in Abrasive Blasting
73
Radiation
Eight different abrasive blasting materials were analyzed for content ofradioactive materials using two independent methods, direct gamma measurements forvirgin (unused) and spent (used) bulk samples and radiochemical separation of radiumwith alpha spectrometry measurements for airborne samples. Gamma spectrometryinvolves lacing a sample of the material on a high resolution germanium detectorinstalled in a low background shield to detect the presence of photons from gamma-emitting radionuclides in the sample. The specific radiochemical separation of radiuminvolves a rigorous chemical dissolution of a small amount of sample, usually less than 1gm, followed by precipitation and filtration to isolate radium from the solution for alphacounting.
The abrasive blasting materials were collected during a field study conductedoutdoors on a barge using a portable containment structure. The bulk samples of abrasiveblasting included material obtained from the bag before blasting (unused) and materialthat was collected from the floor of the portable containment structure after blasting.Although the physical particle size distribution of the abrasive blasting material willlikely change after it is used, there is no evidence that blasting should effect the inherentradioactive content of the abrasive unless the surface being blasted is, itself,contaminated.
Because of the prevalence of radioactive contamination in reclaimed materials, itis prudent to survey blasting slags for radioactive contamination. Gamma spectrometry isthe traditional method that is used to survey bulk materials for photon emittingradioactive contaminants such as 137Cs and 60Co. These contaminants are easy todetect, even in samples of very small mass, because the photons emitted from thecontaminants have a very high yield. The photon yield from naturally occurringradioactive materials is substantially lower making it necessary to analyze sampleshaving greater mass.
The naturally occurring radioactive materials expected to be found in the blastingabrasives include 238U and its decay products, 232Th and its decay products, and 40K.Each of these long-lived radionuclides is found in varying concentrations in all naturalmatrix materials since they are ubiquitous throughout the earth. It is common practice toevaluate natural matrix samples for radioactivity content using gamma spectrometry since238U and 232Th and 40K have gamma-emitting radioactive decay products that caneasily be detected if the sample size is sufficiently large. Unfortunately, 238U and 232Thare, themselves, not gamma emitters so analysis by gamma spectrometry can bemisleading if the measurement procedure is not optimized for detecting low abundantphotons from their respective progeny.
Analysis of radium in natural matrix samples is best performed by separating theradium from the sample matrix so that the alpha particles from the decay of 226Ra and224Ra can be reliably detected. The primary decay mode of radium is by alpha emission,although the decay progeny emit copious quantities of photons. Radium also emits a 185keV photon with very low abundance (i.e., ~ 4%). Unfortunately, analysis of radium by

Evaluation of Substitute Materials forSilica Sand in Abrasive Blasting
74
gamma spectrometry is seriously confounded by photons from 235U that is also presentin natural matrix samples. Therefore, the most sensitive and reliable method foranalyzing the content of radium in a natural matrix sample is by radiochemical separationand alpha spectrometry. Unfortunately, the radiochemical method limits the sample sizeto less than 1 g.
The sensitivity of gamma spectrometry and radium alpha spectrometry variessubstantially from sample to sample. The laboratory reported values for “detectionlimits” and measurement uncertainty for most of the sample results. The detection limitand measurement uncertainty for the radiochemical analyses are explicitly determined foreach sample using a 133Ba tracer added to each sample before processing. Therefore, theresults reported for 226Ra are very reliable. Unfortunately, due to small sample size andbackground measurement variations, the gamma spectrometry results are inherently veryunreliable. The same criteria that were developed for analysis of Phase I LaboratoryStudy gamma spectrometry results were used to analyze the data associated with thePhase II Field Study. The three criteria for identifying positive results are reproducedbelow:
(1) The reported result for an isotope in a sample must exceed the range ofdetection limits reported for that isotope in all samples. Variation indetector background is the greatest uncertainty since the sample size is sosmall. In most cases, the concentration of naturally occurring radioactivematerial in a 10 g sample will be significantly less than the amount thatcan be reliably detected by gamma spectrometry. Therefore, a result foran isotope that is truly greater than background must exceed the range ofdetection limits reported for all the samples measured in a batch.
(2) The reported result for a sample must exceed three times the reporteduncertainty. The uncertainty reported for each isotope in the samplerepresents only one standard deviation of Poisson counting statistics anddoes not include variation in background. In order for a sample to besignificantly greater than background, the result must exceed the 99%confidence limit defined by the Poisson distribution.
(3) If the reported isotope is a member of a chain, it's parent should also bepresent, especially if the progeny has a short half-life. This is especiallyimportant for the short-lived radon progeny (which are present in the airand will confound the sample measurement) since they must be supportedby a longer-lived parent in the sample.
Results
226Ra by Radiochemical Separation and Alpha Spectrometry: Airborne Samples
The NIOSH contract laboratory Standard Operating Procedure (SOP) WN-IN-314“The Determination of Radium-226 in Solids by Alpha Spectrometry7” was implementedfor radiochemical analysis of radium and follows the recognized method for conducting

Evaluation of Substitute Materials forSilica Sand in Abrasive Blasting
75
these measurements. Although the detection limit was reported for each sample result,the laboratory did not report the measurement uncertainty, so the reliability of themeasurement results cannot be evaluated.
The radium content of the total and respirable dusts of staurolite abrasive weregreater than the reported detection limit. The quantity of 226Ra detected in the stauroliteabrasive is similar to the expected quantity of 226Ra normally found in soil. There is noreason to believe that any of the other respirable or total abrasive dust samples containedradium in excess of the detection limit, even though the radium content for certainsamples of respirable or total dusts exceeded the detection limit. This is an indicationthat there is still considerable uncertainty in these results since there is no reason tobelieve that the content of radium in the abrasive would be partitioned differentlybetween the respirable and total dust fractions. The laboratory should report themeasurement uncertainty for each sample along with the detection limit so that a morereliable evaluation of the results could be developed.
Gamma Spectrometry Analysis Results: Virgin and Used Bulk Samples
Gamma spectrometry measurements have been performed using virgin and usedbulk samples of abrasive blasting materials to determine the content of several gamma-emitting isotopes. These measurements were analyzed by following the NIOSH contractlaboratory (SOP) WR-EP-325 “Determination of Gamma Emitting Isotopes.8” Evaluationof the gamma spectrometry data leads to inconclusive findings because the size of thesample used in each measurement was too small. The small sample size, combined withthe low content of naturally occurring radioactive materials in these samples, leads tohighly uncertain results.
The raw and spent samples of garnet and copper slags were both significantlypositive for 238U, although it is unclear from the laboratory procedure how uranium,which decays by alpha emission, is detected using gamma spectrometry. On the otherhand, it is not reasonable to expect that the raw samples of coal slag, which were positivefor uranium, would be different in uranium content than the spent coal slag, which wasnot positive for uranium.
Lead-210 was found in many samples and could be indicative of the presence ofradium. Both samples of raw and spent steel grit abrasive were positive for 210Pb.However, the photon energy of 210Pb is very low (47 keV) and its yield is also very low(~4%) which makes detection very difficult unless the detector is specially designed forlow energy photons. Because the sample mass was so small, the reliability of the 210Pbresults is quite uncertain. This conclusion is further supported by the finding that the210Pb content of raw and blasted abrasives were inconsistent, since there is no reason tobelieve that the blasting process would preferentially remove the nuclide. On the otherhand, because a considerable volume of compressed air is used in the blasting process,one might conclude that radon and its progeny from the air could be added to the blastedabrasive, although the gamma spectrometry results do not support this finding.
Evaluation of Substitute Materials forSilica Sand in Abrasive Blasting
76
No evidence was present in the data to indicate that any of the samples exhibitedelevated concentrations of technologically-enhanced radioactive materials such as 137Csor 60Co. Unlike the naturally occurring radioactive materials, the photon yield of thetechnologically-enhanced radioactive contaminants is high and easily detected, even insmall 10 g samples.
Discussion
Analysis of naturally occurring radioactive materials in natural matrix samples isconfounded by the presence of uranium, thorium, and potassium in the background of themeasurement. Likewise, room air contains varying amounts of radon and its short-livedprogeny, which are also present as confounders in the background and the samplemeasurement. Therefore, it is necessary to include estimates of the total propagateduncertainty with all measurement results so that the data can be adequately evaluated.Likewise, since the detection efficiency increases with sample size, it is necessary to usea sample of sufficient mass so that the total amount of activity expected in the samplewill exceed the limit of detection for the analytical method. The laboratory did not usesufficient sample mass to produce gamma spectroscopy measurements with sufficientreliability to produce conclusive results.
A non-negligible source of contamination for spent blasting abrasives is the aircompressor that is used during the blasting process. Radon in the air will be concentratedby the air compressor. Since radon is very soluble in oil and other organic fluids, thecompressor will also act as a radon reservoir and may actually contaminate the abrasivewith 210Pb, the longest lived decay product of 222Rn.
Further evaluation of this data must be preceded by an evaluation of the computermethod used by the NIOSH contract laboratory for analyzing gamma spectra. Likewise,the laboratory must report the total propagated uncertainty for all of their results as wellas the detection limits so that a more reliable analysis of the data can be performed.

Evaluation of Substitute Materials forSilica Sand in Abrasive Blasting
77
FIGURE 11 – ARSENIC VIRGIN BULK SAMPLE RESULTS

Evaluation of Substitute Materials forSilica Sand in Abrasive Blasting
78
FIGURE 12 – BERYLLIUM VIRGIN BULK SAMPLE RESULTS

Evaluation of Substitute Materials forSilica Sand in Abrasive Blasting
79
FIGURE 13 – CADMIUM VIRGIN BULK SAMPLE RESULTS

Evaluation of Substitute Materials forSilica Sand in Abrasive Blasting
80
FIGURE 14 – CHROMIUM VIRGIN BULK SAMPLE RESULTS

Evaluation of Substitute Materials forSilica Sand in Abrasive Blasting
81
FIGURE 15 – LEAD VIRGIN BULK SAMPLE RESULTS

Evaluation of Substitute Materials forSilica Sand in Abrasive Blasting
82
FIGURE 16 – MANGANESE VIRGIN BULK SAMPLE RESULTS

Evaluation of Substitute Materials forSilica Sand in Abrasive Blasting
83
FIGURE 17 – NICKEL VIRGIN BULK SAMPLE RESULTS

Evaluation of Substitute Materials forSilica Sand in Abrasive Blasting
84
FIGURE 18 – SILVER VIRGIN BULK SAMPLE RESULTS

Evaluation of Substitute Materials forSilica Sand in Abrasive Blasting
85
FIGURE 19 – TITANIUM VIRGIN BULK SAMPLE RESULTS

Evaluation of Substitute Materials forSilica Sand in Abrasive Blasting
86
FIGURE 20 – VANADIUM VIRGIN BULK SAMPLE RESULTS

Evaluation of Substitute Materials forSilica Sand in Abrasive Blasting
87
FIGURE 21 – QUARTZ VIRGIN BULK SAMPLE RESULTS

Evaluation of Substitute Materials forSilica Sand in Abrasive Blasting
88
TABLE 3
Evaluation of Substitute Materials forSilica Sand in Abrasive Blasting
89
CONCLUSIONS AND RECOMMENDATIONS
Conclusions
Conclusions from the study are provided separately below for performance andindustrial hygiene issues. The abrasives are grouped below based on similar performancecharacteristics relative to silica sand.
Abrasive Performance Issues
The eight abrasives were evaluated for cleaning rate, consumption rate, surfaceprofile, breakdown, and embedment. It is important to recognize that the Phase 1 Studydemonstrated that the performance characteristics within a given generic category classof abrasive was variable. Individual abrasives within a generic category showed both“good” and “poor” performance. For Phase 2, only one abrasive from each genericcategory was selected for evaluation. As a result, conclusions regarding the entirecategory of abrasives based on the specific abrasive evaluated are inappropriate. Eachunique abrasive needs to be evaluated individually. Further, it must be recognized that byestablishing the optimum operating conditions for each abrasive (nozzle orifice size,metering valve setting, nozzle-to-workpiece distance, etc.), the relative performance ofthe abrasives will be affected. The results presented in this Phase 2 report arerepresentative of the specific pre-established operating conditions which were tightlycontrolled.
Based on the study parameters, the staurolite abrasive evaluated exhibitedperformance characteristics (cleaning rate, consumption rate, breakdown andembedment) that were superior to the silica sand abrasive evaluated. However, staurolitewas the most expensive abrasive to use ($1.02/square foot versus $0.72/sqaure foot forsilica sand). Each of the other abrasives evaluated exhibited a range of properties thatwere comparable to, better, or worse than silica sand. The coal slag abrasive exhibitedboth improved cleaning and consumption rates, but more embedment than silica sand.The cost of use was comparable ($0.69/square foot versus $0.72/square foot). Garnetalso exhibited improved cleaning and consumption rates but at an increased cost($0.89/square foot versus $0.72/square foot). Steel grit exhibited lesser cleaning ratesunder the test, but significantly improved breakdown rates. The cost of use wascomparable to garnet. The copper slag abrasive evaluated exhibited reduced cleaningrates over silica sand and a poorer breakdown rate. The cost of use was higher($0.82/square foot versus $0.72/square foot). Nickel slag exhibited reduced cleaningrates, but less embedment. The cost of use was higher ($0.96/square foot versus$0.72/square foot). Conclusions regarding the effect of dust suppressant can not be madebecause the treated and untreated silica sands were different products.
It should be noted that if the abrasive must be treated as a hazardous waste, or it isused to remove a hazardous paint which causes the entire waste stream to be hazardous,the cost of use changes dramatically. If the resulting waste stream required disposal as a

Evaluation of Substitute Materials forSilica Sand in Abrasive Blasting
90
hazardous waste, the costs would range from $0.91/square foot to $1.67/square foot(versus $0.69/square foot to $1.02/square foot for non-hazardous disposal) with silicasand costing $1.37/square foot. Steel grit, in this case, is the most cost effective at$0.91/square foot.
Industrial Hygiene-Related Issues
While the study evaluated 30 potential contaminants, this analysis focused oneleven health-related agents selected by NIOSH including: arsenic, beryllium, cadmium,chromium, lead, manganese, nickel, respirable quartz, silver, titanium, and vanadium.The airborne sampling data should be viewed as an indicator of the potential for workerexposure to the health-related agents, since the conditions of the field study may not berepresentative of actual worksite conditions. More importantly, variability betweenindividual abrasives within a generic abrasive category must be considered prior todrawing any broad conclusions regarding airborne concentrations of hazardous health-related agents. The attributes of the specific abrasive rather than the generic class ofabrasive must be considered when making any health based comparisons.
Based on the industrial hygiene results collected in the field study, silica sandabrasives exhibited the highest levels of respirable quartz. The relative airborneconcentrations of the other 10 health-related agents in silica sand varied. Substituting anyof the alternative abrasives for silica sand should significantly reduce airborne respirablequartz concentrations for abrasive blasting. This respirable quartz reduction could serveas a major step in preventing the occurrence of silicosis in abrasive blasting. However,all of the alternative abrasives had at least four hazardous health-related agents whichresulted in a higher geometric mean concentration of the agent than that of silica sand, asdescribed below.
Coal slag had a greater geometric mean airborne concentration than those of silicasand for all the hazardous health-related agents, except respirable quartz. Out of the eightgeneric abrasive categories, coal slag had the highest geometric mean airborneconcentrations of beryllium and vanadium, and the second highest geometric meanconcentration of cadmium, lead, and titanium.
Nickel slag had greater geometric mean airborne concentrations than that of silicasand for seven of the hazardous health-related agents, except beryllium, respirable quartz,and titanium. Nickel slag had the highest geometric mean concentration of chromiumand nickel.
Staurolite had greater geometric mean airborne concentrations than that of silicasand for six of the health-related agents. Staurolite had the highest geometric meanconcentrations of lead and titanium.
Copper slag had greater geometric mean airborne concentrations than that ofsilica sand for eight hazardous health-related agents. Copper slag had the second highest
Evaluation of Substitute Materials forSilica Sand in Abrasive Blasting
91
geometric mean airborne concentration of arsenic and vanadium, and the third highestgeometric mean concentrations of beryllium, cadmium, manganese, and titanium.
Garnet had higher geometric mean concentrations than that of silica sand for fivehazardous health-related agents, including arsenic, cadmium, chromium, lead, andmanganese. Garnet had the highest geometric mean concentration of manganese and thethird highest geometric mean concentrations of arsenic and respirable quartz.
Steel grit had higher geometric mean concentrations than that of silica sand forseven hazardous health-related agents. Steel grit had the highest geometric meanconcentration of arsenic, and the second highest geometric mean concentrations ofchromium, manganese, and nickel.
No comparison of the effect of dust suppressant to reduce dust generation can bemade, as the underlying silica sand abrasives were from different suppliers. Therefore,apparent differences may be due to the inherent variability within generic abrasivecategories as opposed to the effect of the dust suppressant.
In summary, no single abrasive category had reduced levels of all health-relatedagents, although all the substitutes offer advantages over silica sand with regard torespirable quartz. All of the alternative abrasive categories have higher levels of at leastfour of the other health-related agents, as compared to silica sand.
Recommendations
Based upon the above conclusions, consideration should be given to the followingrecommendations:
1. When staurolite, coal slag, nickel slag, copper slag, garnet and/or steel grit abrasivesare used as alternatives to silica sand, select specific products from within the genericcategory which limit worker exposure to multiple toxic contaminants and whichoptimize desired performance characteristics. As indicated throughout this study,Phase 1 demonstrated that the attributes of the individual products within a genericclassification varied widely. Only one abrasive from each category was selected forthis Phase 2 study.
2. Given the potential exposures to multiple contaminants from both the abrasive, aswell as a painted steel surface, worker protection programs should be expanded toaddress all potential metals (e.g., as opposed to the current focus on worker leadprotection programs). Perhaps a comprehensive vertical health standard for industrialmaintenance painting operations addressing the use of abrasives, or classes of genericabrasives, should be developed. The standard would automatically invoke thenecessary levels of protection and work practices without the need to uniquelyevaluate each abrasive for all possible metals.

Evaluation of Substitute Materials forSilica Sand in Abrasive Blasting
92
In addition to the fundamental recommendations described above, this studyidentified the need for additional research. The recommended studies should be used to:
3. Evaluate the potential for correlations between the concentration of health-relatedagents in all virgin abrasives, and the resulting airborne concentrations, for use as aselection criteria.
4. Improve the quality of data regarding cleaning rate, consumption rate, and cost. Theprotocol should be modified to allow selection of blast nozzle size, meter valvesetting, and nozzle pressure for each individual abrasive, set experimentally inconjunction with the suppliers. While such variations limit the strict reproducibilityof the study and introduce subjective design criteria, these detractions will result inimproved cleaning rate, consumption rate, and cost data.
Evaluation of Substitute Materials forSilica Sand in Abrasive Blasting
93
REFERENCES 1 “SSPC-SP 10/NACE No. 2 Near-White Blast Cleaning” SSPC Publication No. 95-02.The Society for Protective Coatings, (formerly Steel Structures Painting Council), 40 24th
Street, 6th Floor, Pittsburgh, PA 15222-4656. (412) 281-2331; fax (412) 281-9982.
2 “Standard Test Method for Indicating Oil or Water in Compressed Air” Annual Book ofStandards, ASTM D4285-83. American Society for Testing and Materials, 100 HarborDrive, West Conshohocken, PA 19248-2959.
3 “SSPC VIS1-89” Visual Standard for Abrasive Blast Cleaned Steel, (StandardReference Photographs), Guide and Standard, SSPC: The Society for ProtectiveCoatings, (formerly Steel Structures Painting Council) 40 24th Street, 6th Floor,Pittsburgh, PA 15222-4656, (412) 281-2331; fax (412) 281-9982.
4 “Standard Test Method for Field Measurement of Surface Profile of Blast CleanedAnnual Book of Standards, Method C of ASTM D4417-93, Vol. 6.02, 1994.
American Society for Testing and Materials, 100 Harbor Drive, West Conshohocken, PA19248-2959. (610) 832-9500; fax (610) 832-9555.
5 “Standard Test Method for Sieve or Screen Analysis of Fine and Coarse Aggregates.”Annual Book of Standards, ASTM C136-92 Vol. 4.02 Concrete and Aggregates, pp 79-821993. American Society for Testing and Materials, 1916 Race Street, Philadelphia, PA19103-1187. (215) 299-5400; fax (215) 977-9679.
6 “OSHA Lead in Construction Training Course,” May 1, 1997, KTA-Tator, Inc., 115Technology Drive, Pittsburgh, PA 15275.
7 “NIOSH Manual of Analytical Methods,” Fourth Edition, U.S. Department of Healthand Human Services, Public Health Service, Centers for Disease Control and Prevention,National Institute for Occupational Safety and Health, August 1994
Silica, Crystalline, Respirable; Method 7500, Issue 2Elements (ICP); Method 7300, Issue 2Particulate Not Otherwise Regulated, Respirable; Method 0600, Issue 2
8 NIOSH Standard Operating Procedure (SOP) WR-IN-314 “The Determination ofRadium-226 in Solids by Alpha Spectrometry.” Revision No. 1, effective May 7, 1993.DataChem Laboratories, Inc., Salt Lake City, UT 84123-2547.
9 NIOSH Standard Operating Procedure (SOP) WR-IN-325 “Determination of GammaRevision No. 2, effective August 11, 1995. DataChem Laboratories,
Inc., Salt Lake City, UT 84123-2547.
10 “Occupational Safety and Health Administration (OSHA) Technical Manual” UnitedStates Department of Labor, Occupational Safety and Health Administration, OSHA
Evaluation of Substitute Materials forSilica Sand in Abrasive Blasting
94
Instruction TED 1.15, September 22, 1995, Office of Science and TechnologyAssessment
Chapter 1: Personal Sampling for Air ContaminantsSection C: Sampling TechniquesTechnique 3: Respirable Dust
11 “Achieving Productivity from Abrasive Blast Cleaning Systems,” Journal of ProtectiveCoatings & Linings, Volume No. 9, September 1989, pp 31-36.
12 “Users Guide to Selection of Blasting Abrasives,” National Shipbuilding ResearchProgram (NSRP); NSRP Program Manager, Halter Marine Group, Inc., P.O. Box 3029,Gulfport, MS 39505.
13 EPA Office of Solid Waste. “Test Methods for Evaluating Solid Waste. Physical andChemical Methods.” Toxicity Characteristics Leaching Procedure (TCLP Method 1311)2nd ed. Washington, DC: Environmental Protection Agency, 1982; SW-846. UpdatedJune 13, 1997 (62 FR 32452).
14 The AED Green Book, 49th Edition, 1998 Rental Rates & Specifications forConstruction Equipment, pp. 49, 71. PRIMEDIA Information, Inc., MachineryInformation Division, 1735 Technology Drive, Suite 410, San Jose, California 95110-1313.
15 The Tool Shed. 2705 East Washington Street, Indianapolis, IN 46201. (317) 467-2525.Equipment Rental Rate Catalog. pp. 7. Alpha VB 1200 Blast & Recovery System.
16 Blast Abrasives & Equipment. 3rd Edition. pp 12. Rental Rates. Blast N’ Vac w/HopperNo HEPA Filter. 888-444-2705. http://www.blastabrasives.com.e-mail: [email protected].
17 “The Salary Calculator”, Home Buyer’s Fair, Inc., Suite 3, 10304 North Hayden Road,Scottsdale, AZ 85258. Online. Internet. Available:http://www2.homefair.com/calc/salcalc.html?NETSCAPE_LIVEWIRE.scr=homefair
18 Transportation Research Board, Synthesis of Highway Practice 251, Lead-Based PaintRemoval for Steel Highway Bridges, National Cooperative Highway Research Program,Transportation Research Board, National Research Council, 2101 Constitution Avenue,N.W., Washington, D.C. 20418, 1997.
19 Richard W. Hornung and Laurence D. Reed, “Estimation of Average Concentration inthe Presence of Nondetectable Values,” Appl. Occup. EnvironHYG5(1), January 1990, pp46-51.
Evaluation of Substitute Materials forSilica Sand in Abrasive Blasting
95
20 Richard W. Hornung and Laurence D. Reed, “Estimation of Average Concentration inthe Presence of Nondetectable Values,” Appl. Occup. EnvironHYG 5(1), January 1990,pp 46-51.