Embed Size (px)
Citation preview
Environmental
Quality Board
Report on Silica Sand
Final Report
March 20, 2013

March 20, 2012
TABLE OF CONTENTS
I. INTRODUCTION
A. Purpose of This Report
II. BACKGROUND ON SILICA SAND
A. What is Silica Sand?
B. What is ‘Fracking’ and Why is Sand Needed?
C. Silica Sand Specifications for Hydraulic Fracturing
D. Location of Silica Sand Resources
E. Comparison of Silica Sand Mining to Other Sand and Gravel Mining
F. Processing of Silica Sand
G. Proppant Alternatives to Silica Sand
H. Multiple Industry Elements: Mining, Processing, Transporting of Silica Sand
III. FRACKING AND SAND MARKET SUMMARIES, SOCIOECONOMICS
A. Fracking Overview
B. Sand Market Overview
C. Research on Impacts of Mining on Communities
D. Employment Data
E. Potential Research Topics
IV. AIR QUALITY
A. Health Impacts
B. Permits and Standards
C. Potential Research Topics
V. WATER QUALITY
A. Groundwater
B. Surface Water
C. Permits and Standards
D. Potential Research Topics
VI. WATER QUANTITY
A. Dry Mining – Winona County Example
B. Wet Mining – Kasota Area Example
C. Possible Hydraulic Impacts of Mining
D. Permits and Standards
E. Water Abundance
F. Potential Research Topics
March 20, 2012
VII. TRANSPORTATION
A. Trucking and Road Systems
B. Rail and Rail Systems
C. Barge and Barge Systems
D. Potential Research Topics
VIII. GOVERNANCE
A. Local Government Land Use, Planning
B. State Agency Rules and Permitting
C. Environmental Review Categories
D. Noise
E. Quality of Life
F. Potential Research Topics
IX. POTENTIAL IMPACTS ON SENSITIVE RESOURCES
A. State Wildlife Action Plan
B. Important Bird Areas
C. MBS Important Prairie Landscapes
D. MBS Sites of Biodiversity Significance
E. MBS Native Plant Communities
F. Known Occurrences of Rare Species
G. Potential Research Topics
X. MAPPING PROJECT
A. Proposed Mapping Project Scope of Work
B. Level of Effort
C. Example Map Output
XI. POTENTIAL RESEARCH TOPICS
XII. DEFINITIONS
XIII. REFERENCES
XIV. APPENDICES
A. Minnesota Biological Survey Sites
B. Native Plant Communities Over Silica Sand Deposits < 50’ Deep
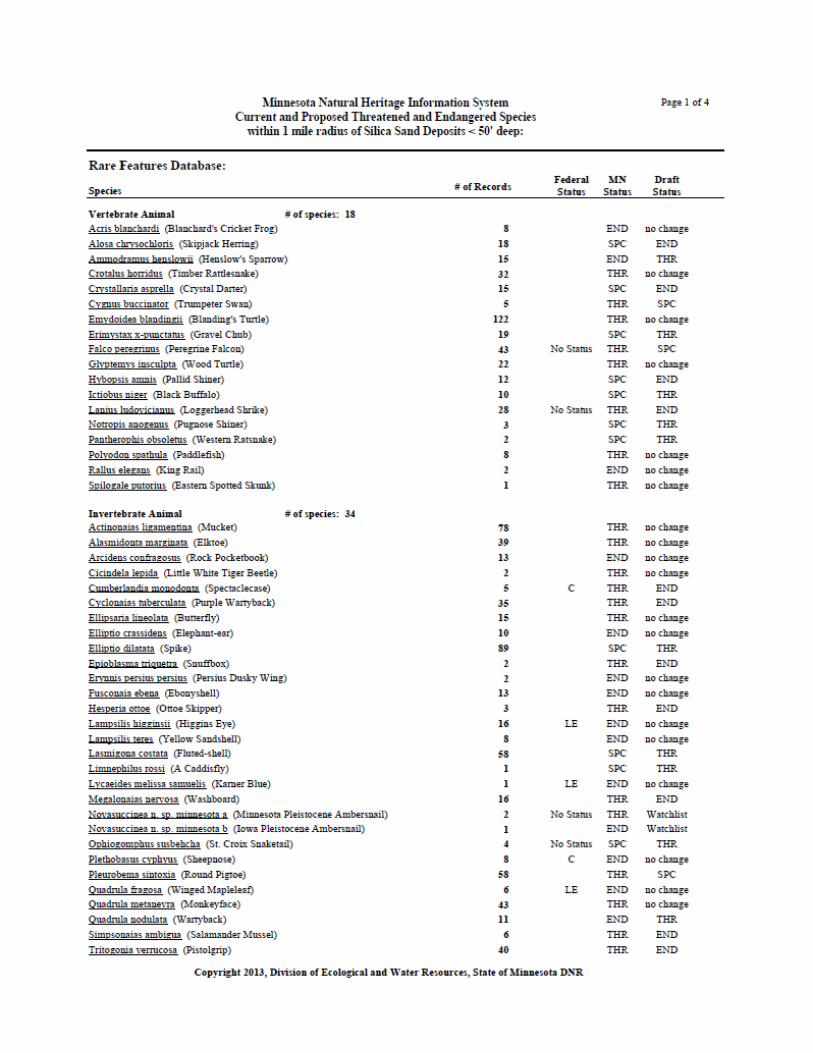
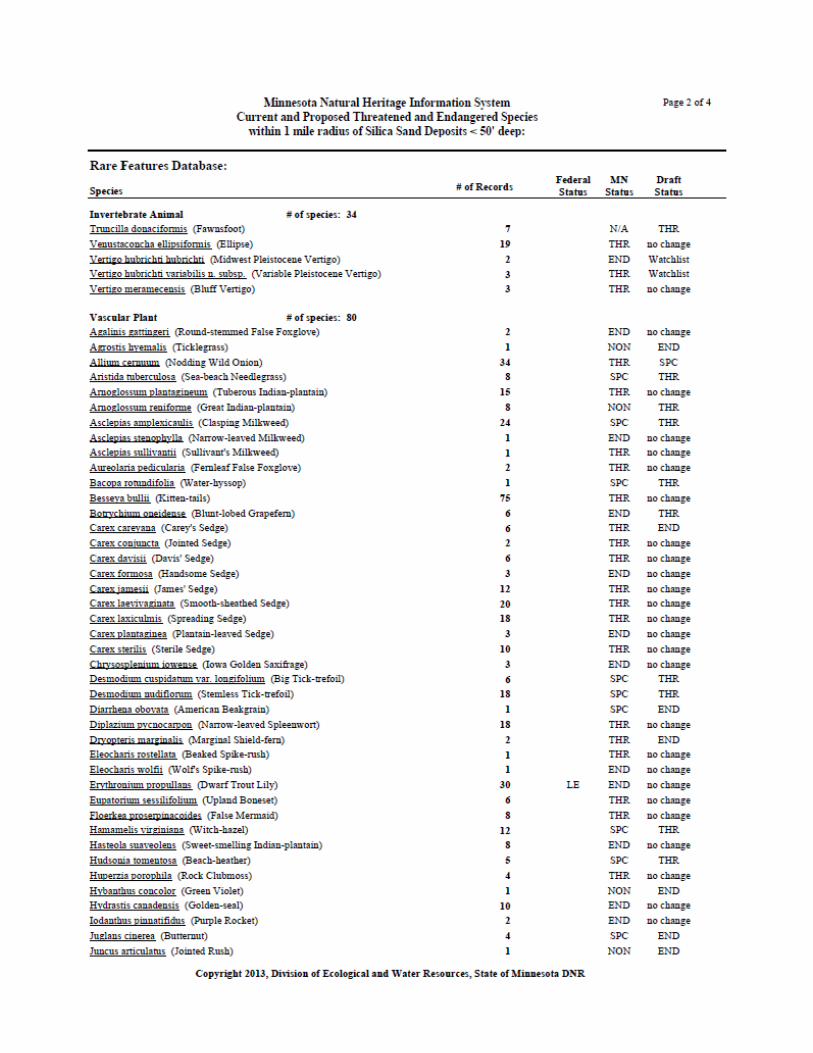
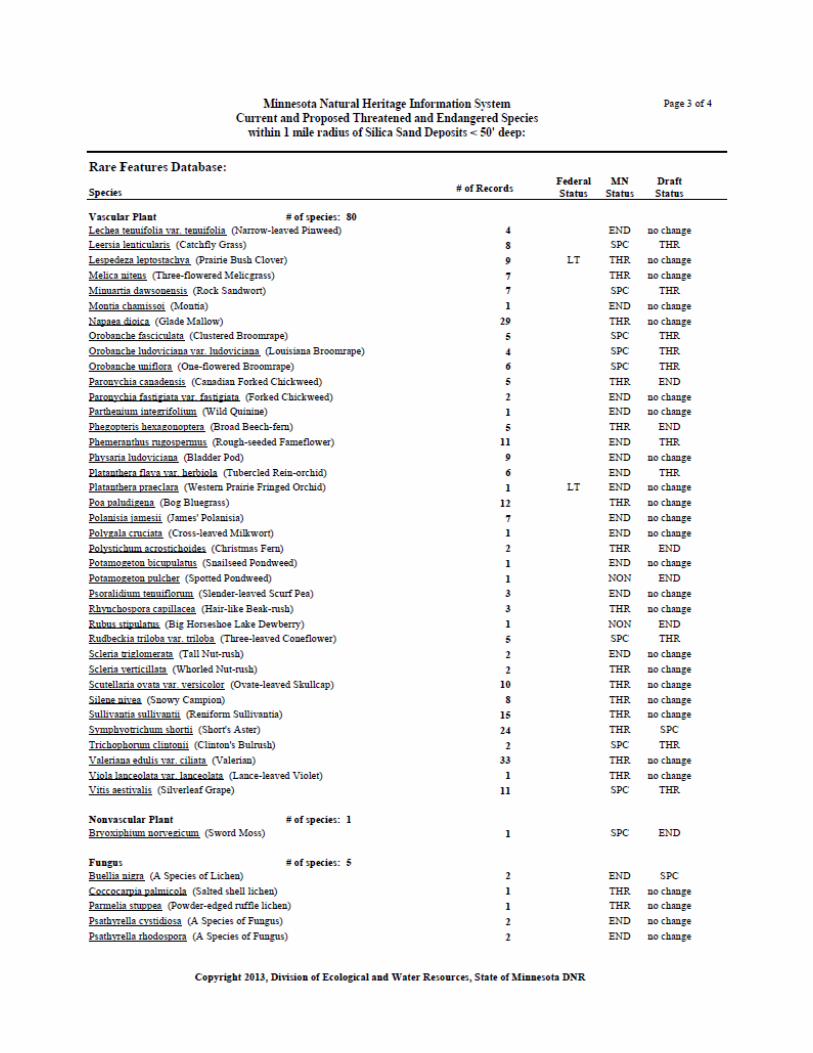
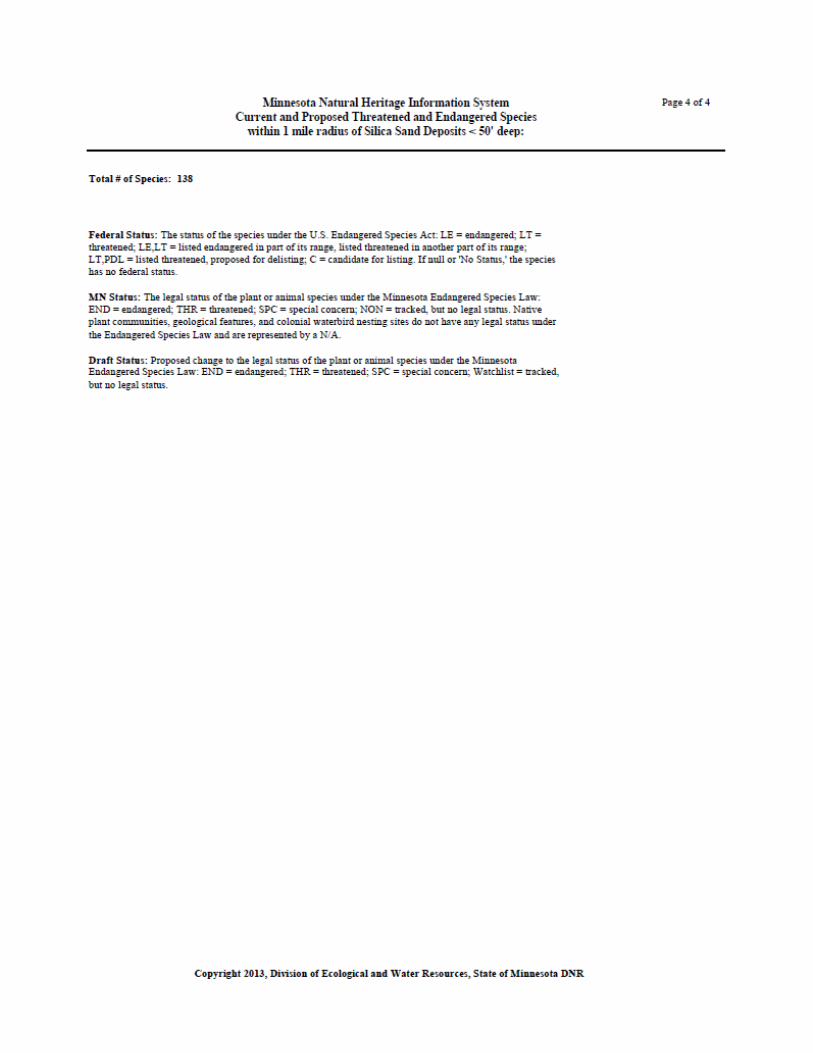
C. Minnesota Natural Heritage Information System Current and Proposed
Threatened and Endangered Species Within 1 Mile Radius of Silica Sand
Deposits < 50' Deep
March 20, 2012 Page 1
I. INTRODUCTION
A. Purpose of This Report
The technologies of horizontal drilling in conjunction with hydraulic fracturing have greatly
expanded the ability to profitably recover natural gas and oil from shale. Hydraulic fracturing,
also called fracking or hydrofracking, is a method used to access oil bearing shales and
limestones and extracting oil and natural gas. Fracking requires a proppant, which are particles
that hold open fractures in the shale that allow the oil or gas to be collected. Silica sand is used
as a proppant. Nationwide, frac sand production almost doubled from 2009 to 2010, to 12.1
million tons, according to the U.S. Geological Survey (USGS). However, this estimate is likely
low because submitting data to the USGS is voluntary. Industry estimates report nationwide
production numbers as high as 22 million tons (“US Silica: The First IPO in the ‘Fracking Sand”,
2012).
Although hydraulic fracturing for the extraction of oil and natural gas is not occurring in
Minnesota, the silica sand resources used in hydraulic fracturing are located in Minnesota. Large
silica sand deposits are located in south central and southeast Minnesota and western Wisconsin.
The demand for sand for hydraulic fracturing has resulted in many new mining and processing
plant proposals being submitted to local and state government agencies. The potential economic
impacts on the local and state economies have generated great interest. Potential impacts to the
landscape, natural resources, and health of residents in the areas of these proposed facilities have
generated great concern.
In 2012 the Environmental Quality Board (EQB) received a petition supporting the preparation
of a Generic Environmental Impact Statement (GEIS) to analyze the potential environmental
effects of the industry. Such a study would require significant time and financial resources.
While the preparation of a GEIS remains an option, the EQB has prepared this report to provide
background information on the topic of silica sand.
This report provides a summary of information relevant to the questions at hand. It does not
pretend to be encyclopedic. The report does not advocate a particular perspective on the silica
sand issues: it is not pro- or anti-silica sand mining. The intent is to provide a basis for further
research, whether that occurs through a GEIS or by other means. It is recognized that the
information presented here can and should be augmented and improved as more is learned.
March 20, 2012 Page 2
II. BACKGROUND ON SILICA SAND
A. What is Silica Sand?
Silica or silicon dioxide (SiO2), also called quartz, is one of the most common minerals found on
the earth’s surface. Silica is major component of many different kinds of rocks (like granites and
gneiss) and comes in many different varieties.
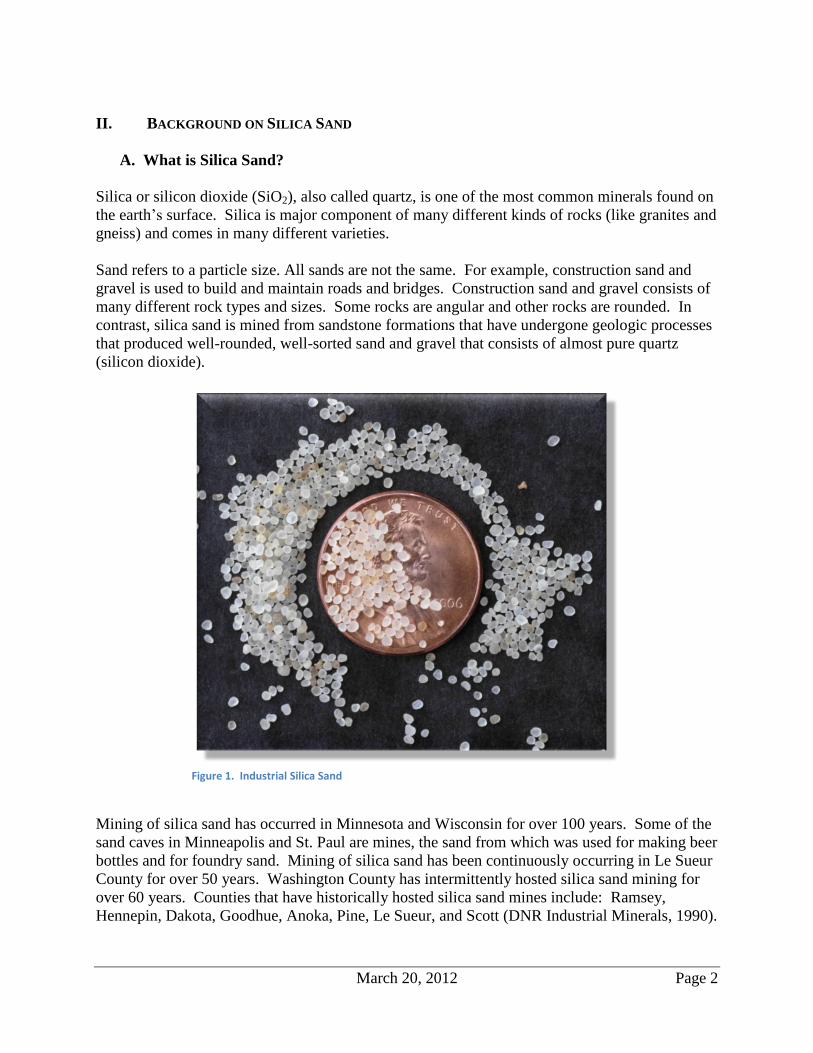
Sand refers to a particle size. All sands are not the same. For example, construction sand and
gravel is used to build and maintain roads and bridges. Construction sand and gravel consists of
many different rock types and sizes. Some rocks are angular and other rocks are rounded. In
contrast, silica sand is mined from sandstone formations that have undergone geologic processes
that produced well-rounded, well-sorted sand and gravel that consists of almost pure quartz
(silicon dioxide).
Figure 1. Industrial Silica Sand
Mining of silica sand has occurred in Minnesota and Wisconsin for over 100 years. Some of the
sand caves in Minneapolis and St. Paul are mines, the sand from which was used for making beer
bottles and for foundry sand. Mining of silica sand has been continuously occurring in Le Sueur
County for over 50 years. Washington County has intermittently hosted silica sand mining for
over 60 years. Counties that have historically hosted silica sand mines include: Ramsey,
Hennepin, Dakota, Goodhue, Anoka, Pine, Le Sueur, and Scott (DNR Industrial Minerals, 1990).
March 20, 2012 Page 3
Silica sand is widely used in many applications. In 2010, about 41% of the U.S. tonnage was
used as hydraulic fracturing sand and well-packing and cementing sand, 26% as glassmaking
sand, 11% as foundry sand; 6% as other whole-grain silica; 6% as whole-grain fillers and
building products; 3% as ground and unground sand for chemicals; 2% as golf course sand; 2%
for abrasive sand for sandblasting; and 3% for other uses (U.S. Geological Survey, 2012).
B. What is ‘Fracking’ and Why is Sand Needed?
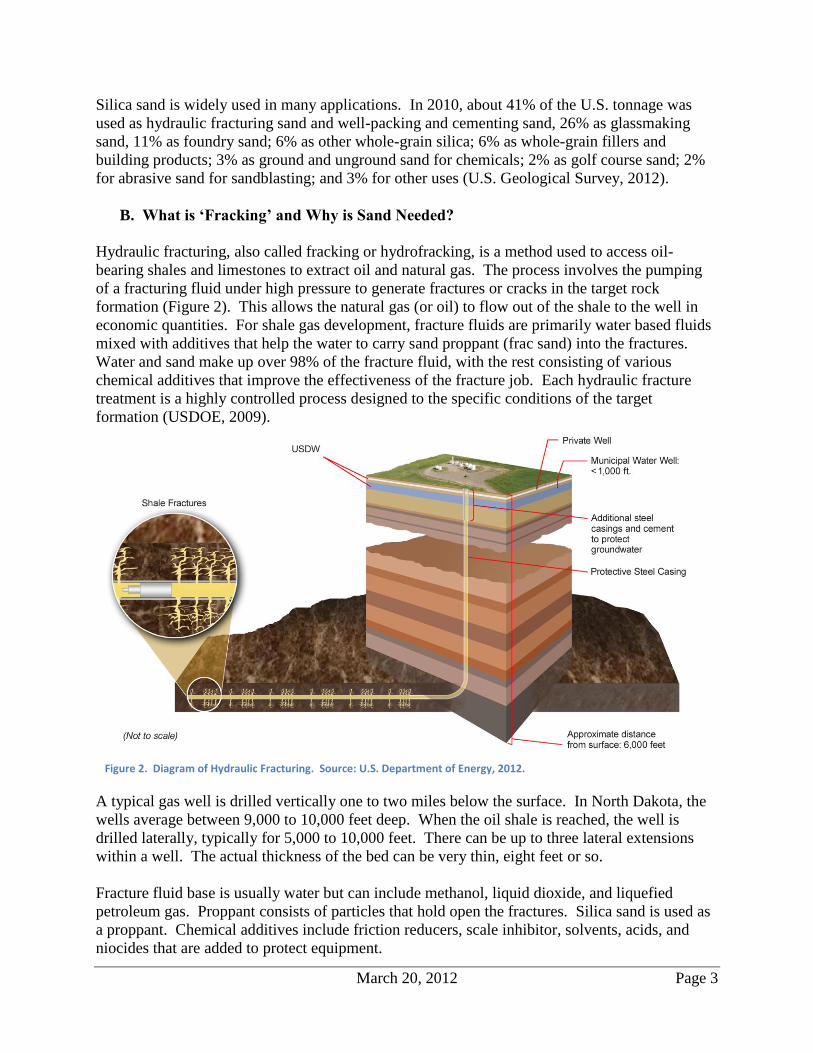
Hydraulic fracturing, also called fracking or hydrofracking, is a method used to access oil-
bearing shales and limestones to extract oil and natural gas. The process involves the pumping
of a fracturing fluid under high pressure to generate fractures or cracks in the target rock
formation (Figure 2). This allows the natural gas (or oil) to flow out of the shale to the well in
economic quantities. For shale gas development, fracture fluids are primarily water based fluids
mixed with additives that help the water to carry sand proppant (frac sand) into the fractures.
Water and sand make up over 98% of the fracture fluid, with the rest consisting of various
chemical additives that improve the effectiveness of the fracture job. Each hydraulic fracture
treatment is a highly controlled process designed to the specific conditions of the target
formation (USDOE, 2009).
A typical gas well is drilled vertically one to two miles below the surface. In North Dakota, the
wells average between 9,000 to 10,000 feet deep. When the oil shale is reached, the well is
drilled laterally, typically for 5,000 to 10,000 feet. There can be up to three lateral extensions
within a well. The actual thickness of the bed can be very thin, eight feet or so.
Fracture fluid base is usually water but can include methanol, liquid dioxide, and liquefied
petroleum gas. Proppant consists of particles that hold open the fractures. Silica sand is used as
a proppant. Chemical additives include friction reducers, scale inhibitor, solvents, acids, and
niocides that are added to protect equipment.
Figure 2. Diagram of Hydraulic Fracturing. Source: U.S. Department of Energy, 2012.
March 20, 2012 Page 4
The propped fracture is only a fraction of an inch wide and held open by the frac sand. A well
uses thousand of tons of sand, depending on how many stages of pumping and fracking occurs.
There has been some misunderstanding about mining that occurs in Minnesota. There are no oil
or gas fracking mines in Minnesota. It is the silica sand (aka frac sand) that is being mined in
Minnesota. This sand is transported elsewhere in the county to oil fields as well as foundries and
glass manufacturers.
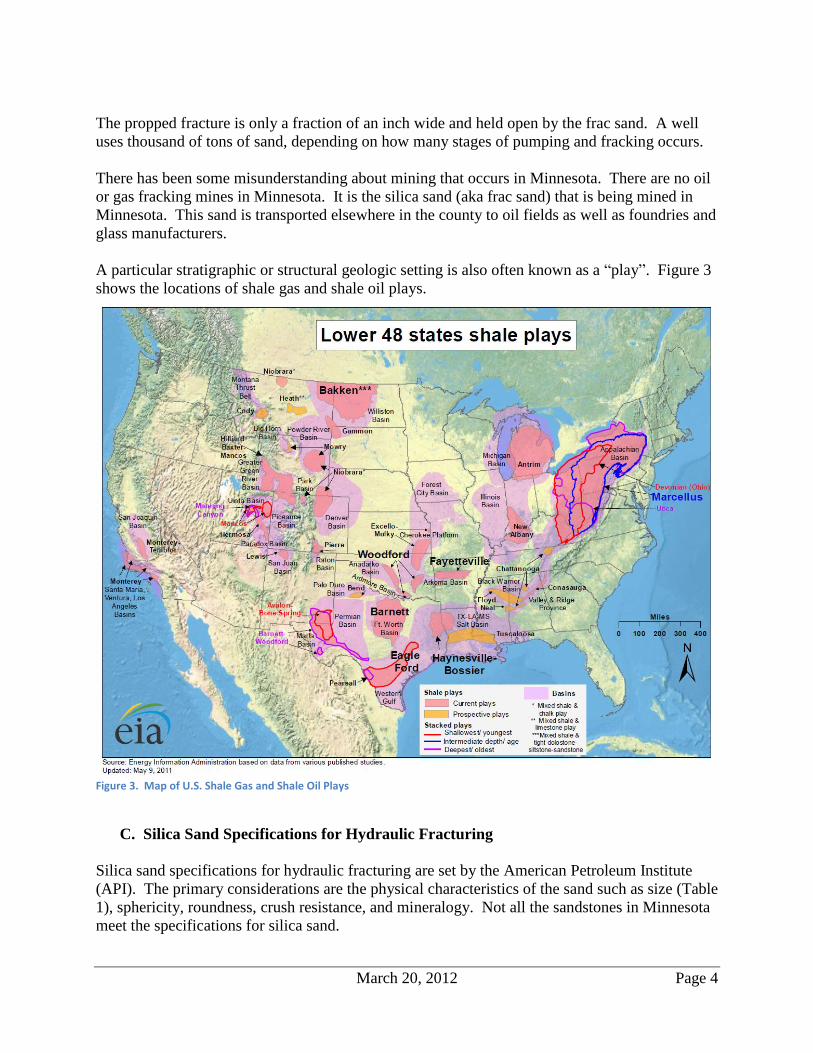
A particular stratigraphic or structural geologic setting is also often known as a “play”. Figure 3
shows the locations of shale gas and shale oil plays.
Figure 3. Map of U.S. Shale Gas and Shale Oil Plays
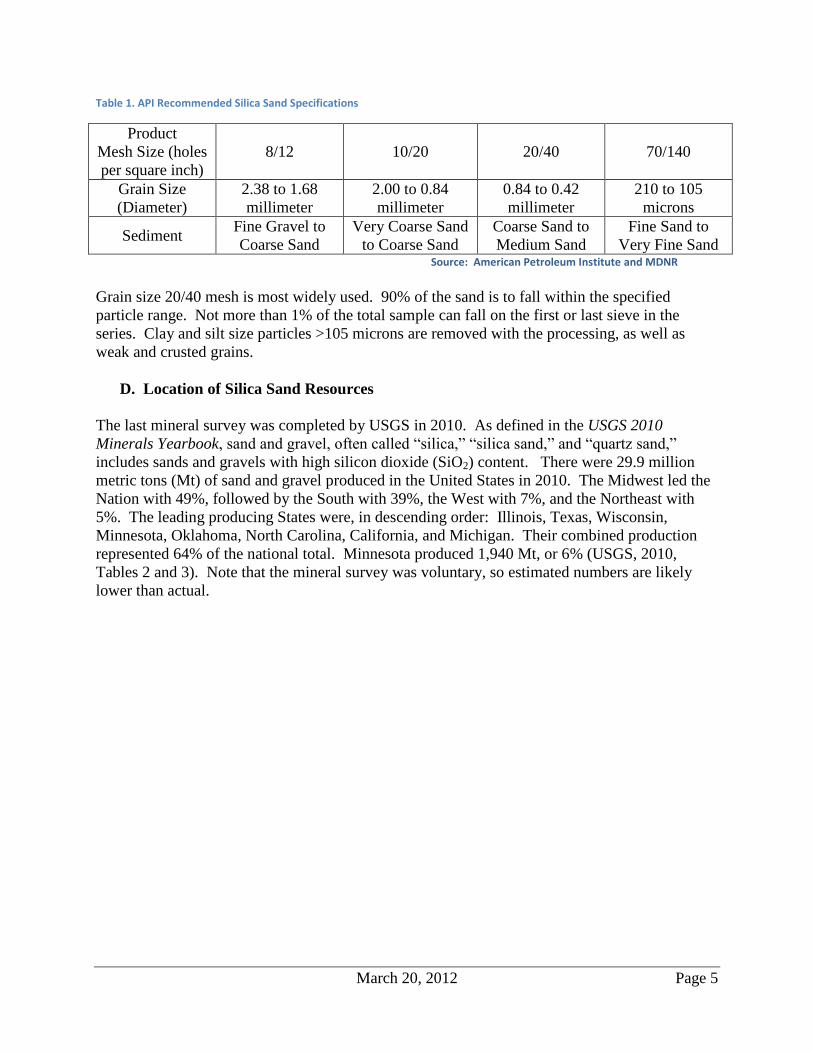
C. Silica Sand Specifications for Hydraulic Fracturing
Silica sand specifications for hydraulic fracturing are set by the American Petroleum Institute
(API). The primary considerations are the physical characteristics of the sand such as size (Table
1), sphericity, roundness, crush resistance, and mineralogy. Not all the sandstones in Minnesota
meet the specifications for silica sand.
March 20, 2012 Page 5
Table 1. API Recommended Silica Sand Specifications
Product
Mesh Size (holes
per square inch)
8/12
10/20
20/40
70/140
Grain Size
(Diameter)
2.38 to 1.68
millimeter
2.00 to 0.84
millimeter
0.84 to 0.42
millimeter
210 to 105
microns
Sediment Fine Gravel to
Coarse Sand
Very Coarse Sand
to Coarse Sand
Coarse Sand to
Medium Sand
Fine Sand to
Very Fine Sand Source: American Petroleum Institute and MDNR
Grain size 20/40 mesh is most widely used. 90% of the sand is to fall within the specified
particle range. Not more than 1% of the total sample can fall on the first or last sieve in the
series. Clay and silt size particles >105 microns are removed with the processing, as well as
weak and crusted grains.
D. Location of Silica Sand Resources
The last mineral survey was completed by USGS in 2010. As defined in the USGS 2010
Minerals Yearbook, sand and gravel, often called “silica,” “silica sand,” and “quartz sand,”
includes sands and gravels with high silicon dioxide (SiO2) content. There were 29.9 million
metric tons (Mt) of sand and gravel produced in the United States in 2010. The Midwest led the
Nation with 49%, followed by the South with 39%, the West with 7%, and the Northeast with
5%. The leading producing States were, in descending order: Illinois, Texas, Wisconsin,
Minnesota, Oklahoma, North Carolina, California, and Michigan. Their combined production
represented 64% of the national total. Minnesota produced 1,940 Mt, or 6% (USGS, 2010,
Tables 2 and 3). Note that the mineral survey was voluntary, so estimated numbers are likely
lower than actual.
March 20, 2012 Page 6
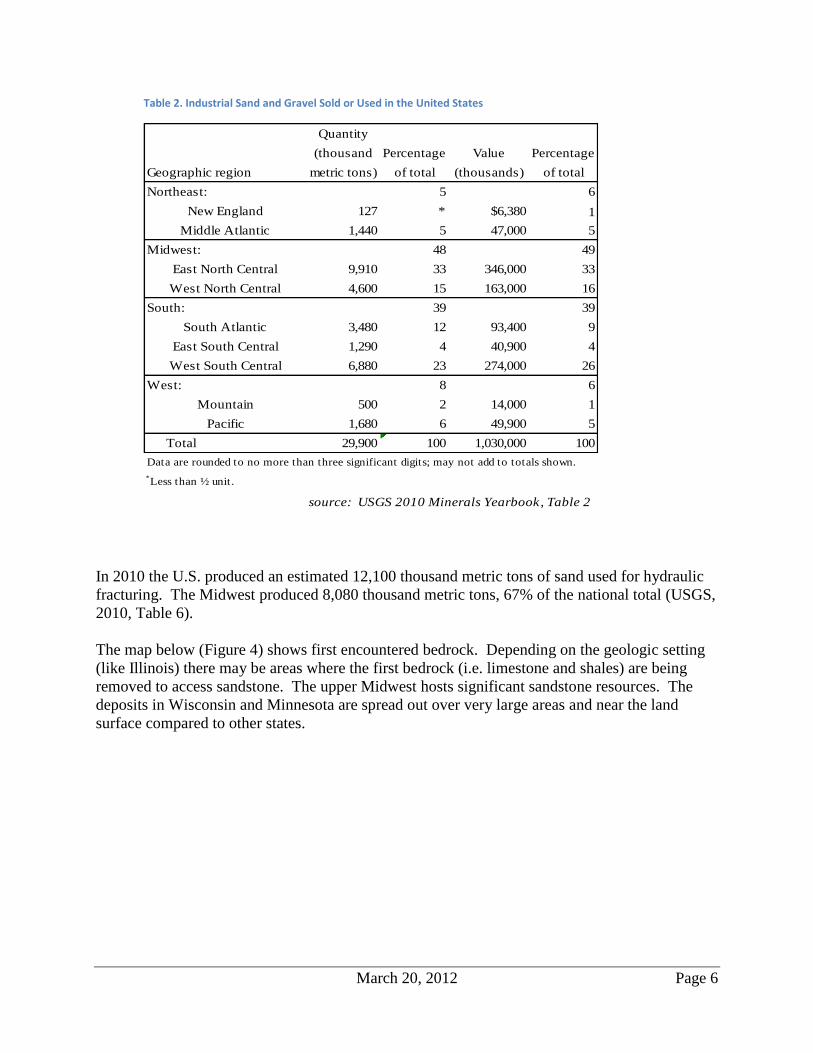
Table 2. Industrial Sand and Gravel Sold or Used in the United States
Quantity
(thousand Percentage Value Percentage
Geographic region metric tons) of total (thousands) of total
Northeast: 5 6
New England 127 * $6,380 1
Middle Atlantic 1,440 5 47,000 5
Midwest: 48 49
East North Central 9,910 33 346,000 33
West North Central 4,600 15 163,000 16
South: 39 39
South Atlantic 3,480 12 93,400 9
East South Central 1,290 4 40,900 4
West South Central 6,880 23 274,000 26
West: 8 6
Mountain 500 2 14,000 1
Pacific 1,680 6 49,900 5
Total 29,900 100 1,030,000 100
source: USGS 2010 Minerals Yearbook, Table 2
Data are rounded to no more than three significant digits; may not add to totals shown.
*Less than ½ unit.
In 2010 the U.S. produced an estimated 12,100 thousand metric tons of sand used for hydraulic
fracturing. The Midwest produced 8,080 thousand metric tons, 67% of the national total (USGS,
2010, Table 6).
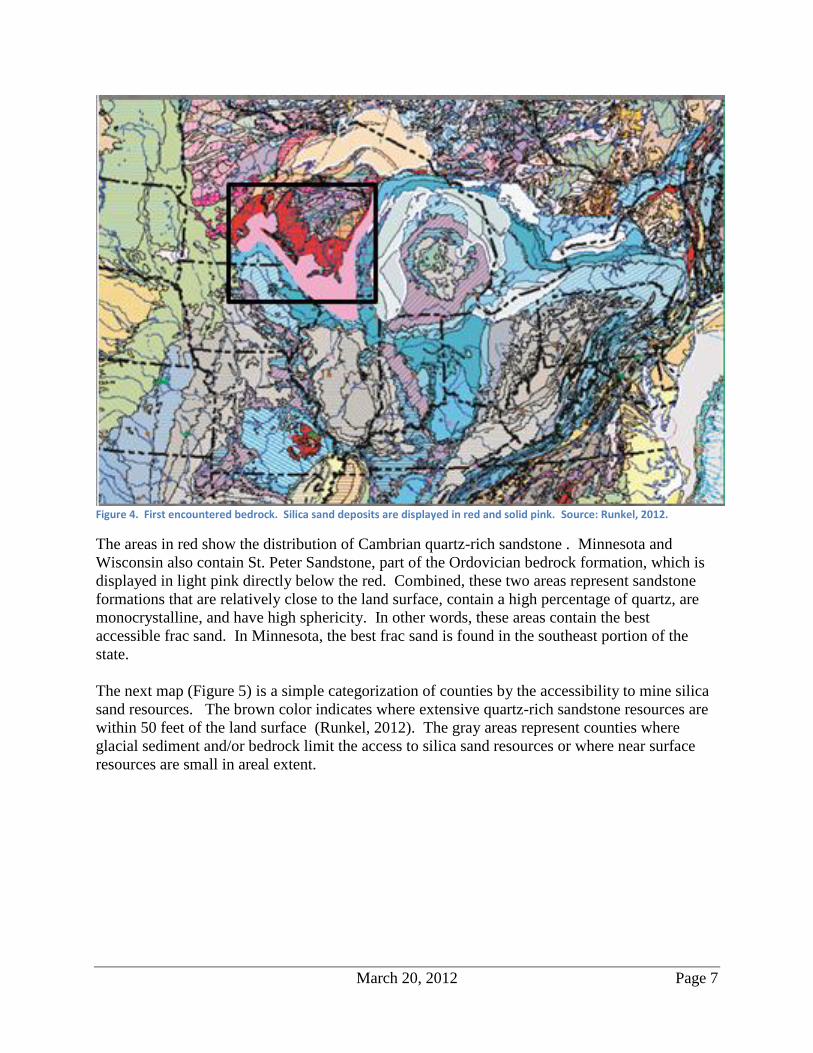
The map below (Figure 4) shows first encountered bedrock. Depending on the geologic setting
(like Illinois) there may be areas where the first bedrock (i.e. limestone and shales) are being
removed to access sandstone. The upper Midwest hosts significant sandstone resources. The
deposits in Wisconsin and Minnesota are spread out over very large areas and near the land
surface compared to other states.
March 20, 2012 Page 7
Figure 4. First encountered bedrock. Silica sand deposits are displayed in red and solid pink. Source: Runkel, 2012.
The areas in red show the distribution of Cambrian quartz-rich sandstone . Minnesota and
Wisconsin also contain St. Peter Sandstone, part of the Ordovician bedrock formation, which is
displayed in light pink directly below the red. Combined, these two areas represent sandstone
formations that are relatively close to the land surface, contain a high percentage of quartz, are
monocrystalline, and have high sphericity. In other words, these areas contain the best
accessible frac sand. In Minnesota, the best frac sand is found in the southeast portion of the
state.
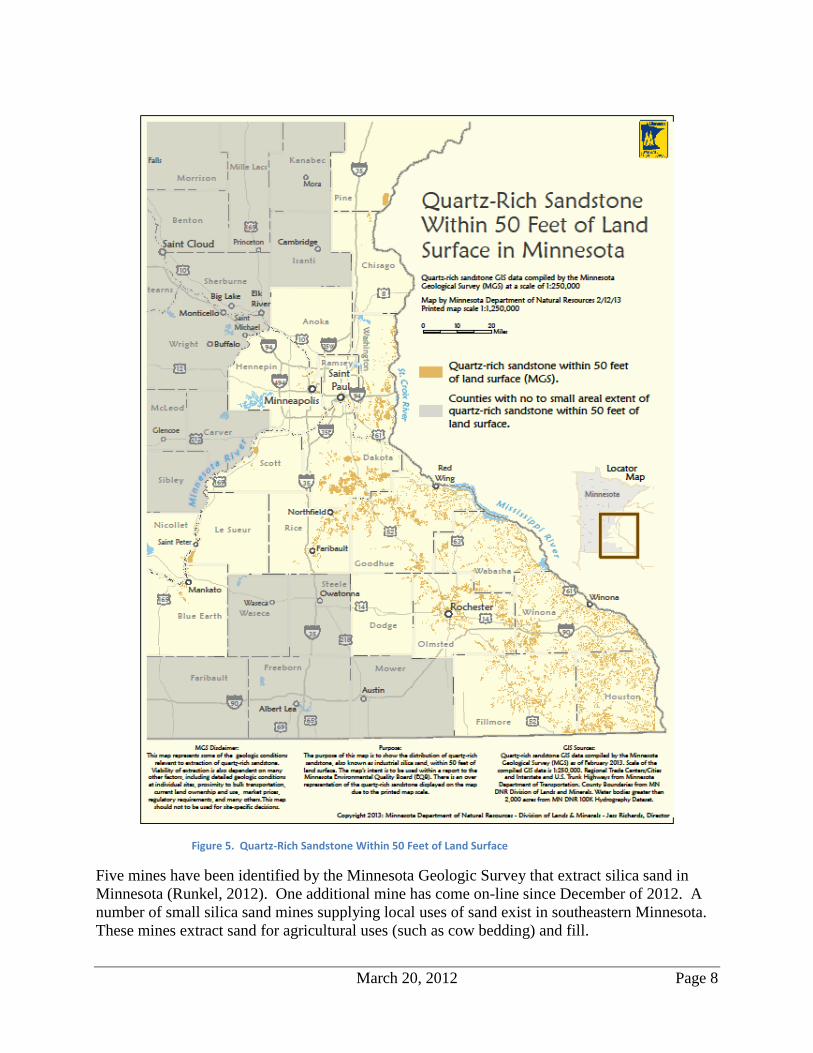
The next map (Figure 5) is a simple categorization of counties by the accessibility to mine silica
sand resources. The brown color indicates where extensive quartz-rich sandstone resources are
within 50 feet of the land surface (Runkel, 2012). The gray areas represent counties where
glacial sediment and/or bedrock limit the access to silica sand resources or where near surface
resources are small in areal extent.
March 20, 2012 Page 8
Figure 5. Quartz-Rich Sandstone Within 50 Feet of Land Surface
Five mines have been identified by the Minnesota Geologic Survey that extract silica sand in
Minnesota (Runkel, 2012). One additional mine has come on-line since December of 2012. A
number of small silica sand mines supplying local uses of sand exist in southeastern Minnesota.
These mines extract sand for agricultural uses (such as cow bedding) and fill.
March 20, 2012 Page 9
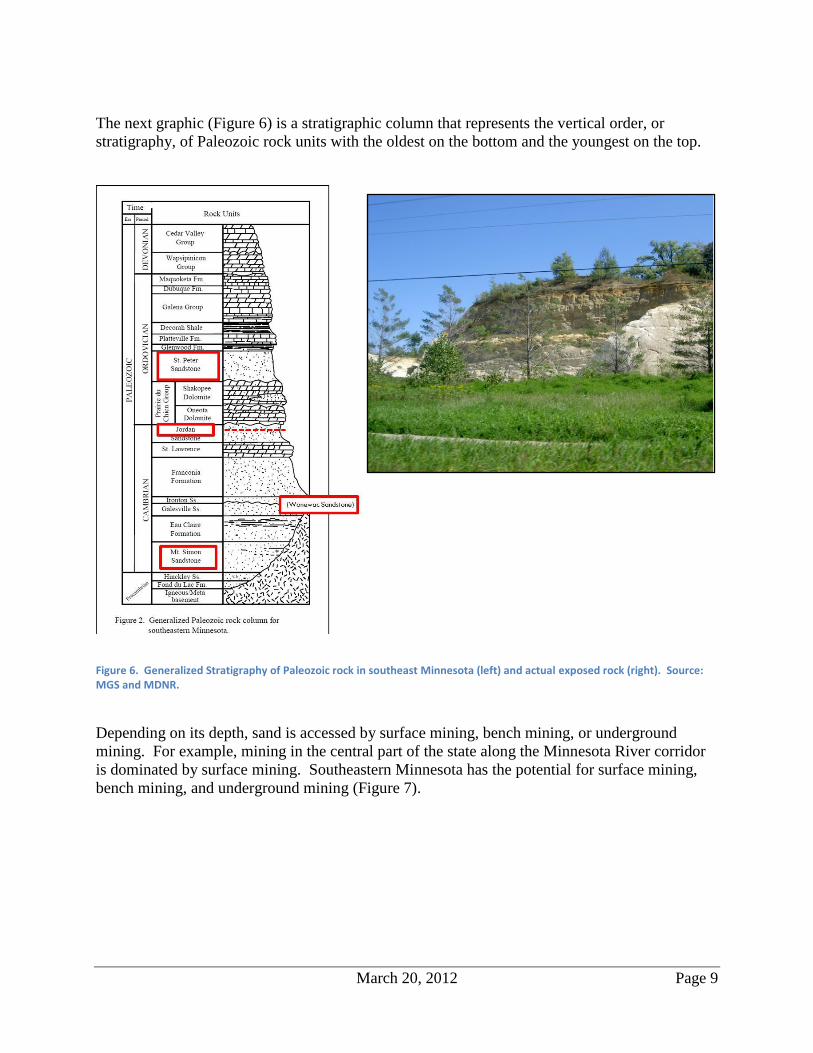
The next graphic (Figure 6) is a stratigraphic column that represents the vertical order, or
stratigraphy, of Paleozoic rock units with the oldest on the bottom and the youngest on the top.
Figure 6. Generalized Stratigraphy of Paleozoic rock in southeast Minnesota (left) and actual exposed rock (right). Source: MGS and MDNR.
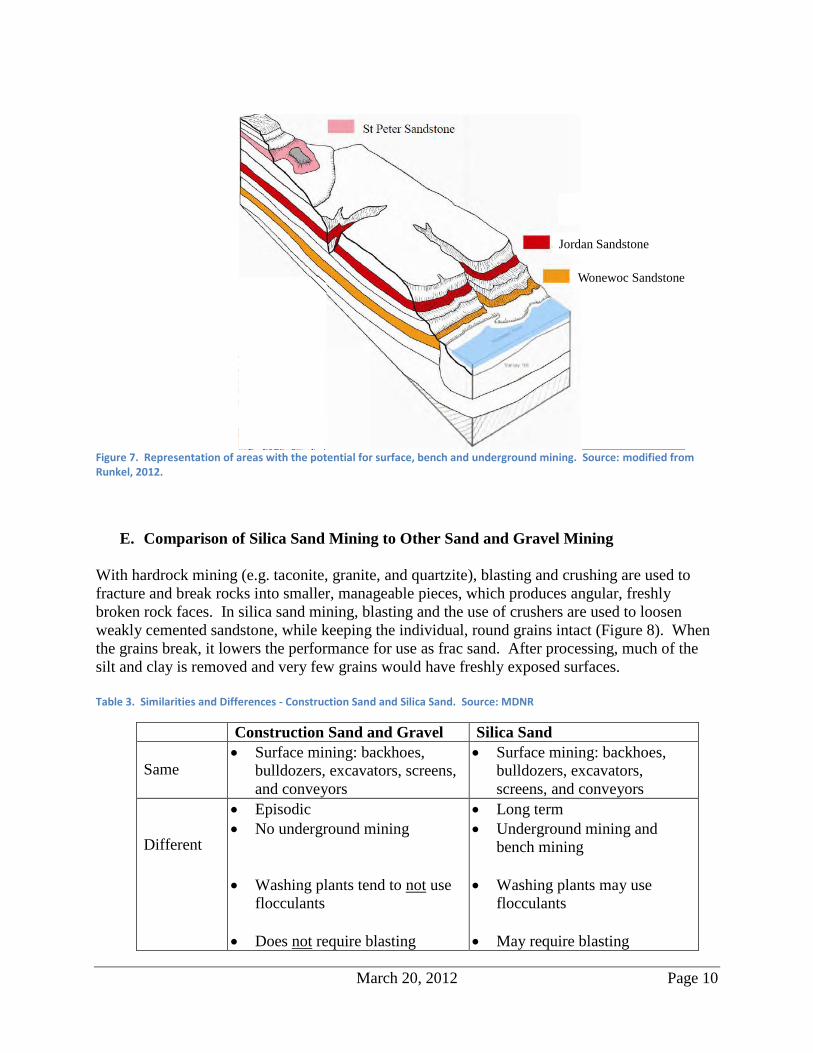
Depending on its depth, sand is accessed by surface mining, bench mining, or underground
mining. For example, mining in the central part of the state along the Minnesota River corridor
is dominated by surface mining. Southeastern Minnesota has the potential for surface mining,
bench mining, and underground mining (Figure 7).
March 20, 2012 Page 10
Figure 7. Representation of areas with the potential for surface, bench and underground mining. Source: modified from Runkel, 2012.
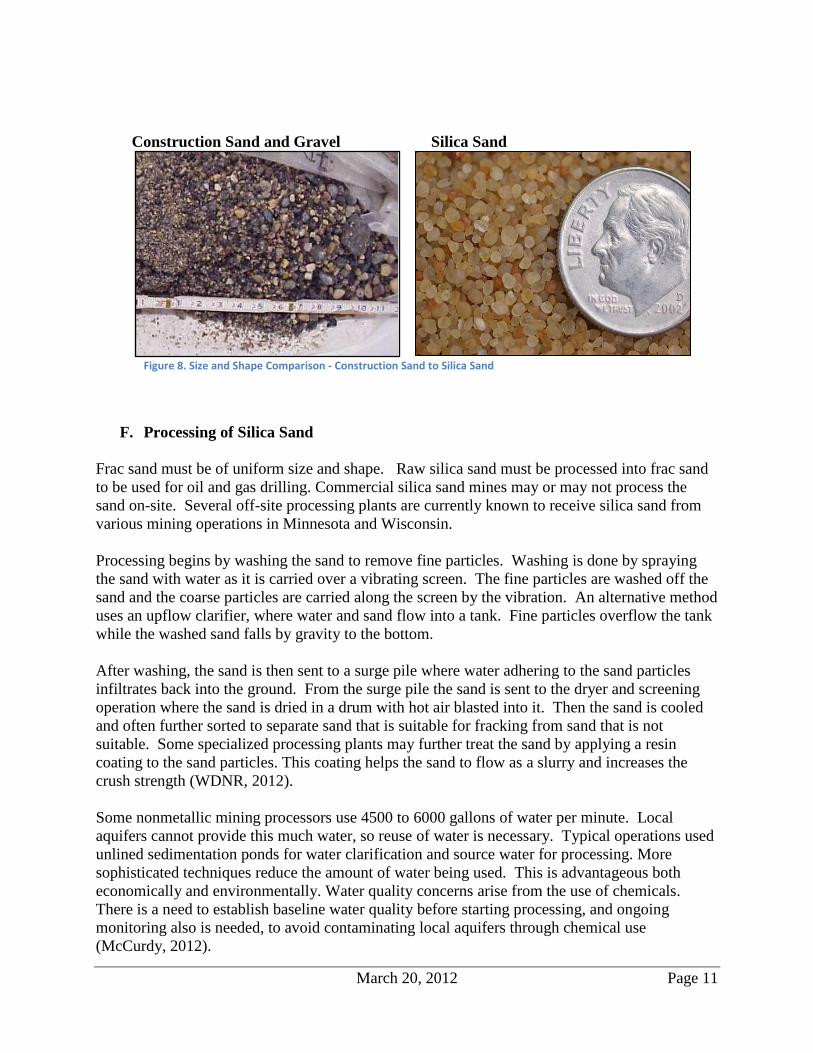
E. Comparison of Silica Sand Mining to Other Sand and Gravel Mining
With hardrock mining (e.g. taconite, granite, and quartzite), blasting and crushing are used to
fracture and break rocks into smaller, manageable pieces, which produces angular, freshly
broken rock faces. In silica sand mining, blasting and the use of crushers are used to loosen
weakly cemented sandstone, while keeping the individual, round grains intact (Figure 8). When
the grains break, it lowers the performance for use as frac sand. After processing, much of the
silt and clay is removed and very few grains would have freshly exposed surfaces.
Table 3. Similarities and Differences - Construction Sand and Silica Sand. Source: MDNR
Construction Sand and Gravel Silica Sand
Same Surface mining: backhoes,
bulldozers, excavators, screens,
and conveyors
Surface mining: backhoes,
bulldozers, excavators,
screens, and conveyors
Different
Episodic
No underground mining
Washing plants tend to not use
flocculants
Does not require blasting
Long term
Underground mining and
bench mining
Washing plants may use
flocculants
May require blasting
Wonewoc Sandstone
Jordan Sandstone
March 20, 2012 Page 11
Construction Sand and Gravel Silica Sand
Figure 8. Size and Shape Comparison - Construction Sand to Silica Sand
F. Processing of Silica Sand
Frac sand must be of uniform size and shape. Raw silica sand must be processed into frac sand
to be used for oil and gas drilling. Commercial silica sand mines may or may not process the
sand on-site. Several off-site processing plants are currently known to receive silica sand from
various mining operations in Minnesota and Wisconsin.
Processing begins by washing the sand to remove fine particles. Washing is done by spraying
the sand with water as it is carried over a vibrating screen. The fine particles are washed off the
sand and the coarse particles are carried along the screen by the vibration. An alternative method
uses an upflow clarifier, where water and sand flow into a tank. Fine particles overflow the tank
while the washed sand falls by gravity to the bottom.
After washing, the sand is then sent to a surge pile where water adhering to the sand particles
infiltrates back into the ground. From the surge pile the sand is sent to the dryer and screening
operation where the sand is dried in a drum with hot air blasted into it. Then the sand is cooled
and often further sorted to separate sand that is suitable for fracking from sand that is not
suitable. Some specialized processing plants may further treat the sand by applying a resin
coating to the sand particles. This coating helps the sand to flow as a slurry and increases the
crush strength (WDNR, 2012).
Some nonmetallic mining processors use 4500 to 6000 gallons of water per minute. Local
aquifers cannot provide this much water, so reuse of water is necessary. Typical operations used
unlined sedimentation ponds for water clarification and source water for processing. More
sophisticated techniques reduce the amount of water being used. This is advantageous both
economically and environmentally. Water quality concerns arise from the use of chemicals.
There is a need to establish baseline water quality before starting processing, and ongoing
monitoring also is needed, to avoid contaminating local aquifers through chemical use
(McCurdy, 2012).
March 20, 2012 Page 12
While sand that is not suitable for fracking has other industrial uses, it may be difficult to sell it
due to the remote locations of many processing plants (Kelley, 2012).
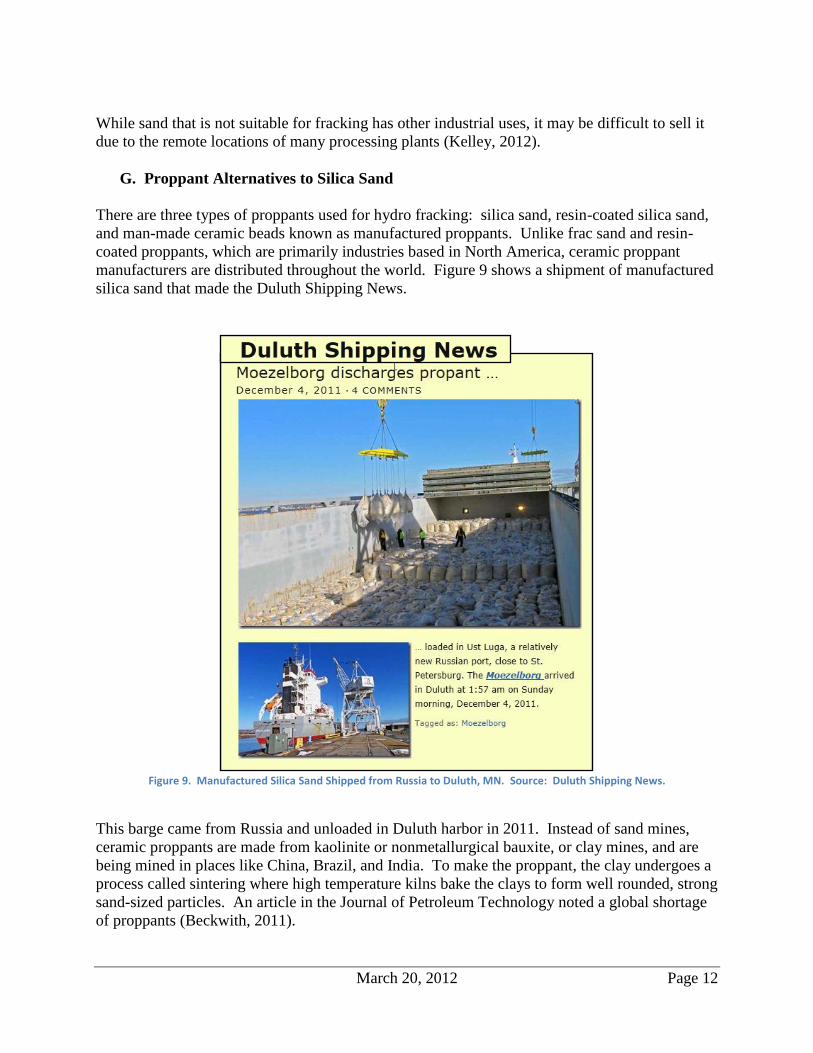
G. Proppant Alternatives to Silica Sand
There are three types of proppants used for hydro fracking: silica sand, resin-coated silica sand,
and man-made ceramic beads known as manufactured proppants. Unlike frac sand and resin-
coated proppants, which are primarily industries based in North America, ceramic proppant
manufacturers are distributed throughout the world. Figure 9 shows a shipment of manufactured
silica sand that made the Duluth Shipping News.
Figure 9. Manufactured Silica Sand Shipped from Russia to Duluth, MN. Source: Duluth Shipping News.
This barge came from Russia and unloaded in Duluth harbor in 2011. Instead of sand mines,
ceramic proppants are made from kaolinite or nonmetallurgical bauxite, or clay mines, and are
being mined in places like China, Brazil, and India. To make the proppant, the clay undergoes a
process called sintering where high temperature kilns bake the clays to form well rounded, strong
sand-sized particles. An article in the Journal of Petroleum Technology noted a global shortage
of proppants (Beckwith, 2011).
March 20, 2012 Page 13
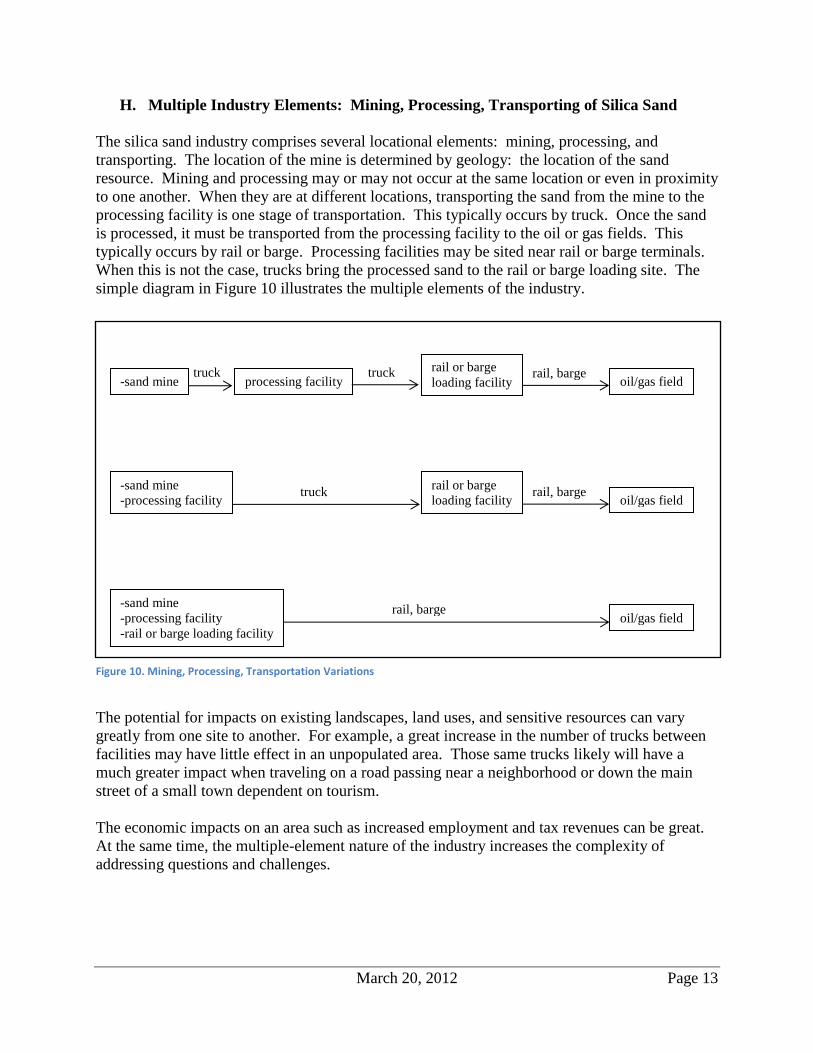
H. Multiple Industry Elements: Mining, Processing, Transporting of Silica Sand
The silica sand industry comprises several locational elements: mining, processing, and
transporting. The location of the mine is determined by geology: the location of the sand
resource. Mining and processing may or may not occur at the same location or even in proximity
to one another. When they are at different locations, transporting the sand from the mine to the
processing facility is one stage of transportation. This typically occurs by truck. Once the sand
is processed, it must be transported from the processing facility to the oil or gas fields. This
typically occurs by rail or barge. Processing facilities may be sited near rail or barge terminals.
When this is not the case, trucks bring the processed sand to the rail or barge loading site. The
simple diagram in Figure 10 illustrates the multiple elements of the industry.
The economic impacts on an area such as increased employment and tax revenues can be great.
The potential for impacts on existing landscapes, land uses, and sensitive resources can vary
greatly from one site to another. For example, a great increase in the number of trucks between
facilities may have little effect in an unpopulated area. Those same trucks likely will have a
much greater impact when traveling on a road passing near a neighborhood or down the main
street of a small town dependent on tourism.
The economic impacts on an area such as increased employment and tax revenues can be great.
At the same time, the multiple-element nature of the industry increases the complexity of
addressing questions and challenges.
-sand mine
-processing facility
-rail or barge loading facility
-sand mine
-sand mine
-processing facility
processing facility rail or barge
loading facility truck truck
oil/gas field rail, barge
rail or barge
loading facility truck
oil/gas field rail, barge
oil/gas field rail, barge
Figure 10. Mining, Processing, Transportation Variations
March 20, 2012 Page 14
III. FRACKING AND SAND MARKET SUMMARIES, SOCIOECONOMICS
A. Fracking Overview
The following excerpt from a publication by a federal agency provides a useful history of
fracking and the shale gas and oil market. This is not intended to be a comprehensive description
of the oil and gas market. The following is excerpted from: “Review of Emerging Resources:
U.S. Shale Gas and Shale Oil Plays.” July 2011, U.S. Energy Information Administration.
“The use of horizontal drilling in conjunction with hydraulic fracturing has greatly
expanded the ability of producers to profitably recover natural gas and oil from low-
permeability geologic plays—particularly, shale plays. Application of fracturing techniques
to stimulate oil and gas production began to grow rapidly in the 1950s, although
experimentation dates back to the 19th century. Starting in the mid-1970s, a partnership of
private operators, the U.S. Department of Energy (DOE) and predecessor agencies, and the
Gas Research Institute (GRI) endeavored to develop technologies for the commercial
production of natural gas from the relatively shallow Devonian (Huron) shale in the eastern
United States. This partnership helped foster technologies that eventually became crucial to
the production of natural gas from shale rock, including horizontal wells, multi-stage
fracturing, and slick-water fracturing. Practical application of horizontal drilling to oil
production began in the early 1980s, by which time the advent of improved downhole
drilling motors and the invention of other necessary supporting equipment, materials, and
technologies (particularly, downhole telemetry equipment) had brought some applications
within the realm of commercial viability.
“The advent of large-scale shale gas production did not occur until a private firm
experimented during the 1980s and 1990s to make deep shale gas production a commercial
reality in the Barnett Shale in North-Central Texas. As the success of this became apparent,
other companies aggressively entered the play, so that by 2005, the Barnett Shale alone was
producing nearly 0.5 trillion cubic feet of natural gas per year. As producers gained
confidence in the ability to produce natural gas profitably in the Barnett Shale, with
confirmation provided by results from the Fayetteville Shale in Arkansas, they began
pursuing other shale plays, including Haynesville, Marcellus, Woodford, Eagle Ford, and
others.
“Although the U.S. Energy Information Administration’s (EIA) National Energy
Modeling System (NEMS) and energy projections began representing shale gas resource
development and production in the mid-1990s, only in the past 5 years has shale gas been
recognized as a “game changer” for the U.S. natural gas market. The proliferation of activity
into new shale plays has increased dry shale gas production in the United States from 1.0
trillion cubic feet in 2006 to 4.8 trillion cubic feet, or 23 percent of total U.S. dry natural gas
production, in 2010. Wet shale gas reserves increased to about 60.64 trillion cubic feet by
year-end 2009, when they comprised about 21 percent of overall U.S. natural gas reserves,
now at the highest level since 1971. Oil production from shale plays, notably the Bakken
Shale in North Dakota and Montana, has also grown rapidly in recent years.” (USEIA, 2011)
March 20, 2012 Page 15
B. Sand Market Overview
Section II includes a data table for sand production is different parts of the U.S. The following
excerpt from a different publication by another federal agency provides a useful background on
recent history of the silica sand market and concerns regarding the industry. The following list
of statement are excerpted are from “Sand Surge” in the Fedgazette, written by Phil Davies and
published by the Federal Reserve Bank of Minneapolis, July 16, 2012. This is not intended to be
a comprehensive description of the market or related issues. Rather, it highlights many of the
issues being recognized in Minnesota.
Nationwide, frac sand production almost doubled from 2009 to 2010, according to the
U.S. Geological Survey.
High-grade frac sand commands a premium in the marketplace. Large mining firms,
many of them based outside the region, have invested hundreds of millions of dollars
in mines and processing facilities.
Many new, large mines are situated on rail lines, the most economical shipping
method. (Rail patterns dictate that most frac sand mined in the region goes to shale oil
and gas fields in the eastern and southern United States, rather than to the Bakken.)
In Minnesota, the frac sand industry is less developed. That’s partly due to geology;
accessible deposits of high-grade sandstone are less extensive in Minnesota than in
Wisconsin. Another impediment to mine development in Minnesota is logistics—the
task of getting millions of tons of sand to distant markets.
In contrast to Wisconsin, southeastern Minnesota has little rail capacity to ship sand
to transportation hubs such as Winona and the Twin Cities. Hundreds of miles of
rural rail lines have been abandoned since the 1970s, leaving trucks as the only viable
means of moving sand overland. In addition, much rail and barge capacity in Winona
is already taken up by agricultural commodities.
Despite these limiting factors, several new mines have been developed or proposed
over the past couple of years.
Industry sources believe that frac sand mining in southeastern Minnesota will remain
small in scale until more rail and barge capacity is developed to ship sand to oil and
gas fields.
No official job numbers exist for sand mining in the district—the industry is too new.
But it’s evident that expanded mining has contributed to rising private employment
since the recession. On average, one frac sand mine employs between 10 and 20
people, while 40 to 50 people work at a typical processing plant, according to
industry sources. So over the past five years, new mines and processing plants—not
counting existing, expanded mines—have created roughly 500 jobs in the Ninth
Federal Reserve district portion of Wisconsin. At many mines, large numbers of
March 20, 2012 Page 16
trucks are needed to haul frac sand to processing plants and rail terminals, creating
job openings for truck drivers and crews.
Local governments and taxpayers in rural areas also benefit from increased economic
activity linked to mining. Lodging tax revenue could increase, and school district mill
rates may decrease as new processing plants begin paying property taxes.
Economic gains from frac sand mining don’t come without costs; mining activity can
damage infrastructure and the natural environment, and compromise public health
and safety. Many of these costs are borne by taxpayers, or by society at large in the
form of extra personal expense or forgone benefits.
Closer to home, sand for the petroleum industry has been mined in Wisconsin for four decades,
but the demand for frac sand increased exponentially from 2008-2011. In January of 2012, there
were about 60 mines producing an estimated 12 million tons per year (Wisconsin Dept. of
Natural Resources 2012).
C. Research on Impacts of Mining on Communities
Carol MacNenna, an environmental anthropologist at Michigan Technological University, has
studied mining communities for ten years. MacNenna cautions in an interview with Michigan
Tech News (January 2012 issue) “the worst type of communication has to do with the
simplification of the mining issues. I think the biggest problem is creation of polar opposites so
that one has to choose between employment or environmental and health protection.” She
continues by saying “characterizing it [mining] that way is very destructive because you’re never
forced to confront the complexity of the issue.”
A study by Deller and Schreiber at the University of Wisconsin-Madison reviewed academic
literature in an attempt to “provide some insights into the economics of sand mining with
particular attention to economic growth and development opportunities associated with the
mines.” Very little academic research exists that examines impacts of mining on local
communities. While there may be many consultant reports, it is difficult to draw generalities
from them because funding sources—whether mining companies or environmental advocacy
groups—may affect objectiveness. Internationally, much of the research on mining in
developing nations often conclude that the ownership structure, and lax environmental safety
standards, the local communities don’t retain economic benefits. This aligns with the concept of
the “resource curse”. Some studies conclude that strong economic growth from resource
extraction is the exception rather than the rule. However, these conclusions are not directly
transferrable to Wisconsin (Deller and Schreiber 2012). It seems logical that the conclusions
also should not automatically be applied to Minnesota.
Perhaps the best conclusion is that there is not enough known about the relatively recent
phenomenon of the demand for silica sand for fracking regarding the long term effects of sand
mining on local or regional communities.
March 20, 2012 Page 17
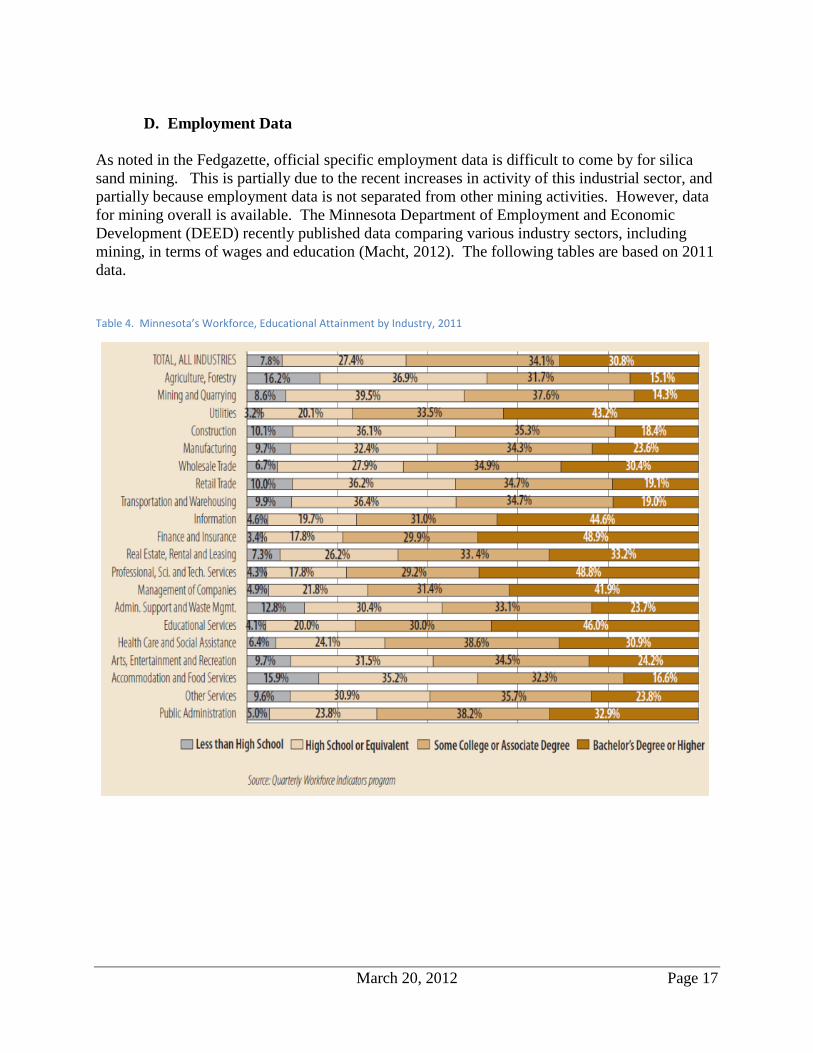
D. Employment Data
As noted in the Fedgazette, official specific employment data is difficult to come by for silica
sand mining. This is partially due to the recent increases in activity of this industrial sector, and
partially because employment data is not separated from other mining activities. However, data
for mining overall is available. The Minnesota Department of Employment and Economic
Development (DEED) recently published data comparing various industry sectors, including
mining, in terms of wages and education (Macht, 2012). The following tables are based on 2011
data.
Table 4. Minnesota’s Workforce, Educational Attainment by Industry, 2011
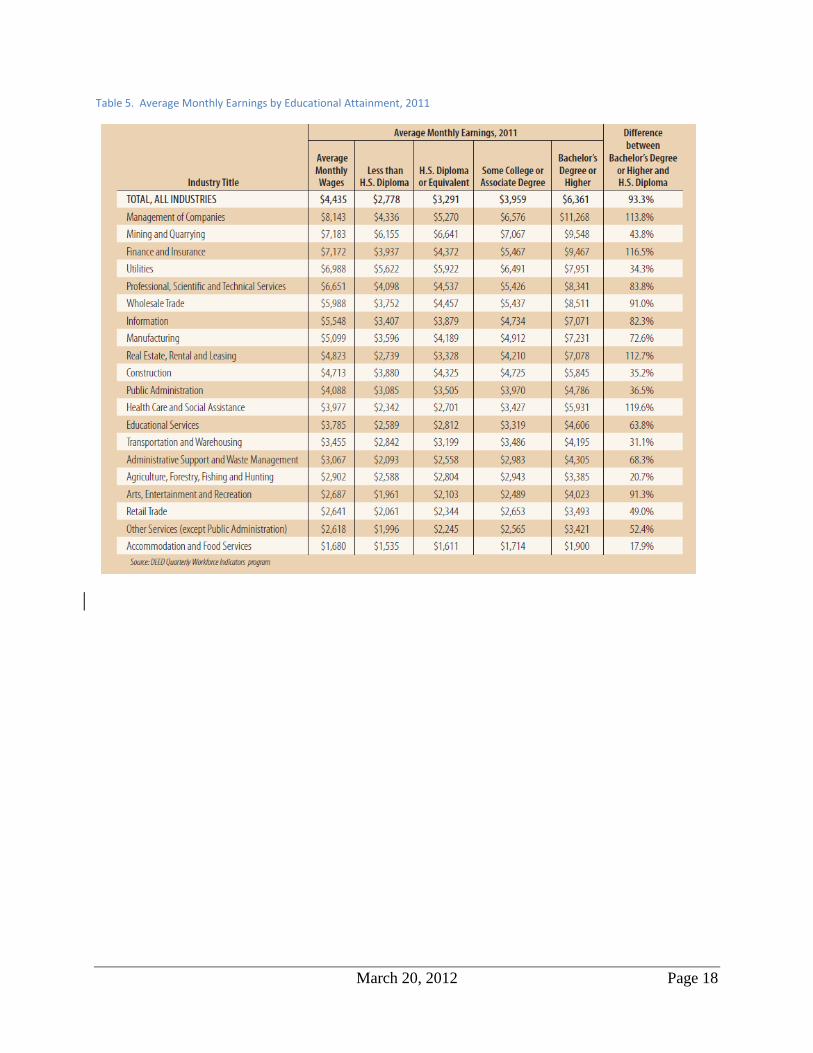
March 20, 2012 Page 18
Table 5. Average Monthly Earnings by Educational Attainment, 2011
March 20, 2012 Page 19
C. Potential Research Topics
Future market for silica sand for hydrofracking: Data from industry and
government sources could be assembled and compared to consider market projections
of demand. This likely will involve market projections for oil and gas. Such
projections could serve as the bases for analyzing potential impacts in a number of the
topic areas addressed elsewhere in this report.
Economical depth for mining: We know where the sand is, but the depth at which
mining is economical is changing. In the past, it was not economical to mine sand
beyond certain depths. With the surge in demand due to hydrofracking, this changed.
Further consideration of this may be useful.
Impacts on property values: It may be possible to assemble data for properties near
mines, processing sites, and transportation facilities to see what, if any, property value
changes have occurred and if the changes are correlated to those activities and
facilities. Such studies have been conducted on other types of land use to address
questions of the impacts on property values in the vicinity. However, the sand
facilities may be too recently created for any such analyses to be possible.
Potential effects on tourism: Determining potential effects on tourism would be
very useful. Determining what data and methodology would be needed in order to
conduct such a study is a challenging question in itself.
Tax revenues available: Minnesota Statute 298.75 establishes a tax on aggregate
mining, including silica sand. Property taxes apply as well. It may be useful to
assemble information to describe the potential revenues from these sources and
determine what other tax or fee revenue sources are available.
Employment: Reliable research is scant or nonexistent regarding short term and
long term employment created by silica sand mining.
March 20, 2012 Page 20
IV. AIR QUALITY
A. Health Impacts
1. Potential Health Impacts of Crystalline Silica
Silica exists in two forms: amorphous and crystalline. The toxicity of crystalline silica to
humans has been well characterized. In occupational settings where exposures tend to be higher
than ambient exposures, silica is capable of causing a number of diseases. The best known
disease is silicosis (silicotic nodules and fibrotic scarring of the lung), but exposure to crystalline
silica is associated with other health concerns. Silica exposure contributes to other diseases of
the lung including emphysema, chronic obstructive pulmonary disease, tuberculosis, and lung
cancer. Silica exposure has also been associated with several diseases of the immune system.
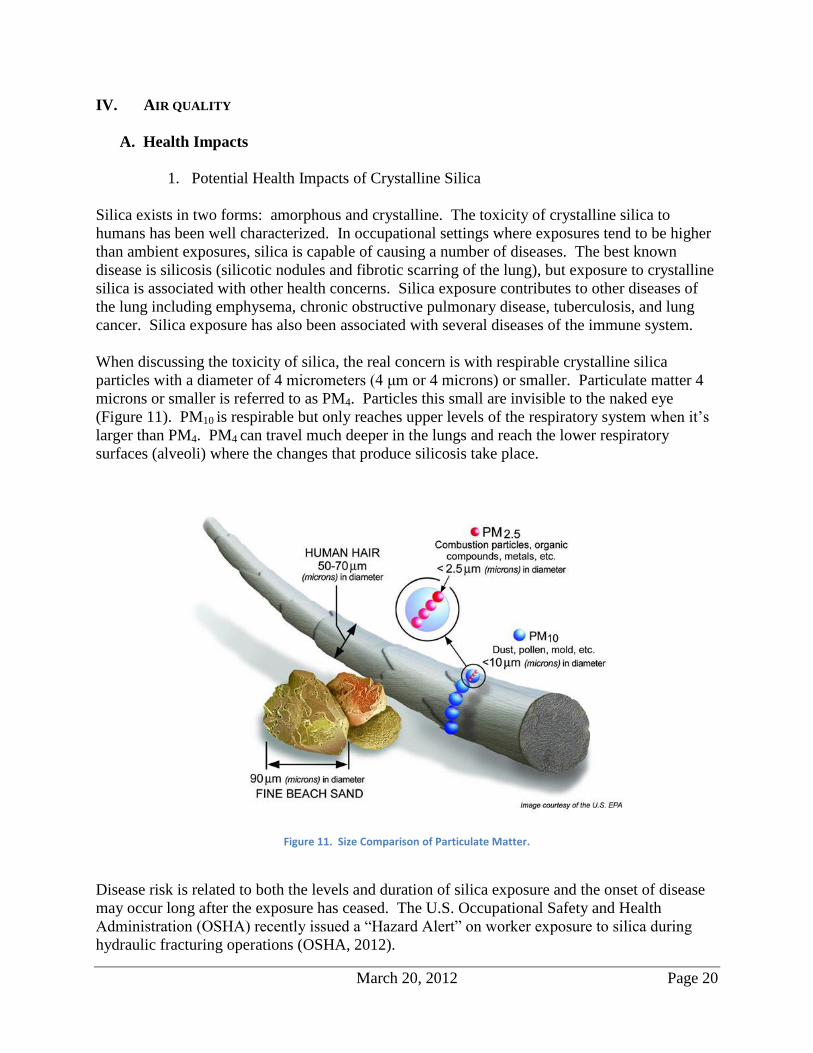
When discussing the toxicity of silica, the real concern is with respirable crystalline silica
particles with a diameter of 4 micrometers (4 μm or 4 microns) or smaller. Particulate matter 4
microns or smaller is referred to as PM4. Particles this small are invisible to the naked eye
(Figure 11). PM10 is respirable but only reaches upper levels of the respiratory system when it’s
larger than PM4. PM4 can travel much deeper in the lungs and reach the lower respiratory
surfaces (alveoli) where the changes that produce silicosis take place.
Figure 11. Size Comparison of Particulate Matter.
Disease risk is related to both the levels and duration of silica exposure and the onset of disease
may occur long after the exposure has ceased. The U.S. Occupational Safety and Health
Administration (OSHA) recently issued a “Hazard Alert” on worker exposure to silica during
hydraulic fracturing operations (OSHA, 2012).
March 20, 2012 Page 21
Mining activities have the potential to generate high concentrations of fine silica dust. As noted
above, exposure to silica dust has been shown to cause a number of lung diseases, including
silicosis and cancer, although there’s no conclusive evidence linking these conditions to sand
mining (Davies, 2012).
However, there have been studies identifying non-occupational silicosis due to elevated ambient
exposures to silica particulate. There also are studies identifying silicosis in exposed animals
downwind of peak sources of respirable crystalline silica (Bridge, 2009). More study is needed,
but there is evidence of potential health risks in areas of elevated silica concentration. It is
unknown what health impacts silica has at lower concentrations such as those typically found in
ambient air.
2. Exposure Limits for Crystalline Silica
The OSHA permissible exposure limit (PEL) for crystalline silica is 0.100 parts per million
(ppm) (which is the same as 100 micrograms per cubic meter or μg/m3) for an 8-hour time-
weighted average exposure. Adjustment of the OSHA PEL for a 24-hour exposure gives a level
of 24 μg/m3. The National Institute for Occupational Safety and Health (NIOSH) recommended
exposure limit is 0.05 ppm (50 μg/m3) for a 10-hour time-weighted exposure which would be
adjusted to 15 μg/m3 for a 24-hour exposure.
The California Environmental Protection Agency’s Office of Environmental Health Hazard
Assessment (OEHHA) has developed a chronic reference exposure limit for silica in ambient air
of 3 μg/m3. This value is eight-fold lower than the time adjusted OSHA limit and five-fold lower
than the time-adjusted NIOSH recommendation. The OEHHA value for the general population is
therefore more protective than federal recommendations for occupational exposure. The
differences between acceptable risk levels for occupational settings and those for the general
population are typically much greater than five- to eight-fold.
The Minnesota Department of Health (MDH) has recommended that the Minnesota Pollution
Control Agency (MPCA) use a long-term exposure limit of 3 μg/m3
of crystalline silica. The
MPCA has accepted this value for the purpose of risk assessment. The MPCA has requested that
MDH develop a short-term exposure limit for respirable crystalline silica in air.
3. Are the Occupational Exposure Limits Adequately Protective?
A number of studies suggest that silicosis is underdiagnosed when X-ray is used as the
diagnostic tool, and that there is significant risk to workers exposed to silica concentrations
lower than the occupational levels. OEHHA reports that “silicosis is still being diagnosed at
autopsy following death in workers who were supposed to be exposed to occupational levels of
50-100 μg/m3.”
4. Ambient Levels of Crystalline Silica Associated With Frac Sand Mining
The MDH has little or no information on the levels of respirable silica generated by frac sand
mining or processing. MDH has not been provided with any information on the ambient air
March 20, 2012 Page 22
levels of silica that result from frac sand mining operations. Two Minnesota facilities recently
started monitoring for crystalline silica: Great Plains Sand and Tiller North Branch. These two
sites received construction authorization from the MPCA in October 2012, and January 2013,
respectively. Both sites are expected to start operating at full capacity by Spring 2013. MDH has
been told that there are plans to monitor ambient air for silica associated with frac sand mining in
Wisconsin.
5. Other Possible Health Concerns Associated With Frac Sand Mining
Because frac sand mining operations are expected to operate for many hours a day, some 24
hours per day for 7 days a week, the increase in truck traffic could be a problem. Increased dust,
noise, risk of accidents and increased levels of engine exhaust will present health and nuisance
issues. Emissions from the mining process--blasting, digging equipment, conveyors, crushing,
drying, sorting, storage, and other fixed machinery—have the potential to result in more dust and
chemicals being placed into the air.
B. Permits and Standards
MPCA always regulates a silica-sand-related facility if they meet any of the following
descriptions:
o Has a dryer that was constructed after April 23, 1986
o Has a stationary crusher capable of processing 25 tons per hour of non-metallic
minerals (i.e. sandstone), and that crusher was constructed after August 31, 1983
o Has a portable crusher capable of processing 150 tons per hour of non-metallic
minerals (i.e. sandstone, and that crusher was constructed after August 31, 1983
o Has potential PM10 emissions of 25 tons per year or more
The MPCA regulates ‘particulate matter’ in three size ranges: Total Suspended Particulate,
PM10, and PM2.5
Silica sand primarily falls into the Total Suspended Particulate size category, but can also be
found in PM10 and PM2.5 size categories. The grain sizes used in the oil and gas extraction
process fall into the Total Suspended Particulate size category..
There is no Federal or State standard for silica in ambient air (PM4); ambient air is defined as
the portion of the atmosphere, external to buildings, to which the general public has
access. The MPCA cannot build a specific limit in our air permits for PM4 without a
standard although the Agency can request practices to mitigate emissions and exposure.
Health benchmarks are similar to air standards in that they are health based, but they are less
enforceable within the permitting process. They may be used to inform air permitting and
respond to public comments. The MDH is currently reviewing other states’ health
benchmarks to compare to Minnesota’s.
Local units of government may also have air-quality-related ordinances and requirements
that apply in addition to those found in MPCA-issued permits. However, MPCA does advise
March 20, 2012 Page 23
local units of government on ways to mitigate potential health and environmental concerns
(e.g. advice on how to limit fugitive dust).
OSHA regulates air quality in occupational settings to protect the health of workers through a
respirable crystalline silica standard. OSHA defines respirable as particles below 4
micrometers, or PM4.
MDH and the MPCA have found that the majority of the silica exposure data are collected
for the PM4 size category.
There are no federal reference methods for ambient air monitoring of the PM4 size category.
A federal reference method is a procedure for collecting and analyzing the ambient air for a
specific pollutant.
The MPCA has ambient air monitors for Total Suspended Particulate, PM10, and PM2.55
arranged in a state-wide array; these locations are not intended to represent any specific
facility, but are intended to represent neighborhoods or larger geographic areas such as
regions.
A paper was published by Richards, et. al., in 2009 in the Journal of Air and Waste
Management Association regarding a method in which a PM2.5 monitor was modified to
collect PM4 data. This data was collected at several sand and gravel facilities in
California. The published data includes emission factors for silica and ambient monitoring of
silica. The results of the study suggest that the monitored levels are below the Reference
Exposure Level of 3 μg/m3, which is the limit developed by OEHHA and recommended by
MDH. This Reference Exposure Level is intended to protect the general public over the long
term. It is important to note that the silica content of the California sand and gravel was
approximately 30% by weight and that the silica sand found in Minnesota is nearly 100%
silica by weight. This silica content difference makes it difficult to directly apply the
findings of the California study to Minnesota sands.
Certain industries in Wisconsin, of their own initiative, have hired the above-mentioned
Richard et. al in an attempt to monitor for PM4. This data will be further analyzed in order to
assess what portion of the collected PM4 material is composed of silica. Due to the nature of
the project’s funding, it is unclear if the data will ever be published or peer reviewed.
A facility in Scott County has agreed to monitor for Total Suspended Particulate, PM10, and
silica. A facility in Chisago County has agreed to monitor for PM10, PM2.5, PM4, and silica.
The data from these sites may inform whether or not there are exposure risks to the general
public. The MPCA will receive this data on a quarterly and semi-annual basis from the two
facilities.
The MPCA has received approximately six months of ambient data from the Great Plains
Sand facility. The data indicate that the facility is not exceeding the NAAQS. The data also
indicate the facility is not exceeding the long-term crystalline silica health benchmark. The
March 20, 2012 Page 24
MPCA understands the facility will not be fully operational until Spring 2013, so the current
six-month dataset is not representative of an operational silica sand facility.
C. Potential Research Topics
Concentrations of crystalline silica associated with silica sand mining: As noted
above, there is little or no information on the amount of silica in the air that results
from silica sand mining, processing, and transportation operations. There are plans to
monitor silica levels in ambient air associated with frac sand mining in Wisconsin.
However, MPCA reports that the Wisconsin study is being funded by industry and
therefore the results may or may not be made public. A study funded by the State of
Minnesota would ensure public availability of the results. Such a study might provide
a basis for new state air quality standards for silica.
In order to predict (i.e. model) the ambient impacts of a silica-sand facility, the
MPCA needs additional information, such as: (1) an acceptable PM4 monitoring
method, and (2) a set of silica emission factors for PM4-sized material for processes
that occur at silica sand facilities. Both the monitoring method and emission factors
would be used to support any air quality standard developed by the State.
Health Impact Assessment: A Health Impact Assessment (HIA) is a research and
community engagement process that can be used to help ensure that people’s health
and concerns are being considered when decisions on infrastructure and land use
projects are being made. The National Research Council defines HIA as “a structured
process that uses scientific data, professional expertise, and stakeholder input to
identify and evaluate public-health consequences of proposals and suggests actions
that could be taken to minimize adverse health impacts and optimize beneficial ones.”
HIAs have been used to provide important health information to decision makers on a
wide range of projects outside the typical health arena, including comprehensive
plans, brownfield redevelopment, transportation projects, energy policies, and
housing projects. Over 100 HIAs have been performed in the U.S. to help improve
public health. Ten HIAs have been completed in Minnesota, mostly on
comprehensive plans and transportation projects.
To date, no HIA has been used to evaluate frac sand mining in the U.S., but HIAs
have been used to inform decision makers about additional health effects in projects
that have some similarities, including oil and gas leasing, coal mine proposals, and
copper, zinc and gold mining. These HIAs may review health issues that are typically
included in an EIS, such as water and air quality, but they also review additional
health effects that are related to the specific site and community. Some health effects
considered in these HIAs include reviewing the health effects of newly built
infrastructure and traffic to support mining, the influx of migrant workers, and the
disturbance of food sources relied upon by subsistence cultures.

March 20, 2012 Page 25
An HIA on silica sand mining could provide additional health information for policy
makers in determining how to balance health and citizens’ concerns with the
economic benefits of silica sand mining. The HIA would need to include an air
monitoring study. It also could include additional primary data collection and
analysis of other issues, such as the economic impacts on tourism, to be most helpful.
Also, the HIA should provide a quality public process that helps to articulate and
clarify citizens’ concerns. An HIA could provide recommendations to policy makers
to support possible positive health outcomes and to mitigate or prevent possible
negative health outcomes to improve the public’s health and to inform zoning,
permitting, monitoring, and reclamation policies. Performing an HIA on silica sand
mining is beyond the scope of a standard agency project and would require dedicated
funding. MDH provides training, technical assistance, and communications about
HIA activities in Minnesota. A HIA may take between several months to several
years, depending on the scope and scale of the review.
Alternative proppants: Proppants other than pure silica sand exist that are used for
fracking. Are other proppants, such as manufactured ceramics or resin coated
proppants, viable alternatives to silica sand? Do alternative proppants avoid the air
quality and other potential environmental impacts generated by the silica sand
industry elements? Should the State consider the availability of non-sand proppants
in policy decisions regarding sand mining, processing, and transporting in Minnesota?
March 20, 2012 Page 26
V. WATER QUALITY
A. Groundwater
1. Potential Impacts to Groundwater from Mining
Any mine may create a pathway for pollutants (chemicals and/or bacteria) to more easily reach
the groundwater, especially if the bottom of the mine is near or below the water table. Typical
mining activity involves the use of heavy equipment and the potential exists for leaks or spills of
petroleum products and solvents related to that machinery, although these tend to be fairly
infrequent and small in volume. Runoff from contaminant sources near the mine or waste
illegally dumped in the mine may also be potential concerns. Additional information regarding
potential risks to drinking water associated with mining activities and actions required by the
state to minimize or eliminate those risks can be found in the August 2009 MDH whitepaper
titled: “Wellhead Protection Issues Related to Mining Activities” (MDH, 2009).
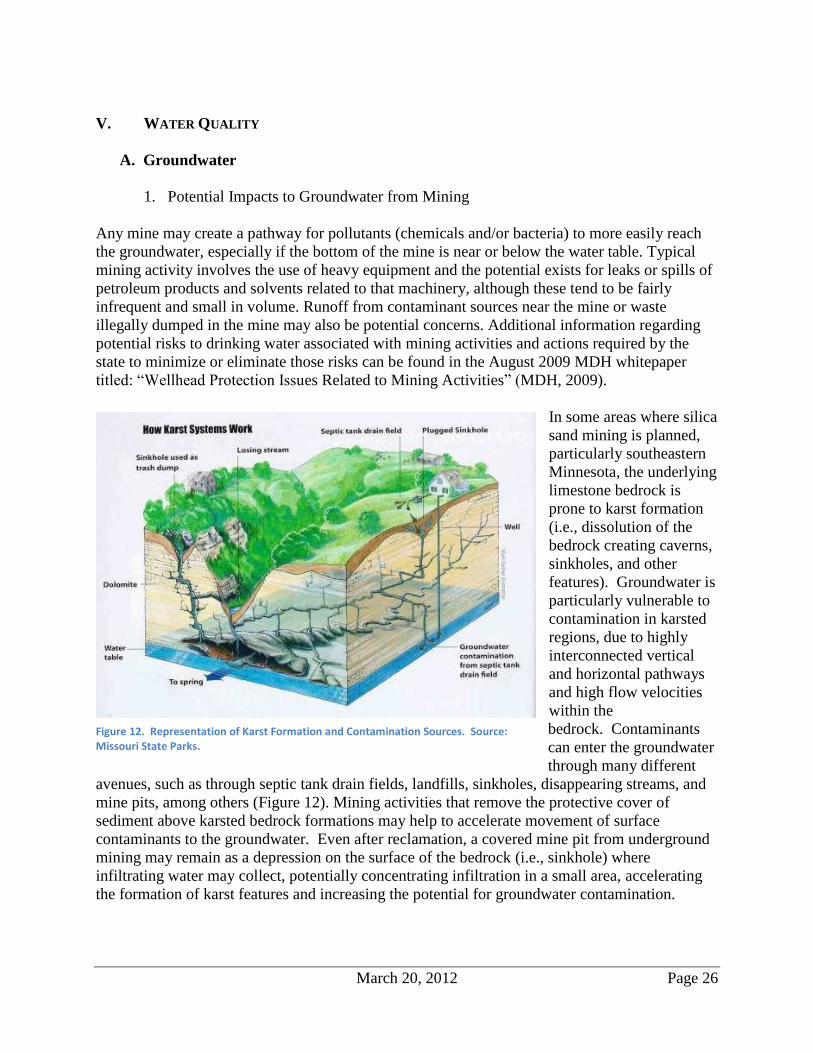
In some areas where silica
sand mining is planned,
particularly southeastern
Minnesota, the underlying
limestone bedrock is
prone to karst formation
(i.e., dissolution of the
bedrock creating caverns,
sinkholes, and other
features). Groundwater is
particularly vulnerable to
contamination in karsted
regions, due to highly
interconnected vertical
and horizontal pathways
and high flow velocities
within the
bedrock. Contaminants
can enter the groundwater
through many different
avenues, such as through septic tank drain fields, landfills, sinkholes, disappearing streams, and
mine pits, among others (Figure 12). Mining activities that remove the protective cover of
sediment above karsted bedrock formations may help to accelerate movement of surface
contaminants to the groundwater. Even after reclamation, a covered mine pit from underground
mining may remain as a depression on the surface of the bedrock (i.e., sinkhole) where
infiltrating water may collect, potentially concentrating infiltration in a small area, accelerating
the formation of karst features and increasing the potential for groundwater contamination.
Figure 12. Representation of Karst Formation and Contamination Sources. Source: Missouri State Parks.
March 20, 2012 Page 27
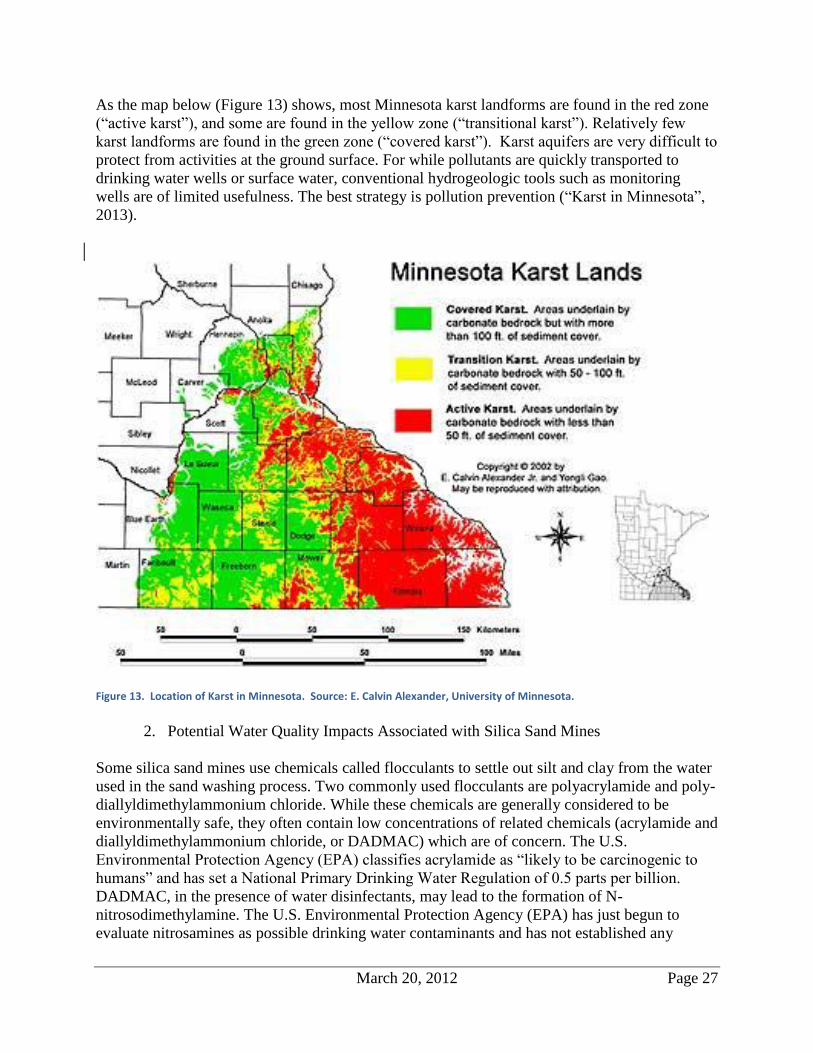
As the map below (Figure 13) shows, most Minnesota karst landforms are found in the red zone
(“active karst”), and some are found in the yellow zone (“transitional karst”). Relatively few
karst landforms are found in the green zone (“covered karst”). Karst aquifers are very difficult to
protect from activities at the ground surface. For while pollutants are quickly transported to
drinking water wells or surface water, conventional hydrogeologic tools such as monitoring
wells are of limited usefulness. The best strategy is pollution prevention (“Karst in Minnesota”,
2013).
Figure 13. Location of Karst in Minnesota. Source: E. Calvin Alexander, University of Minnesota.
2. Potential Water Quality Impacts Associated with Silica Sand Mines
Some silica sand mines use chemicals called flocculants to settle out silt and clay from the water
used in the sand washing process. Two commonly used flocculants are polyacrylamide and poly-
diallyldimethylammonium chloride. While these chemicals are generally considered to be
environmentally safe, they often contain low concentrations of related chemicals (acrylamide and
diallyldimethylammonium chloride, or DADMAC) which are of concern. The U.S.
Environmental Protection Agency (EPA) classifies acrylamide as “likely to be carcinogenic to
humans” and has set a National Primary Drinking Water Regulation of 0.5 parts per billion.
DADMAC, in the presence of water disinfectants, may lead to the formation of N-
nitrosodimethylamine. The U.S. Environmental Protection Agency (EPA) has just begun to
evaluate nitrosamines as possible drinking water contaminants and has not established any
March 20, 2012 Page 28
drinking water standards for them. Although the concentrations of these chemicals in the sand
wash water is likely to be low, MDH recommends monitoring of the groundwater at facilities
where these chemicals are to be used and stored to ensure safe drinking water levels are not
exceeded. Often times the finer fraction of sand that an operation cannot sell, called “waste
sand”, is returned to the mine site as part of the reclamation process. The returned waste sand
may have been in contact with flocculants. The use of contaminated waste sand in a reclaimed
pit introduces concerns of groundwater contamination. This concern is elevated in heavily
karsted areas.
There have been anecdotal reports that groundwater near silica sand mines becomes slightly
more acidic (lower in pH) as a result of mining. It is not known whether this is typical of all sand
mining operations, silica sand mines in general, or specifically related to the geology of the
particular mines that were studied. MDH conducted a preliminary review of water quality
literature but was unable to verify or refute these reports. Increasing the acidity of groundwater
may cause naturally occurring minerals such as iron and manganese to more easily dissolve into
the water. While generally not a health concern, these minerals can cause water to have
unpleasant taste and odor and may cause staining, resulting in the need for treatment to make the
water potable. Until the relationship between silica sand mines and water chemistry is better
understood, MDH recommends that, among other water chemistry measures, pH be monitored in
the groundwater near silica sand mining operations.
B. Surface Water
In karst landscapes, the distinction between groundwater and surface water is commonly blurry,
and sometimes very tenuous. Groundwater may emerge as a spring, flow a short distance above
ground, only to vanish in a disappearing stream, and perhaps re-emerge farther downstream
again as surface water (Figure 12).
The intimate connection between groundwater and surface water gives rise to large number of
cold water streams in southeastern Minnesota where trout and other important species thrive.
Pollution traveling rapidly along a groundwater path may emerge at a lake or stream, thus posing
a threat to the animals and plants living there. In the same way, pollution that has reached surface
water can easily become groundwater pollution, thus posing a pollution risk to people whose
drinking water is groundwater.
C. Permits and Standards
MPCA regulates a facility or site through general and individual National Pollutant
Discharge Elimination Systems/ State Disposal System (NPDES/ SDS) water permits.
The permits regulate wastewater and stormwater discharges to ground and surface
waters from sites.
Sand mining and processing facilities that have a surface water discharge are required
to monitor their discharge. Depending on whether the facility has an individual or
general permit, the discharge will be monitored for Total Suspended Solids (TSS),
Potential of Hydrogen (pH), Flow and Turbidity at a frequency determined within the
March 20, 2012 Page 29
facility/ site’s NPDES/ SDS permit. The results of the monitoring will be submitted to
the MPCA.
Chemical use: As part of the NPDES/SDS program, MPCA reviews requests for the
use of chemical additives at facilities. The MPCA considers surface water quality
standards as well as health risk limits/health based values set for groundwater as part
of this evaluation. Chemical additive reviews are done to avoid/minimize
environmental or health risks from chemical use at permitted facilities. The
Minnesota Department of Health (MDH) has not set a health risk limit/health risk
value for acrylamide, a flocculant known to be used at silica sand processing
facilities. To inform chemical additive reviews, MPCA staff developed a screening
threshold for acrylamide using MDH methods. If MDH develops health risk
limits/health based values, or if new and better information becomes available, for
chemicals proposed for use at silica sand processing facilities, the MPCA will
consider it when reviewing chemical additive requests.
D. Potential Research Topics
Cumulative Impacts: The cumulative impacts to water quality (and quantity) of
multiple silica sand mines in close proximity are not well understood. Monitoring
wells should be required at mines to measure groundwater elevations, flow directions
and water quality.
Guidance for Drinking Water: No state or federal drinking water standards exist
for chemicals of potential concern associated with silica sand operations (i.e.
flocculants). Federal regulation regulates the amount of acrylamide in the polymeric
coagulant aids to .05% by weight and the dosage of polymeric coagulant aid which
can be added to raw water to remove particulates to 1ppm
(http://water.epa.gov/drink/contaminants/basicinformation/acrylamide.cfm). If these
chemicals are detected in groundwater, MDH could evaluate whether drinking water
guidance can be developed.
Testing Methods: No commonly accepted analytical testing methods have been
developed for the chemicals of potential concern (i.e. flocculants) and very few
commercial laboratories offer testing for these chemicals – MDH Public Health
Laboratory could explore the feasibility of developing analytical test methods for
acrylamide, DADMAC and NDMA. Despite there being no commonly accepted
analytical testing method, Chippewa County, Wisconsin has required mines to test
groundwater and waste material (clay and silt particulate) for acrylamide.
Long Term Effects in Karst Regions: More information is needed on the long-term
implications for groundwater quality of reclaimed mines in karst-prone regions of the
state – water quality monitoring should be required following mine closure. The
MDNR, University of Minnesota, and Minnesota Geological Survey are actively
researching karst and groundwater in Minnesota and should be consulted regarding
additional mining-related research needs/opportunities.
March 20, 2012 Page 30
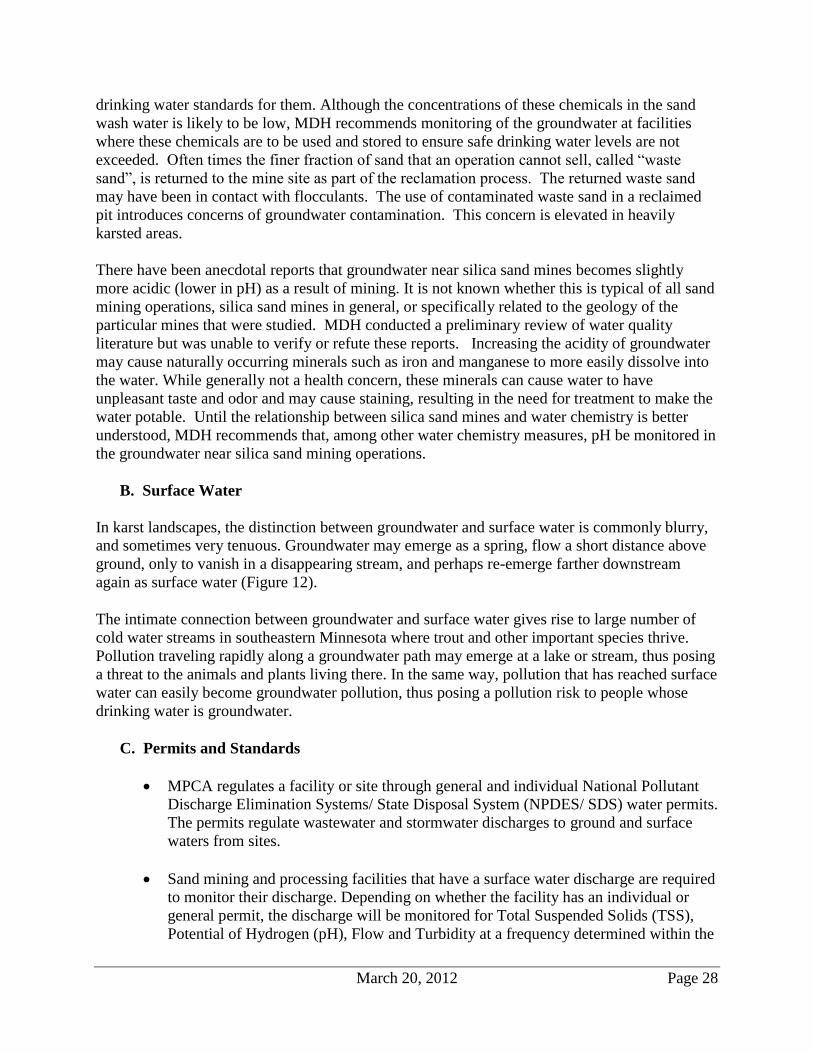
VI. WATER QUANTITY
Sandstone layers in Minnesota that could be valuable as silica sand may be saturated or
unsaturated with water depending on the local depth to the water table. The water table is
defined as the surface that separates unsaturated earth materials (i.e. sandstone, limestone, sand
and gravel etc.) from the underlying fully saturated materials (Figure 14).
Figure 14. An illustration of fundamental groundwater concepts.
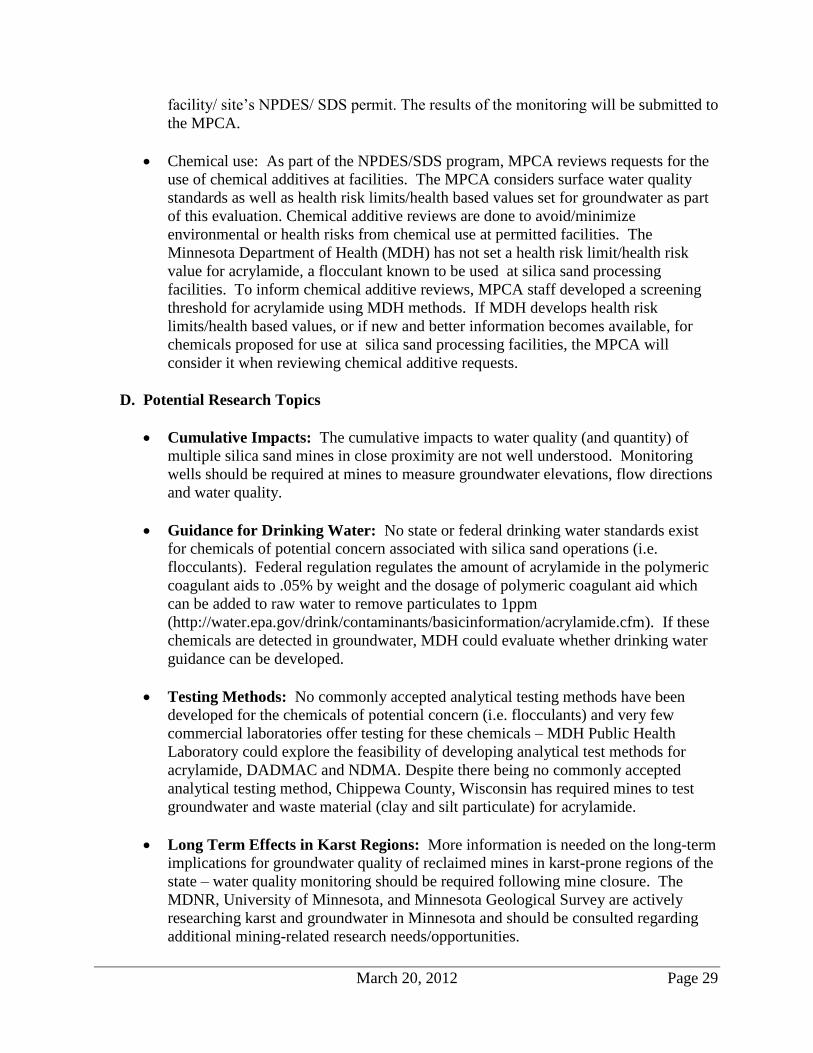
Two proposed mining examples—dry mining and wet mining—are presented in this section to
help illustrate some of the water quantity related issues that will be encountered with silica sand
mining in southeastern Minnesota. The general geologic setting of both examples is shown on
the regional geologic cross section (Figure 15). Near the center of the cross section shallow
upland St. Peter Sandstone exposures are shown in pink. This is the regional setting for the dry
mining example. Near the left (western) portion of the cross section Jordan sandstone exposures
are shown in a valley setting of the Minnesota River where wet mining conditions exist.
Figure 15. Regional cross section across south-eastern Minnesota showing the general geologic settings of major sandstone formations. Source: Runkel, 2012.
March 20, 2012 Page 31
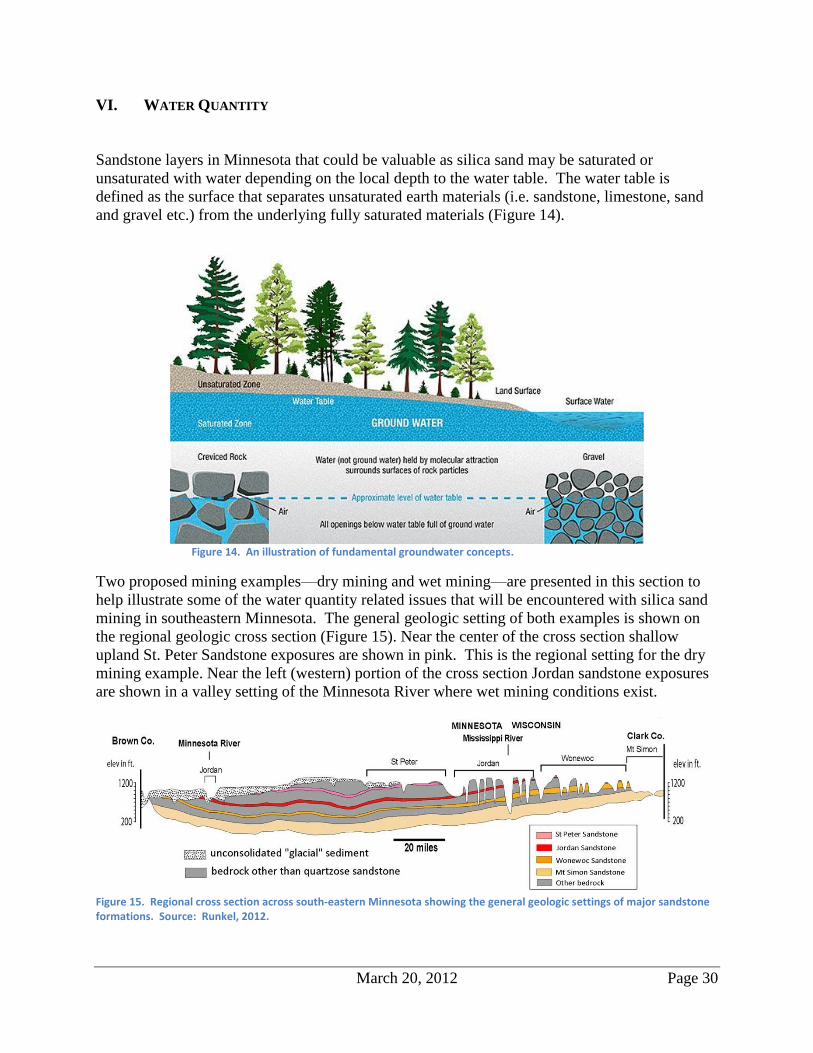
A. Dry Mining - Winona County Example
Portions of sandstone formations in southern Minnesota occur above the water table and may be
suitable for dry mining. The St. Peter Sandstone is most likely to be unsaturated over large areas.
The Jordan Sandstone, and to a lesser extent the Wonewoc Sandstone, are also unsaturated in
some areas including some valley side slopes (Figure 16).
The sandstone that forms this hill shown in Figure17 is above the regional water table. A
proposed project to mine the sandstone from a similar hill in Winona County has a reported
water table of approximately 50 feet below the elevation at the base of the hill. The EAW for the
project reports “Hydrologic alteration through dewatering for mining will not be necessary at the
site” (Dabelstein Quarry EAW, 2012). In landscapes like these, natural lakes, streams, and
wetlands typically are rare or absent. Thus, in this example, large changes to the water table
aquifer would not be anticipated. However, if said processing requires the use of a large amount
of water from an onsite well, the effect of that groundwater withdrawal may require analysis of
the water table elevation according to MDNR permitting requirements.
A
A
’Jordan Sandstone
St Peter Sandstone
Wonewoc Sandstone
SARATOGA TOWNSHIP
Modified from Winona County Geologic Atlas (Mossler and Book, 1984)
A
’A
Figure 16. Sandstone layers that are accessible in southeastern Minnesota. Source: modified from Mossler and Book, 1984.
March 20, 2012 Page 32
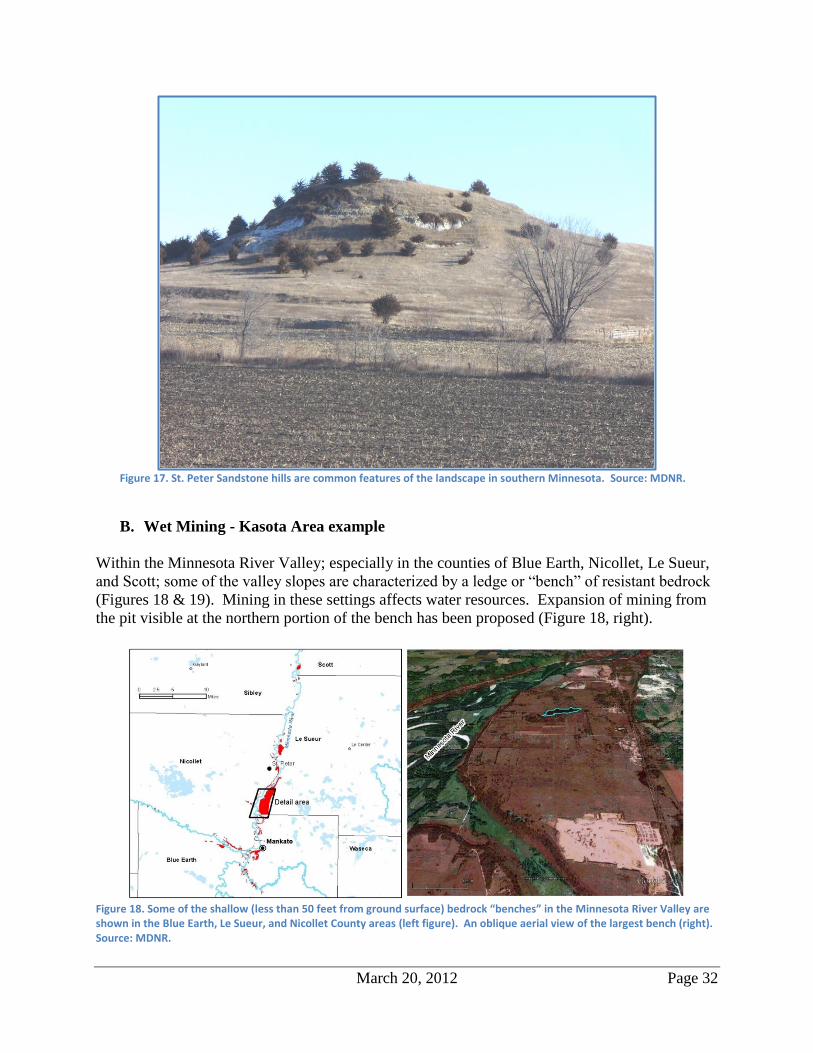
Figure 17. St. Peter Sandstone hills are common features of the landscape in southern Minnesota. Source: MDNR.
B. Wet Mining - Kasota Area example
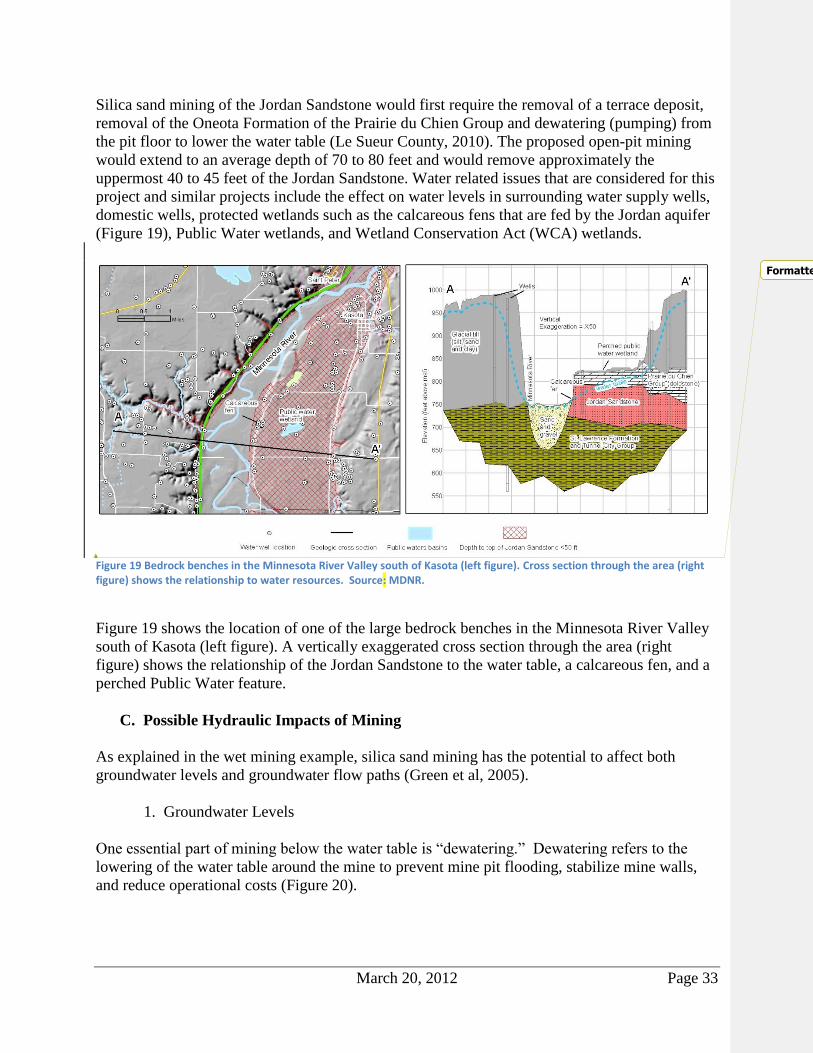
Within the Minnesota River Valley; especially in the counties of Blue Earth, Nicollet, Le Sueur,
and Scott; some of the valley slopes are characterized by a ledge or “bench” of resistant bedrock
(Figures 18 & 19). Mining in these settings affects water resources. Expansion of mining from
the pit visible at the northern portion of the bench has been proposed (Figure 18, right).
Figure 18. Some of the shallow (less than 50 feet from ground surface) bedrock “benches” in the Minnesota River Valley are shown in the Blue Earth, Le Sueur, and Nicollet County areas (left figure). An oblique aerial view of the largest bench (right). Source: MDNR.
March 20, 2012 Page 33
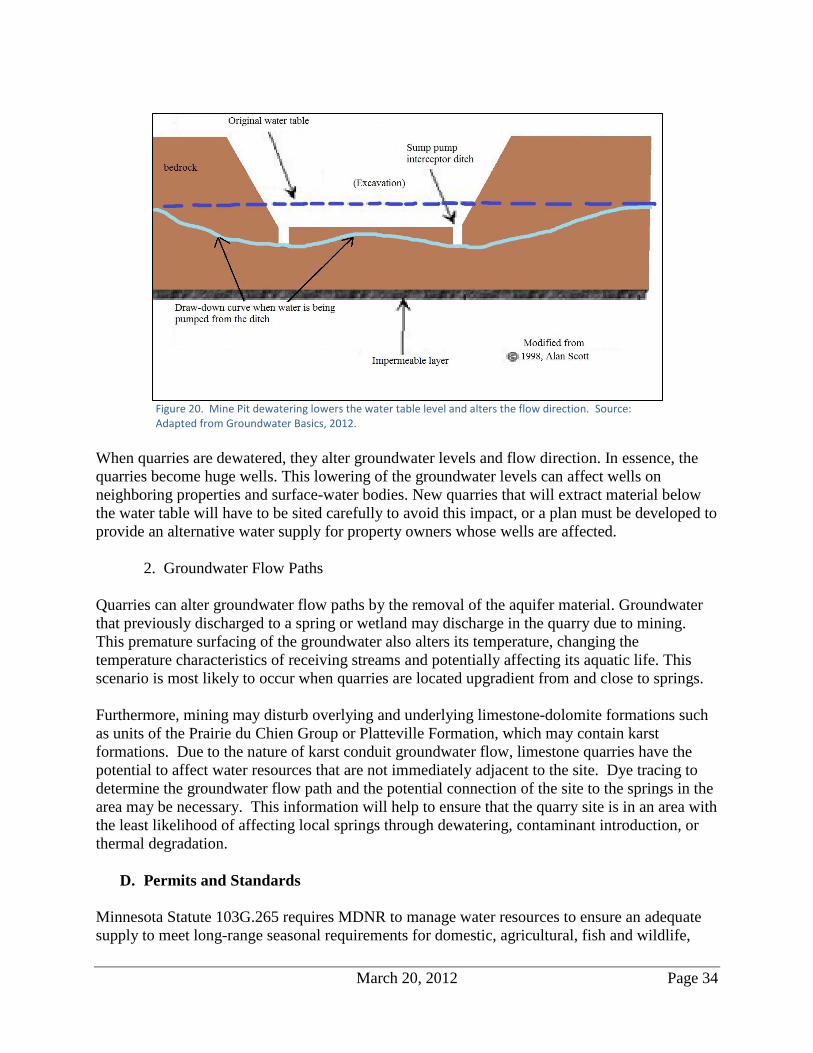
Silica sand mining of the Jordan Sandstone would first require the removal of a terrace deposit,
removal of the Oneota Formation of the Prairie du Chien Group and dewatering (pumping) from
the pit floor to lower the water table (Le Sueur County, 2010). The proposed open-pit mining
would extend to an average depth of 70 to 80 feet and would remove approximately the
uppermost 40 to 45 feet of the Jordan Sandstone. Water related issues that are considered for this
project and similar projects include the effect on water levels in surrounding water supply wells,
domestic wells, protected wetlands such as the calcareous fens that are fed by the Jordan aquifer
(Figure 19), Public Water wetlands, and Wetland Conservation Act (WCA) wetlands.
Figure 19 Bedrock benches in the Minnesota River Valley south of Kasota (left figure). Cross section through the area (right figure) shows the relationship to water resources. Source: MDNR.
Figure 19 shows the location of one of the large bedrock benches in the Minnesota River Valley
south of Kasota (left figure). A vertically exaggerated cross section through the area (right
figure) shows the relationship of the Jordan Sandstone to the water table, a calcareous fen, and a
perched Public Water feature.
C. Possible Hydraulic Impacts of Mining
As explained in the wet mining example, silica sand mining has the potential to affect both
groundwater levels and groundwater flow paths (Green et al, 2005).
1. Groundwater Levels
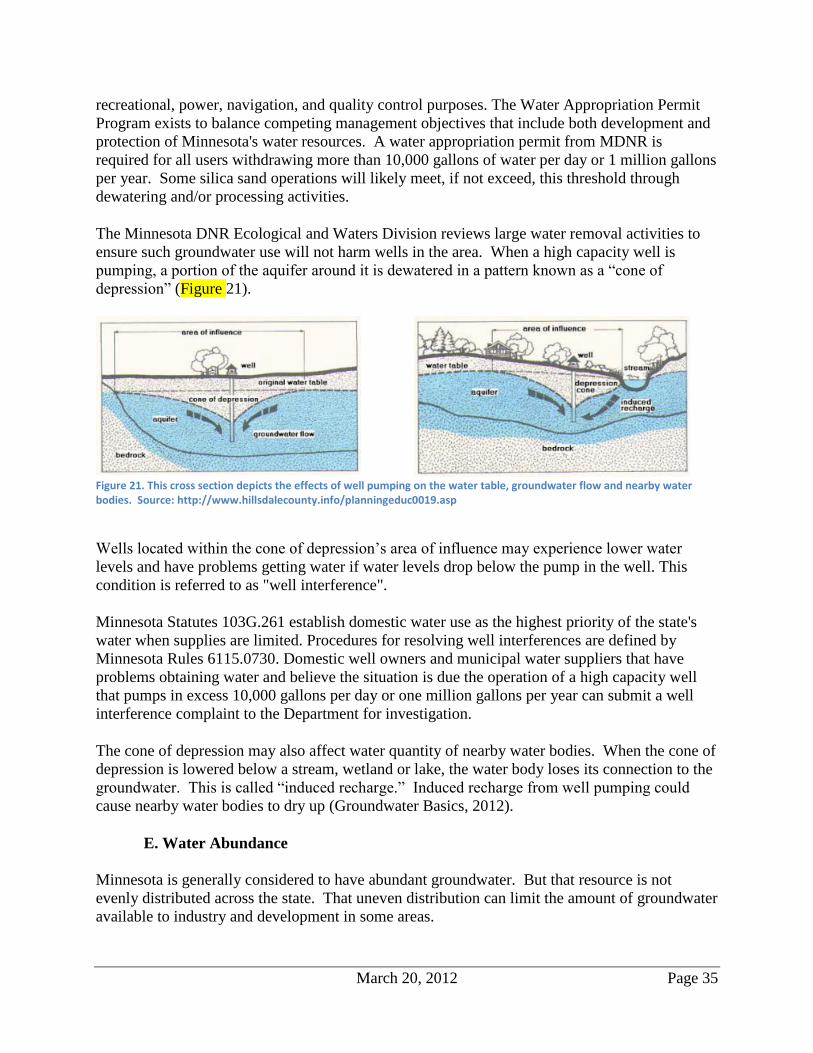
One essential part of mining below the water table is “dewatering.” Dewatering refers to the
lowering of the water table around the mine to prevent mine pit flooding, stabilize mine walls,
and reduce operational costs (Figure 20).
Formatted: Font: Bold
March 20, 2012 Page 34
Figure 20. Mine Pit dewatering lowers the water table level and alters the flow direction. Source: Adapted from Groundwater Basics, 2012.
When quarries are dewatered, they alter groundwater levels and flow direction. In essence, the
quarries become huge wells. This lowering of the groundwater levels can affect wells on
neighboring properties and surface-water bodies. New quarries that will extract material below
the water table will have to be sited carefully to avoid this impact, or a plan must be developed to
provide an alternative water supply for property owners whose wells are affected.
2. Groundwater Flow Paths
Quarries can alter groundwater flow paths by the removal of the aquifer material. Groundwater
that previously discharged to a spring or wetland may discharge in the quarry due to mining.
This premature surfacing of the groundwater also alters its temperature, changing the
temperature characteristics of receiving streams and potentially affecting its aquatic life. This
scenario is most likely to occur when quarries are located upgradient from and close to springs.
Furthermore, mining may disturb overlying and underlying limestone-dolomite formations such
as units of the Prairie du Chien Group or Platteville Formation, which may contain karst
formations. Due to the nature of karst conduit groundwater flow, limestone quarries have the
potential to affect water resources that are not immediately adjacent to the site. Dye tracing to
determine the groundwater flow path and the potential connection of the site to the springs in the
area may be necessary. This information will help to ensure that the quarry site is in an area with
the least likelihood of affecting local springs through dewatering, contaminant introduction, or
thermal degradation.
D. Permits and Standards
Minnesota Statute 103G.265 requires MDNR to manage water resources to ensure an adequate
supply to meet long-range seasonal requirements for domestic, agricultural, fish and wildlife,
March 20, 2012 Page 35
recreational, power, navigation, and quality control purposes. The Water Appropriation Permit
Program exists to balance competing management objectives that include both development and
protection of Minnesota's water resources. A water appropriation permit from MDNR is
required for all users withdrawing more than 10,000 gallons of water per day or 1 million gallons
per year. Some silica sand operations will likely meet, if not exceed, this threshold through
dewatering and/or processing activities.
The Minnesota DNR Ecological and Waters Division reviews large water removal activities to
ensure such groundwater use will not harm wells in the area. When a high capacity well is
pumping, a portion of the aquifer around it is dewatered in a pattern known as a “cone of
depression” (Figure 21).
Figure 21. This cross section depicts the effects of well pumping on the water table, groundwater flow and nearby water bodies. Source: http://www.hillsdalecounty.info/planningeduc0019.asp
Wells located within the cone of depression’s area of influence may experience lower water
levels and have problems getting water if water levels drop below the pump in the well. This
condition is referred to as "well interference".
Minnesota Statutes 103G.261 establish domestic water use as the highest priority of the state's
water when supplies are limited. Procedures for resolving well interferences are defined by
Minnesota Rules 6115.0730. Domestic well owners and municipal water suppliers that have
problems obtaining water and believe the situation is due the operation of a high capacity well
that pumps in excess 10,000 gallons per day or one million gallons per year can submit a well
interference complaint to the Department for investigation.
The cone of depression may also affect water quantity of nearby water bodies. When the cone of
depression is lowered below a stream, wetland or lake, the water body loses its connection to the
groundwater. This is called “induced recharge.” Induced recharge from well pumping could
cause nearby water bodies to dry up (Groundwater Basics, 2012).
E. Water Abundance
Minnesota is generally considered to have abundant groundwater. But that resource is not
evenly distributed across the state. That uneven distribution can limit the amount of groundwater
available to industry and development in some areas.
March 20, 2012 Page 36
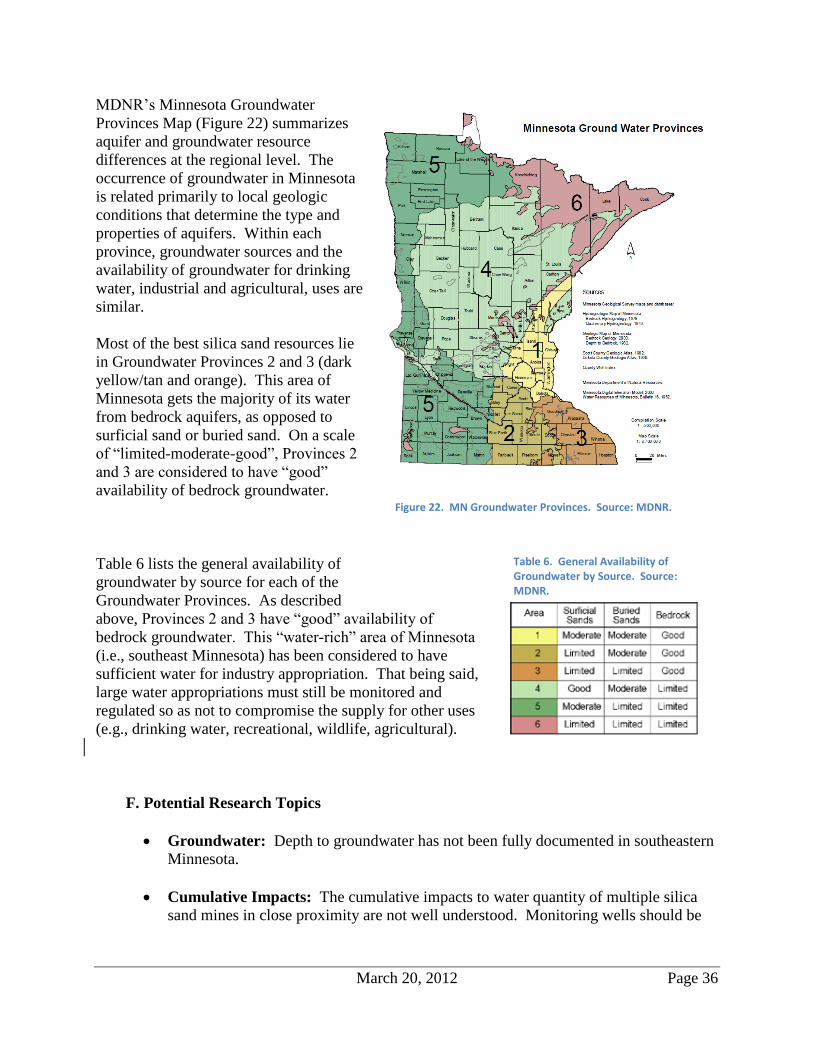
MDNR’s Minnesota Groundwater
Provinces Map (Figure 22) summarizes
aquifer and groundwater resource
differences at the regional level. The
occurrence of groundwater in Minnesota
is related primarily to local geologic
conditions that determine the type and
properties of aquifers. Within each
province, groundwater sources and the
availability of groundwater for drinking
water, industrial and agricultural, uses are
similar.
Most of the best silica sand resources lie
in Groundwater Provinces 2 and 3 (dark
yellow/tan and orange). This area of
Minnesota gets the majority of its water
from bedrock aquifers, as opposed to
surficial sand or buried sand. On a scale
of “limited-moderate-good”, Provinces 2
and 3 are considered to have “good”
availability of bedrock groundwater.
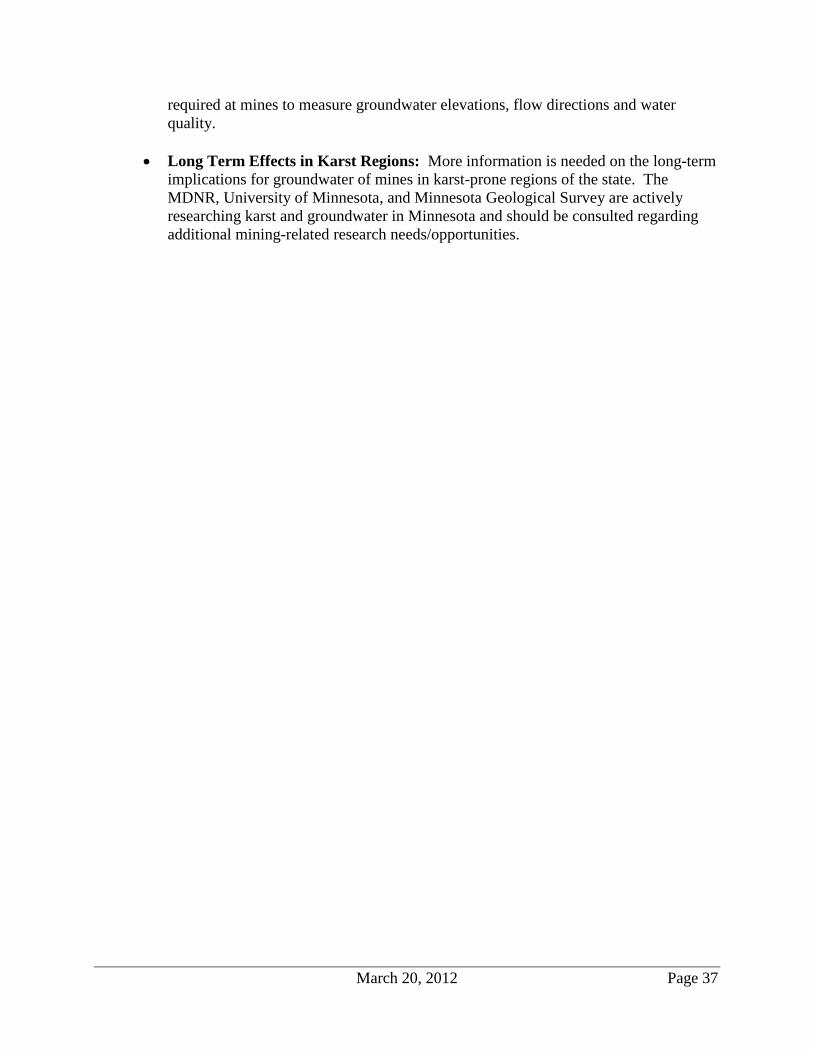
Table 6 lists the general availability of
groundwater by source for each of the
Groundwater Provinces. As described
above, Provinces 2 and 3 have “good” availability of
bedrock groundwater. This “water-rich” area of Minnesota
(i.e., southeast Minnesota) has been considered to have
sufficient water for industry appropriation. That being said,
large water appropriations must still be monitored and
regulated so as not to compromise the supply for other uses
(e.g., drinking water, recreational, wildlife, agricultural).
F. Potential Research Topics
Groundwater: Depth to groundwater has not been fully documented in southeastern
Minnesota.
Cumulative Impacts: The cumulative impacts to water quantity of multiple silica
sand mines in close proximity are not well understood. Monitoring wells should be
Figure 22. MN Groundwater Provinces. Source: MDNR.
Table 6. General Availability of Groundwater by Source. Source: MDNR.
March 20, 2012 Page 37
required at mines to measure groundwater elevations, flow directions and water
quality.
Long Term Effects in Karst Regions: More information is needed on the long-term
implications for groundwater of mines in karst-prone regions of the state. The
MDNR, University of Minnesota, and Minnesota Geological Survey are actively
researching karst and groundwater in Minnesota and should be consulted regarding
additional mining-related research needs/opportunities.
March 20, 2012 Page 38
VII. TRANSPORTATION
As a transportation commodity, silica sand is considered a common non-metallic mineral. It is
normally handled as a dry bulk commodity, easily transferred by mechanical means including
bucket loaders, clamshells, and conveyors. Silica sand is transported both packaged and in bulk
by all modes; truck, rail, barge, and intermodal container. It is a chemically inert material
included in the non-hazardous United States Department of Transportation hazmat classification.
While Wisconsin already has 10 times the silica sand mining activity of Minnesota, state
residents here have concerns around the rapid expansion of non-metallic mineral production and
its transport. Transportation safety is a significant issue resulting from frequent heavy truck and
rail trips, and is being addressed in road design, traffic safety, and grade crossing safety
initiatives. Local, light duty roads are being most rapidly and directly impacted by concentrated
truck traffic. Local jurisdictions have limited resources to react to the damage, but are
negotiating through use permits for private sector compensation.
A. Trucking and Road Systems
1. Federal, State Trunk, and State Aid Roadways and Bridges
In January of 2012, there were about 60 mines producing 12 million tons per year by the state’s
conservative estimate (Wisconsin Dept. of Natural Resources 2012). This is an average of
200,000 tons per mine per year. If a large truck holds 26 tons (Tennessee Tombigbee), this
averages to about 7,700 trucks per year, or 150 per week. Larger mines producing more sand
would create correspondingly more truck traffic.
Traffic routes and volumes are determined in consultation with local road authorities and
MnDOT. Factors include the most direct route as well as highway condition and capacity. Road
capacity to handle the new traffic and current traffic levels is derived from existing data.
MnDOT and county engineers have authority over road designs, safety configurations, and
programmed maintenance. Engineers have developed benchmark wear impacts and costs. Wear
produced by concentrated traffic is determined based on design standards and life of a specific
road versus the new traffic.
The Federal and State trunk highway system is generally able to handle the increased traffic
without significant immediate impact. Because these are public thoroughfares with users
engaged in traffic crossing jurisdictional boundaries, including interstate commerce, specific
commodity or industry-targeted user fees are normally not allowed for non-permit loads.
Funding thus is usually attached to mining and conditional use permit fee structures. Non-
programmed funding for sand-associated repairs on light duty roads is most commonly
negotiated between mining interests and local officials.
March 20, 2012 Page 39
2. Local Roads Designed for Lower Capacity and Loading
The greatest immediate impacts due to mine operations and concentrated heavy truck traffic
occur on local township and county roads designed for low traffic volumes and 5-9 ton axle
loadings. Normal highway funding available to these governmental units is far from adequate to
offset the new and immediate needs for road repair and rebuilds. Serious road degradation may
occur in the first 1-3 years, versus a life of the mining operations that is expected to extend for 5-
30 years.
3. Regulation of Trucks (Commercial Vehicle Operations)
MnDOT is charged with administering and enforcing both state and federal commercial vehicle
safety regulations, including inspections and audits. Regulatory and statutory direction also
covers several areas that directly apply to silica sand transport.
All trucks hauling commodities subject to blowing or dust production, including sand and gravel,
must be covered by full tarps at all times on Federal and State highways, and at any speeds over
30 MPH on local Minnesota roads, compliant with M.S.169.81.
Condition of equipment must be maintained by the operator at all times to ensure safe operations
of the vehicle and to minimize risk and impacts to other traffic. This includes condition of tires,
brakes, signals, operating controls, installed safety equipment, and potential for spill or leakage
of commodities.
Legal weight loadings must be observed at all times, to minimize and control wear on roads and
bridges. Sand transporters are limited to the default weight limits of 80,000 pounds GVW on five
axles without exception. The Department of Public Safety (DPS) may enforce these limits
through ticketing and fines, and both DPS and MnDOT provide safety data to the national driver
and carrier data bases, which may trigger probation or suspension of driver and carrier licensing.
MnDOT maintains strategically located Weigh-In-Motion scales and cameras to provide
observation and protection of key infrastructure, including major bridges, to monitor operations
within legal limits.
4. General Highway Safety: Motorized Vehicle and Non-Motorized Shared Use on
Identified Mine-Haul Routes
MnDOT and local authorities have a direct responsibility for the safety of all highway users.
Heavy truck traffic on a historically light-use road has the potential to significantly increase
safety risks for other users, in particular non-motorized use.
Pedestrian, bicycle, and horse & buggy conflicts have been identified in the potential mining
areas. This is due to the presence of heavy recreational uses in the region and to local
communities such as the Amish, who by choice use horse and buggy for normal transportation.
Unless specific allowances are made in traffic routing or road design, such as adequate shoulder
widths, these conflicting uses may increase the incidence of serious or fatal accidents.
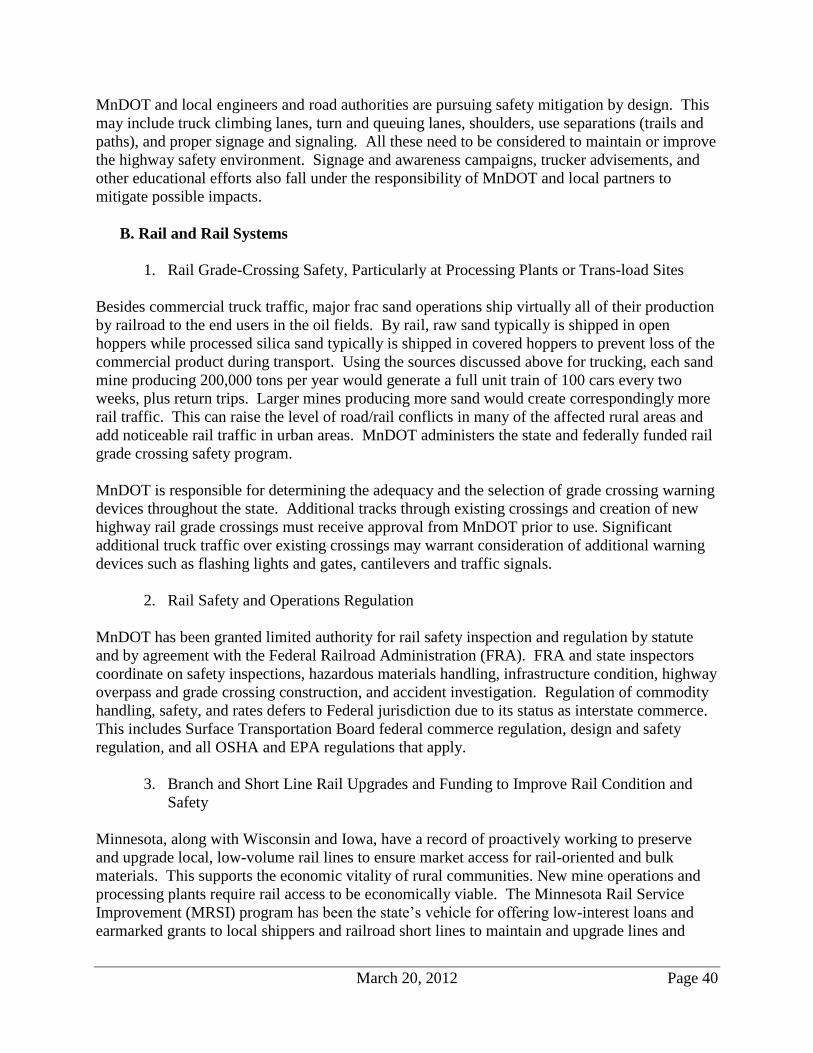
March 20, 2012 Page 40
MnDOT and local engineers and road authorities are pursuing safety mitigation by design. This
may include truck climbing lanes, turn and queuing lanes, shoulders, use separations (trails and
paths), and proper signage and signaling. All these need to be considered to maintain or improve
the highway safety environment. Signage and awareness campaigns, trucker advisements, and
other educational efforts also fall under the responsibility of MnDOT and local partners to
mitigate possible impacts.
B. Rail and Rail Systems
1. Rail Grade-Crossing Safety, Particularly at Processing Plants or Trans-load Sites
Besides commercial truck traffic, major frac sand operations ship virtually all of their production
by railroad to the end users in the oil fields. By rail, raw sand typically is shipped in open
hoppers while processed silica sand typically is shipped in covered hoppers to prevent loss of the
commercial product during transport. Using the sources discussed above for trucking, each sand
mine producing 200,000 tons per year would generate a full unit train of 100 cars every two
weeks, plus return trips. Larger mines producing more sand would create correspondingly more
rail traffic. This can raise the level of road/rail conflicts in many of the affected rural areas and
add noticeable rail traffic in urban areas. MnDOT administers the state and federally funded rail
grade crossing safety program.
MnDOT is responsible for determining the adequacy and the selection of grade crossing warning
devices throughout the state. Additional tracks through existing crossings and creation of new
highway rail grade crossings must receive approval from MnDOT prior to use. Significant
additional truck traffic over existing crossings may warrant consideration of additional warning
devices such as flashing lights and gates, cantilevers and traffic signals.
2. Rail Safety and Operations Regulation
MnDOT has been granted limited authority for rail safety inspection and regulation by statute
and by agreement with the Federal Railroad Administration (FRA). FRA and state inspectors
coordinate on safety inspections, hazardous materials handling, infrastructure condition, highway
overpass and grade crossing construction, and accident investigation. Regulation of commodity
handling, safety, and rates defers to Federal jurisdiction due to its status as interstate commerce.
This includes Surface Transportation Board federal commerce regulation, design and safety
regulation, and all OSHA and EPA regulations that apply.
3. Branch and Short Line Rail Upgrades and Funding to Improve Rail Condition and
Safety
Minnesota, along with Wisconsin and Iowa, have a record of proactively working to preserve
and upgrade local, low-volume rail lines to ensure market access for rail-oriented and bulk
materials. This supports the economic vitality of rural communities. New mine operations and
processing plants require rail access to be economically viable. The Minnesota Rail Service
Improvement (MRSI) program has been the state’s vehicle for offering low-interest loans and
earmarked grants to local shippers and railroad short lines to maintain and upgrade lines and
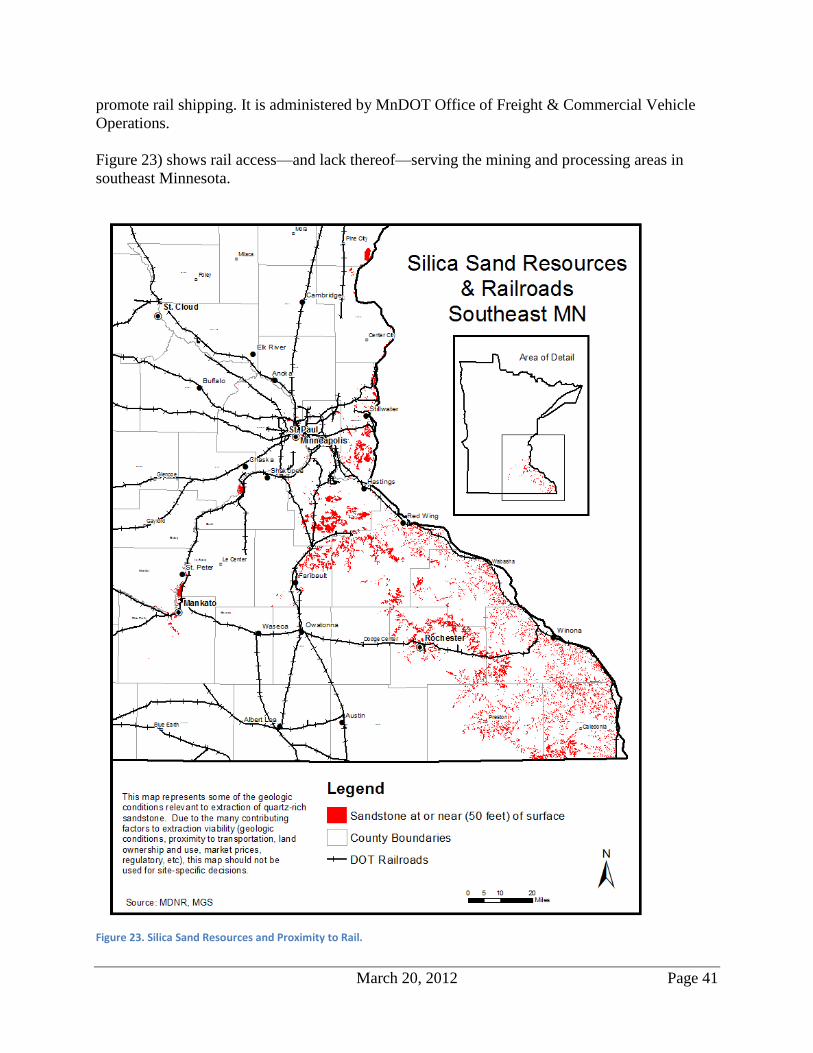
March 20, 2012 Page 41
promote rail shipping. It is administered by MnDOT Office of Freight & Commercial Vehicle
Operations.
Figure 23) shows rail access—and lack thereof—serving the mining and processing areas in
southeast Minnesota.
Figure 23. Silica Sand Resources and Proximity to Rail.
March 20, 2012 Page 42
C. Barge and Barge Systems
Silica sand is hauled by barge in applications similar to rail, open or closed depending on
condition of sand. Environmental Protection Agency air and water rules apply. Normal payload
is 1,500 tons per barge. A river tow (collection of barges under control of a single towboat) may
carry 22,500 tons or more.
There are over two dozen intermodal freight terminals located on the Mississippi and Minnesota
Rivers in Minnesota (MnDOT) (Figure 24), though only one currently handles silica sand. Port
activities, like commercial truck, rail, and barge transport, constitute interstate commerce and
cannot be materially restricted by local & state jurisdictions.
Figure 24. Intermodal Freight Terminals in Minnesota. Source: MnDOT.
March 20, 2012 Page 43
D. Potential Research Topics
Air quality issues (ambient air and impacts) created by transportation:
-loading and transporting
-by truck
-by rail
-by barge
-near mines
-near processing sites
-near loading sites
Traffic projections: If an analysis is prepared projecting demand for silica sand, it
may be possible to model projected truck and rail traffic to analyze potential impacts
on transportation infrastructure.
Funding options for local road jurisdictions: Local roads designed for lower
volumes that state highways are being impacted by concentrated truck traffic from
sand mining industry operations. Local jurisdictions have limited resources to address
this. Are the funding means available to local and state government adequate to
address the needs?
How many barge terminals are capable of serving the silica sand industry? Is
there a potential for more?
Do publicly owned transportation terminals (truck, rail, barge) have
management or regulatory differences if privately owned versus publicly
owned? If so, which terminals are owned by public entities (port authorities,
cities, etc.) versus privately owned?
What EPA air and water rules apply for rail and barge facilities related to
transporting silica sand? How are the rules implemented?
March 20, 2012 Page 44
VIII. GOVERNANCE
A. Local Government Land Use, Planning
The following summary of a discussion found in an article by the Federal Reserve Ninth District
is a good description of the land use planning challenges faced by residents, local governments,
and the mining industry.
Sand mining has sparked protests from residents who have formed groups to monitor
mining activity and challenge projects at normally uneventful township and village board
meetings. Many of these are small communities where controversy was rare at their
meetings. Local governments across the region have responded to the controversy
around frac sand mining by imposing bans on new mining operations or expansions.
Federal and state governments have some oversight of nonmetallic mines but sand
mining in Minnesota and Wisconsin is mostly regulated at the local level. This includes
zoning codes and land use permits that require mining companies to fulfill specified
conditions. Moratoriums on sand mining enacted by municipal, town and county boards
are intended to provide a chance for community leaders and planners to consider stricter
regulations for sand mining (Davies, 2012).
Air quality and water quality regulation is described in the respective sections of this report, but
in Minnesota and other states, land use planning and regulatory authority rests primarily with
local government: county, municipality, township. Such authorities are granted by enabling acts
in Minnesota Statutes. There are similarities across the planning and regulatory powers of these
three types of local government. However, there also are differences.
Comprehensive planning, or planning that addresses a local government’s decision making for
the future, is required only in seven county metropolitan area around Minneapolis and St. Paul.
This includes the following counties: Anoka, Carver, Dakota, Hennepin, Ramsey, Scott, and
Washington. The comprehensive plan of communities in these counties must include specified
elements such as land use, housing, parks and opens space, transportation, surface water
management, utilities, capital improvements, and the like. In other areas of the state,
communities are not required to prepare comprehensive plan (often called general plans) but
have the authority to do so. One of the important purposes of a comprehensive plan is to avoid
land use conflicts caused by incompatible uses locating in near proximity to one another. A
large sand processing facility next to a retail or residential area might be an example. The noise,
dust, and light created by industrial activities can and should be considered when planning the
future of a community.
Unfortunately, many communities choose not to develop comprehensive plans for reasons of
cost, nonchalance, or ideology. The lack of a long range, comprehensive plan often leaves the
county, city, or town without guidance or policies on how to deal with issues that arise.
Once policies are established by a comprehensive plan, they are implemented by official controls
such as a zoning code, subdivision regulations, or other ordinances. Local government approval
of a mining and/or processing facility typically is granted through a conditional use permit or
March 20, 2012 Page 45
special use permit as well as other elements of a zoning ordinance or official control. There
might be a site plan approval, building permit, or others, depending on the specifics of the
official controls of the government unit. These official controls, or regulations, are best when
written and administered to promote and implement the policies established by the long range
plan. Instead, revisions to official controls often are driven solely by reaction to a project
proposal. Such situations lack the guidance of long range visions and policies.
Planning and regulatory questions become more complex when considering transportation
issues. Major roadways fall under several jurisdictions. A municipality has jurisdiction over its
own roads, but access onto a county highway requires approval by the county. Access to a state
highway requires review and approval by MnDOT. Different roads are intended for differing
types and volumes of traffic. “Main Street” in many small cities is a state highway. What might
seem normal for a state highway—for example, dozens or even hundreds of sand trucks in a
day—often is considered disruptive and destructive to a small town’s main street character.
While it is easy in retrospect to say that such conflicts could or should have been foreseen and
avoided through good land use and transportation planning, the fact is that such situations are
common and cannot be shrugged off.
The conflicts are not limited to ‘main street’ locations or transportation issues. As described
earlier, communities known for their scenic attributes draw great numbers of regional visitors,
which has created a tourism economy. Destruction of bluffs that contain silica sand or the
creation of large mines in scenic areas, along with the associated noise, traffic, dust, and other
disruptive elements may significantly reduce the attractiveness of these areas for visitors. An
additional fear is that a mining economy is limited to the time during which the sand is available
and profitable to mine. Once the landscape has been altered, tourism may no longer be an
option.
Local governments with mining experience typically require reclamation of a mining site. This
will include landscaping, adequate water management design, ensuring stable land on slopes, and
other elements. This ensures a site will not be left in an unstable or unsightly condition.
However, it does not avoid the changes discussed above—elimination of bluffs or other scenic
features, impacts on small town economies, unknown air quality issues, etc.—that have raised
concerns among many residents of areas potentially affected by the changes.
The spectrum of planning and regulatory knowledge and experience is vast. Not all counties
have the same regulatory controls. Ordinances from one city to another can vary greatly.
Though there are issues with silica sand mining that don’t apply to aggregate mining, there are
common elements. A governmental unit that has been reviewing and regulating aggregate
mining for decades will have a greater ability to deal with silica sand mining than a
governmental unit that has no history with mining of any kind. Nonetheless, because of the
separate elements of mining, processing, and transportation, the nature of sand mining is posing
new challenges even for experienced governmental units.
These complexities and conflicts point out the need for inter-governmental, multidisciplinary
cooperation, coordination, and planning. Local government authorities and regulatory practices
should be reviewed and amended to address current needs. A long range plan and official
March 20, 2012 Page 46
controls based on current needs and the missions and requirements of other jurisdictions will
better accommodate real world situations.
B. State Agency Rules and Permitting
Several chapters in this report discuss state rules and permitting standards. Such regulatory tools
were established to address many of the issues that arise with the silica sand industry elements
(mining, processing, transportation). Permits are important tools and when standards are met and
permitting processes implemented they are very effective tools in accomplishing their specific
goals. Nonetheless, it is worthwhile to ask whether or not the scope of the rules and permits
address concerns as well as possible and, if not, what can be improved. The silica sand issues
present a good venue for such discussions.
As noted above, inter-governmental understanding and planning is needed. An examination of
state rules and permit standards should include how state rules and local controls interact: how
they affect, depend on, and maybe even contradict one another. There may be assumptions made
in one government level that specific safeguards are in place at other government levels.
C. Environmental Review Categories
Minnesota Rules 4410 were prepared to implement the environmental review program
established by Minnesota Statutes Chapter 116D, the Minnesota Environmental Protection Act
(MEPA). The Rules include mandatory categories for environmental review and the responsible
governmental unit (RGU) for each category. Each category included a threshold, usually based
on project size, the crossing of which places the project in the mandatory review category. The
review might be an Environmental Assessment Worksheet (EAW) or an Environmental Impact
Statement (EIS). The following mandatory review categories do or may apply to silica sand
mining facilities:
4410.4300, Mandatory Environmental Assessment Worksheet
Subp. 12. Nonmetallic mineral mining. RGU: local government
Subp. 14. Industrial, commercial, and institutional facilities. RGU: local government
Subp. 15. Air pollution. RGU: Minnesota Pollution Control Agency
Subp. 24. Water appropriation and impoundments. RGU: local government
Subp. 27. Wetlands and public waters. RGU: local government
Subp. 36. Land use conversion. RGU: local government
Subp. 36a. Land conversion in shoreland. RGU: local government
4410.4400, Mandatory Environmental Impact Statement
Subp. 9. Nonmetallic mineral mining. RGU: local government
Subp. 11. Industrial, commercial, and institutional facilities. RGU: local government
Subp. 20. Wetlands and public waters. RGU: local government
Subp. 27. Land conversion in shorelands. RGU: local government
March 20, 2012 Page 47
The rules also give governmental units, including the EQB, the authority to require an EAW for
projects that may have the potential for significant environmental effect even if the project does
not cross a mandatory review threshold.
The various elements of the silica sand industry (mining, processing, transporting) create a
significant challenge in determining if a proposed project crosses a size threshold established by
the mandatory categories and thus requires environmental review. The concepts of ‘phased
project’, ‘connected actions’ will apply. The rules require that “multiple projects and multiple
stages of a single project that are connected actions or phased actions must be considered in total
when comparing the project or projects to the thresholds” of the mandatory review categories.
For example, several mines operated by the same firm often are phased actions. A new mine and
its new processing facility located off site may well be connected actions.
D. Noise
Minnesota Rules 7030 establish maximum noise levels in noise area classifications. These
standards may or may not be an issue near sand mining or processing facilities. Noise
monitoring to ensure the standards are met requires specialized expertise.
E. Quality of Life
There are intangibles that should not be overlooked. The rural character of an area and the small
town character of a city are examples. Many people believe these considerations extend beyond
discussions of specific regulatory authorities or rights. In fact, planning, regulations, and
property rights established by law are tools for identifying, prioritizing, promoting, and
protecting these intangibles.
F. Potential Research Topics
Guidance and Best Management Practices for Local Governmental Units: The
nature of sand mining with its varied elements is posing challenges even for
experienced governmental units. A multi-discipline study resulting in a guidance
document would be useful for local governments. This effort would examine and
provide guidance on such things as:
- statutory authorities for planning and regulating
- review topics and information needs, e.g., water quality, water use quantity, air
quality
- identifying location and impacts on existing natural resources
- provision of and maintaining necessary infrastructure
- how to address the different elements: mining, processing, transporting
- best management practices for local governments in permitting and ongoing
monitoring
- best management practices for facility operators for planning and managing
facilities
- reclamation methods and requirements
March 20, 2012 Page 48
Additional Review and Guidance on Connected Actions and Phased Actions in
Environmental Review: Further examination of these concepts as they apply to the
varied elements of the silica sand mining industry would be useful to local
governments.
Interaction of Regulatory Practices Across State and Local Governments: An
examination of state rules and permit standards as well as local government
authorities and regulatory practices should include how state rules and local controls
interact: how they affect, depend on, and possibly contradict one another. There may
be assumptions made in one government level that specific safeguards are in place at
other government levels.
Subsurface Rights vs. Surface Rights: Questions have arisen regarding subsurface
mining rights and the effects on surface rights owned by another person.
March 20, 2012 Page 49
IX. POTENTIAL IMPACTS ON SENSITIVE RESOURCES
Silica sand mining has the potential to negatively affect many sensitive resources through the
destruction of rare plants, rare native plant communities, or habitat for rare animals. Rare
features may also be affected through the introduction or spread of invasive species and through
increased erosion, sedimentation, or pollution. The resources that will actually be affected will
depend on the specific areas that will be mined. Depending on the extent to which the silica sand
resources are mined, the cumulative effect on Minnesota’s sensitive resources may be
significant.
To determine potential impacts to sensitive ecological resources, the geographic extent of the
silica sand deposits less than 50 feet deep was compared to the locations of Audubon Important
Bird Areas, Minnesota Biological Survey (MBS) Important Prairie Landscapes, MBS Sites of
Biodiversity Significance, MBS Native Plant Communities, and known occurrences of rare
species. Not surprisingly, the majority of these resources are associated with the Mississippi, St.
Croix, Minnesota, Cannon, Zumbro, and Root rivers. The MBS systematically collects,
interprets, and delivers baseline data on the distribution and ecology of rare plants, rare animals,
native plant communities, and functional landscapes needed to guide decision making.
A. State Wildlife Action Plan
The State Wildlife Action Plan identifies Species in Greatest Conservation Need (SGCN) and
Key Habitats for each ecological subsection within Minnesota. Silica sand resources in
Minnesota are found predominantly within the Blufflands, Rochester Plateau, Oak Savanna, and
St. Paul-Baldwin Plains and Moraines subsections (Figure 25).
The Blufflands Subsection is dominated by the Mississippi River and is characterized by bluffs,
prairies, and stream valleys. Numerous cold-water streams feed major rivers and Mesic
Hardwood Forests and Floodplain Forests grow along these streams and rivers. This subsection
provides a critical migratory corridor for birds, has the highest number of SGCN of all the
subsections, is the most important subsection for reptiles, and is one of the most important
subsections for mollusks.
The Rochester Plateau Subsection is an area of level to gently rolling terrain that contains the
headwaters of several rivers as well as some cold-water trout streams.
The Oak Savanna Subsection consists of gently rolling hills that historically were covered with
oak savanna, tallgrass prairie, and maple-basswood forest.
The St. Paul-Baldwin Plains and Moraines Subsection is dominated by the Mississippi and St.
Croix rivers. Historically, oak savanna, tallgrass prairie, and maple-basswood forest were
common. This subsection is a significant migratory corridor for birds and has a large diversity of
mussels and small stream fish.
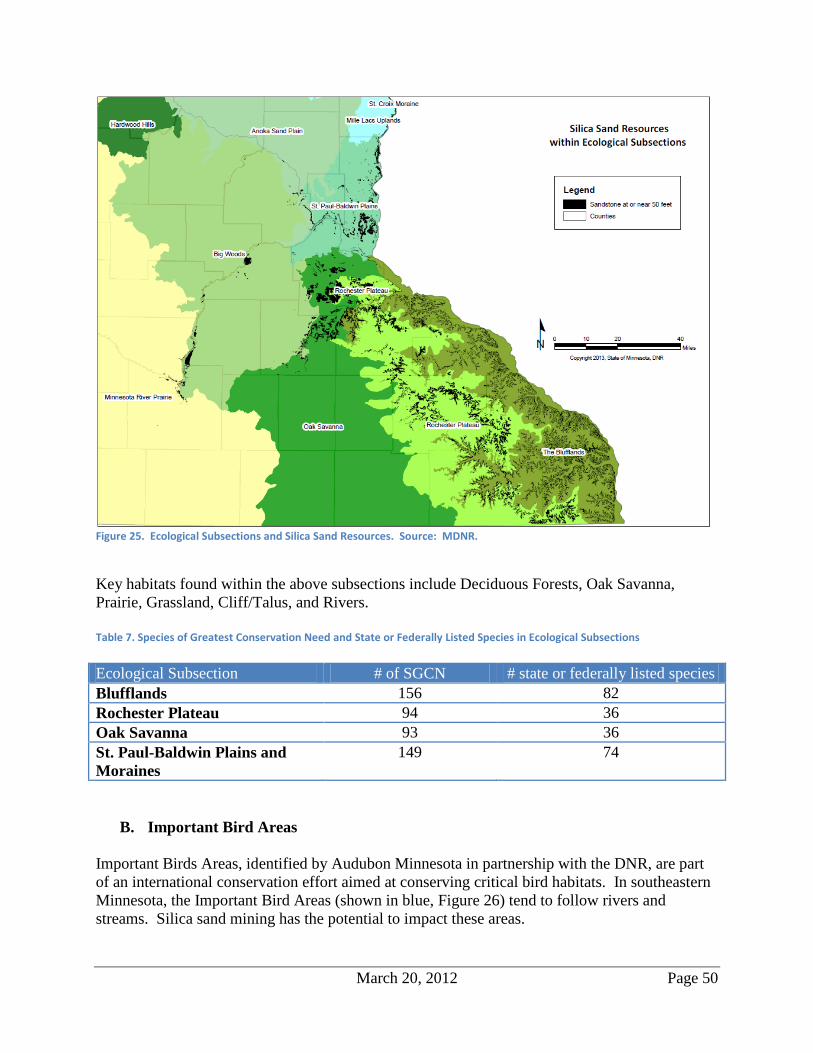
March 20, 2012 Page 50
Figure 25. Ecological Subsections and Silica Sand Resources. Source: MDNR.
Key habitats found within the above subsections include Deciduous Forests, Oak Savanna,
Prairie, Grassland, Cliff/Talus, and Rivers.
Table 7. Species of Greatest Conservation Need and State or Federally Listed Species in Ecological Subsections
Ecological Subsection # of SGCN # state or federally listed species
Blufflands 156 82
Rochester Plateau 94 36
Oak Savanna 93 36
St. Paul-Baldwin Plains and
Moraines
149 74
B. Important Bird Areas
Important Birds Areas, identified by Audubon Minnesota in partnership with the DNR, are part
of an international conservation effort aimed at conserving critical bird habitats. In southeastern
Minnesota, the Important Bird Areas (shown in blue, Figure 26) tend to follow rivers and
streams. Silica sand mining has the potential to impact these areas.
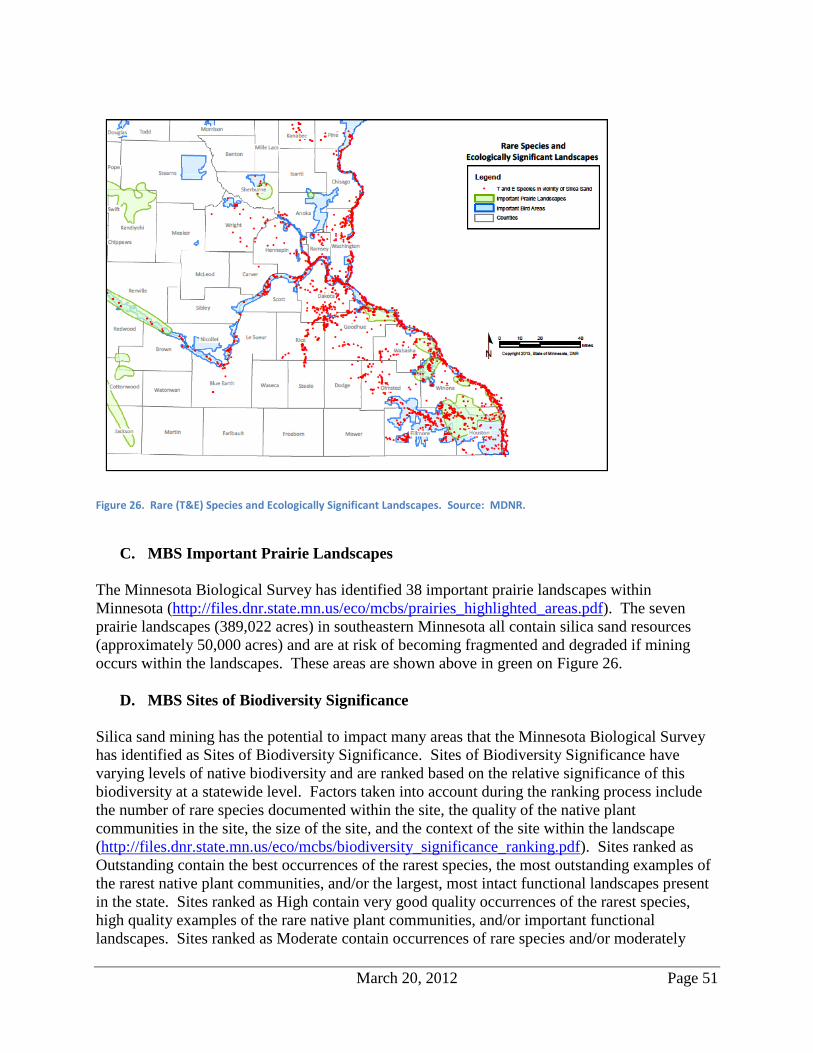
March 20, 2012 Page 51
Figure 26. Rare (T&E) Species and Ecologically Significant Landscapes. Source: MDNR.
C. MBS Important Prairie Landscapes
The Minnesota Biological Survey has identified 38 important prairie landscapes within
Minnesota (http://files.dnr.state.mn.us/eco/mcbs/prairies_highlighted_areas.pdf). The seven
prairie landscapes (389,022 acres) in southeastern Minnesota all contain silica sand resources
(approximately 50,000 acres) and are at risk of becoming fragmented and degraded if mining
occurs within the landscapes. These areas are shown above in green on Figure 26.
D. MBS Sites of Biodiversity Significance
Silica sand mining has the potential to impact many areas that the Minnesota Biological Survey
has identified as Sites of Biodiversity Significance. Sites of Biodiversity Significance have
varying levels of native biodiversity and are ranked based on the relative significance of this
biodiversity at a statewide level. Factors taken into account during the ranking process include
the number of rare species documented within the site, the quality of the native plant
communities in the site, the size of the site, and the context of the site within the landscape
(http://files.dnr.state.mn.us/eco/mcbs/biodiversity_significance_ranking.pdf). Sites ranked as
Outstanding contain the best occurrences of the rarest species, the most outstanding examples of
the rarest native plant communities, and/or the largest, most intact functional landscapes present
in the state. Sites ranked as High contain very good quality occurrences of the rarest species,
high quality examples of the rare native plant communities, and/or important functional
landscapes. Sites ranked as Moderate contain occurrences of rare species and/or moderately
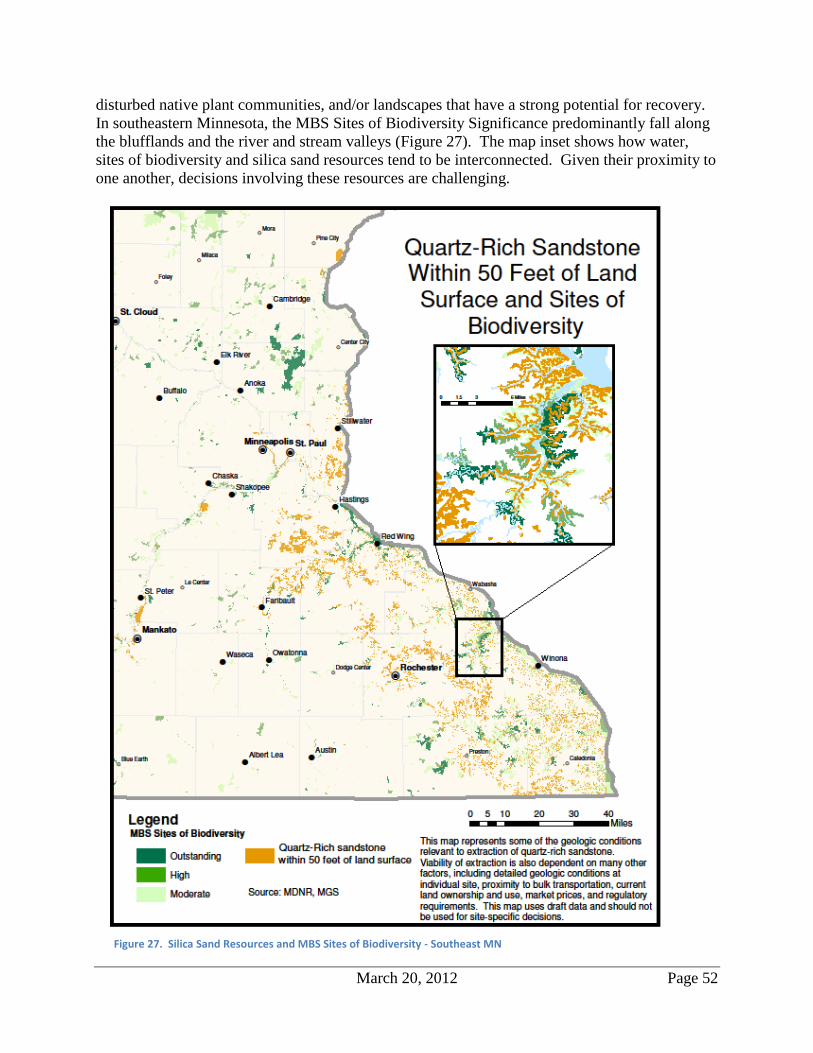
March 20, 2012 Page 52
disturbed native plant communities, and/or landscapes that have a strong potential for recovery.
In southeastern Minnesota, the MBS Sites of Biodiversity Significance predominantly fall along
the blufflands and the river and stream valleys (Figure 27). The map inset shows how water,
sites of biodiversity and silica sand resources tend to be interconnected. Given their proximity to
one another, decisions involving these resources are challenging.
Figure 27. Silica Sand Resources and MBS Sites of Biodiversity - Southeast MN
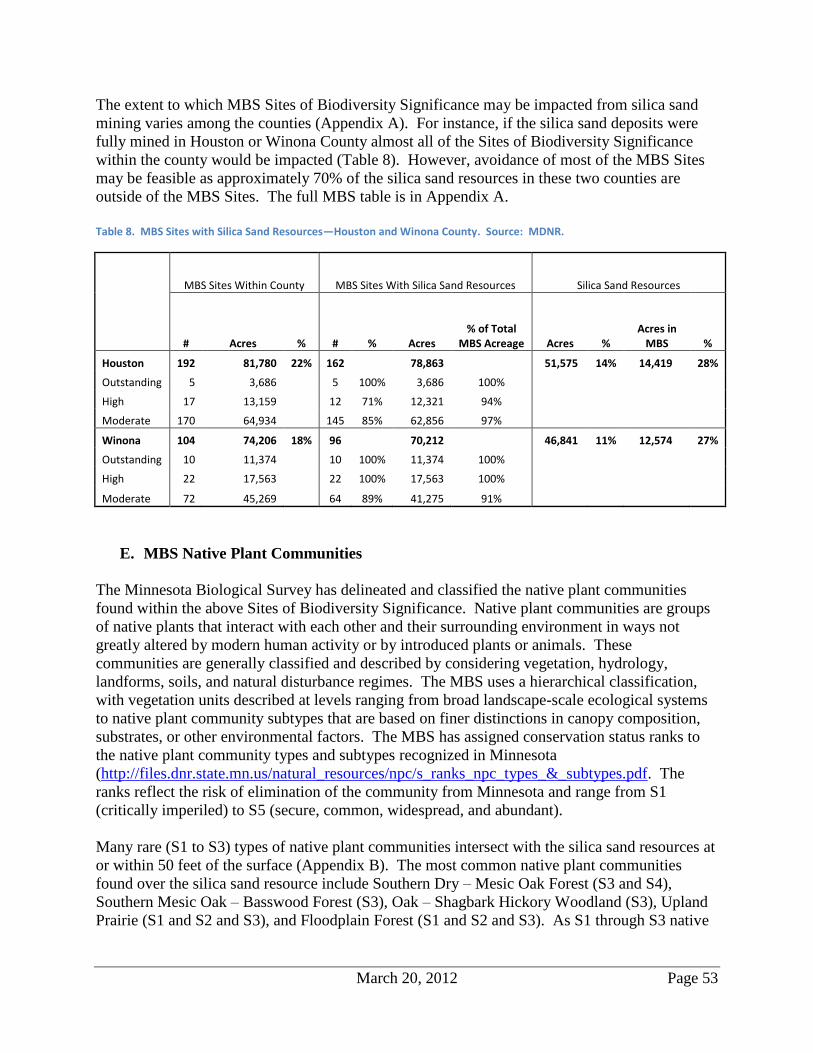
March 20, 2012 Page 53
The extent to which MBS Sites of Biodiversity Significance may be impacted from silica sand
mining varies among the counties (Appendix A). For instance, if the silica sand deposits were
fully mined in Houston or Winona County almost all of the Sites of Biodiversity Significance
within the county would be impacted (Table 8). However, avoidance of most of the MBS Sites
may be feasible as approximately 70% of the silica sand resources in these two counties are
outside of the MBS Sites. The full MBS table is in Appendix A.
Table 8. MBS Sites with Silica Sand Resources—Houston and Winona County. Source: MDNR.
MBS Sites Within County MBS Sites With Silica Sand Resources Silica Sand Resources
# Acres % # % Acres % of Total
MBS Acreage Acres % Acres in
MBS %
Houston 192 81,780 22% 162
78,863
51,575 14% 14,419 28%
Outstanding 5 3,686
5 100% 3,686 100%
High 17 13,159
12 71% 12,321 94%
Moderate 170 64,934 145 85% 62,856 97%
Winona 104 74,206 18% 96
70,212
46,841 11% 12,574 27%
Outstanding 10 11,374
10 100% 11,374 100%
High 22 17,563
22 100% 17,563 100%
Moderate 72 45,269 64 89% 41,275 91%
E. MBS Native Plant Communities
The Minnesota Biological Survey has delineated and classified the native plant communities
found within the above Sites of Biodiversity Significance. Native plant communities are groups
of native plants that interact with each other and their surrounding environment in ways not
greatly altered by modern human activity or by introduced plants or animals. These
communities are generally classified and described by considering vegetation, hydrology,
landforms, soils, and natural disturbance regimes. The MBS uses a hierarchical classification,
with vegetation units described at levels ranging from broad landscape-scale ecological systems
to native plant community subtypes that are based on finer distinctions in canopy composition,
substrates, or other environmental factors. The MBS has assigned conservation status ranks to
the native plant community types and subtypes recognized in Minnesota
(http://files.dnr.state.mn.us/natural_resources/npc/s_ranks_npc_types_&_subtypes.pdf. The
ranks reflect the risk of elimination of the community from Minnesota and range from S1
(critically imperiled) to S5 (secure, common, widespread, and abundant).
Many rare (S1 to S3) types of native plant communities intersect with the silica sand resources at
or within 50 feet of the surface (Appendix B). The most common native plant communities
found over the silica sand resource include Southern Dry – Mesic Oak Forest (S3 and S4),
Southern Mesic Oak – Basswood Forest (S3), Oak – Shagbark Hickory Woodland (S3), Upland
Prairie (S1 and S2 and S3), and Floodplain Forest (S1 and S2 and S3). As S1 through S3 native
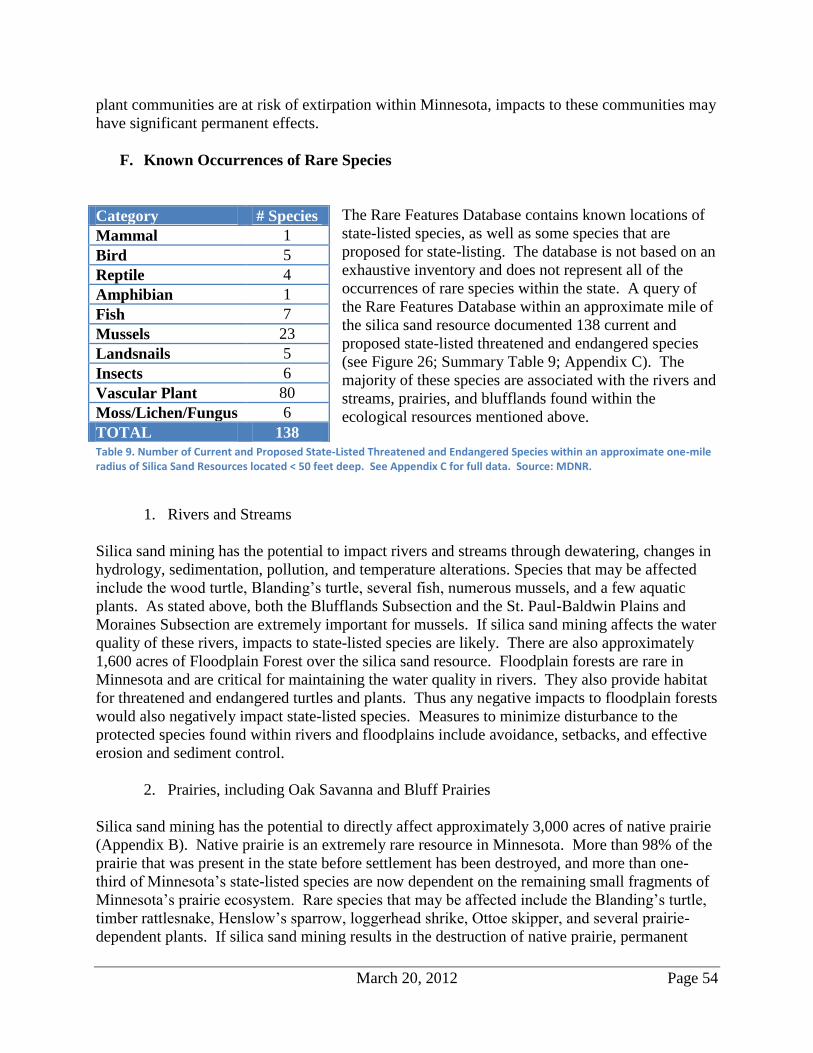
March 20, 2012 Page 54
plant communities are at risk of extirpation within Minnesota, impacts to these communities may
have significant permanent effects.
F. Known Occurrences of Rare Species
The Rare Features Database contains known locations of
state-listed species, as well as some species that are
proposed for state-listing. The database is not based on an
exhaustive inventory and does not represent all of the
occurrences of rare species within the state. A query of
the Rare Features Database within an approximate mile of
the silica sand resource documented 138 current and
proposed state-listed threatened and endangered species
(see Figure 26; Summary Table 9; Appendix C). The
majority of these species are associated with the rivers and
streams, prairies, and blufflands found within the
ecological resources mentioned above.
Table 9. Number of Current and Proposed State-Listed Threatened and Endangered Species within an approximate one-mile radius of Silica Sand Resources located < 50 feet deep. See Appendix C for full data. Source: MDNR.
1. Rivers and Streams
Silica sand mining has the potential to impact rivers and streams through dewatering, changes in
hydrology, sedimentation, pollution, and temperature alterations. Species that may be affected
include the wood turtle, Blanding’s turtle, several fish, numerous mussels, and a few aquatic
plants. As stated above, both the Blufflands Subsection and the St. Paul-Baldwin Plains and
Moraines Subsection are extremely important for mussels. If silica sand mining affects the water
quality of these rivers, impacts to state-listed species are likely. There are also approximately
1,600 acres of Floodplain Forest over the silica sand resource. Floodplain forests are rare in
Minnesota and are critical for maintaining the water quality in rivers. They also provide habitat
for threatened and endangered turtles and plants. Thus any negative impacts to floodplain forests
would also negatively impact state-listed species. Measures to minimize disturbance to the
protected species found within rivers and floodplains include avoidance, setbacks, and effective
erosion and sediment control.
2. Prairies, including Oak Savanna and Bluff Prairies
Silica sand mining has the potential to directly affect approximately 3,000 acres of native prairie
(Appendix B). Native prairie is an extremely rare resource in Minnesota. More than 98% of the
prairie that was present in the state before settlement has been destroyed, and more than one-
third of Minnesota’s state-listed species are now dependent on the remaining small fragments of
Minnesota’s prairie ecosystem. Rare species that may be affected include the Blanding’s turtle,
timber rattlesnake, Henslow’s sparrow, loggerhead shrike, Ottoe skipper, and several prairie-
dependent plants. If silica sand mining results in the destruction of native prairie, permanent
Category # Species
Mammal 1
Bird 5
Reptile 4
Amphibian 1
Fish 7
Mussels 23
Landsnails 5
Insects 6
Vascular Plant 80
Moss/Lichen/Fungus 6
TOTAL 138
March 20, 2012 Page 55
negative impacts to state-listed species are likely. Prairies that are adjacent to mining activities
may also become degraded through invasive species, surface runoff, or other disturbance.
G. Potential Research Topics
Site-Specific Data: Given the multitude of rare species and native plant communities
in the vicinity of the silica sand resources it is highly probable that silica sand mining
will negatively affect rare resources to some degree. However, without site-specific
details it is impossible to determine which sensitive ecological resources will be
impacted and the extent to which they will be impacted (e.g., Takings Permits).
Development Pressure: Calculating the surface area of silica sand resources within
each county that resides outside of the MBS Sites of Biodiversity Significance or
Important Prairie Landscapes will help to assess the amount of development pressure
that will occur within these ecologically significant areas.
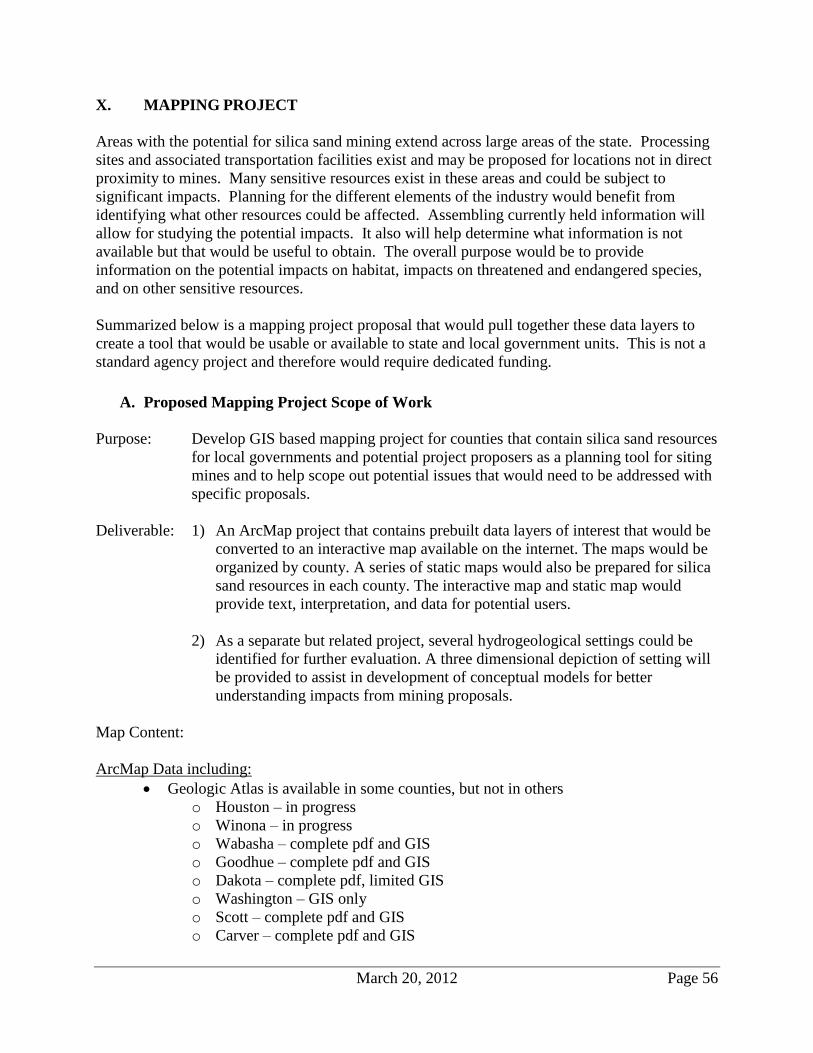
March 20, 2012 Page 56
X. MAPPING PROJECT
Areas with the potential for silica sand mining extend across large areas of the state. Processing
sites and associated transportation facilities exist and may be proposed for locations not in direct
proximity to mines. Many sensitive resources exist in these areas and could be subject to
significant impacts. Planning for the different elements of the industry would benefit from
identifying what other resources could be affected. Assembling currently held information will
allow for studying the potential impacts. It also will help determine what information is not
available but that would be useful to obtain. The overall purpose would be to provide
information on the potential impacts on habitat, impacts on threatened and endangered species,
and on other sensitive resources.
Summarized below is a mapping project proposal that would pull together these data layers to
create a tool that would be usable or available to state and local government units. This is not a
standard agency project and therefore would require dedicated funding.
A. Proposed Mapping Project Scope of Work
Purpose: Develop GIS based mapping project for counties that contain silica sand resources
for local governments and potential project proposers as a planning tool for siting
mines and to help scope out potential issues that would need to be addressed with
specific proposals.
Deliverable: 1) An ArcMap project that contains prebuilt data layers of interest that would be
converted to an interactive map available on the internet. The maps would be
organized by county. A series of static maps would also be prepared for silica
sand resources in each county. The interactive map and static map would
provide text, interpretation, and data for potential users.
2) As a separate but related project, several hydrogeological settings could be
identified for further evaluation. A three dimensional depiction of setting will
be provided to assist in development of conceptual models for better
understanding impacts from mining proposals.
Map Content:
ArcMap Data including:
Geologic Atlas is available in some counties, but not in others
o Houston – in progress
o Winona – in progress
o Wabasha – complete pdf and GIS
o Goodhue – complete pdf and GIS
o Dakota – complete pdf, limited GIS
o Washington – GIS only
o Scott – complete pdf and GIS
o Carver – complete pdf and GIS
March 20, 2012 Page 57
o Sibley – complete pdf and GIS
o Nicollet – complete pdf and GIS
o LeSueur – no atlas
o Blue Earth – complete pdf and GIS
The following GIS data sources are available from the MDNR:
Karst features
Trout streams
Public waters
Official Fens
Sites of Biodiversity (moderate, high, and outstanding)
Land cover data
LIDAR topographic data
Other GIS data sources available from others:
Railroads
Highway corridors
Population Centers
Silica sand resources within 50 feet of the ground surface
Potential Additional Data: These data layers would need to be assembled from a variety of
sources, including individual local governments. Some work has been accomplished on this but
the data is varied and requires verification and updating. These layers would be useful in
considering cumulative potential effects, connected actions, and phased actions.
Silica sand mines and processing facilities
Sensitive populations:
schools
licensed daycare centers
nursing homes
hospitals
clinics
Wetlands
Prevailing wind
Wind speed
B. Level of Effort
Production of a web based interactive map and static county maps would require the following
tasks:
Compilation and verification of data (meta data)
Map production
Development of web instructions, caveats, and data limitations
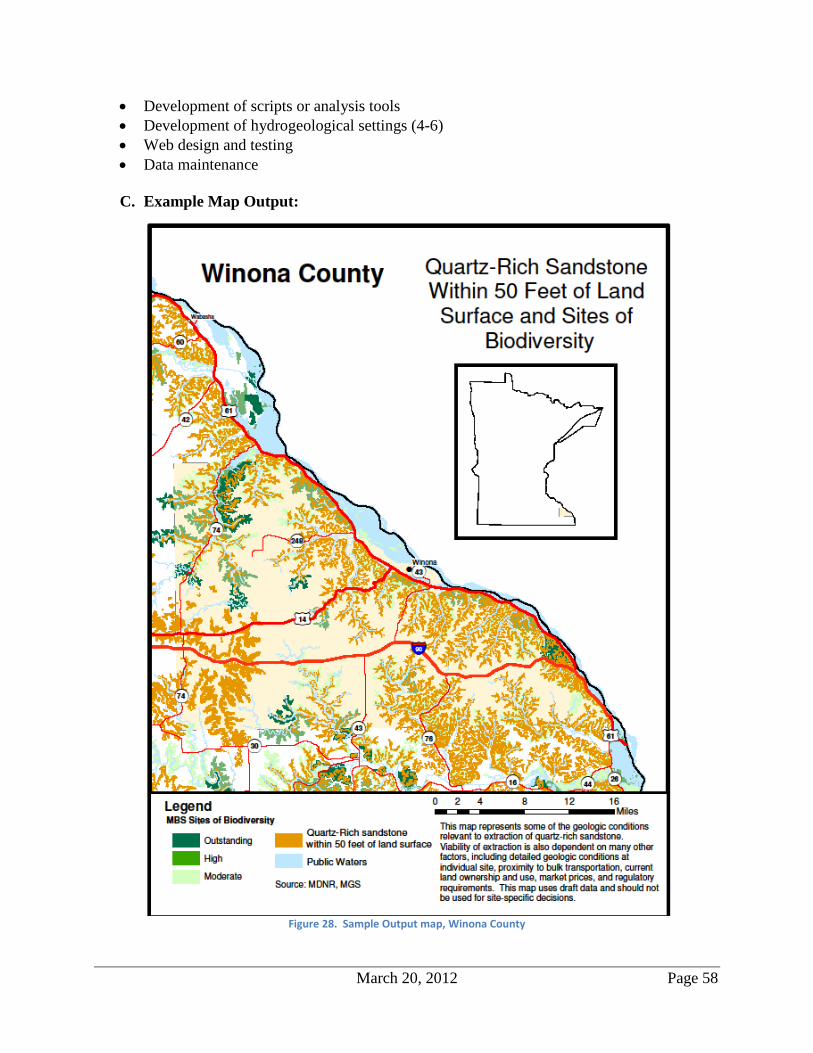
March 20, 2012 Page 58
Development of scripts or analysis tools
Development of hydrogeological settings (4-6)
Web design and testing
Data maintenance
C. Example Map Output:
Figure 28. Sample Output map, Winona County
March 20, 2012 Page 59
XV. POTENTIAL RESEARCH TOPICS
The following list assembles the potential research topics listed in the chapters.
FRACKING AND SAND MARKET SUMMARIES, SOCIOECONOMICS
Future market for silica sand for hydrofracking: Data from industry and government
sources could be assembled and compared to consider market projections of demand. This
likely will involve market projections for oil and gas.
Economical depth for mining: We know where the sand is, but the depth at which mining
is economical is changing. In the past, it was not economical to mine sand beyond certain
depths. With the surge in demand due to hydrofracking, this changed. Further consideration
of this may be useful.
Impacts on property values: It may be possible to assemble data for properties near mines,
processing sites, and transportation facilities to see what, if any, property value changes have
occurred and if the changes are correlated to those activities and facilities. Such studies have
been conducted on other types of land use to address questions of the impacts on property
values in the vicinity. However, the sand facilities may be too recently created for any such
analyses to be possible.
Potential effects on tourism: Determining potential effects on tourism would be very
useful. Determining what data and methodology would be needed in order to conduct such a
study is a challenging question in itself.
Tax revenues available: Minnesota Statute 298.75 establishes a tax on aggregate mining,
including silica sand. Property taxes apply as well. It may be useful to assemble information
to describe the potential revenues from these sources and determine what other tax or fee
revenue sources are available.
Employment: Reliable research is scant or nonexistent regarding short term and long term
employment created by silica sand mining.
AIR QUALITY
Concentrations of crystalline silica associated with silica sand mining: As noted above,
there is little or no information on the amount of silica in the air that results from silica sand
mining, processing, and transportation operations. There are plans to monitor silica levels in
ambient air associated with frac sand mining in Wisconsin. However, MPCA reports that the
Wisconsin study is being funded by industry and therefore the results may or may not be
made public. A study funded by the State of Minnesota would ensure public availability of
the results. Such a study might provide a basis for new state air quality standards for silica.
March 20, 2012 Page 60
In order to predict (i.e. model) the ambient impacts of a silica-sand facility, the MPCA needs
additional information, such as: (1) an acceptable PM4 monitoring method, and (2) a set of
silica emission factors for PM4-sized material for processes that occur at silica sand facilities.
Both the monitoring method and emission factors would be used to support any air quality
standard developed by the State.
Health Impact Assessment: A Health Impact Assessment (HIA) is a research and
community engagement process that can be used to help ensure that people’s health and
concerns are being considered when decisions on infrastructure and land use projects are
being made. An HIA on silica sand mining could provide additional health information for
policy makers in determining how to balance health and citizens’ concerns with the
economic benefits of silica sand mining. The HIA would need to include an air monitoring
study. Performing an HIA on silica sand mining is beyond the scope of a standard agency
project and would require dedicated funding. A HIA may take between several months to
several years, depending on the scope and scale of the review.
Alternative proppants: Proppants other than pure silica sand exist that are used for
fracking. Are other proppants, such as manufactured ceramics or resin coated proppants,
viable alternatives to silica sand? Do alternative proppants avoid the air quality and other
potential environmental impacts generated by the silica sand industry elements? Should the
State consider the availability of non-sand proppants in policy decisions regarding sand
mining, processing, and transporting in Minnesota?
WATER QUALITY
Cumulative Impacts: The cumulative impacts to water quality (and quantity) of multiple
silica sand mines in close proximity are not well understood. Monitoring wells should be
required at mines to measure groundwater elevations, flow directions and water quality.
Guidance for Drinking Water: No state or federal drinking water standards exist for
chemicals of potential concern associated with silica sand operations (i.e. flocculants).
Federal regulation regulates the amount of acrylamide in the polymeric coagulant aids to
.05% by weight and the dosage of polymeric coagulant aid which can be added to raw water
to remove particulates to 1ppm
(http://water.epa.gov/drink/contaminants/basicinformation/acrylamide.cfm). If these
chemicals are detected in groundwater, MDH could evaluate whether drinking water
guidance can be developed.
Testing Methods: No commonly accepted analytical testing methods have been developed
for the chemicals of potential concern (i.e. flocculants) and very few commercial laboratories
offer testing for these chemicals – MDH Public Health Laboratory could explore the
feasibility of developing analytical test methods for acrylamide, DADMAC and NDMA.
Despite there being no commonly accepted analytical testing method, Chippewa County,
Wisconsin has required mines to test groundwater and waste material (clay and silt
particulate) for acrylamide.
March 20, 2012 Page 61
Long Term Effects in Karst Regions: More information is needed on the long-term
implications for groundwater quality of reclaimed mines in karst-prone regions of the state –
water quality monitoring should be required following mine closure. The MDNR, University
of Minnesota, and Minnesota Geological Survey are actively researching karst and
groundwater in Minnesota and should be consulted regarding additional mining-related
research needs/opportunities.
WATER QUANTITY
Groundwater: Depth to groundwater has not been fully documented in southeastern
Minnesota.
Cumulative Impacts: The cumulative impacts to water quantity of multiple silica sand
mines in close proximity are not well understood. Monitoring wells should be required at
mines to measure groundwater elevations, flow directions and water quality.
Long Term Effects in Karst Regions: More information is needed on the long-term
implications for groundwater of mines in karst-prone regions of the state. The MDNR,
University of Minnesota, and Minnesota Geological Survey are actively researching karst
and groundwater in Minnesota and should be consulted regarding additional mining-related
research needs/opportunities.
TRANSPORTATION
Air quality issues (ambient air and impacts) created by transportation:
-loading and transporting
-by truck
-by rail
-by barge
-near mines
-near processing sites
-near loading sites
Funding options for local road jurisdictions: Local roads designed for lower volumes that
state highways are being impacted by concentrated truck traffic from sand mining industry
operations. Local jurisdictions have limited resources to address this. Are the funding means
available to local and state government adequate to address the needs?
How many barge terminals are capable of serving the silica sand industry? Is there a
potential for more?
March 20, 2012 Page 62
Do publicly owned transportation terminals (truck, rail, barge) have management or
regulatory differences if privately owned versus publicly owned? If so, which terminals
are owned by public entities (port authorities, cities, etc.) versus privately owned?
What EPA air and water rules apply for barge facilities?
GOVERNANCE
Guidance and Best Management Practices for Local Governmental Units: The nature of
sand mining with its varied elements is posing challenges even for experienced governmental
units. A multi-discipline study resulting in a guidance document would be useful for local
governments. This effort would examine and provide guidance on such things as:
- statutory authorities for planning and regulating
- review topics and information needs, e.g., water quality, water use quantity, air quality
- identifying location and impacts on existing natural resources
- provision of and maintaining necessary infrastructure
- how to address the different elements: mining, processing, transporting
- best management practices for local governments in permitting and ongoing monitoring
- best management practices for facility operators for planning and managing facilities
- reclamation methods and requirements
Additional Review and Guidance on Connected Actions and Phased Actions in
Environmental Review: Further examination of these concepts as they apply to the varied
elements of the silica sand mining industry would be useful to local governments.
Interaction of Regulatory Practices Across State and Local Governments: An
examination of state rules and permit standards as well as local government authorities and
regulatory practices should include how state rules and local controls interact: how they
affect, depend on, and possibly contradict one another. There may be assumptions made in
one government level that specific safeguards are in place at other government levels.
Subsurface Rights vs. Surface Rights: Questions have arisen regarding subsurface mining
rights and the effects on surface rights owned by another person.
POTENTIAL IMPACTS ON SENSITIVE RESOURCES
Site-Specific Data: Given the multitude of rare species and native plant communities in the
vicinity of the silica sand resources it is highly probable that silica sand mining will
negatively affect rare resources to some degree. However, without site-specific details it is
impossible to determine which sensitive ecological resources will be impacted and the extent
to which they will be impacted (e.g., Takings Permits).
March 20, 2012 Page 63
Development Pressure: Calculating the surface area of silica sand resources within each
county that resides outside of the MBS Sites of Biodiversity Significance or Important Prairie
Landscapes will help to assess the amount of development pressure that will occur within
these ecologically significant areas.
March 20, 2012 Page 64
XII. DEFINITIONS
Ambient Of the surrounding area or environment.
Amorphous (silica) A non-crystalline, or non-crystal-like solid.
Aquifer An underground layer of water-bearing permeable rock or
unconsolidated materials (gravel, sand, or silt) from which
groundwater can be extracted.
Bench Mining An open pit method of extracting rock or minerals from the earth
through layer-by-layer removal.
Carcinogenic Having the potential to cause cancer.
Crystalline (silica) A crystal-like solid. Associated with health concerns where exposures
tend to be higher than ambient exposures.
Flocculant A substance that promotes the clumping of particles, esp. one used in
treating waste water.
Frac sand Silica sand that has characteristics suitable for hydraulic fracking.
Fracking, Fracing, or
Frac Mining
Variations of the term “hydraulic fracturing”.
Fracture Fluids Primarily water-based fluids mixed with additives that help the water
to carry sand proppant into the fractures.
Generic
Environmental
Impact Statement
A comprehensive environmental review of an activity or entity (i.e.,
silica sand mining) that is applicable in many situations and locations,
not just one specific site.
Hopper A type of railroad freight car used to transport loose bulk commodities
such as coal, ore, grain and gravel.
Horizontal Fracturing A wellbore that starts down through the rock in a vertical direction,
but is then turned horizontally for some length into the producing
formation. Fractures are often placed along the horizontal wellbore to
help spur new production.
Hydraulic Fracturing A process used in drilling that involves pumping fluid into a wellbore
at a pressure high enough to fracture and create fissures in the
formation rock.
Hydrocarbon Any of numerous organic compounds, such as benzene and methane,
that contain only hydrogen and carbon.
Incised Made by cutting.
Infiltrate To cause to permeate something by penetrating its pores.
Kaolinite A clay mineral, part of the group of industrial minerals.
March 20, 2012 Page 65
Karst An area of irregular limestone in which erosion has produced fissures,
sinkholes, underground streams, and caverns.
Methanol A chemical also known as methyl alcohol, carbinol, wood alcohol,
wood naphtha, or wood spirits. It is the simplest alcohol.
Micron One micrometer, which is one millionth of a meter or approximately
1/25,000 of an inch.
Mill rate The tax per dollar of assessed value of property. The rate is expressed
in mills, where one mill is one-tenth of a cent ($0.001).
Mineralogy A subset of geology specializing in the scientific study of chemistry,
crystal structure, and physical (including optical) properties of
minerals.
Moratoria A temporary prohibition of an activity.
Nonmetallurgical
bauxite
A non-metal, amorphous clayey rock.
Overburden Rock or soil overlying a mineral deposit, archaeological site, or other
underground feature.
Paleozoic The Paleozoic Era is the earliest of three geologic eras of the
Phanerozoic Eon, spanning from roughly 541 to 252.2 million years
ago.
Play (Geologic) A particular stratigraphic or structural geologic setting is also often
known as a play. (see also Stratigraphy)
Proppant A contraction of the words "propping" and "agent". A particle used to
hold open cracks in the geologic formation so that oil or gas can be
collected. Can be natural or man-made.
Reclamation The act or process of reclaiming. A restoration, as to productivity, or
usefulness.
Sedimentation The tendency for particles in suspension to settle out of the fluid in
which they are entrained, and come to rest against a barrier.
Silica Sand Sands and gravels with high silicon dioxide (SiO2) content. Also
called “silica” and “quartz sand”.
Silicosis A form of lung disease caused by inhalation of crystalline silica dust,
and is marked by inflammation and scarring in forms of nodular
lesions in the upper lobes of the lungs.
Silt A granular material of a size somewhere between sand and clay whose
mineral origin is quartz and feldspar.
Sintering The process of using high temperature kilns to bake clay into well-
formed, round, sand-sized particles.
Sphericity A measure of how spherical (round) an object is.
March 20, 2012 Page 66
Stratigraphy The study of rock strata, especially the distribution, deposition, and
age of sedimentary rocks.
Surface Mining A broad category of mining in which the soil and rock overlying the
mineral are removed. The opposite of underground mining.
Turbidity Having sediment or foreign particles stirred up or suspended; muddy:
turbid water.
Underground Mining The practice of mining that leaves the overlying surface soil and rock
in place, and the underlying mineral is removed by way of shafts or
tunnels.
March 20, 2012 Page 67
XIII. REFERENCES
Beckwith, Robin, “Proppants: Where in the World.” Journal of Petroleum Technology. Society
of Petroleum Engineers. April 2011.
Bridge, I. “Crystalline Silica: A Review of the Dose Response Relationship and Environmental
Risk.” Air Quality and Climate Change. 2009. 43(1): 17-23.
Davies, Phil. “Sand Surge.” Fedgazette. The Federal Reserve Bank of Minneapolis. 16 July
2012.
Deller, Steven C. and Andrew Schreiber. “Frac Sand Mining and Community Economic
Development.” Staff Paper Series. University of Wisconsin-Madison Department of
Agricultural and Applied Economics. May 2012.
Donovan, Jennifer. “What the Mining Debate is Missing.” Michigan Tech News. University of
Michigan. 9 Jan 2012. 19 Feb
2013<http://www.mtu.edu/news/stories/2012/january/story59925.html/>.
Green, J.A., J.A. Pavlish, R.G. Merritt, and J.L. Leete. Minnesota Department of Natural
Resources. “Hydraulic Impacts of Quarries and Gravel Pits.” Prepared for the Legislative
Commission on Minnesota Resources. Minnesota Department of Natural Resources. 2005.
“Groundwater Basics.” Hillsdale County. 12 Feb 2013<
http://www.hillsdalecounty.info/planningeduc0019.asp.>
“Industrial Silica Sand.” Minnesota Department of Natural Resources. 12 Feb
2013<http://www.dnr.state.mn.us/lands_minerals/silicasand.html>.
“Intermodal Freight Terminals.” Minnesota Department of Transportation. 15 Feb
2013<http://www.dot.state.mn.us/ofrw/maps/Intermodal%20Facilities%20Statewide%202
0120801.pdf>.
“Karst in Minnesota.” Minnesota Pollution Control Agency. 12 Feb 2013<
http://www.pca.state.mn.us/index.php/water/water-types-and-
programs/groundwater/groundwater-basics/karst-in-minnesota.html>.
Kelley, Christopher. “Wet Frac Sand Processing.” Conference on Silica Sand Resources of
Minnesota and Wisconsin. Precambrian Research Center, University of Minnesota, Duluth,
MN and Society of Mining, Metallurgy, and Exploration. 1-3 Oct 2012.
Macht, Cameron. “Education and Jobs.” Minnesota Economic Trends. Minnesota Department
of Employment and Economic Development. Dec 2012.
McCurdy, Scott E.. “Silica Sand Processing—Water Quantity and Quality.” Conference on
Silica Sand Resources of Minnesota and Wisconsin. Precambrian Research Center,
University of Minnesota, Duluth, MN and Society of Mining, Metallurgy, and Exploration.
1-3 Oct 2012.
Minnesota Department of Health. Wellhead Protection Issues Related to Mining Activities.
Minnesota Department of Health, Aug 2009.
March 20, 2012 Page 68
Minnesota Department of Natural Resources. Industrial Minerals. Inventory of Industrial
Mineral Pits and Quarries in Minnesota. Minnesota Department of Natural Resources. 1
and 2 (1990) 415.
Missouri State Parks, “How Karst Systems Work” figure at
<http://mostateparks.com/sites/default/files/karst.jpg>
“Moezelborg Discharges Propants.” Duluth Shipping News. 4 Dec 2011.
Richards, John R., et al. “PM4 Crystalline Silica Emission Factors and Ambient Concentrations
at Aggregate-Producing Sources in California.” Journal of the Air and Waste Management
Association. 59(11). (2009): 1287-1295.
Runkel, A. Quartz-rich sandstone bedrock layers at or near (approx. 50 ft) land surface.
Minnesota Geologic Survey, Draft Map. 2012.
Tennessee-Tombigbee Waterway, Shipping Comparisons, Cargo Capacity of Different
Transportation Modes. <http://business.tenntom.org/why-use-the-waterway/shipping-
comparisons/>
“US Silica: The First IPO in the ‘Fracking Sand’ Industry.” Oil and Gas Investment Bulletin. 17
Feb. 2012. 12 Feb 2013 <http://oilandgas-investments.com/2012/stock-market/us-silica-
ipo-fracking-sand/>.
United States Department of Energy. Office of Fossil Energy. National Energy Technology
Laboratory. Modern Shale Gas Primer: Development in the United States: A Primer. U.S.
Department of Energy, 2009.
United States Department of Energy. Office of Fossil Energy. National Energy Technology
Laboratory. Shale Gas: Applying Technology to Solve America’s Energy Challenges.
U.S. Department of Energy, Mar 2011.
United States Department of the Interior. United States Geological Survey. Mineral Commodity
Summaries 2012. U.S. Geological Survey, Reston, Virginia: 2012.
United States Department of the Interior. United States Geological Survey. Minerals Yearbook
2010. U.S. Geological Survey: 2010.
United States Department of Labor. Occupational Safety and Health Administration. National
Institute for Occupational Safety and Health. “Worker Exposure to Silica During
Hydraulic Fracturing.” OSHA-NIOSH Hazard Alert. Occupational Safety & Health
Administration, June 2012.
United States Energy Information Administration. Independent Statistics and Analysis. Review
of Emerging Resources: U.S. Shale Gas and Shale Oil Plays. U.S. Energy Information
Administration, July 2011.
Winona County. Dabelstein Quarry, Winona County Environmental Assessment Worksheet.
2012.
Wisconsin Department of Natural Resources. Silica Sand Mining in Wisconsin. Wisconsin
Department of Natural Resources, Jan 2012.
March 20, 2012 Page 69
XIV. APPENDICES
A. Minnesota Biological Survey Sites
B. Native Plant Communities Over Silica Sand Deposits < 50’ Deep
C. Minnesota Natural Heritage Information System Current and Proposed
Threatened and Endangered Species Within 1 Mile Radius of Silica Sand
Deposits < 50' Deep

March 20, 2012 Page 70

Appendix A

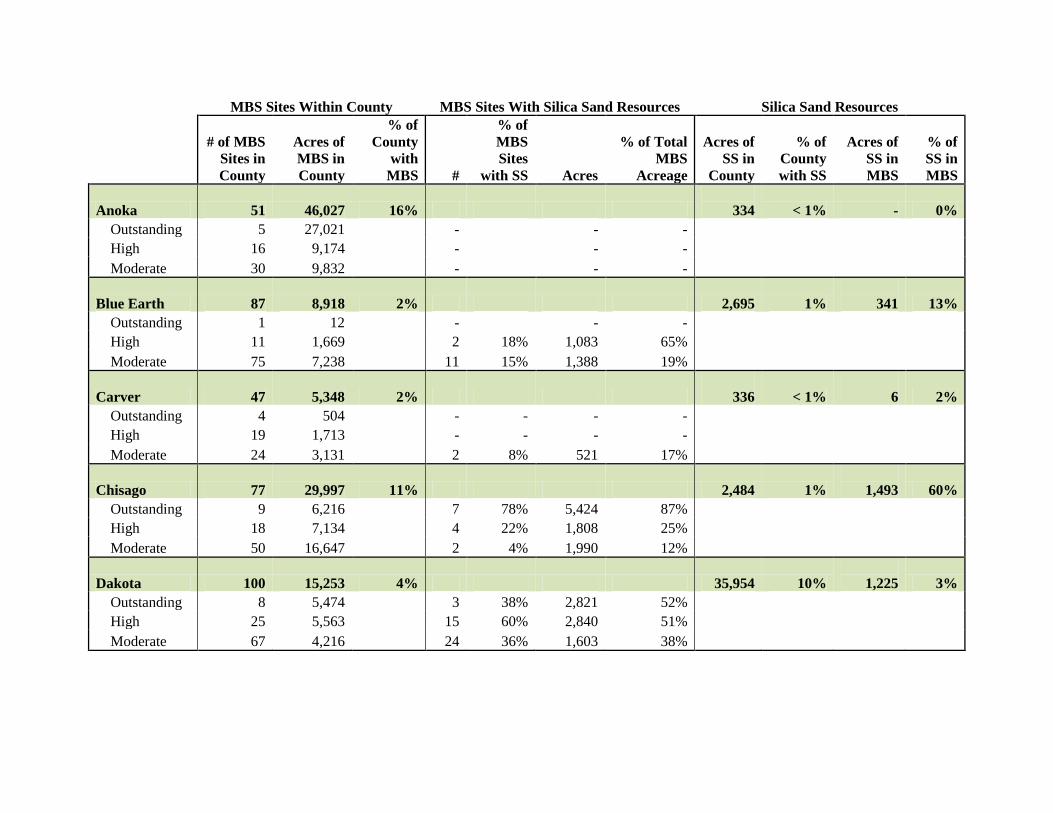
MBS Sites Within County MBS Sites With Silica Sand Resources Silica Sand Resources
# of MBS
Sites in
County
Acres of
MBS in
County
% of
County
with
MBS #
% of
MBS
Sites
with SS Acres
% of Total
MBS
Acreage
Acres of
SS in
County
% of
County
with SS
Acres of
SS in
MBS
% of
SS in
MBS
Anoka 51 46,027 16%
334 < 1% - 0%
Outstanding 5 27,021
-
- -
High 16 9,174
-
- -
Moderate 30 9,832 - - -
Blue Earth 87 8,918 2% 2,695 1%
341 13%
Outstanding 1 12
-
- -
High 11 1,669
2 18% 1,083 65%
Moderate 75 7,238 11 15% 1,388 19%
Carver 47 5,348 2%
336 < 1%
6 2%
Outstanding 4 504
- - - -
High 19 1,713
- - - -
Moderate 24 3,131 2 8% 521 17%
Chisago 77 29,997 11% 2,484 1%
1,493 60%
Outstanding 9 6,216
7 78% 5,424 87%
High 18 7,134
4 22% 1,808 25%
Moderate 50 16,647 2 4% 1,990 12%
Dakota 100 15,253 4% 35,954 10%
1,225 3%
Outstanding 8 5,474
3 38% 2,821 52%
High 25 5,563
15 60% 2,840 51%
Moderate 67 4,216 24 36% 1,603 38%
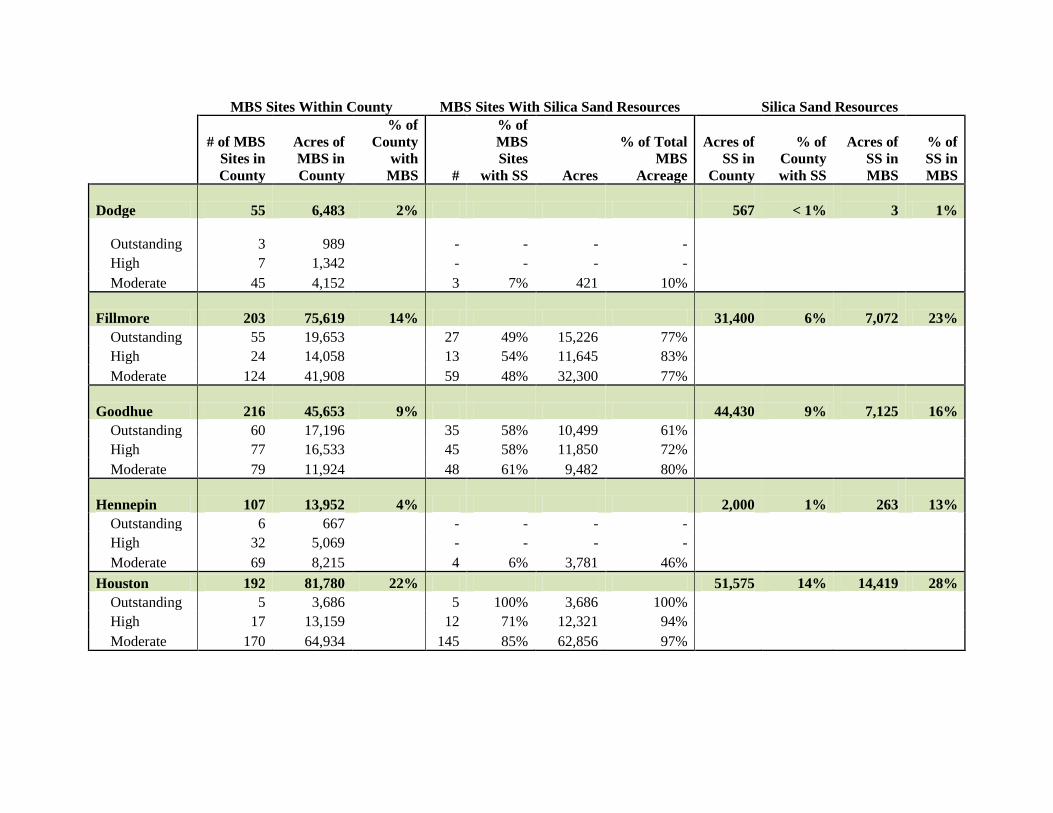
MBS Sites Within County MBS Sites With Silica Sand Resources Silica Sand Resources
# of MBS
Sites in
County
Acres of
MBS in
County
% of
County
with
MBS #
% of
MBS
Sites
with SS Acres
% of Total
MBS
Acreage
Acres of
SS in
County
% of
County
with SS
Acres of
SS in
MBS
% of
SS in
MBS
Dodge 55 6,483 2%
567 < 1%
3 1%
Outstanding 3
989
- - - -
High 7 1,342
- - - -
Moderate 45 4,152 3 7% 421 10%
Fillmore 203 75,619 14% 31,400 6%
7,072 23%
Outstanding 55 19,653
27 49% 15,226 77%
High 24 14,058
13 54% 11,645 83%
Moderate 124 41,908 59 48% 32,300 77%
Goodhue 216 45,653 9% 44,430 9%
7,125 16%
Outstanding 60 17,196
35 58% 10,499 61%
High 77 16,533
45 58% 11,850 72%
Moderate 79 11,924 48 61% 9,482 80%
Hennepin 107 13,952 4% 2,000 1%
263 13%
Outstanding 6 667
- - - -
High 32 5,069
- - - -
Moderate 69 8,215 4 6% 3,781 46%
Houston 192 81,780 22% 51,575 14% 14,419 28%
Outstanding 5 3,686
5 100% 3,686 100%
High 17 13,159
12 71% 12,321 94%
Moderate 170 64,934 145 85% 62,856 97%
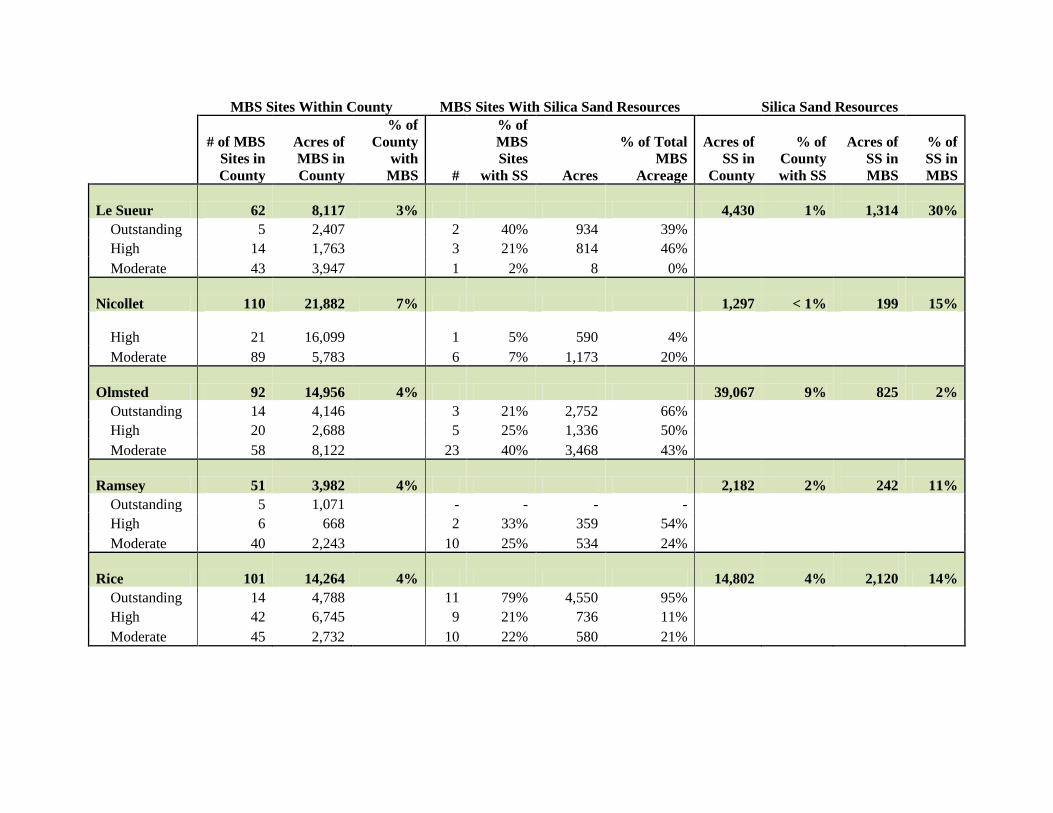
MBS Sites Within County MBS Sites With Silica Sand Resources Silica Sand Resources
# of MBS
Sites in
County
Acres of
MBS in
County
% of
County
with
MBS #
% of
MBS
Sites
with SS Acres
% of Total
MBS
Acreage
Acres of
SS in
County
% of
County
with SS
Acres of
SS in
MBS
% of
SS in
MBS
Le Sueur 62 8,117 3% 4,430 1%
1,314 30%
Outstanding 5 2,407
2 40% 934 39%
High 14 1,763
3 21% 814 46%
Moderate 43 3,947 1 2% 8 0%
Nicollet 110 21,882 7% 1,297 < 1%
199 15%
High 21
16,099
1 5% 590 4%
Moderate 89 5,783 6 7% 1,173 20%
Olmsted 92 14,956 4% 39,067 9%
825 2%
Outstanding 14 4,146
3 21% 2,752 66%
High 20 2,688
5 25% 1,336 50%
Moderate 58 8,122 23 40% 3,468 43%
Ramsey 51 3,982 4% 2,182 2%
242 11%
Outstanding 5 1,071
- - - -
High 6 668
2 33% 359 54%
Moderate 40 2,243 10 25% 534 24%
Rice 101 14,264 4% 14,802 4%
2,120 14%
Outstanding 14 4,788
11 79% 4,550 95%
High 42 6,745
9 21% 736 11%
Moderate 45 2,732 10 22% 580 21%
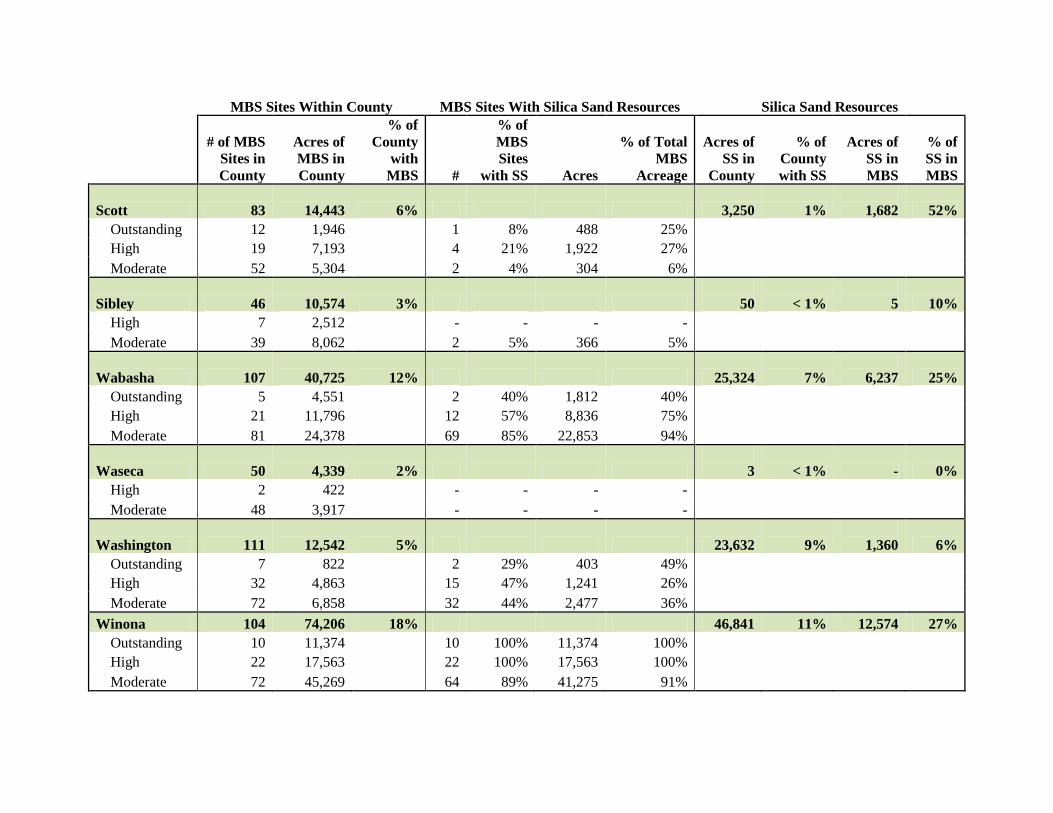
MBS Sites Within County MBS Sites With Silica Sand Resources Silica Sand Resources
# of MBS
Sites in
County
Acres of
MBS in
County
% of
County
with
MBS #
% of
MBS
Sites
with SS Acres
% of Total
MBS
Acreage
Acres of
SS in
County
% of
County
with SS
Acres of
SS in
MBS
% of
SS in
MBS
Scott 83 14,443 6% 3,250 1%
1,682 52%
Outstanding 12 1,946
1 8% 488 25%
High 19 7,193
4 21% 1,922 27%
Moderate 52 5,304 2 4% 304 6%
Sibley 46 10,574 3%
50 < 1%
5 10%
High 7 2,512
- - - -
Moderate 39 8,062 2 5% 366 5%
Wabasha 107 40,725 12% 25,324 7%
6,237 25%
Outstanding 5 4,551
2 40% 1,812 40%
High 21 11,796
12 57% 8,836 75%
Moderate 81 24,378 69 85% 22,853 94%
Waseca 50 4,339 2%
3 < 1% - 0%
High 2 422
- - - -
Moderate 48 3,917 - - - -
Washington 111 12,542 5% 23,632 9%
1,360 6%
Outstanding 7 822
2 29% 403 49%
High 32 4,863
15 47% 1,241 26%
Moderate 72 6,858 32 44% 2,477 36%
Winona 104 74,206 18% 46,841 11% 12,574 27%
Outstanding 10 11,374
10 100% 11,374 100%
High 22 17,563
22 100% 17,563 100%
Moderate 72 45,269 64 89% 41,275 91%
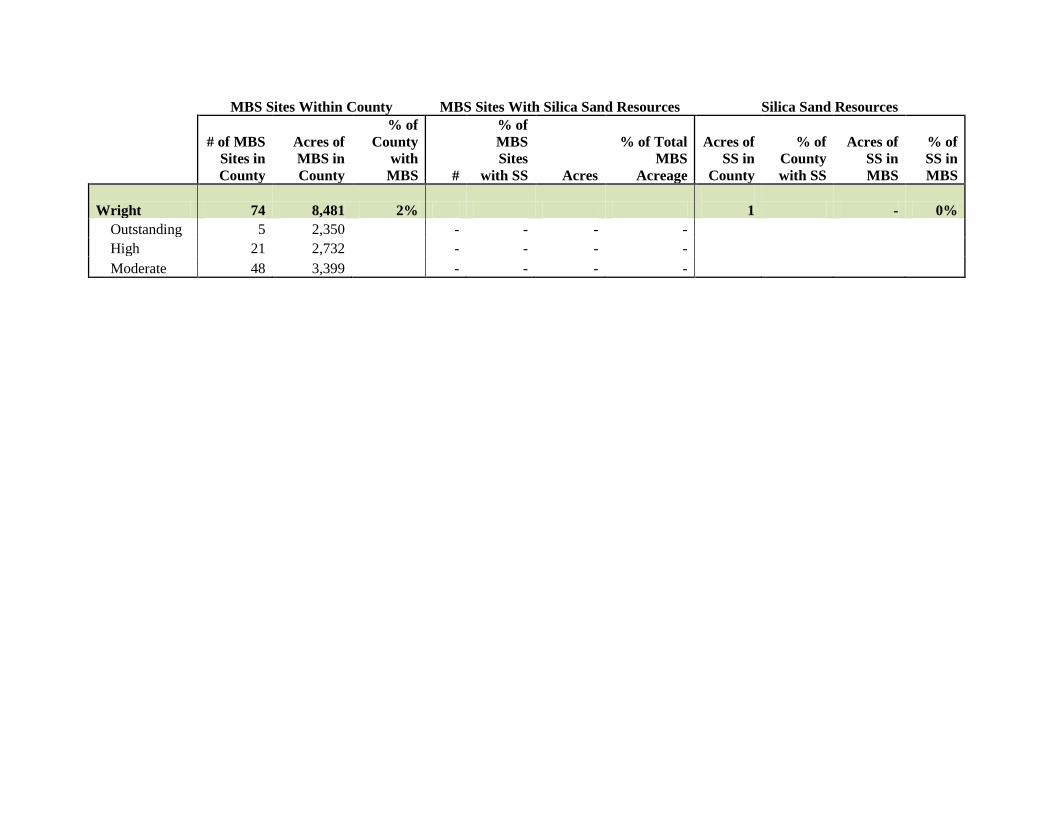
MBS Sites Within County MBS Sites With Silica Sand Resources Silica Sand Resources
# of MBS
Sites in
County
Acres of
MBS in
County
% of
County
with
MBS #
% of
MBS
Sites
with SS Acres
% of Total
MBS
Acreage
Acres of
SS in
County
% of
County
with SS
Acres of
SS in
MBS
% of
SS in
MBS
Wright 74 8,481 2%
1 - 0%
Outstanding 5 2,350
- - - -
High 21 2,732
- - - -
Moderate 48 3,399 - - - -


Appendix B

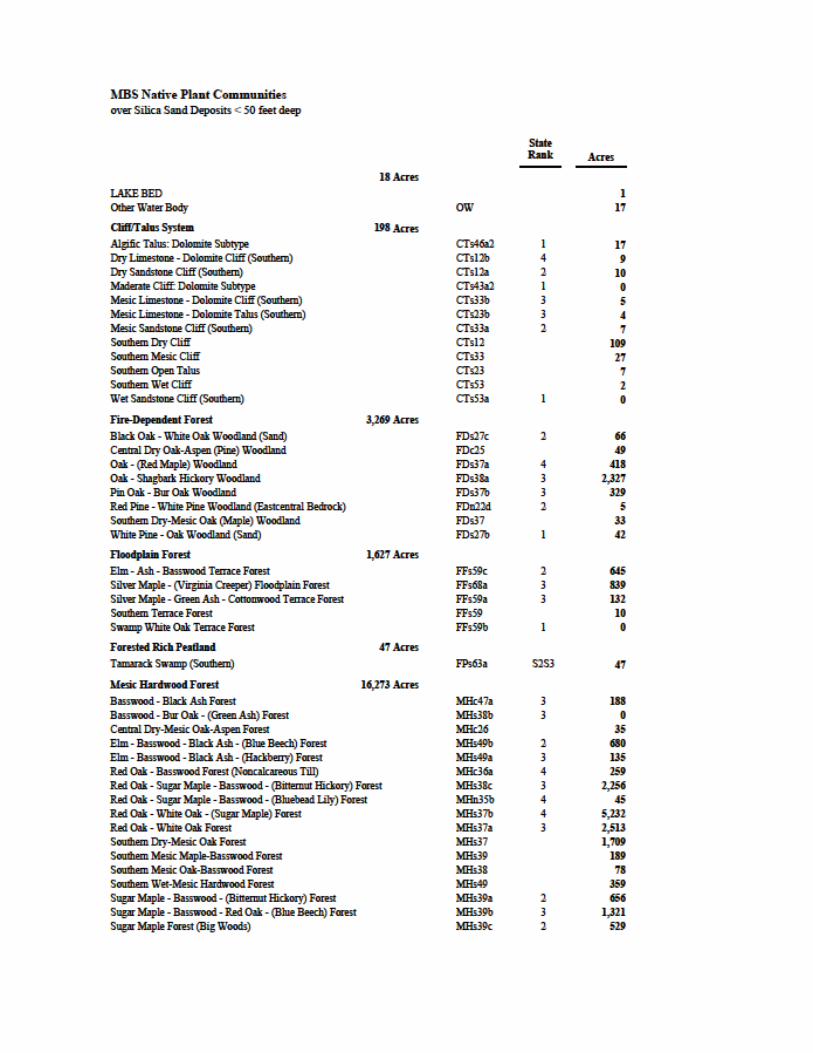
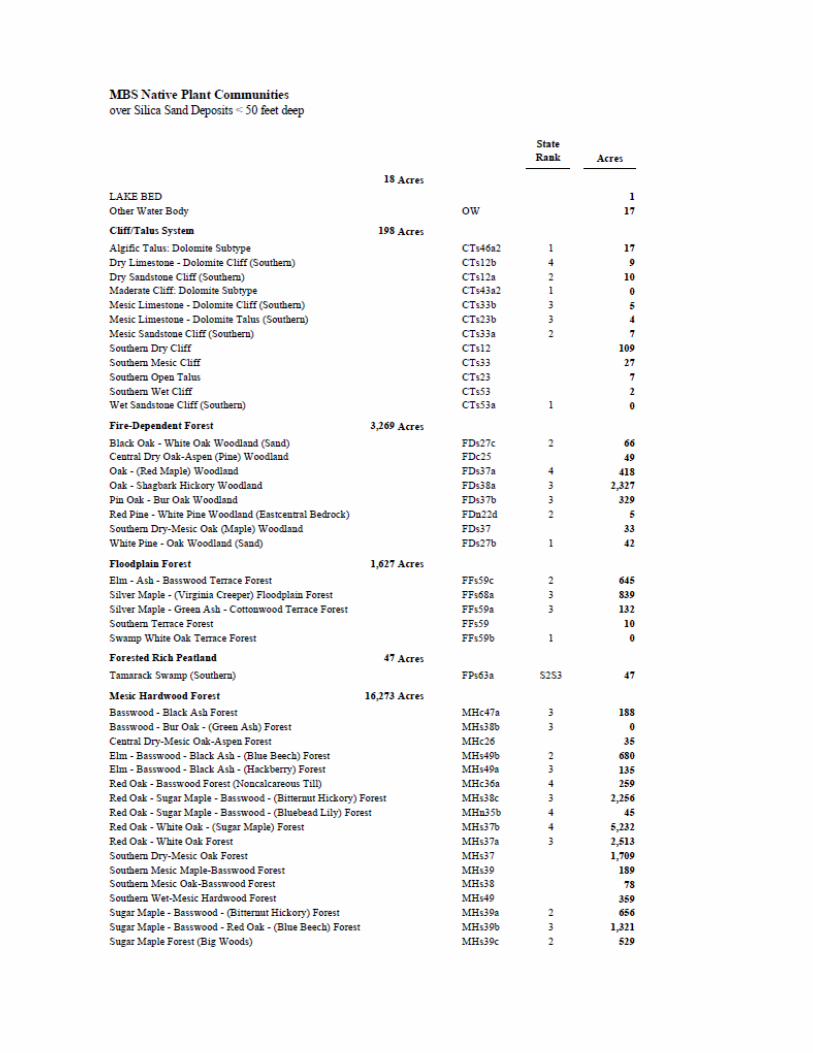

Appendix C