Embed Size (px)
Citation preview
Evaluation of digesters in The Netherlands
Phase II
October 2013
This studie is executed in the context of the “Innovatieagenda Energie Nieuw Gas”
Client:
Agentschap NL, Divisie Energie & Klimaat
Croeselaan 15, 3521BJ, Utrecht
Contact person: M. Dumont
Study conducted by:
Organic Waste Systems NV
Dok Noord 5, 9000 Gent, België
Authors: F. Velghe & I. Wierinck
Evaluation of digester in The Netherlands Phase II p 2 of 15
SUMMARY
The Dutch anaerobic digestion sector is emerging and has grown significantly since 2000. In 2010 the
opportunity arose to evaluate the developments of this sector with funding through the ‘Energie Innovatie
Agenda’. A contract for a study was issued after a public tender to map the developments of the sector and to
evaluate the possibilities for optimization based on a thorough process monitoring. This study revealed that in
recent years several problems developed and led to financial difficulties for the digester facilities (results
shown in the report of Phase I of this study). Phase II of this study builds on these conclusions, and had as its
main goal to optimize the digestion sector through a thorough monitoring and data analysis of several full scale
plants.
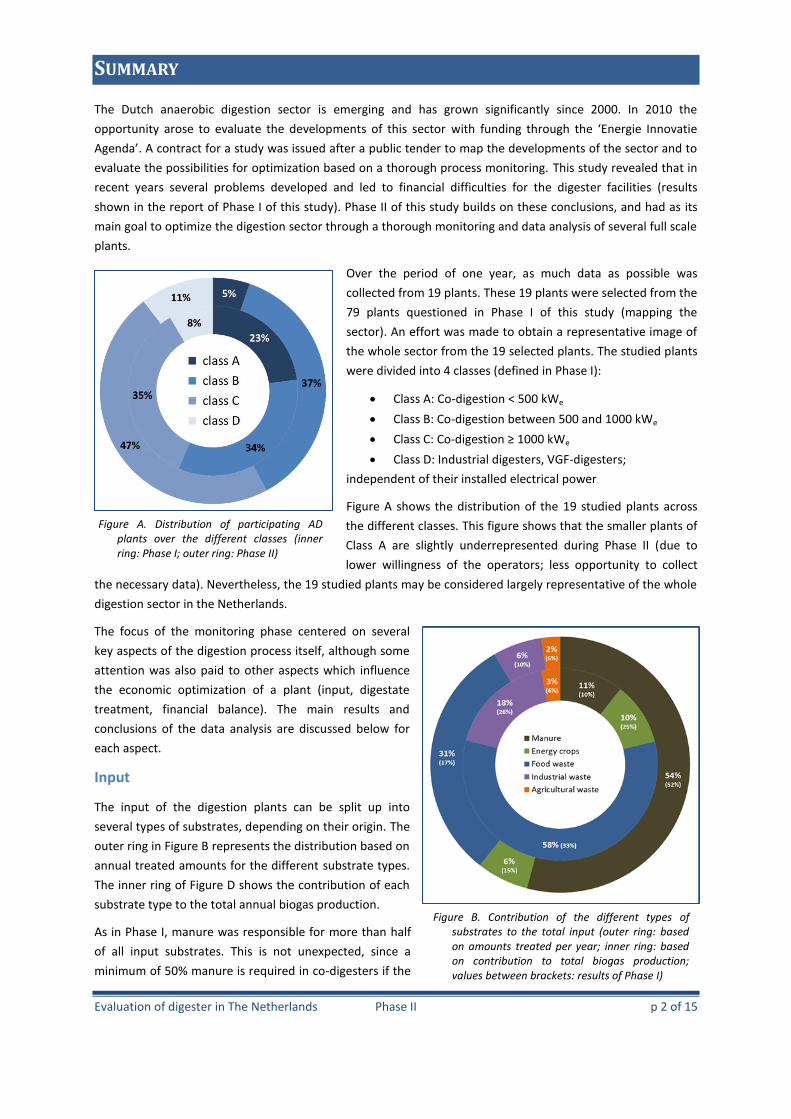
Over the period of one year, as much data as possible was
collected from 19 plants. These 19 plants were selected from the
79 plants questioned in Phase I of this study (mapping the
sector). An effort was made to obtain a representative image of
the whole sector from the 19 selected plants. The studied plants
were divided into 4 classes (defined in Phase I):
Class A: Co-digestion < 500 kWe
Class B: Co-digestion between 500 and 1000 kWe
Class C: Co-digestion ≥ 1000 kWe
Class D: Industrial digesters, VGF-digesters;
independent of their installed electrical power
Figure A shows the distribution of the 19 studied plants across
the different classes. This figure shows that the smaller plants of
Class A are slightly underrepresented during Phase II (due to
lower willingness of the operators; less opportunity to collect
the necessary data). Nevertheless, the 19 studied plants may be considered largely representative of the whole
digestion sector in the Netherlands.
The focus of the monitoring phase centered on several
key aspects of the digestion process itself, although some
attention was also paid to other aspects which influence
the economic optimization of a plant (input, digestate
treatment, financial balance). The main results and
conclusions of the data analysis are discussed below for
each aspect.
Input
The input of the digestion plants can be split up into
several types of substrates, depending on their origin. The
outer ring in Figure B represents the distribution based on
annual treated amounts for the different substrate types.
The inner ring of Figure D shows the contribution of each
substrate type to the total annual biogas production.
As in Phase I, manure was responsible for more than half
of all input substrates. This is not unexpected, since a
minimum of 50% manure is required in co-digesters if the
Figure A. Distribution of participating AD plants over the different classes (inner ring: Phase I; outer ring: Phase II)
Figure B. Contribution of the different types of substrates to the total input (outer ring: based on amounts treated per year; inner ring: based on contribution to total biogas production; values between brackets: results of Phase I)
Evaluation of digester in The Netherlands Phase II p 3 of 15
digestate is to be used as animal manure. Given the low biogas potential of this product, manure was only
responsible for 11% of all biogas production. The share of energy crops and industrial waste has significantly
decreased compared to Phase I of this study (from 15% to 6% and from 10% to 6% resp.). This is caused by the
increased price of both substrate categories over the last few years. As a consequence, the share of food waste
in the average recipe increased from 17% to 31%, and was responsible for almost 60% of all biogas.
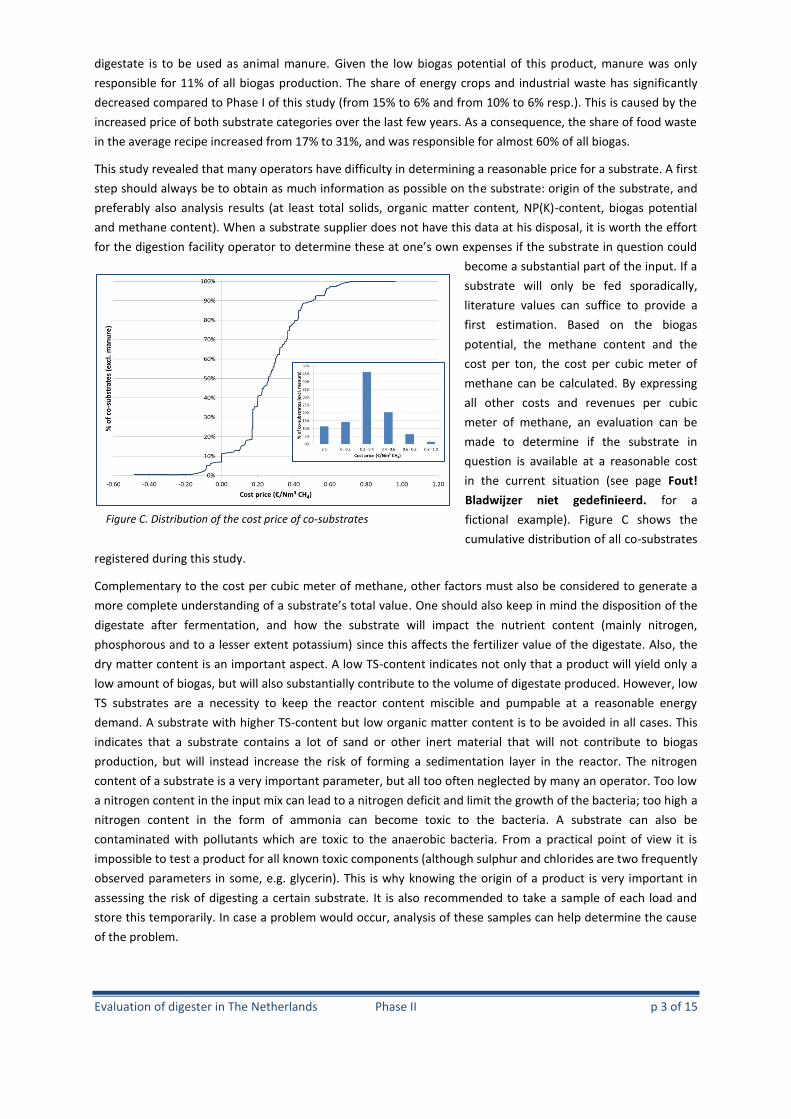
This study revealed that many operators have difficulty in determining a reasonable price for a substrate. A first
step should always be to obtain as much information as possible on the substrate: origin of the substrate, and
preferably also analysis results (at least total solids, organic matter content, NP(K)-content, biogas potential
and methane content). When a substrate supplier does not have this data at his disposal, it is worth the effort
for the digestion facility operator to determine these at one’s own expenses if the substrate in question could
become a substantial part of the input. If a
substrate will only be fed sporadically,
literature values can suffice to provide a
first estimation. Based on the biogas
potential, the methane content and the
cost per ton, the cost per cubic meter of
methane can be calculated. By expressing
all other costs and revenues per cubic
meter of methane, an evaluation can be
made to determine if the substrate in
question is available at a reasonable cost
in the current situation (see page Fout!
Bladwijzer niet gedefinieerd. for a
fictional example). Figure C shows the
cumulative distribution of all co-substrates
registered during this study.
Complementary to the cost per cubic meter of methane, other factors must also be considered to generate a
more complete understanding of a substrate’s total value. One should also keep in mind the disposition of the
digestate after fermentation, and how the substrate will impact the nutrient content (mainly nitrogen,
phosphorous and to a lesser extent potassium) since this affects the fertilizer value of the digestate. Also, the
dry matter content is an important aspect. A low TS-content indicates not only that a product will yield only a
low amount of biogas, but will also substantially contribute to the volume of digestate produced. However, low
TS substrates are a necessity to keep the reactor content miscible and pumpable at a reasonable energy
demand. A substrate with higher TS-content but low organic matter content is to be avoided in all cases. This
indicates that a substrate contains a lot of sand or other inert material that will not contribute to biogas
production, but will instead increase the risk of forming a sedimentation layer in the reactor. The nitrogen
content of a substrate is a very important parameter, but all too often neglected by many an operator. Too low
a nitrogen content in the input mix can lead to a nitrogen deficit and limit the growth of the bacteria; too high a
nitrogen content in the form of ammonia can become toxic to the bacteria. A substrate can also be
contaminated with pollutants which are toxic to the anaerobic bacteria. From a practical point of view it is
impossible to test a product for all known toxic components (although sulphur and chlorides are two frequently
observed parameters in some, e.g. glycerin). This is why knowing the origin of a product is very important in
assessing the risk of digesting a certain substrate. It is also recommended to take a sample of each load and
store this temporarily. In case a problem would occur, analysis of these samples can help determine the cause
of the problem.
Figure C. Distribution of the cost price of co-substrates
Evaluation of digester in The Netherlands Phase II p 4 of 15
The lack of information regarding many co-substrates (both to the operators and substrate suppliers) was an
important cause of fluctuating prices for similar products. In many cases incomplete knowledge of a substrate‘s
characteristics caused misjudgment with regard to process control parameters and, in some cases, led to
process failure.
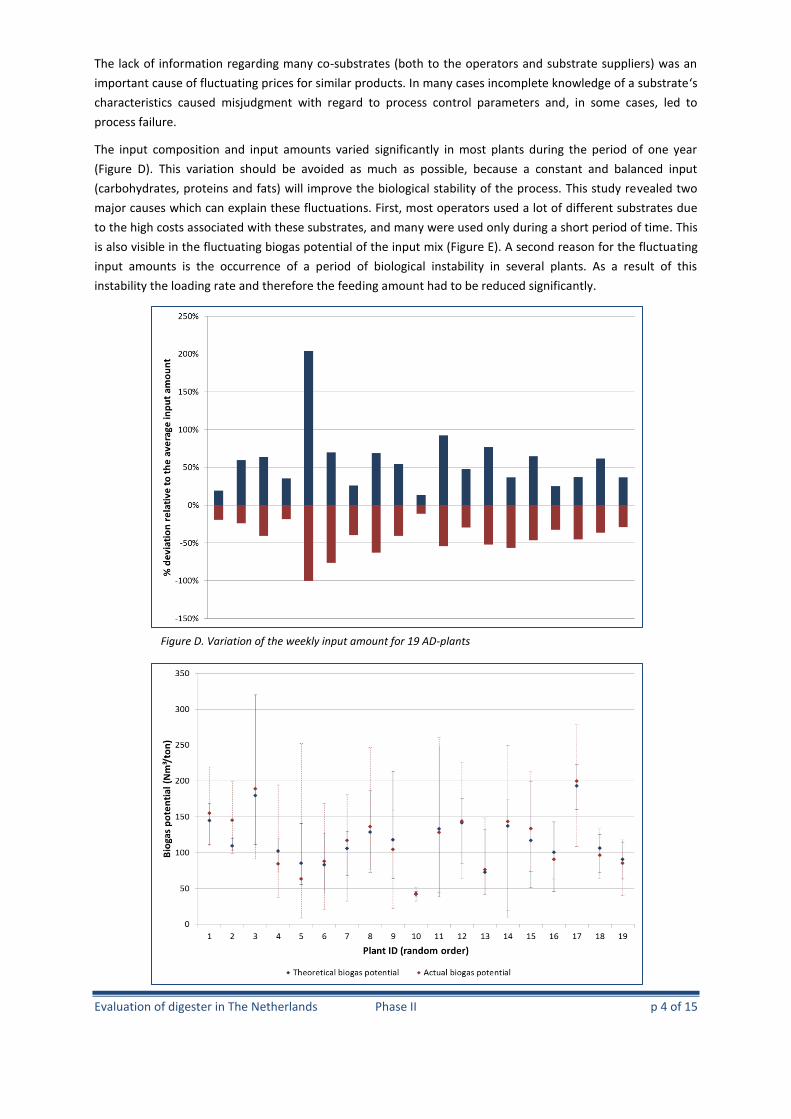
The input composition and input amounts varied significantly in most plants during the period of one year
(Figure D). This variation should be avoided as much as possible, because a constant and balanced input
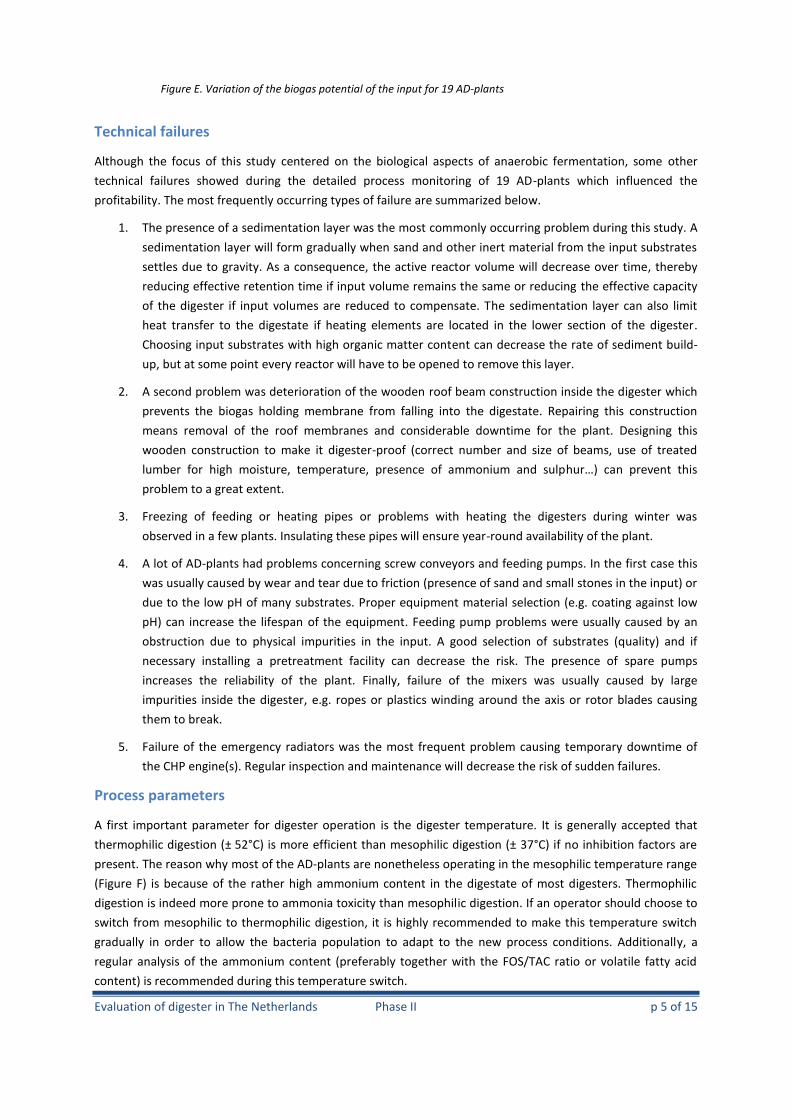
(carbohydrates, proteins and fats) will improve the biological stability of the process. This study revealed two
major causes which can explain these fluctuations. First, most operators used a lot of different substrates due
to the high costs associated with these substrates, and many were used only during a short period of time. This
is also visible in the fluctuating biogas potential of the input mix (Figure E). A second reason for the fluctuating
input amounts is the occurrence of a period of biological instability in several plants. As a result of this
instability the loading rate and therefore the feeding amount had to be reduced significantly.
Figure D. Variation of the weekly input amount for 19 AD-plants
Evaluation of digester in The Netherlands Phase II p 5 of 15
Technical failures
Although the focus of this study centered on the biological aspects of anaerobic fermentation, some other
technical failures showed during the detailed process monitoring of 19 AD-plants which influenced the
profitability. The most frequently occurring types of failure are summarized below.
1. The presence of a sedimentation layer was the most commonly occurring problem during this study. A
sedimentation layer will form gradually when sand and other inert material from the input substrates
settles due to gravity. As a consequence, the active reactor volume will decrease over time, thereby
reducing effective retention time if input volume remains the same or reducing the effective capacity
of the digester if input volumes are reduced to compensate. The sedimentation layer can also limit
heat transfer to the digestate if heating elements are located in the lower section of the digester.
Choosing input substrates with high organic matter content can decrease the rate of sediment build-
up, but at some point every reactor will have to be opened to remove this layer.
2. A second problem was deterioration of the wooden roof beam construction inside the digester which
prevents the biogas holding membrane from falling into the digestate. Repairing this construction
means removal of the roof membranes and considerable downtime for the plant. Designing this
wooden construction to make it digester-proof (correct number and size of beams, use of treated
lumber for high moisture, temperature, presence of ammonium and sulphur…) can prevent this
problem to a great extent.
3. Freezing of feeding or heating pipes or problems with heating the digesters during winter was
observed in a few plants. Insulating these pipes will ensure year-round availability of the plant.
4. A lot of AD-plants had problems concerning screw conveyors and feeding pumps. In the first case this
was usually caused by wear and tear due to friction (presence of sand and small stones in the input) or
due to the low pH of many substrates. Proper equipment material selection (e.g. coating against low
pH) can increase the lifespan of the equipment. Feeding pump problems were usually caused by an
obstruction due to physical impurities in the input. A good selection of substrates (quality) and if
necessary installing a pretreatment facility can decrease the risk. The presence of spare pumps
increases the reliability of the plant. Finally, failure of the mixers was usually caused by large
impurities inside the digester, e.g. ropes or plastics winding around the axis or rotor blades causing
them to break.
5. Failure of the emergency radiators was the most frequent problem causing temporary downtime of
the CHP engine(s). Regular inspection and maintenance will decrease the risk of sudden failures.
Process parameters
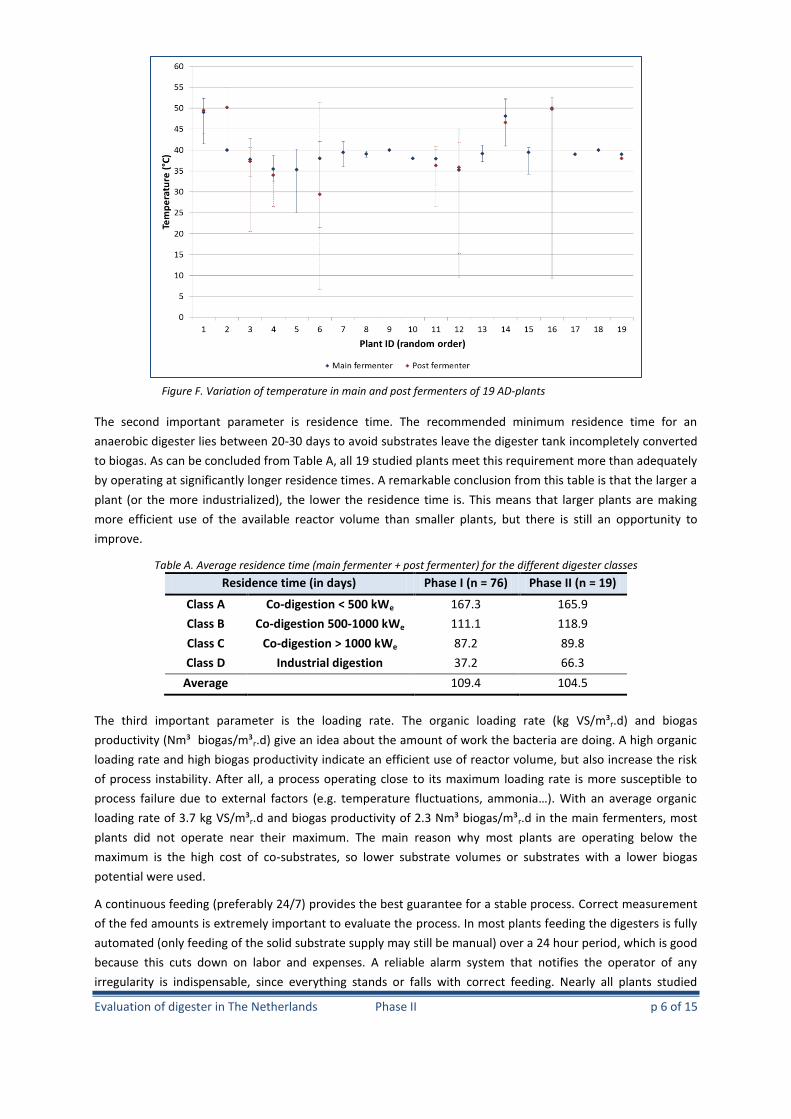
A first important parameter for digester operation is the digester temperature. It is generally accepted that
thermophilic digestion (± 52°C) is more efficient than mesophilic digestion (± 37°C) if no inhibition factors are
present. The reason why most of the AD-plants are nonetheless operating in the mesophilic temperature range
(Figure F) is because of the rather high ammonium content in the digestate of most digesters. Thermophilic
digestion is indeed more prone to ammonia toxicity than mesophilic digestion. If an operator should choose to
switch from mesophilic to thermophilic digestion, it is highly recommended to make this temperature switch
gradually in order to allow the bacteria population to adapt to the new process conditions. Additionally, a
regular analysis of the ammonium content (preferably together with the FOS/TAC ratio or volatile fatty acid
content) is recommended during this temperature switch.
Figure E. Variation of the biogas potential of the input for 19 AD-plants
Evaluation of digester in The Netherlands Phase II p 6 of 15
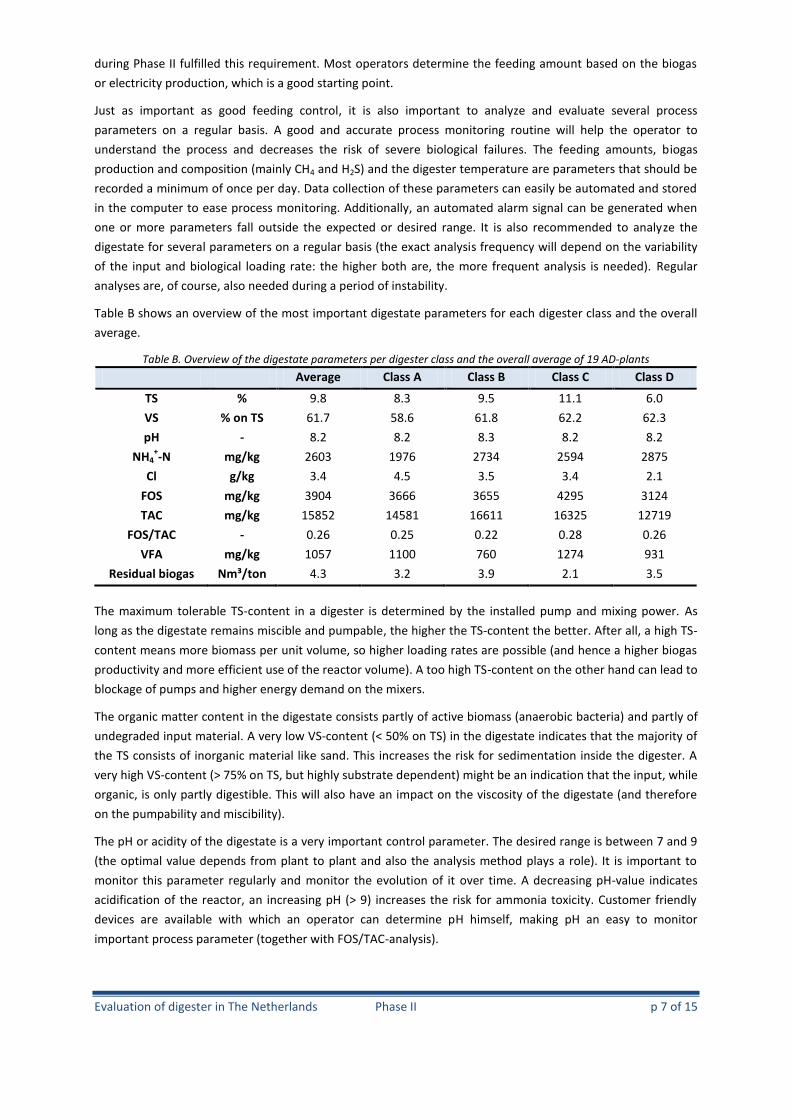
The second important parameter is residence time. The recommended minimum residence time for an
anaerobic digester lies between 20-30 days to avoid substrates leave the digester tank incompletely converted
to biogas. As can be concluded from Table A, all 19 studied plants meet this requirement more than adequately
by operating at significantly longer residence times. A remarkable conclusion from this table is that the larger a
plant (or the more industrialized), the lower the residence time is. This means that larger plants are making
more efficient use of the available reactor volume than smaller plants, but there is still an opportunity to
improve.
Table A. Average residence time (main fermenter + post fermenter) for the different digester classes
Residence time (in days) Phase I (n = 76) Phase II (n = 19)
Class A Co-digestion < 500 kWe 167.3 165.9
Class B Co-digestion 500-1000 kWe 111.1 118.9
Class C Co-digestion > 1000 kWe 87.2 89.8
Class D Industrial digestion 37.2 66.3
Average 109.4 104.5
The third important parameter is the loading rate. The organic loading rate (kg VS/m³r.d) and biogas
productivity (Nm³ biogas/m³r.d) give an idea about the amount of work the bacteria are doing. A high organic
loading rate and high biogas productivity indicate an efficient use of reactor volume, but also increase the risk
of process instability. After all, a process operating close to its maximum loading rate is more susceptible to
process failure due to external factors (e.g. temperature fluctuations, ammonia…). With an average organic
loading rate of 3.7 kg VS/m³r.d and biogas productivity of 2.3 Nm³ biogas/m³r.d in the main fermenters, most
plants did not operate near their maximum. The main reason why most plants are operating below the
maximum is the high cost of co-substrates, so lower substrate volumes or substrates with a lower biogas
potential were used.
A continuous feeding (preferably 24/7) provides the best guarantee for a stable process. Correct measurement
of the fed amounts is extremely important to evaluate the process. In most plants feeding the digesters is fully
automated (only feeding of the solid substrate supply may still be manual) over a 24 hour period, which is good
because this cuts down on labor and expenses. A reliable alarm system that notifies the operator of any
irregularity is indispensable, since everything stands or falls with correct feeding. Nearly all plants studied
Figure F. Variation of temperature in main and post fermenters of 19 AD-plants
Evaluation of digester in The Netherlands Phase II p 7 of 15
during Phase II fulfilled this requirement. Most operators determine the feeding amount based on the biogas
or electricity production, which is a good starting point.
Just as important as good feeding control, it is also important to analyze and evaluate several process
parameters on a regular basis. A good and accurate process monitoring routine will help the operator to
understand the process and decreases the risk of severe biological failures. The feeding amounts, biogas
production and composition (mainly CH4 and H2S) and the digester temperature are parameters that should be
recorded a minimum of once per day. Data collection of these parameters can easily be automated and stored
in the computer to ease process monitoring. Additionally, an automated alarm signal can be generated when
one or more parameters fall outside the expected or desired range. It is also recommended to analyze the
digestate for several parameters on a regular basis (the exact analysis frequency will depend on the variability
of the input and biological loading rate: the higher both are, the more frequent analysis is needed). Regular
analyses are, of course, also needed during a period of instability.
Table B shows an overview of the most important digestate parameters for each digester class and the overall
average.
Table B. Overview of the digestate parameters per digester class and the overall average of 19 AD-plants
Average Class A Class B Class C Class D
TS % 9.8 8.3 9.5 11.1 6.0
VS % on TS 61.7 58.6 61.8 62.2 62.3
pH - 8.2 8.2 8.3 8.2 8.2
NH4+-N mg/kg 2603 1976 2734 2594 2875
Cl g/kg 3.4 4.5 3.5 3.4 2.1
FOS mg/kg 3904 3666 3655 4295 3124
TAC mg/kg 15852 14581 16611 16325 12719
FOS/TAC - 0.26 0.25 0.22 0.28 0.26
VFA mg/kg 1057 1100 760 1274 931
Residual biogas Nm³/ton 4.3 3.2 3.9 2.1 3.5
The maximum tolerable TS-content in a digester is determined by the installed pump and mixing power. As
long as the digestate remains miscible and pumpable, the higher the TS-content the better. After all, a high TS-
content means more biomass per unit volume, so higher loading rates are possible (and hence a higher biogas
productivity and more efficient use of the reactor volume). A too high TS-content on the other hand can lead to
blockage of pumps and higher energy demand on the mixers.
The organic matter content in the digestate consists partly of active biomass (anaerobic bacteria) and partly of
undegraded input material. A very low VS-content (< 50% on TS) in the digestate indicates that the majority of
the TS consists of inorganic material like sand. This increases the risk for sedimentation inside the digester. A
very high VS-content (> 75% on TS, but highly substrate dependent) might be an indication that the input, while
organic, is only partly digestible. This will also have an impact on the viscosity of the digestate (and therefore
on the pumpability and miscibility).
The pH or acidity of the digestate is a very important control parameter. The desired range is between 7 and 9
(the optimal value depends from plant to plant and also the analysis method plays a role). It is important to
monitor this parameter regularly and monitor the evolution of it over time. A decreasing pH-value indicates
acidification of the reactor, an increasing pH (> 9) increases the risk for ammonia toxicity. Customer friendly
devices are available with which an operator can determine pH himself, making pH an easy to monitor
important process parameter (together with FOS/TAC-analysis).
Evaluation of digester in The Netherlands Phase II p 8 of 15
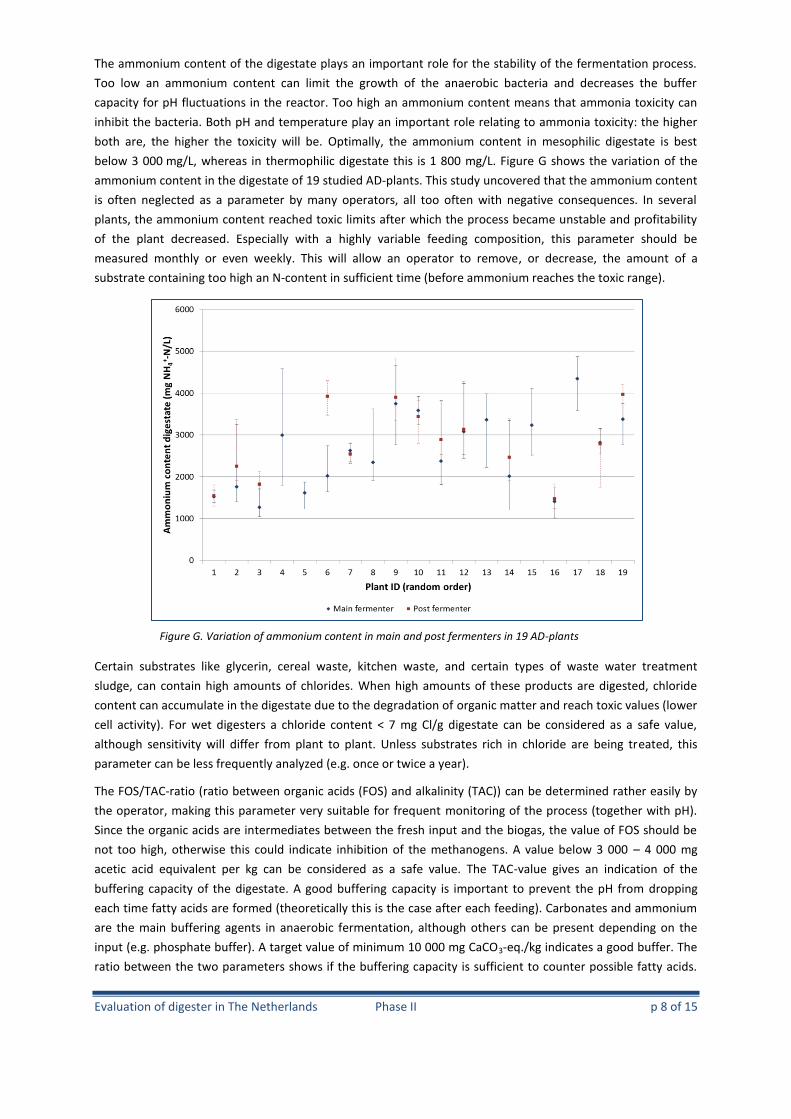
The ammonium content of the digestate plays an important role for the stability of the fermentation process.
Too low an ammonium content can limit the growth of the anaerobic bacteria and decreases the buffer
capacity for pH fluctuations in the reactor. Too high an ammonium content means that ammonia toxicity can
inhibit the bacteria. Both pH and temperature play an important role relating to ammonia toxicity: the higher
both are, the higher the toxicity will be. Optimally, the ammonium content in mesophilic digestate is best
below 3 000 mg/L, whereas in thermophilic digestate this is 1 800 mg/L. Figure G shows the variation of the
ammonium content in the digestate of 19 studied AD-plants. This study uncovered that the ammonium content
is often neglected as a parameter by many operators, all too often with negative consequences. In several
plants, the ammonium content reached toxic limits after which the process became unstable and profitability
of the plant decreased. Especially with a highly variable feeding composition, this parameter should be
measured monthly or even weekly. This will allow an operator to remove, or decrease, the amount of a
substrate containing too high an N-content in sufficient time (before ammonium reaches the toxic range).
Certain substrates like glycerin, cereal waste, kitchen waste, and certain types of waste water treatment
sludge, can contain high amounts of chlorides. When high amounts of these products are digested, chloride
content can accumulate in the digestate due to the degradation of organic matter and reach toxic values (lower
cell activity). For wet digesters a chloride content < 7 mg Cl/g digestate can be considered as a safe value,
although sensitivity will differ from plant to plant. Unless substrates rich in chloride are being treated, this
parameter can be less frequently analyzed (e.g. once or twice a year).
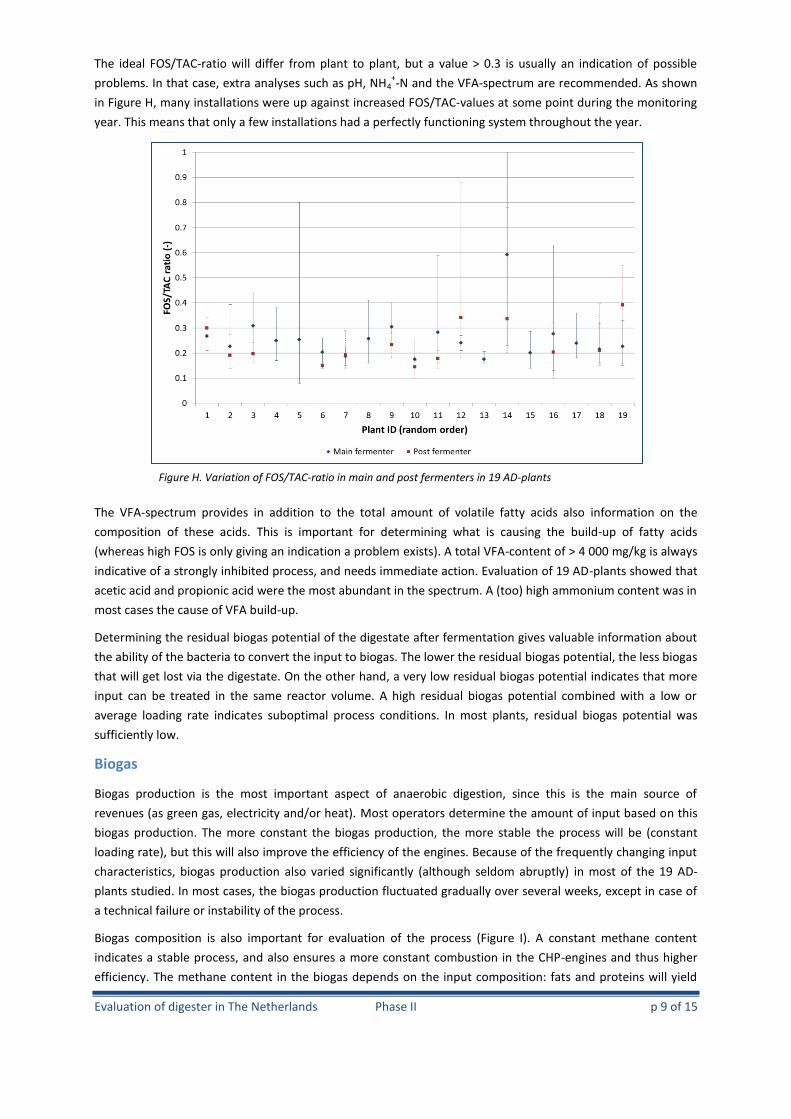
The FOS/TAC-ratio (ratio between organic acids (FOS) and alkalinity (TAC)) can be determined rather easily by
the operator, making this parameter very suitable for frequent monitoring of the process (together with pH).
Since the organic acids are intermediates between the fresh input and the biogas, the value of FOS should be
not too high, otherwise this could indicate inhibition of the methanogens. A value below 3 000 – 4 000 mg
acetic acid equivalent per kg can be considered as a safe value. The TAC-value gives an indication of the
buffering capacity of the digestate. A good buffering capacity is important to prevent the pH from dropping
each time fatty acids are formed (theoretically this is the case after each feeding). Carbonates and ammonium
are the main buffering agents in anaerobic fermentation, although others can be present depending on the
input (e.g. phosphate buffer). A target value of minimum 10 000 mg CaCO3-eq./kg indicates a good buffer. The
ratio between the two parameters shows if the buffering capacity is sufficient to counter possible fatty acids.
Figure G. Variation of ammonium content in main and post fermenters in 19 AD-plants
Evaluation of digester in The Netherlands Phase II p 9 of 15
The ideal FOS/TAC-ratio will differ from plant to plant, but a value > 0.3 is usually an indication of possible
problems. In that case, extra analyses such as pH, NH4+-N and the VFA-spectrum are recommended. As shown
in Figure H, many installations were up against increased FOS/TAC-values at some point during the monitoring
year. This means that only a few installations had a perfectly functioning system throughout the year.
The VFA-spectrum provides in addition to the total amount of volatile fatty acids also information on the
composition of these acids. This is important for determining what is causing the build-up of fatty acids
(whereas high FOS is only giving an indication a problem exists). A total VFA-content of > 4 000 mg/kg is always
indicative of a strongly inhibited process, and needs immediate action. Evaluation of 19 AD-plants showed that
acetic acid and propionic acid were the most abundant in the spectrum. A (too) high ammonium content was in
most cases the cause of VFA build-up.
Determining the residual biogas potential of the digestate after fermentation gives valuable information about
the ability of the bacteria to convert the input to biogas. The lower the residual biogas potential, the less biogas
that will get lost via the digestate. On the other hand, a very low residual biogas potential indicates that more
input can be treated in the same reactor volume. A high residual biogas potential combined with a low or
average loading rate indicates suboptimal process conditions. In most plants, residual biogas potential was
sufficiently low.
Biogas
Biogas production is the most important aspect of anaerobic digestion, since this is the main source of
revenues (as green gas, electricity and/or heat). Most operators determine the amount of input based on this
biogas production. The more constant the biogas production, the more stable the process will be (constant
loading rate), but this will also improve the efficiency of the engines. Because of the frequently changing input
characteristics, biogas production also varied significantly (although seldom abruptly) in most of the 19 AD-
plants studied. In most cases, the biogas production fluctuated gradually over several weeks, except in case of
a technical failure or instability of the process.
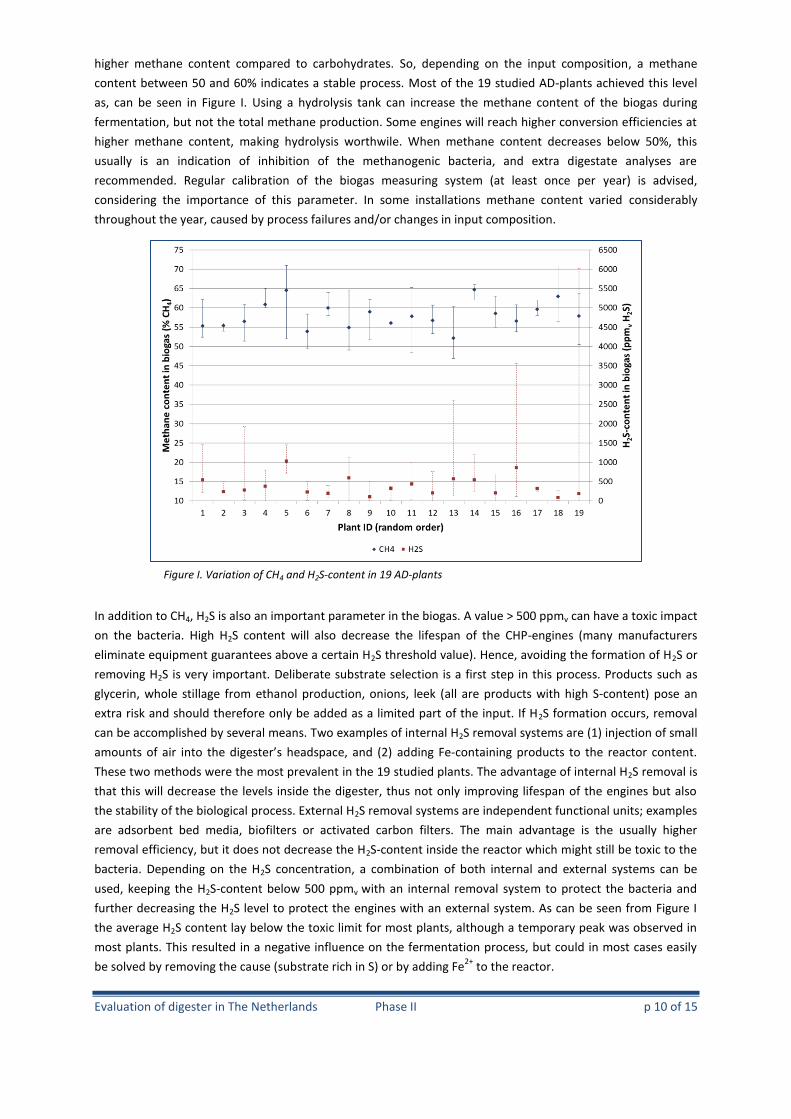
Biogas composition is also important for evaluation of the process (Figure I). A constant methane content
indicates a stable process, and also ensures a more constant combustion in the CHP-engines and thus higher
efficiency. The methane content in the biogas depends on the input composition: fats and proteins will yield
Figure H. Variation of FOS/TAC-ratio in main and post fermenters in 19 AD-plants
Evaluation of digester in The Netherlands Phase II p 10 of 15
higher methane content compared to carbohydrates. So, depending on the input composition, a methane
content between 50 and 60% indicates a stable process. Most of the 19 studied AD-plants achieved this level
as, can be seen in Figure I. Using a hydrolysis tank can increase the methane content of the biogas during
fermentation, but not the total methane production. Some engines will reach higher conversion efficiencies at
higher methane content, making hydrolysis worthwile. When methane content decreases below 50%, this
usually is an indication of inhibition of the methanogenic bacteria, and extra digestate analyses are
recommended. Regular calibration of the biogas measuring system (at least once per year) is advised,
considering the importance of this parameter. In some installations methane content varied considerably
throughout the year, caused by process failures and/or changes in input composition.
In addition to CH4, H2S is also an important parameter in the biogas. A value > 500 ppmv can have a toxic impact
on the bacteria. High H2S content will also decrease the lifespan of the CHP-engines (many manufacturers
eliminate equipment guarantees above a certain H2S threshold value). Hence, avoiding the formation of H2S or
removing H2S is very important. Deliberate substrate selection is a first step in this process. Products such as
glycerin, whole stillage from ethanol production, onions, leek (all are products with high S-content) pose an
extra risk and should therefore only be added as a limited part of the input. If H2S formation occurs, removal
can be accomplished by several means. Two examples of internal H2S removal systems are (1) injection of small
amounts of air into the digester’s headspace, and (2) adding Fe-containing products to the reactor content.
These two methods were the most prevalent in the 19 studied plants. The advantage of internal H2S removal is
that this will decrease the levels inside the digester, thus not only improving lifespan of the engines but also
the stability of the biological process. External H2S removal systems are independent functional units; examples
are adsorbent bed media, biofilters or activated carbon filters. The main advantage is the usually higher
removal efficiency, but it does not decrease the H2S-content inside the reactor which might still be toxic to the
bacteria. Depending on the H2S concentration, a combination of both internal and external systems can be
used, keeping the H2S-content below 500 ppmv with an internal removal system to protect the bacteria and
further decreasing the H2S level to protect the engines with an external system. As can be seen from Figure I
the average H2S content lay below the toxic limit for most plants, although a temporary peak was observed in
most plants. This resulted in a negative influence on the fermentation process, but could in most cases easily
be solved by removing the cause (substrate rich in S) or by adding Fe2+
to the reactor.
Figure I. Variation of CH4 and H2S-content in 19 AD-plants
Evaluation of digester in The Netherlands Phase II p 11 of 15
The majority of the biogas was converted to electricity and heat in a CHP-engine (combined heat and power).
Around 2/3 of the studied plants had more than one engine. The main advantage of multiple engines is the
higher flexibility: in case one of the engines fails, not all of the biogas has to be flared off, unused. Some
installations opted for installing a backup engine to guarantee that all biogas can be converted to biogas, even
in case one engine would fail or is down for maintenance. Most plants had a relatively small gas buffer (usually
varying between 2 and 12 hours of gas production), so in the event of engine downtime there was a limited
capability totemporarily store the biogas production. In case of multiple engines, it is preferred to operate one
or more engines at full capacity and using one engine intermittently or at partial load to burn the residual gas
production, rather than equally distributing the biogas and operating all engines at partial load. This will
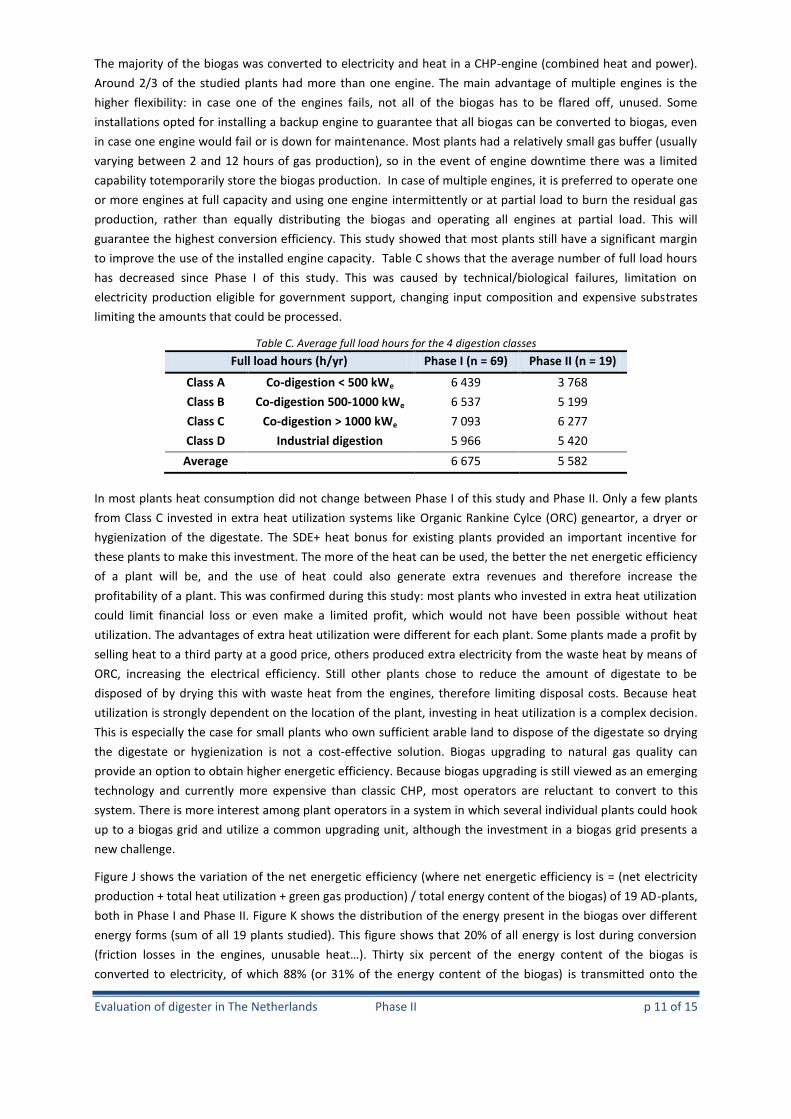
guarantee the highest conversion efficiency. This study showed that most plants still have a significant margin
to improve the use of the installed engine capacity. Table C shows that the average number of full load hours
has decreased since Phase I of this study. This was caused by technical/biological failures, limitation on
electricity production eligible for government support, changing input composition and expensive substrates
limiting the amounts that could be processed.
Table C. Average full load hours for the 4 digestion classes
Full load hours (h/yr) Phase I (n = 69) Phase II (n = 19)
Class A Co-digestion < 500 kWe 6 439 3 768
Class B Co-digestion 500-1000 kWe 6 537 5 199
Class C Co-digestion > 1000 kWe 7 093 6 277
Class D Industrial digestion 5 966 5 420
Average 6 675 5 582
In most plants heat consumption did not change between Phase I of this study and Phase II. Only a few plants
from Class C invested in extra heat utilization systems like Organic Rankine Cylce (ORC) geneartor, a dryer or
hygienization of the digestate. The SDE+ heat bonus for existing plants provided an important incentive for
these plants to make this investment. The more of the heat can be used, the better the net energetic efficiency
of a plant will be, and the use of heat could also generate extra revenues and therefore increase the
profitability of a plant. This was confirmed during this study: most plants who invested in extra heat utilization
could limit financial loss or even make a limited profit, which would not have been possible without heat
utilization. The advantages of extra heat utilization were different for each plant. Some plants made a profit by
selling heat to a third party at a good price, others produced extra electricity from the waste heat by means of
ORC, increasing the electrical efficiency. Still other plants chose to reduce the amount of digestate to be
disposed of by drying this with waste heat from the engines, therefore limiting disposal costs. Because heat
utilization is strongly dependent on the location of the plant, investing in heat utilization is a complex decision.
This is especially the case for small plants who own sufficient arable land to dispose of the digestate so drying
the digestate or hygienization is not a cost-effective solution. Biogas upgrading to natural gas quality can
provide an option to obtain higher energetic efficiency. Because biogas upgrading is still viewed as an emerging
technology and currently more expensive than classic CHP, most operators are reluctant to convert to this
system. There is more interest among plant operators in a system in which several individual plants could hook
up to a biogas grid and utilize a common upgrading unit, although the investment in a biogas grid presents a
new challenge.
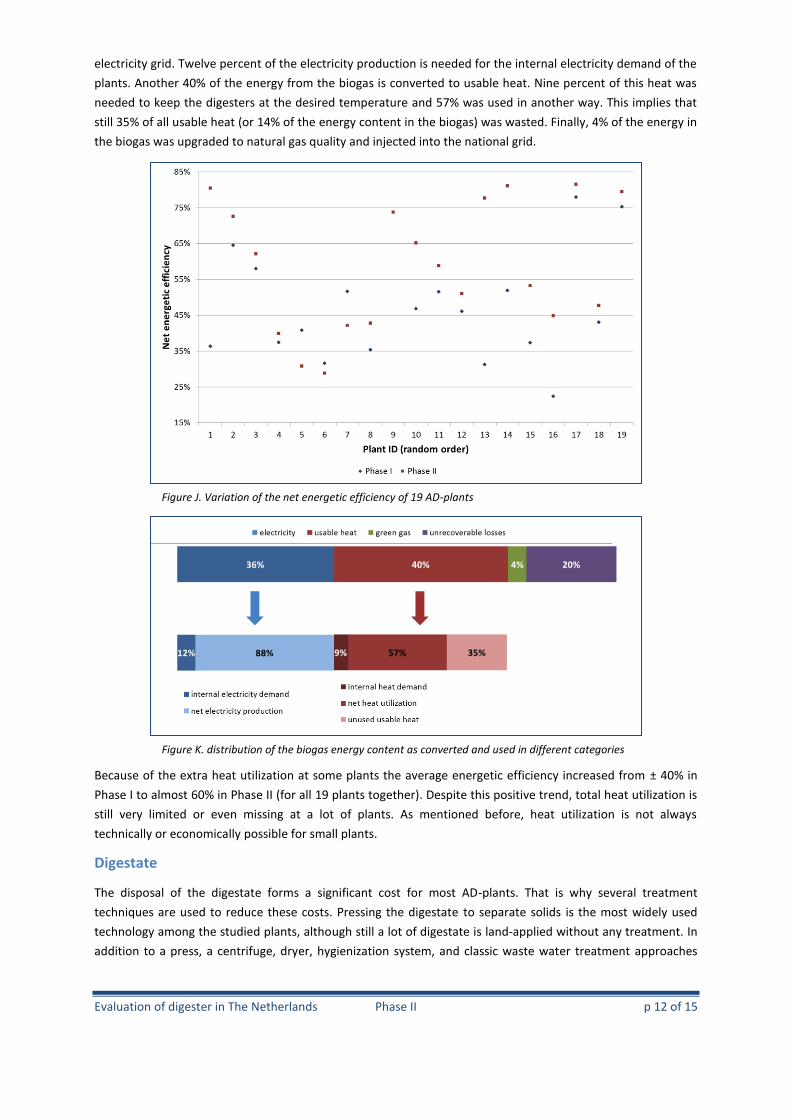
Figure J shows the variation of the net energetic efficiency (where net energetic efficiency is = (net electricity
production + total heat utilization + green gas production) / total energy content of the biogas) of 19 AD-plants,
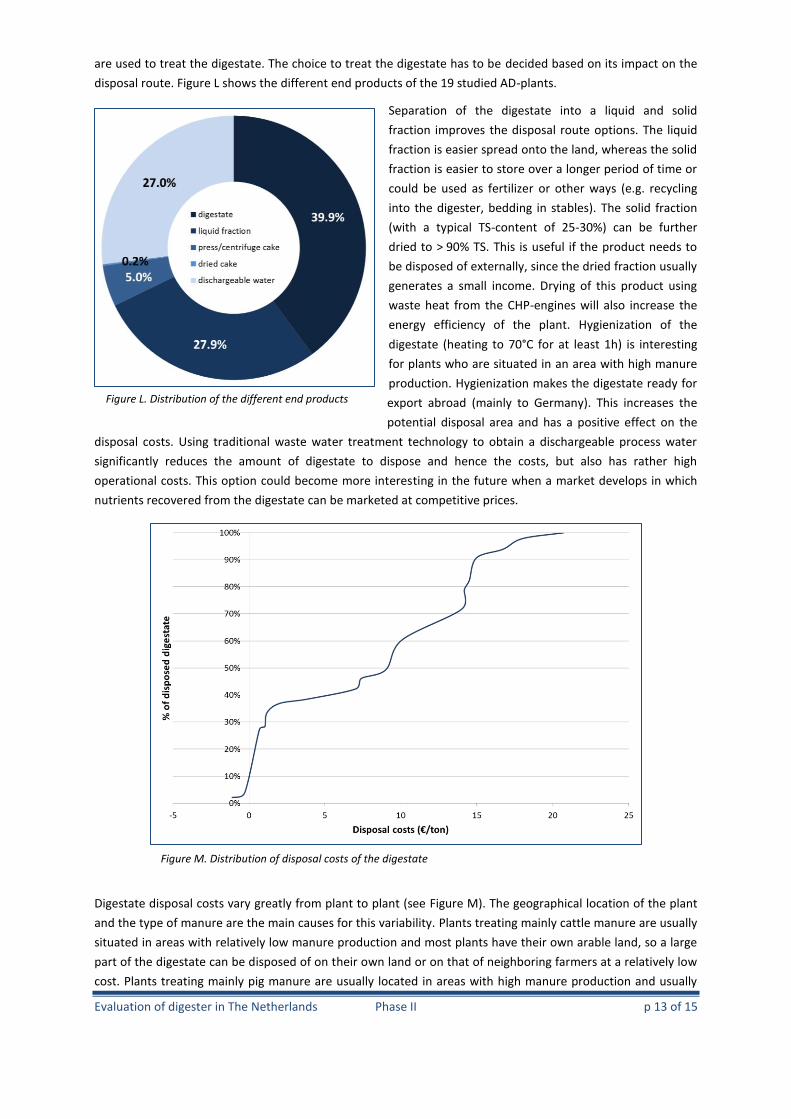
both in Phase I and Phase II. Figure K shows the distribution of the energy present in the biogas over different
energy forms (sum of all 19 plants studied). This figure shows that 20% of all energy is lost during conversion
(friction losses in the engines, unusable heat…). Thirty six percent of the energy content of the biogas is
converted to electricity, of which 88% (or 31% of the energy content of the biogas) is transmitted onto the
Evaluation of digester in The Netherlands Phase II p 12 of 15
electricity grid. Twelve percent of the electricity production is needed for the internal electricity demand of the
plants. Another 40% of the energy from the biogas is converted to usable heat. Nine percent of this heat was
needed to keep the digesters at the desired temperature and 57% was used in another way. This implies that
still 35% of all usable heat (or 14% of the energy content in the biogas) was wasted. Finally, 4% of the energy in
the biogas was upgraded to natural gas quality and injected into the national grid.
Because of the extra heat utilization at some plants the average energetic efficiency increased from ± 40% in
Phase I to almost 60% in Phase II (for all 19 plants together). Despite this positive trend, total heat utilization is
still very limited or even missing at a lot of plants. As mentioned before, heat utilization is not always
technically or economically possible for small plants.
Digestate
The disposal of the digestate forms a significant cost for most AD-plants. That is why several treatment
techniques are used to reduce these costs. Pressing the digestate to separate solids is the most widely used
technology among the studied plants, although still a lot of digestate is land-applied without any treatment. In
addition to a press, a centrifuge, dryer, hygienization system, and classic waste water treatment approaches
Figure K. distribution of the biogas energy content as converted and used in different categories
Figure J. Variation of the net energetic efficiency of 19 AD-plants
Evaluation of digester in The Netherlands Phase II p 13 of 15
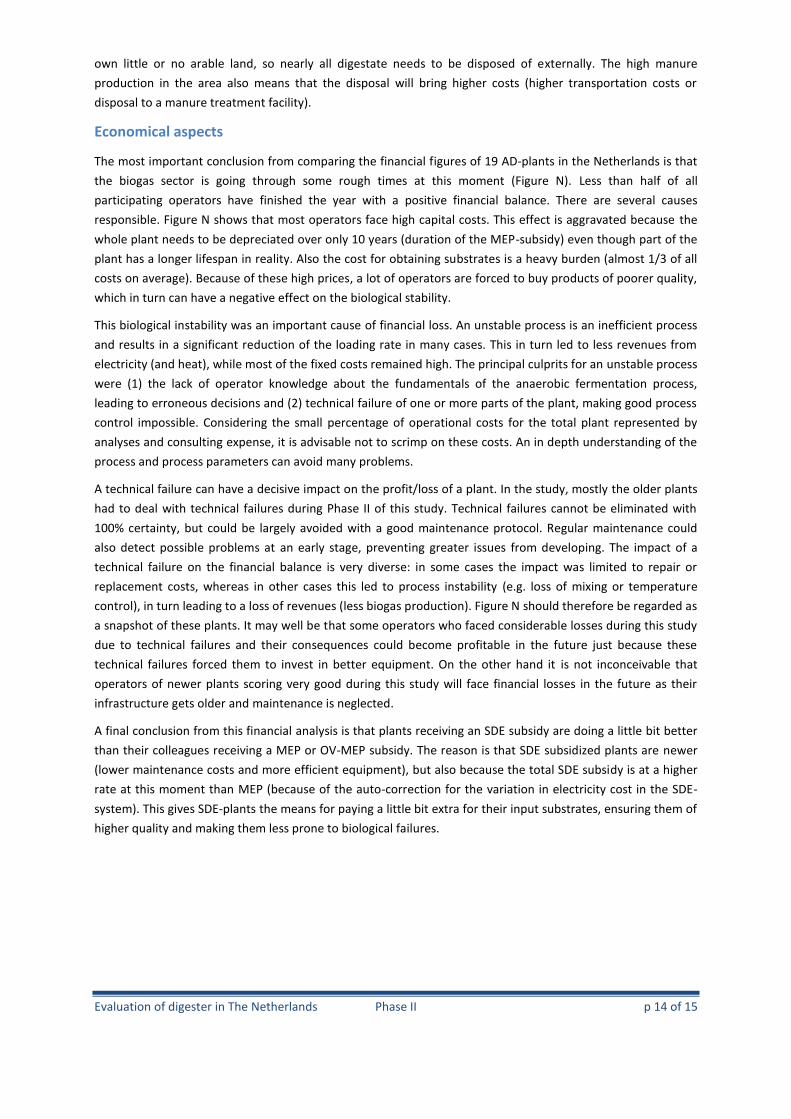
are used to treat the digestate. The choice to treat the digestate has to be decided based on its impact on the
disposal route. Figure L shows the different end products of the 19 studied AD-plants.
Separation of the digestate into a liquid and solid
fraction improves the disposal route options. The liquid
fraction is easier spread onto the land, whereas the solid
fraction is easier to store over a longer period of time or
could be used as fertilizer or other ways (e.g. recycling
into the digester, bedding in stables). The solid fraction
(with a typical TS-content of 25-30%) can be further
dried to > 90% TS. This is useful if the product needs to
be disposed of externally, since the dried fraction usually
generates a small income. Drying of this product using
waste heat from the CHP-engines will also increase the
energy efficiency of the plant. Hygienization of the
digestate (heating to 70°C for at least 1h) is interesting
for plants who are situated in an area with high manure
production. Hygienization makes the digestate ready for
export abroad (mainly to Germany). This increases the
potential disposal area and has a positive effect on the
disposal costs. Using traditional waste water treatment technology to obtain a dischargeable process water
significantly reduces the amount of digestate to dispose and hence the costs, but also has rather high
operational costs. This option could become more interesting in the future when a market develops in which
nutrients recovered from the digestate can be marketed at competitive prices.
Digestate disposal costs vary greatly from plant to plant (see Figure M). The geographical location of the plant
and the type of manure are the main causes for this variability. Plants treating mainly cattle manure are usually
situated in areas with relatively low manure production and most plants have their own arable land, so a large
part of the digestate can be disposed of on their own land or on that of neighboring farmers at a relatively low
cost. Plants treating mainly pig manure are usually located in areas with high manure production and usually
Figure L. Distribution of the different end products
Figure M. Distribution of disposal costs of the digestate
Evaluation of digester in The Netherlands Phase II p 14 of 15
own little or no arable land, so nearly all digestate needs to be disposed of externally. The high manure
production in the area also means that the disposal will bring higher costs (higher transportation costs or
disposal to a manure treatment facility).
Economical aspects
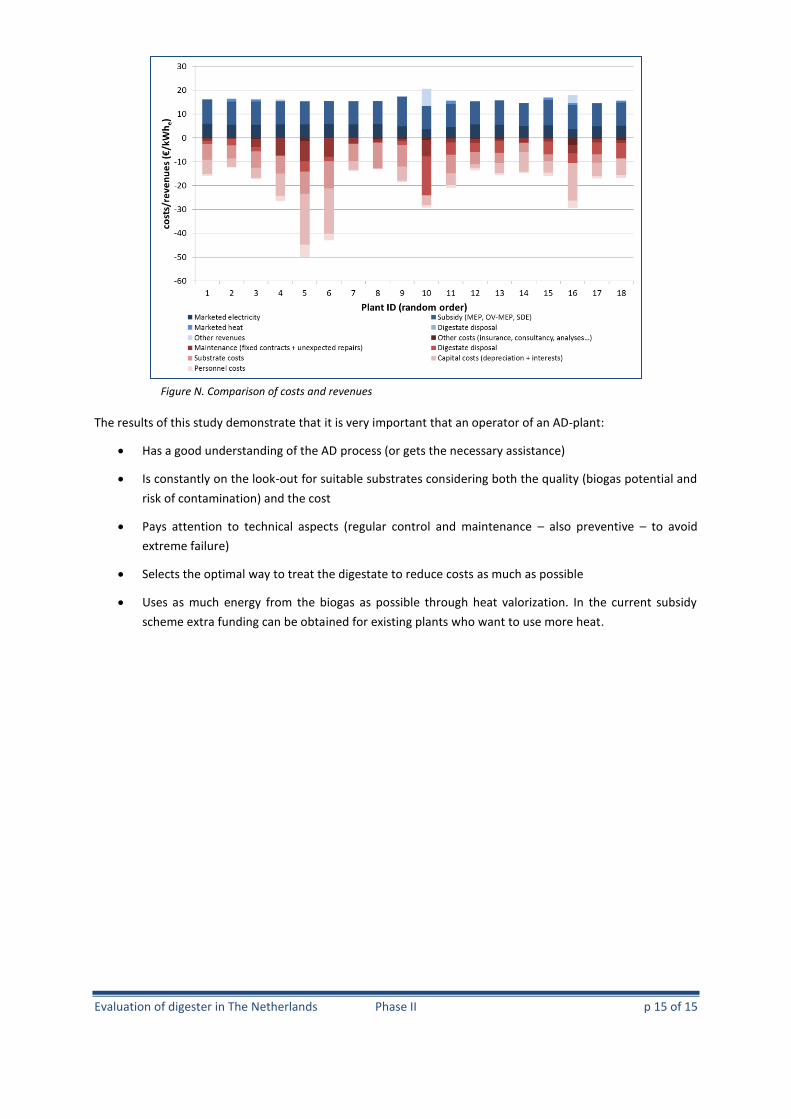
The most important conclusion from comparing the financial figures of 19 AD-plants in the Netherlands is that
the biogas sector is going through some rough times at this moment (Figure N). Less than half of all
participating operators have finished the year with a positive financial balance. There are several causes
responsible. Figure N shows that most operators face high capital costs. This effect is aggravated because the
whole plant needs to be depreciated over only 10 years (duration of the MEP-subsidy) even though part of the
plant has a longer lifespan in reality. Also the cost for obtaining substrates is a heavy burden (almost 1/3 of all
costs on average). Because of these high prices, a lot of operators are forced to buy products of poorer quality,
which in turn can have a negative effect on the biological stability.
This biological instability was an important cause of financial loss. An unstable process is an inefficient process
and results in a significant reduction of the loading rate in many cases. This in turn led to less revenues from
electricity (and heat), while most of the fixed costs remained high. The principal culprits for an unstable process
were (1) the lack of operator knowledge about the fundamentals of the anaerobic fermentation process,
leading to erroneous decisions and (2) technical failure of one or more parts of the plant, making good process
control impossible. Considering the small percentage of operational costs for the total plant represented by
analyses and consulting expense, it is advisable not to scrimp on these costs. An in depth understanding of the
process and process parameters can avoid many problems.
A technical failure can have a decisive impact on the profit/loss of a plant. In the study, mostly the older plants
had to deal with technical failures during Phase II of this study. Technical failures cannot be eliminated with
100% certainty, but could be largely avoided with a good maintenance protocol. Regular maintenance could
also detect possible problems at an early stage, preventing greater issues from developing. The impact of a
technical failure on the financial balance is very diverse: in some cases the impact was limited to repair or
replacement costs, whereas in other cases this led to process instability (e.g. loss of mixing or temperature
control), in turn leading to a loss of revenues (less biogas production). Figure N should therefore be regarded as
a snapshot of these plants. It may well be that some operators who faced considerable losses during this study
due to technical failures and their consequences could become profitable in the future just because these
technical failures forced them to invest in better equipment. On the other hand it is not inconceivable that
operators of newer plants scoring very good during this study will face financial losses in the future as their
infrastructure gets older and maintenance is neglected.
A final conclusion from this financial analysis is that plants receiving an SDE subsidy are doing a little bit better
than their colleagues receiving a MEP or OV-MEP subsidy. The reason is that SDE subsidized plants are newer
(lower maintenance costs and more efficient equipment), but also because the total SDE subsidy is at a higher
rate at this moment than MEP (because of the auto-correction for the variation in electricity cost in the SDE-
system). This gives SDE-plants the means for paying a little bit extra for their input substrates, ensuring them of
higher quality and making them less prone to biological failures.
Evaluation of digester in The Netherlands Phase II p 15 of 15
The results of this study demonstrate that it is very important that an operator of an AD-plant:
Has a good understanding of the AD process (or gets the necessary assistance)
Is constantly on the look-out for suitable substrates considering both the quality (biogas potential and
risk of contamination) and the cost
Pays attention to technical aspects (regular control and maintenance – also preventive – to avoid
extreme failure)
Selects the optimal way to treat the digestate to reduce costs as much as possible
Uses as much energy from the biogas as possible through heat valorization. In the current subsidy
scheme extra funding can be obtained for existing plants who want to use more heat.
Figure N. Comparison of costs and revenues