Embed Size (px)
Citation preview

Thesis
Amsterdam University of
applied sciences
Bahadir Palali
Julian de Jong
Evaluating Contemporary
Safety Views and Models in
Incident/Accident Investigation
Reports
2015

Evaluating Contemporary Safety Views and Models in Incident/Accident Investigation
Reports
2
Table of contents
1 Literature review.................................................................................................................................................................... 7
1.1 Safety views .................................................................................................................................................................. 7
1.1.1 Safety view aspects .......................................................................................................................................... 7
1.1.2 Differences in safety views ........................................................................................................................... 8
1.1.3 Understanding old view popularity ........................................................................................................ 11
1.1.4 Tendency towards the new view .............................................................................................................. 11
1.2 Safety models ............................................................................................................................................................ 11
1.2.1 Sequence of events ....................................................................................................................................... 11
1.2.2 Epidemiological............................................................................................................................................... 12
1.2.3 Systemic ............................................................................................................................................................. 12
2 Methodology ........................................................................................................................................................................ 13
2.1 Developing the assessment tool ........................................................................................................................ 13
2.1.1 Assessment Tool ............................................................................................................................................. 13
2.1.2 Sample ................................................................................................................................................................ 13
2.1.3 Validation .......................................................................................................................................................... 14
2.2 Applying the assessment tool ............................................................................................................................. 15
2.2.1 Assumptions ..................................................................................................................................................... 15
2.2.2 Application ........................................................................................................................................................ 15
2.2.3 Check ................................................................................................................................................................... 16
2.3 Analyzing data ........................................................................................................................................................... 16
2.3.1 Possible methods ........................................................................................................................................... 17
2.3.2 External dependency cross-test ............................................................................................................... 19
2.3.3 Internal dependency cross-test ................................................................................................................ 20
2.3.4 Significant results ........................................................................................................................................... 20
3 Results ..................................................................................................................................................................................... 21
3.1 Raw data ...................................................................................................................................................................... 21
3.2 External dependency cross-test result data ................................................................................................... 22
3.3 Internal dependency test result data ................................................................................................................ 24
3.4 Significant cross-test results ................................................................................................................................ 24
3.4.1 External significant cross-test results ..................................................................................................... 24
3.4.2 Internal significant cross-test results ...................................................................................................... 25
4 Discussion .............................................................................................................................................................................. 28
4.1 General frequencies ................................................................................................................................................. 28
4.1.1 Frequency distribution ................................................................................................................................. 28
4.1.2 Points of interest ............................................................................................................................................ 29
4.2 Significant results ..................................................................................................................................................... 30
4.2.1 External dependency cross-tests ............................................................................................................. 30

Evaluating Contemporary Safety Views and Models in Incident/Accident Investigation
Reports
3
4.2.2 Internal dependency cross-tests .............................................................................................................. 30
4.3 Non significant results ............................................................................................................................................ 32
4.3.1 External dependency cross-tests ............................................................................................................. 32
4.3.2 Internal dependency cross-test ................................................................................................................ 33
4.4 Synopsis ....................................................................................................................................................................... 33
5 Conclusion ............................................................................................................................................................................. 34

Evaluating Contemporary Safety Views and Models in Incident/Accident Investigation
Reports
4
Foreword
As parts of the research programme, we (Bahadir Palali and Julian de Jong) have worked on this
research together. This report is meant to provide the Dutch Safety Board with information regarding
their research and to function as an aid in the improvement of safety systems across industries.
This research for our thesis is provided by Dr. Nektarios Karanikas. Therefore we want to thank him for
this great opportunity to improve our scientific knowledge with a very interesting subject. We both
learned a lot during this project as regards aviation and safety, which is hopefully obvious by the result
that we produced. We both enjoyed the subject and every activity of this project.
Furthermore we would like to thank Dr. Nektarios Karanikas again for his time, assistance and effort
that he granted us during this research.
All chapters have been written in deliberation however, predominant input is shown below:
Originally written by Re-arranged and comments
implemented
Summary Julian
Introduction Julian
Literature review Julian Julian
Methodology Julian + Bahadir Julian + Bahadir
Results Bahadir Julian
Discussion Bahadir Bahadir +Julian
Conclusion Bahadir Bahadir
Appendices Bahadir
Total document checks Together Together
Bahadir Palali and Julian de Jong, August 4th
2015

Evaluating Contemporary Safety Views and Models in Incident/Accident Investigation
Reports
5
Summary
Safety critical organizations such as the aviation and nuclear industries have been highly concerned
about their safety performance. Safety performance is monitored by various proactive and reactive
methods, including the investigation of adverse incidents and accidents, collectively known as safety
investigations. Most of these methods stem from accident causation models. These models have over
time evolved from the root cause rationale to multiple cause analyses and to systemic approaches
(Katsakiori, Sakellaropoulos, & Manatakis, 2009). In parallel, the view of how humans contribute to
system failure has also shifted; for example, Dekker (2006) stated that human error must be seen as
symptom of trouble deeper in the system and not a cause.
The new accident causation models and safety thinking are widely accepted in academic circles and
have been continuously tested with positive results. Hence, it is of high interest to compare current
practice with academic thinking and research.
The problem here is formulated as: How have safety thinking and the perception of its accessory
aspects evolved since 1999?
The associated hypothesis is described as follows: New view thinking will, influenced by time, show an
increase in application in period II (2007/2014) with regards to period I (1999/2006).
In order to ‘depict’ safety thinking, a tool is created, by means of which the presence of certain safety
aspects can be measured. This is done by applying the tool to a sample of 52 investigation reports.
The resulting frequencies are processed by means of the statistical chi-2 test. By comparing each
individual result with a predetermined boundary value, something can be stated regarding the
significance of the outcome and its meaning.
A part of this research was to validate the theory by means of three benchmarks and this has
successfully been done. In addition a predominant use of this new view theory was found in the
assessed reports. Several aspects were consistently used, marking acceptance and understanding of
the theory. In contrast to all this, the focus on failure was found to be a more deep-rooted mind-set
judging by the assessment reports. Regarding the hypothesis, the majority of new view aspects were
found in period II. Tests however have shown that time does not play a significant role in the change
of any of the aspects and the hypothesis is therefore rejected.
The evolvement of safety thinking and its aspects have changed in the sense that an increase in the
use of new view aspects is visible. The easy-to-grasp aspects are embraced and often used, whereas
safety-II in particular falls behind. Although the perception of aspects has changed between 1999 and
2014, the sheer passing of time has proven to play a less than expected role in this. Despite a deep-
rooted focus on failure –in contrast with new view theory-, an increased familiarity and embracement
of new view theory was found. The increase of new view use- and embracement is believed to have a
beneficial influence on the safety within the aviation industry. A shift from a failure-focused process to
a way of working in which success lies at the basis has proven to be difficult, but a development
regarding the new view is visible.

Evaluating Contemporary Safety Views and Models in Incident/Accident Investigation
Reports
6
Introduction
After the introduction of new accident causation models and safety thinking, steps are yet to be taken
to depict the relation between these ideas and todays practice. “Have new ideas been embraced over
time?” and “what can we learn from the way in which we investigate?” are relevant question in todays
safety industry. The goal of this project therefore is to provide insight in safety-thinking evolvement in
the aviation sector whilst also providing a platform to do the same across other industries.
Providing and applying a so-called assessment tool will aid in doing so. Formatting this tool to a
certain set of industry-specific values enables it to compare different industrial practices with accident
causation models and views on safety. Applying the tool to the Dutch aviation sector and analyzing
those results will help to depict the evolution of safety thinking or the lack thereof and help answering
the problem: How have safety thinking and the perception of its accessory aspects evolved since 1999?
The build up to the answering of that question is done by the use of five chapters. The first chapter of
this report focuses on the reviewing of the literature and other means of information that was available
for the research. The safety views and aspects are discussed and their differences are explained (I).
The method behind the making and the validating of the tool is discussed, as well as how the getting
of the aimed results was envisioned (II).
Chapter three is used as a results exhibition. Up to this point their meaning is solely explained by
means of the facts; an overview of the gathered results is given (III).
Whether the results have valuable meaning and what this meaning is, will be discussed in this chapter
(IV).
The leading results and/or discussions will again be mentioned in the final chapter that will conclude
this research (V).
The most important sources for this paper are The Fieldguide to Human Error from Sidney Dekker and
the work of Hollnagel and Leveson regarding safety view aspects and accident causation models.
In the appendices you will find among others: an example of the assessment tool use and an overview
of the results per accident report.

Evaluating Contemporary Safety Views and Models in Incident/Accident Investigation
Reports
7
1 Literature review
The work of Dekker worked as a catalyst during the start of this research. In addition to the works of
Leveson and Hollnagel, his study regarding the two views on human error or safety views lies at the
basis of this research. These are; "human error as a cause of incidents/accidents " and "human error as
a symptom of trouble deeper inside a system". This chapter aims to describe certain principles that
arise from this theoretical background. Both views, as described by Dekker, are found in recent
publications on human error although they strongly differ in their perspective on human error (1.1). In
addition to the different views upon human error, there also are differences in the accident models
that are used in the aftermath of an incident/accident (1.2).
1.1 Safety views
The old view has been around since the 1960’s and proves to be a popular method even today. The
new view on the other hand –only introduced since 2004 is still to gain acceptance and become
general knowledge. The views are compared by means of a set of safety aspects, while these give
insight in the perception of each view (1.1.1). By looking at the way in which these safety aspects are
interpreted, the differences in views are explained (1.1.2). Reasons for the continued use of the old
view, despite the new view introduction are explained next (1.1.3). Contradictory to this continued use,
a tendency towards the new view can be found in the literature (1.1.4).
1.1.1 Safety view aspects
There are nine safety aspects that are regularly present in an investigation of incidents/accidents. To
clarify these safety views, each of them will be briefly discussed:
1. Human error seen as symptom.
2. Hindsight bias.
3. Shared responsibility.
4. Safety-II.
5. Control loop consideration.
6. Folk models.
7. Counterfactual approach.
8. Judgmental approach.
9. Proximal approach.
ad 1 Human error seen as a symptom
In cases where human error (HE) is present, this can either be seen as a symptom or as a cause. The
further questioning of contributing factors to this error, indicate that the error is looked upon as a
symptom, rather than a cause.
ad 2 Hindsight bias
"Hindsight bias" means being able to look back, from the outside, on a sequence of events that led to
an outcome you already know about.’’(Dekker, 2006). This way of approach does not yield a clear
picture of what really happened and merely focuses on the back tracing of events that are the closest
to the incident/accident. By doing so there will always be information missed that may have
contributed in the incident/accident. Missing information along the way will not yield to an accurate
recommendation toward the correction in safety of the regarding events. Considering the options that
were available at that moment in time and space, aid in the avoidance of a hindsight bias view. A clear
image of that moment can be made by going through the options of the operators without tracing

Evaluating Contemporary Safety Views and Models in Incident/Accident Investigation
Reports
8
back the events from the outcome that is already known. The avoidance of hindsight bias will
therefore aid in a more accurate recommendation of safety improvement.
ad 3 Shared responsibility
Shared responsibility is a term that is used for marking a balance in the focus that is put on the
organizational aspects as well as on the people that work in the front-line.
ad 4 Safety-II
"Things basically happen in the same way, regardless of the outcome. The purpose of an investigation
is to understand how things usually go right as a basis for explaining how things occasionally go
wrong.’’ (Hollnagel, 2014) In short this sketches what safety-II means: focusing on success, rather than
failure. E.g. the experience of the operators prevented the incident/accident from resulting in
something more wrong.
ad 5 Control loop consideration
This aspect revolves around the question: were there ‘loops’ or ‘circuits’ in place that could have
prevented the incident/accident (from happening or deteriorating) and were these discussed by the
investigators?
ad 6 Folk models
When during an investigation parts of a story cannot be explained, folk models are often used to fill in
the blanks. Such models are abstract statements that roughly cover the story and do not give actual
insight in the happening. To avoid misinterpretation it is better to explain everything in detail so that
no other meanings can be associated to a statement than the actual statement it implies.
ad 7 Counterfactual approach
A counterfactual approach is marked by merely focusing on comparing human performance with
decisions against standards and procedures without considering the circumstances at the time of the
decision. Often counterfactual statements translate to the stating of what people could or should have
done to prevent the incident/accident. (Dekker, 2006). When the circumstances that were present at
the moment the operator had to make a decision are considered, this implies that a non-
counterfactual approach is present.
ad 8 Judgmental approach
A judgmental approach emphasizes on what humans did or did not based on their knowledge,
experience and training (e.g., did not pay attention, they made the wrong decision, they did not
communicate well) without getting into underlying reasons. Judging the closest humans in proximity
of the incident/accident is a human instinct but not always the fairest. This way of approach is an easy
way out and will most probably suit the public but is not always fair toward the operator, since there
might have been contributing factors that were out of the operator his control.
ad 9 Proximal approach
Proximal: “Reactions to failure focus firstly and predominantly on those people who were closest to
producing and to potentially avoiding the incident/accident”. (Dekker, 2001). Just like judgmental
statements a proximal approach offers an easy way out. Factors that play a role in proximal approach
may be financial reasons. Proximal approaches in most cases do not yield a safe solution in the long
run and must therefore be avoided.
1.1.2 Differences in safety views The perception of certain aspects or perceptions that are linked to the old view and reasons for
tending to such behaviour are discussed (1.1.2a). The differences when comparing the old view to the
new view are depicted through the explanation of the different aspects (1.1.2b).

Evaluating Contemporary Safety Views and Models in Incident/Accident Investigation
Reports
9
1.1.2a Old view
Each view can be defined by the way they give explanation to the before-mentioned set of aspects.
Several different aspects form the base of a particular view, together with the way in which they are
conceived determine how this view is classified. For example the views are labelled old or new. In its
core, it can be said that the old view works from a principle where it is believed that human error is the
cause of accidents. The use of hindsight bias and folk models in particular are inherent to this view on
safety. As mentioned before: “Hindsight means being able to look back, from the outside, on a
sequence of events that led to an outcome that is already known.’’ (Dekker, 2006.) Consequently the
use of hindsight is closely linked to the way in which there is reacted to failure. Four common reactions
can be identified:
- Retrospective
- Counterfactual
- Judgmental
- Proximal
Retrospective reactions are found in situations where the observer is able to look back on events that
contributed to the incident/accident; therefore it is easy for them to see what and where things went
wrong. The outcome is known thus making it possible to derive back from the accident. While doing
this, the counterfactual reaction comes into play. Here, the observer concentrates on what could or
should have been done to prevent the situation from escalating. This is where the counterfactual
reactions differ from the judgmental reactions, since the latter of the two solely judges behaviour of
the human operator based on norms and expectations, as these stem from training, experience and
daily practice. People are judged for their actions, actions that often result in a degradation of the
situation. Examples of judgmental reactions are; not taking sufficient time to conduct tasks, lack of
awareness of the on-going processes or insufficient motivation of the operators. In a judgmental
reaction the observer basically blames the operator for their incorrect actions. The final type of
reaction is a proximal reaction; in this situation the observer centres its investigation on one particular
aspect. An example of an accessory mindset is as follows: “Either individuals or systems were closest in
time and space to the incident/accident”. With this type of reaction the observer is focused on one
aspect that contributed to the incident/accident and not the other aspects resulting in the
incident/accident. This will affect the way in which research is conducted. The result of a proximal
reaction will be an investigation that focuses on an end-user and not incorporating the interrelations
between various aspects in a system. “These traps are common because investigations aim to explain a
part of the past, yet they are conducted in the present and thus inevitably influenced by it (Dekker,
2006)”. This sentence refers to the traps that lure investigators into reacting in one of the ways
mentioned above, being that they are:
Aware of the outcome of a sequence of events that they are investigating.
Aware of the clues and indications that were critical in the light of the outcome, i.e. the signs
of danger?
Aware of the actions that would have prevented the outcome.
These traps, along with the reactions they invoke, result in an oversimplification of the past. A complex
system is turned into a linear sequence of events, where the consecutive events are easily determined.
In addition, different aspects that affected or contributed to an incident/accident are often generalized
by means of folk models. Folk models work by taking various aspects and hiding them under one
specific term. Instead of clarifying and explaining, they adopt abstract statements to describe a
problem. They are often introduced to compensate for a piece of missing information and give a
blurred view on the situation. (Metzelaar & van Rooij, 2013)

Evaluating Contemporary Safety Views and Models in Incident/Accident Investigation
Reports
10
1.1.2b New view
The new view works from a principle in which human error is seen as a symptom of trouble deeper
inside a system. An incident or accident is not always the consequences of the actions of one person,
there are always external factors that influenced the occurrence. At the end no one with a healthy mind
has the intention to cause an incident or accident, they may have been forced to act the way they did
because of external influences. In other words, it can be an outcome of many factors (e.g. company
policy, erroneous regulations, external factors in privacy, time pressure, organisational influences,
influences of multiple parties, diverse external influences etc.). The intension of the new view is to trace
the presence of external factors that may have played role in the incident/accident and not merely
focussing on the persons that were closest to the incident/accident. Along with this change in mind-
set, also comes the change in the interpretation of the before-mentioned aspects. Rather than
describing these changes, they are viewed below (Table 1).
Old view New view
Human Error seen as
symptom.
HE is often seen as a cause of
accidents instead of a symptom
of trouble deeper within a
system.
Looking for possible contributing
factors that might have led to
the HE.
Hindsight bias avoidance Focus on finding inaccurate
assessments, wrong decisions or
bad judgment.
Instead of analyzing faults
(Human Error), consider why
their actions made sense to them
at that time and what options
they had prior to the accident.
Shared responsibility
Mere focus on the end-user(s)
and leaving out higher
organizational influences.
End-user is no focal point &
organizational influences are also
investigated.
Safety-II Humans are predominantly seen
as a hazard or liability, resulting
in an overall emphasis on failure.
Humans are seen as a resource
necessary for system flexibility
and resilience. Instead of
thinking in terms of failure, focus
lies on thinking in success.
Control loops No effective controlling
mechanisms that could have
aided in the prevention of an
incident/accident are taken into
account.
Feedback mechanisms between
different involved parties in the
incident/accident were
considered during the
investigation.
Lack of folk models Adopting abstract statements –
folk models.
Decomposing and explaining the
problem.
Non Counterfactual Focus lies in comparing human
performance i.e. decisions and
actions, against standards and
procedures.
Applying further research onto
the contributing factor to the
human error.
Non judgemental Actions are compared with that
persons knowledge, experience
and training.
Applying further research onto
the contributing factor to the
human error.
Non proximal Predominant focus on the sharp-
end1 of an accident.
Abstaining from end-user focus
and including organizational
aspects in the investigation.
1 Sharp-end: that part of the system that was closest to producing or potentially avoiding an accident.

Evaluating Contemporary Safety Views and Models in Incident/Accident Investigation
Reports
11
(Lack of in-depth investigation of
end-user distinguishes this from
shared responsibility.)
Table 1 Safety view overview of old and new perspective
From this table it becomes apparent that both views are the exact opposite of each other when it
comes to these aspects. These changes arise from the fact that focus has shifted from finding where
people went wrong, to trying to understand their behaviour.
1.1.3 Understanding old view popularity Although the new view has been introduced several years back, it is yet to be fully accepted and
understood by the bigger public. Recent publications on human error have shown that the old view is
still often used. In "The Field guide to human error, (2002)" Dekker states that there are three main
reasons for investigators to adhere to the old view, being:
Cheap & easy solution
Saving face
Illusion of omnipotence
The old view asks for a relatively easy approach, is simple to understand and it costs little to
implement. In addition, the pressure of public opinion is easily dealt with by marking human error as
the sole problem. It soothes the public to see that something is done about the problem, while at the
same giving them the idea that it is no systemic problem. Finally, people are inclined to believe that
they can simply choose between making errors and not making them. The freedom of choice is
overestimated and accountability will tend to point in the direction of the end-user.
1.1.4 Tendency towards the new view Since the prioritizing of safety in different sectors, many views on safety have been created or
adjusted, of which the above-mentioned are deemed the most important. Both these views were
created with the idea in mind of increasing safety. The difference in time periods however, has had
major impact on the way in which they view the various aspects. The continued development of
technology and systems asks for new understanding of these systems and the way in which they
should be controlled. This is backed-up by this statement: “The new view of human error holds the key
to progress on safety. Investigations according to the new view lead to the clarification of the
underlying difficulties in the way, circumstances in which people work and in the tools they operate
(Field guide to human error, Dekker, 2000). In today’s world, using the old view will most likely keep us
unaware of how everyday actions contribute or fail to contribute to safety. By adjusting the way in
which safety aspects are viewed and adding methods and practices, originating from a new mind-set,
it is expected that these methods will aid in the understanding of these processes.
1.2 Safety models
Safety models are not exactly a safety view but they are very closely linked to it. There are roughly
three categories of safety models and they differ in character. One of them is the sequential model
(1.2.1). This model has partial resemblance with the epidemiological model, which analyses the
accident deeper (1.2.2). Next to these two there is a more complex model called the systemic model
(1.2.3).
1.2.1 Sequence of events This type of model depicts the leading up to an accident as a chain of discrete events. The cause-effect
relation is hereby linear and deterministic. Identification and removal of the event that initiated the

Evaluating Contemporary Safety Views and Models in Incident/Accident Investigation
Reports
12
chain of events (root cause) is believed to prevent a recurrence of the accident. This type of model fails
in clearly depicting the cause-effect relation between management, organization and humans in a
system and is linked to the old view on safety. Examples of this model are the domino effect model
(Heinrich, 1931), the Fault tree analysis (Watson, 1961) and the Five Why’s method (Ohno, 1988).
1.2.2 Epidemiological In Epidemiological models, accidents are seen as a combination of latent and active failures, analogous
to the spreading of a disease (Qureshi, 2007). Latent factors e.g. organizational culture or management
practices are potential contributors to an accident, but can lie dormant within a system for long
periods of time. The way, in which, organizational factors can affect accident causation, are better
reflected by this type of model. However, the linear cause-effect relation, as known from the sequential
model, is still often found in this type of model. In the work and publications of Hollnagel (1997),
Leveson (2001) and Svedung & Rasmussen (2002), they argued that these epidemiological techniques
were no longer able to account for the increasingly complex nature of socio-technical system
accidents. Examples of epidemiological models are; the Swiss cheese model, the Australian Transport
Safety Bureau (ATSB) model, The Human Factors Analysis and Classification System (HFACS) model,
the System occurrence analysis methodology model and the Tropod beta model.
1.2.3 Systemic Systemic models aim to understand the structure and behaviour of a system. Comprehending the
behaviour of an entire system can aid in understanding how this contributes to an accident. One of the
benefits paired with the system model, is the ability to evaluate non-linear processes. They do not
operate under the cause-effect sequences used in the other two accident models. This allows them to
evaluate processes much closer to the complex areas, where the system operates close to success or
failure. Another difference with the other two models is sketched by means of this quote: “System
accidents result not from component failures, but from inadequate control or enforcement of safety-
related constraints on the development, design and operation of the system” (Leveson, 2002).
Examples of systemic models are; the System Theoretical Accident Model and Processes (STAMP)
model, The Functional Resonance Analysis Method (FRAM) model, the System Theoretical Process
Analysis (STPA) model and the AcciMap approach model.

Evaluating Contemporary Safety Views and Models in Incident/Accident Investigation
Reports
13
2 Methodology
With respect to the goal of this Thesis report, the methodology has been split into three parts. The
process of developing the assessment tool is necessary in order to filter out the usable raw data and
guarantee reliable results as a result (2.1). The steps that need to be taken during the application are
discussed (2.2). In anticipation of the gathering of the ‘raw data’, a plan is made in which the method
for converting this data into usable information is discussed (2.3).
2.1 Developing the assessment tool
A concise and easy to use model is necessary for the assessment of incident/accident reports.
Therefore several practical issues had to be dealt with (2.1.1). Along with the creation of the
assessment tool (framework), a sample had to be chosen and gathered. The categorization of the
sample and the choice of incident/accident reports are addressed (1.1.2). The last step in this process
is the validation of the assessment tool. By doing this the quality and reliability of the results are
ensured (1.1.3).
2.1.1 Assessment Tool The development of the assessment tool will be built by using two existent frameworks as feedback. By
using the applicable parts and adding information from the literature, a collectively inclusive and
mutually exhaustive assessment tool can be created. As stated before, the assessment tool is meant to
create a way in which the incident/accident reports can easily be analyzed. To aid in this process, all
theoretical background needs to be present in a concise and understandable manner (Table 2). In
addition, a way of showing the presence or absence of the nine safety aspects had to be thought of.
Since the differences in the before-mentioned views on safety must clearly come to light, when
investigating the incident/accident reports, the choice was made to construct the assessment tool
based upon the safety aspects (1). In order to make the assessment tool accessible for new users,
guidance was also added, explaining in detail what to look for in the incident/accident reports i.e. what
marks either a new or old view (2). In combination with a theoretical definition of the aspects (3), this
must enable the user to mark whether or not a specific aspect has been found in the incident/accident
report (4). To back-up the findings, evidence from within the incident/accident report must be stated
(5).
Safety aspects (1) Definition (2) Guidance (3) YES, NO, N/A (4) Evidence (5)
Table 2 Assessment tool columns
2.1.2 Sample In order to be able to start with the assessments, a sample of incident/accident reports within the
aviation sector was necessary. On behalf of the Dutch government, such incident/accident reports are
made by the Dutch Safety Board (DSB). The DSB conducts investigations with regard to safety in
different sectors and publishes these incident/accident reports in their online database. For this thesis
report all applicable incident/accidents reports were checked after which it was decided to use a
sample of fifty-two incident/accident reports. Out of these fifty-two, twenty-six were marked Human
Factors (HF) incident/accident reports. This categorization has been made according to the information
that is derived from the summary of each individual incident/accident report. In addition to this
categorization, the incident/accident reports were also split into two time periods. Based upon the
release-date of the incident/accident report, the incident/accident report will either fall into the first
time period (1999-2006) or the second time period (2007-2014). The split line between time periods
are based on the approximate release year of the new safety views (which is 2004) together with the
average time the investigators need to complete an investigation and publish an incident/accident

Evaluating Contemporary Safety Views and Models in Incident/Accident Investigation
Reports
14
report (which is two years). The respective categorizations were made to see if either a difference in
time period or the involvement of end-users has a significant influence on the results. Information
regarding the incident/accident reports is provided separately (Appendix I – Sample).
2.1.3 Validation After composing the assessment tool, its usability for research must be verified. The validation is done
in three steps. Namely;
1. Second opinion
2. Pilot study
3. Inter rater reliability
2.1.3a Second opinion
The raw version of the assessment tool was presented to Dr. Karanikas. Dr. Karanikas was of the
opinion that there should be an extra column where the evidence needs to be inserted. This column
serves as a validation and proof of the choice that is made. Dr.Karanikas stated that the assessment
tool seemed to be able to satisfy the needs in this research. In order to validate the assessment tool
for its usability a pilot study must be executed where the assessment tool will be tested by means of a
sample.
2.1.3b Pilot study
Two sets of incident/accident reports are used as a sample. Each set consists of four incident/accident
reports, two human error related and two non-human error related. In total eight incident/accident
reports are used to conduct a pilot study that is meant for the validation of the assessment tool. From
the first pilot study, consisting of four incident/accident reports, it became apparent that the
perception of the guidance was misunderstood. This was the case for the guidance for HSBA, S-II, HES
and CL. Hindsight bias avoidance was often wrongly marked as ‘yes’. A similar thing happened for the
S-II aspect. As mentioned before, Safety-II is either there or not. During the pilot study however this
aspect was marked ‘not applicable’ for a number of times. Regarding the CL aspect, this was often
mistaken for communication instead of control loops. As reaction to the pilot study results it was then
decided to adjust the guidance for the respective aspects. In addition for HES, an assumption (2.2.1)
has been introduced. Two raters executed this pilot study. With respect to their relatively low
experience regarding the safety-thinking concept, two sets of incident/accident reports are chosen.
Here, the first set acted as a start-up set. It was agreed that the assessment of the second set, needed
an 80% agreement, among the raters, for the assessment tool in order to be considered as ‘ready for
use’.
2.1.3c Inter rater reliability
An inter rater reliability or inter rater agreement is a degree of agreement among raters. It is a
percentage that gives the amount of homogeneity or consensus among raters with regards to their
ratings. If various raters do not agree, either the scale is defective or the raters need to be trained in
the manner of executing the assessment. Meaning that either the scale cannot be validated or the
raters (assessors) are not capable to conduct the assessment. The lower boundary (minimum
percentage) of the agreement must be chosen before the inter rater reliability test is conducted. The
agreement must be higher than the lower boundary in order to successfully conclude the test. In this
research this means that if the lower boundary of agreement is not passed, either the assessment tool
is not valid or the raters are not capable to conduct the assessment. Like previously noted, the lower
boundary on which there has been agreed before conducting the pilot study, was at least 80%. The
method that is used to yield the degree of agreement is Fleiss' Kappa (Appendix II - Fleiss' Kappa).
This method can be used to assess the degree of agreement between all raters. At first it was decided
that the degree of agreement among raters must be higher than the 80% lower agreement boundary
in order to validate the assessment tool. Because the research was a qualitative research the actual

Evaluating Contemporary Safety Views and Models in Incident/Accident Investigation
Reports
15
agreement among raters of 67% for the incident/accident reports and 76% for the safety aspects was
accepted as sufficient to validate the assessment tool (Appendix III - Inter rater reliability results).
An example of the final assessment tool is provided (Appendix IV – Definitive assessment tool).
2.2 Applying the assessment tool
After validation of the assessment tool, it is shown usable for research. By applying it, it is capable to
yield the usable data for the research. Before applying the assessment tool, assumptions need to be
made in order to use the assessment tool in its context. This guarantees the proper usage of the
assessment tool on the sample (2.2.1). The remainder of the 52 incident/accident reports will then be
used for the application (2.2.2). The quality of the research and the gathered data must be checked
after the assessment tool is applied to all incident/accident reports. Going through all
incident/accident reports and checking the gathered data on its logic gives ads to the quality of the
gathered data (2.2.3).
2.2.1 Assumptions Assumptions are made to use the assessment tool in its context. The assumptions are implemented
inside the guidance of the assessment tool. Each safety aspect has guidance inside the assessment
tool. This guidance must ease the tracing of the safety aspects inside the incident/accident reports.
Most of the time it is hard to trace the safety aspects inside the incident/accident reports and when
found it is sometimes a dilemma if the safety aspects are really present. Therefore these assumptions
are made;
"Human error as a symptom" is applicable if at least 50% of all participants that are involved in
the accident (e.g. pilot and air traffic control) are discussed.
Safety-II cannot be "not applicable". It is either there or not.
There is always a model used (Sequential, Epidemiological or Systemic)
2.2.2 Application The pilot study contains eight incident/accident reports, four human error related and four non human
errors related. Since the research is intended to be conducted on a total sample of 52
incident/accident reports, 26 human error related reports and 26 non human error related
incident/accident reports, this leaves 44 incident/accident reports not assessed. Therefore the
assessment tool will be applied to the remaining 44 incident/accident reports, 22 human errors related
and 22 non human error related. The results of this pilot study however, will also be taken into account
in the final results. During this process every incident/accident report will be assessed on the nine
different aspects as they are mentioned before, next to this the applied safety model is also assessed.
The guidance and definition of the assessment tool provide help in doing so. With exception to a few
(2.2.1), every safety aspect has three options: ‘yes’, ‘no’ and ‘not applicable’. Whether or not a specific
aspect is present in the incident/accident report and how the investigators perceived these, can be
made visible trough these options. The option ‘not applicable’ needs further explanation; this option
must be marked when an aspect does not apply to the investigation or when the specific aspects has
not been investigated. For example, when no human error was involved in the incident/accident
report, this aspect must be marked ‘not applicable’. In the event that human error is present, the
guidance and definition must be used to conclude to a ‘yes’ or ‘no’ for this aspect. In addition to their
choices, the assessors need to insert the evidence of their findings in verification of their decision. This
is decided in order to ensure a greater quality of research. This approach of application of the
assessment tool is used for every single incident/accident report of the sample.

Evaluating Contemporary Safety Views and Models in Incident/Accident Investigation
Reports
16
2.2.3 Check The quality of the research and the gathered data must be checked after the assessment tool is
applied to all incident/accident reports. Additional checks upon own assessments of the
incident/accident reports must therefore be made in order to validate the reliable outcomes and
improve quality. Three logical behaviours regarding the investigators that frequently occur are checked
on their presence. When these are present it is most likely to be reliable information. This is done by
means of certain causalities that arise from the theoretical background. The three frequently occurring
behaviours arise from the following causalities:
1. When human error (HE) is seen as a cause.
2. When non-Proximal reactions are found.
3. When there is an absence of hindsight bias avoidance.
ad 1 HE as a cause
In cases where HE is seen as a cause, it is expected to find judgmental, counterfactual and proximal
views and vice-versa. These three safety aspects are typical safety aspects that define a judgmental
view toward the end users. Therefore it is obvious that the investigators have seen human error as the
root cause. To achieve a greater research quality and to validate the reliable results a re-assessment
must be executed.
ad 2 Non-proximal reactions
The definition of proximal view is; "Reactions to failure focus firstly and predominantly on those people
who were closest to producing and to potentially avoiding the incident/accident " (Dekker, 2001).
When investigators have looked upon the accident as non-proximal (distal), they have most likely
taken shared responsibility in account. Because this makes logical sense, the incident/accident reports
are re-checked on the presence of shared responsibility when non-proximal safety aspect is present.
To achieve a greater research quality and to validate the reliable results a re-assessment is executed, if
proven to be necessary.
ad 3 Absence of hindsight bias avoidance
Hindsight bias is an easily used method for investigators, when investigating an incident/accident. This
lead to the question whether the investigators of DSB have used hindsight bias avoidance when
investigation the incident/accident. Taken in account that hindsight bias is more often present than
not, a 30% trigger is established to the use of hindsight bias avoidance in all incident/accident reports.
When this 30% limit is exceeded it is most likely that the information found in the incident/accident
reports is not reliable. So the incident/accident reports need to be re-assessed. However, if after a
thorough re-assessment this figure appears to be reliable, it will be kept this way, since this number is
not funded upon the literature.
2.3 Analyzing data
Based on the information available a method is found suitable to analyse the raw data. This method is
to categorize the frequencies into discrete categories and then execute a Chi-2 test in order to yield
results that can address the hypothesis. In other words all frequencies are categorised into nominal
value categories. These values are used in a Chi-2 test. Chi-2 test is a general name for multiple
different tests that are existing, who all have their own speciality. The ones that are relevant to our
research are the Pearson asymptotical Chi-2 test of independence and the Fisher exact Chi-2 test of
independence (2.3.1). With means of this method relations between the safety aspects (dependent
variables) and independent variables are explored (2.3.2). Besides this, there is also explored for
relations between safety aspects without external influences (2.3.3). The yielded results in the form of
percentages that are beneath a certain boundary value are significant results (2.3.4). These results are

Evaluating Contemporary Safety Views and Models in Incident/Accident Investigation
Reports
17
interesting because they indicate significant difference between the cross-tested categories which is
exactly what this research is about.
2.3.1 Possible methods The gathered data are frequencies of selected safety aspects. In order to use these numbers, they need
to be translated to a “language” by means of which something can be said about these numbers. The
best way to do this is to categorize these numbers as nominal values. Nominal values are variables that
are discretely classified observations placed into categories. In other words, measurement variables
(for example; 33.5mm, 36.7mm, 34.4mm etc.) classified into discrete categories (for example; "small
bolts"32.5mm to 34.5mm and "big bolts" 34.5mm to 38.5mm). Discrete categories of measurement
variables, which are now nominal variables, can be expressed in words (for example "small", "normal",
"great"). For example, there is a test and the possible ratings are from 1 to 10 and it happens to be
that every rating above the six is a pass for the test. Now when the scores among participants are
gathered, only ratings are seen. Now if the ratings below the six are classified as fail and the ratings
above the six as a pass, we have created two discrete categories. In other words, we have created two
nominal variables. Information such as age or gender can also be classified (e.g. 1 to 10, 7 to 15 and
male or female). These variables are compatible for analysis that can yield an answer where there can
be said something about the hypothesis. This analysis is done by means of mathematical cross-tests.
Now nominal variables can be used to compare classified other variables (e.g. measurement variables)
among categories. Here, something can be said about the degree of independence of these categories
relating to each other.
A mathematical method to analyse independence is the Chi-2 test of independence. Chi-2 is a test that
can be used to analyse the “goodness of fit or independence. The independence test will be used for
the research of this thesis. Chi-2 is a mathematical analysis method that consists of many different
kinds of methods. The ones that are related to this research are the Pearson Chi-2 test of
independence and the Fisher exact Chi-2 test of independence. The difference in application lies in the
sample numbers that are available or the value of the expected value. When sample sizes become
small the Pearson's Chi-2 test gives inaccurate results. According to an old rule of thumb, sample sizes
are small when the expected value of the sample is less than five. The acceptance of this rule is based
on how great the acceptable error may be, between p-value of the Pearson's test and the p-value
Fisher's test.
The following example does not have an expected value below the five but it will show the error
between p-values of the two tests. For example let say there are eleven donkeys and there are two
kinds of grass. Let also say that we are nice to donkeys in the world and present them two kinds of
grass for them to choose. Grass-I is wet grass and Grass-II is relatively dry grass. If the null hypothesis
states that there is no significant preference for one type of grass the expected preferences would be
that 5.5 donkeys choose Grass-I and 5.5 donkeys choose grass-II. Now when the observed numbers
are compared to the expected values by applying Pearson's asymptotical Chi-2 test, yields a p-value of
0.035. That would mean that the donkeys have a preference for one type of grass over the other type
of grass. But when the same comparison is done with the Fisher's exact Chi-2 test, the cross-test yields
a p-value of 0.065. This would mean that there is no significant preference for one type of grass by the
donkeys. This would also mean, if Pearson's Chi-2 test of independence was used, that the significance
would be falsely accepted. This error is known as type-I error (falsely positive) and occurs when sample
sizes become small. It is generally accepted that the acceptable error is at the expected value of five.
So the rule of thumb is to take the exact test when the sample sizes are so small that the expected
values are less than five.
This rule is an old method and currently there is a new method where there can be calculated when to
swap to exact test. For example, we take the same p-values as the previous example because these
values also suit this example. The idea is to take the exact test en calculate the p-value nearest to 0.05

Evaluating Contemporary Safety Views and Models in Incident/Accident Investigation
Reports
18
without going beneath it. And then do the same cross-test with the same numbers applying the
asymptotical test. The p-value of the exact test is 0.065 and the p-value of the asymptotical test is
0.035. When the p-value of the asymptotical test is divided by the p-value of the exact test
(0.035/0.065=0.54) an error value of 54% is yielded. This means that the error is 54%. The acceptance
of a certain error value is based on many factors and differs for different purposes. For the
determination of the error value there needs to be a compromise by the ones conducting the analysis.
Because this way of determining the test choice includes too many factors, the choice was made to
apply the old rule of thumb that has successfully been used for a long time.
The possible methods that can be used to translate this data are listed below:
1. Pearson Chi-2 test of independence
2. Fisher Chi-2 test of independence
ad 1 Pearson Chi-2 test of independence
A Chi-2 test is a statistical form of mathematical analysis test where the significance of the deviation of
a normally distributed sample is calculated. Pearson's Chi-2 test of independence is an asymptotical
test that yields an approximated Chi-2 value. This Chi-2 value, in turn, together with the degree of
freedom of the sample, yields an approximated p-value. When the sample size becomes grater, the p
value becomes more exact and the difference with the Fisher's p-value becomes less. For this test, the
p-value can be derived from a table where every chi-2 value corresponds with a p-value. The formula
of the Chi-2 test is:
n = Number of classes
F = Observed
E = Expected
n-1 = Degree of freedom
ad 2 Fisher exact Chi-2 test of independence
The Fisher's exact Chi-2 test of independence is just like the Pearson's Chi-2 test of independence a
test to determine if there are non-random associations between two categorical variables. The Fisher
exact Chi-2 test of independence is an exact test that yields a Chi-2 value that in turn yields an exact p-
value. The formula that is used for the fisher's Chi-2 test is relative more complex in comparison with
the Pearson's chi-2 formula. The explanation of the working of the Fisher method is beyond the scope
of this research. However, the formula that leads to the Fisher's p-value is:
Where, the variables are shown below (Table 3)
NO YES
NO A B A+B
YES C D C+D
A+C B+D N
Table 3 Fisher's exact matrix
First of all it has to be noted that the p-cutoff-value is based on the matrix that has direct relation to
the case that is tested. All the other p-values that are yielded by the same formula are not seen as p-

Evaluating Contemporary Safety Views and Models in Incident/Accident Investigation
Reports
19
cutoff-values but just as a p-value for other matrices with the same column and row total. The
following will clear up this statement. The matrix can be set up in different ways where the row and
column totals can be achieved in multiple ways to the same numbers. This would mean that the
composition of the matrix, as regards A, B, C, D is different but the row and column totals still the
same. Thereby also changing the p-value achieved by the formula for every matrix that have the same
row and column totals. Since both the row-totals and column-totals add up to one certain amount,
several combinations are possible. For example: if A=5 and B=7, this makes that A+B=12. Now, if we
compute only by means of the row and column-totals, A and B might also be 6, since this also adds up
to 12. Now if all possible options of matrix composition are computed, each will give a certain p-value.
As final step the Fisher's p-value is calculated by the following formula:
2.3.2 External dependency cross-test In order to find whether or not there are relations between one safety aspect (dependent) and an
independent variable, the external dependency cross-test is to be conducted. Here, the aspects will be
cross-tested with a set of independent variables:
1. Period against safety aspects
2. End-user involvement against safety aspects
3. Fatalities against safety aspects
ad 1 Period against safety aspects
This cross-test is to be performed in order to see whether there is a relation between the view that
investigators have on certain aspects, and the time in which they conduct their investigation. In other
words: does time play a role in the perception of the aspects and safety views?
ad 2 End-user involvement against safety aspects
Due to the nature of the incident/accident, end-user involvement could play a significant role in the
perception of safety views and its aspects. In order to see if there is relation between end-user
involvement and a change in perception of views, this cross-test is to be conducted.
ad 3 Fatalities against safety aspects
Is there a relation to be found between the presence of fatalities and the perception of the people
investigation the incident/accident? A lack of testimony could play a role in this, as could some
emotional effects; to see if this is the case, a cross-test is to be conducted.
In addition, a cross-test is conducted to see if, regarding the different aspects, one independent
variable influences another. This is a cross-test regarding a partial correlation and is executed for the
period and the presence of an end-user.
2.3.2a Application of Chi-2 to external dependency cross-test
The table below shows the categories in which the nominal variables are categorized (Table 4). Every
safety aspect (1) has three nominal categories (2). These are Yes, no and not applicable. Every nominal
category consists of frequencies (3). Like previously stated a Chi-2 test can only be applied to two
nominal variables. For example if the relation of period with an aspect is explored than two of the
three nominal variables are taken from that particular safety aspect in two different time periods. The
difference in the two nominal variables in one period is cross-tested against the difference of two
nominal values in another time period. This will give a result on the change of relation of the two
nominal variables in time periods.

Evaluating Contemporary Safety Views and Models in Incident/Accident Investigation
Reports
20
YES (2) NO N/A
Safety aspect (1) (3)
Table 4 Nominal categories of Safety aspects
The table below (Table 5) shows an example of the cross-test explained above. The period is the
independent variable (1), the safety aspect is the dependent variable (2), T1 and T2 represents the two
time periods (3), The YES and NO represents the two nominal categories (4) and the percentage
symbols represents the percentage of the sample that include the nominal category in question. In this
table the difference of nominal categories in time period two are compared to the difference of
nominal categories in time period one.
Table 5 Chi-2 test example
SAFETY ASPECTS (2)
NO (4) %
2 YES %
PERIOD (1) T1 (3)
T2
2.3.3 Internal dependency cross-test The relations among the different aspects are reviewed by means of internal crosschecking. These
results will give insight in relations that exist between one aspect and another, regardless of external
influences. These cross-tests are also executed with the same method explained in the last sub
paragraph (2.3.2a).
2.3.4 Significant results Significant results are defined as relations between nominal variables that have such deviation from
the expected that there can be concluded that there is a structural difference; all chance can be
eliminated. A 2-sided Chi-2 tests with a 95% reliability interval will be conducted, meaning that when
the Chi-2 value of a cross-test yields a p-value of less than 5% (p-value<0.05), the relation between the
assessed safety aspects is deemed significant (Less or more, dependent on the change in frequency
numbers). These results of these cross-tests will be further looked into.
2 % : Percentages within the variable. E.g.; if HFS is tested against model than the depicted percentages, in the boxes, are the
percentages out of all incident/accident reports that include HFS. In other words if in the total sample 70% of all
incident/accident reports include the safety aspect HFS and 30% is noted in the regarded box than this 30% is the percentage
out of the 70%. To be more clear; 7 reports out of the 10 incident/accident reports include HFS, than the total amount of HFS
incident/accident reports will be 70%. Now taking this 70% and making it 100% of all incident/accident reports with HFS. 30% of
this 70% (now 100%) will be 0,3 * 7 = 2,1.

Evaluating Contemporary Safety Views and Models in Incident/Accident Investigation
Reports
21
3 Results
The frequencies that are derived from the assessments of the incident/accident reports are shown as a
basis of this chapter (1.1). The cross-test upon the external dependency of the aspects is shown and its
results are briefly considered (1.2). Concerning the internal dependency cross-test, the same is done
(1.3). The respective significant results are finally depicted in detail (1.4).
3.1 Raw data
The application of the assessment tool on the 52 incident/accident reports has yielded raw data in the
form of frequencies. These frequencies are put together in a table (Table 6). For a clearer view a graph
is made (Graph I). The frequencies inside table are the frequencies of the safety aspects as they are
found in all the incident/accident reports combined.
SAFETY ASPECTS YES NO N/A
Human error seen as symptom (HES) 25 11 16
Hindsight bias avoidance (HSBA) 16 19 17
Shared responsibility (SR) 26 18 8
Safety – II (S-II) 7 43 2
Control Loop (CL) 36 14 2
Lack of folk models (LOFM) 37 10 5
Non-counterfactual view (NCOUNT) 25 13 14
Non-judgmental view (NJUDG) 24 14 14
Non-proximal view (NPROX) 22 19 11
Casualties resulting from incident/accident (CRFM) 4 48
Table 6 Total of found frequencies in incident/accident reports
Both tables provide an overview of the findings that were found during the assessment of the
incident/accident reports. Although it cannot give insight in the relations between the various aspects,
this graph does provide information about the amount of new view aspects that were found in all
incident/accident reports and the ratios per aspect.
Graph I Total of found frequencies in incident/accident reports
Concerning the models that were used, a similar thing is done. The table below (Table 7) shows an
equal ratio between the sequential (1) and epidemiological (2) model and barely any use of the
systemic (3) model.

Evaluating Contemporary Safety Views and Models in Incident/Accident Investigation
Reports
22
Chain of events (C) Epidemiological (E) Systemic (S)
Accident Model 25 (1) 26 (2) 1 (3)
Table 7 Distribution of model usage
The graph below provides information about the use of either one of the three available models
(Graph II). Whether there is a relation between model-usage and the aspects cannot be derived from
this graph.
Graph II Frequencies of all used models
In order to do this, the data in the form of frequencies was translated by means of the Chi-2 tests, so
that it could be used for addressing the hypothesis.
3.2 External dependency cross-test result data
The results from the three individual cross-tests are provided below. (Table 8). The table shows the
numerical p-values per cross-test along with the letter (P) or (F), which refers to a Pearson- or Fisher
exact test correspondingly.
DIRECT CORRELATION
PERIOD EU FATAL
HES ,481 P 0,650 F 0,290 F
HSBA 1,000 P 1,000 F 1,000 F
SR ,541 P 1,000 P 0,634 F
S-II 0,098 F 0,434 F 1,000 F
CL 1,000 P ,213 P 0,310 F
LOFM 1,000 F ,168 F 1,000 F
NCOUNT 1,000 P ,689 F 0,278 F
NJUDG 1,000 P 1,000 F 0,616 F
NPROX 1,000 P ,325 P 1,000 F
MODEL 0,267 P 0,002 P 0,610 F
Table 8 External dependency direct correlated results
These p-values give insight into the relations between the respective aspects and external variables. As
stated, results <0,05 are deemed significant and are shown in bold. Both the period and fatalities do
not seem to have any influence on the perception of the investigators concerning the aspects. These

Evaluating Contemporary Safety Views and Models in Incident/Accident Investigation
Reports
23
non-significant results will not be further discussed in this chapter. However some of them will be
discussed later in this thesis report. The significant data will be presented and addressed later in this
chapter.
The partially correlated cross-test as it is executed for the period and end-user presence is viewed
below (Table 9).
PARTIALLY CORRELATED
PERIOD CRTLD FOR EU EU CTRLD FOR PERIOD
EU NEU T1 T2
HES 1,000 F 1,000 F 1,000 F ,617 F
HSBA ,707 P ,429 F ,206 F ,638 F
SR ,716 P ,608 F 1,000 F 1,000 F
S-II ,573 F ,104 F 1,000 F ,378 F
CL 1,000 F ,646 F ,167 F 1,000 F
LOFM 1,000 F ,458 F 0,130 F 1,000 F
NCOUNT 0,454 F 0,167 F 0,571 F ,129 F
NJUDG ,702 F 0,464 F ,263 F ,617 F
NPROX 0,715 P 0,545 F ,162 F 1,000 F
MODEL 1,000 F 0,341 F ,122 F 0,015 P3
Table 9 External dependency partially correlated results
Results show that in the case that the end-user presence is controlled, in period two a significant
results is found regarding the model use. No other significant results are found from this cross-test.
Nevertheless, valuable information that is derived from this cross-test will be addressed further in this
thesis report.
3 Significant results are shown in bold

Evaluating Contemporary Safety Views and Models in Incident/Accident Investigation
Reports
24
3.3 Internal dependency test result data
The following table (Table 10) depicts the results from the internal cross-tests. As stated before, this
cross-test aims to find dependencies among the aspects, regardless of external influences.
INTERNAL DEPENCY
HES HSBA SR MODEL
HES 0,271 F 0,002 F 0,002 F
HSBA 0,271 P 0,166 P 0,152 P
SR 0,002 F 0,166 P 0,000 P
S-II
CL
LOFM 0,227 F 1,000 F 0,714 F 0,472 F
NCOUNT 0,153 F 0,467 P 1,000 P 0,146 F
NJUDG 0,273 F 0,724 P 0,168 P 0,716 F
NPROX 0,027 P 0,092 P 0,000 P 0,007 P
MODEL 0,002 F 0,152 P 0,000 P
Table 10 Internal dependency cross-test results table
From the table it becomes apparent that the applicability of human error, shared responsibility and the
choice of model all have influence on certain other aspects during an investigation. The application of
hindsight bias avoidance does not seem to have any influence on the other aspects. Nevertheless,
several relations between aspects are depicted as significant results and will be discussed later in this
chapter. Specific relations or the lack thereof will be addressed in the discussion, later in this thesis
report.
3.4 Significant cross-test results
The significant results, as they are depicted in the previous sub-chapters, are addressed in detail. The
underlying frequencies are shown and the result is briefly explained, starting with the significant results
from the external dependency cross-test (1.4.1). The same will be done for the significant results that
resulted from the internal dependency cross-test (1.4.2).
3.4.1 External significant cross-test results Significant results arose in two cross-tests concerning the internal dependency cross-test:
1. End-user vs MODEL
2. End-user * T2 vs MODEL
Each cross-test is shortly addressed below. In addition the frequencies, as they are derived from the
incident/accident report assessments, are depicted.
ad 1 End-user vs Model
The values in the table below (Table 11) show the exploration of the relation between the involvement
of an end-user and the model selection. This cross-test has yielded a Chi-2 p-value of 0,002. This result

Evaluating Contemporary Safety Views and Models in Incident/Accident Investigation
Reports
25
means that end-user involvement in the incident/accident reports has had influence over the type of
model that was used during the investigation of the incident/accident.
Table 11 Chi-2 cross-test of the dependency of safety model in NEU against EU
incident/accident reports
MODEL
C %
4 E %
EU EU 8 28.6 20 71.4
NEU 17 73.9 6 26.1
ad 2 End-user * T2 vs MODEL
The values in the table below (Table 12) show the exploration of the relation between end user
involvement and the model selection in a fixed time period. In the depicted table, time period two is
fixed. This cross-test has yielded a Chi-2 p-value of 0,015. Meaning, that regarding the end-user
incident/accident reports, period two has had a significant influence of the type of model that was
used during the investigation of the incident/accident. In other words the chain of event model is
significantly more used in non end user incidents/accidents in comparison with end user involved
incidents/accidents.
Table 12 - Chi-2 cross-test of the dependency of safety model in time period 2
between EU and NEU incident/accident reports
MODEL
C % E %
EU*PERIOD
(T2)
EU 4 30.8 9 69.2
NEU 11 84.6 2 15.4
3.4.2 Internal significant cross-test results Significant results arose in several cross-tests concerning the internal dependency cross-test:
3. HFS vs SR
4. HFS vs NPROX
5. HFX vs Model
6. SR vs NPROX
7. SR vs Model
8. Model vs NPROX
Each cross-test is shortly addressed below. In addition the frequencies, as they are derived from the
incident/accident report assessments, are depicted.
ad 1 HFS vs SR
The values in the table below (Table 13) show the exploration of the relation between the involvement
of human error that is seen as a symptom and the usage of shared responsibility. This cross-test has
yielded a Chi-2 p-value of 0,002. This means that the marking of shared responsibility in the
incident/accident reports is closely linked to the perception of human error as a symptom by the
investigators.
4 % : Percentages of total sample

Evaluating Contemporary Safety Views and Models in Incident/Accident Investigation
Reports
26
Table 13 Chi-2 cross-test of the relation between SR and HFS in incident/accident
reports
SR
NO % YES %
HFS NO 9 81.8 2 18.2
YES 6 24.0 19 76.0
ad 2 HFS vs NPROX
The values in the table below (Table 14) show the exploration of the relation between the perception
of human error as a symptom and the usage of a non-proximal approach. This cross-test has yielded a
Chi-2 p-value of 0,027. This result means that whenever human error was perceived as a symptom,
rather than a cause, a non-proximal view was often found.
Table 14 Chi-2 cross-test of the relation between NPROX
and HFS
NPROX
NO % YES %
HFS NO 9 81.8 2 18.2
YES 9 36.0 16 64,0
ad 3 HFS vs Model
The values in the table below (Table 15) show the exploration of the relation between the perception
of human error as a symptom and the model selection. This cross-test has yielded a Chi-2 p-value of
0,002. This result leads to say that the perception of human error as a symptom can be linked to the
selection of the epidemiological model.
Table 15 Chi-2 cross-test of the relation between safety models and HFS
MODEL
C % E %
HFS NO 8 72.7 3 27.3
YES 4 16.7 20 83.3
ad 4 SR vs NPROX
The values in the table below (Table 16) show the exploration of the relation between the involvement
of shared responsibility and the usage of a non-proximal approach. This cross-test has yielded a Chi-2
p-value of 0,00. This means that in most cases where shared responsibility was present, a non-proximal
view was used.
Table 16 Chi-2 cross-test of the relation between NPROX
and SR
NPROX
NO % YES %
SR NO 15 93.8 1 6.3
YES 4 16.0 21 84.0

Evaluating Contemporary Safety Views and Models in Incident/Accident Investigation
Reports
27
ad 5 Model vs Shared responsibility
The values in the table below (Table 17) show the exploration of the relation between the involvement
of shared responsibility and the model selection. This cross-test has yielded a Chi-2 p-value of 0,00. In
other words, the use of the epidemiological model is correlated with the rise of shared responsibility
presence in the incident/accident reports.
Table 17 Chi-2 cross-test of the relation between safety model and SR
SR
NO % YES %
MODEL C 13 76.5 4 23.5
E 5 19.2 21 80.8
ad 6 Model vs NPROX
The values in the table below (Table 18) show the exploration of the relation between the model
selection and the use of a non-proximal approach. This cross-test has yielded a Chi-2 p-value of 0,007.
This means that the choice for an epidemiological model is correlated with the use of a non-proximal
view during the investigation.
Table 18 Chi-2 cross-test of the relation between safety model and NPROX
NPROX
NO % YES %
MODEL C 11 78.6 3 21.4
E 8 30.8 18 69.2
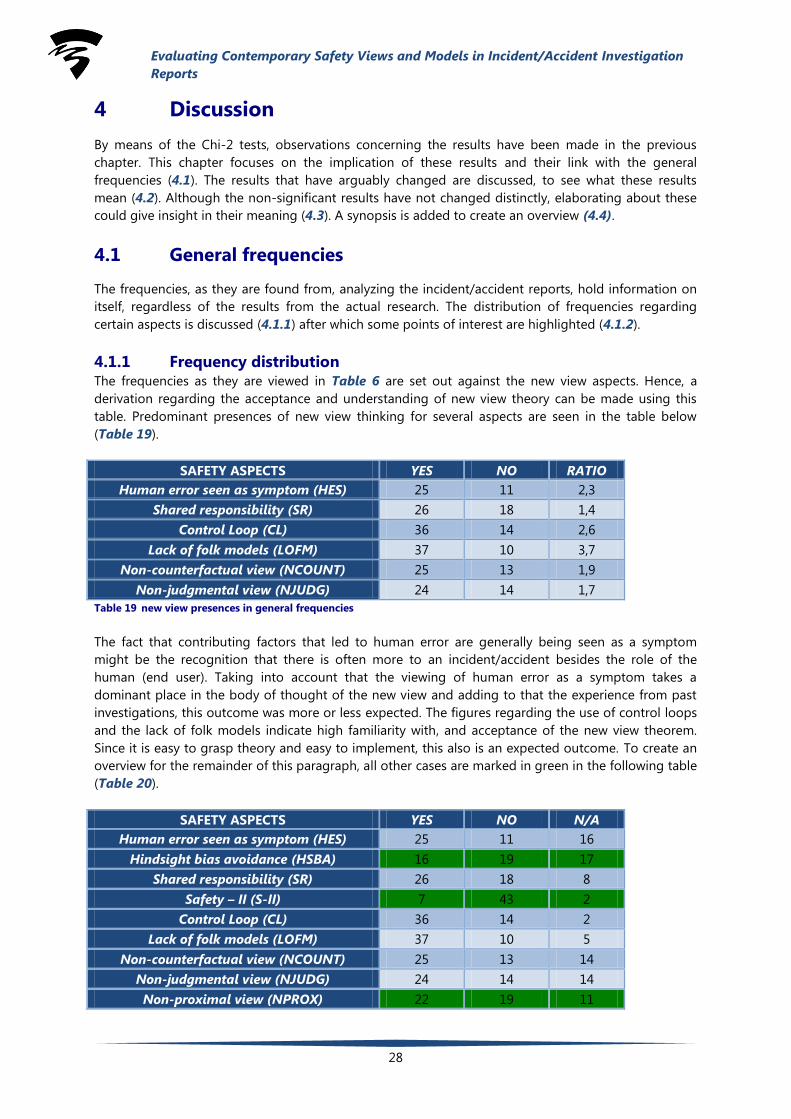
Evaluating Contemporary Safety Views and Models in Incident/Accident Investigation
Reports
28
4 Discussion
By means of the Chi-2 tests, observations concerning the results have been made in the previous
chapter. This chapter focuses on the implication of these results and their link with the general
frequencies (4.1). The results that have arguably changed are discussed, to see what these results
mean (4.2). Although the non-significant results have not changed distinctly, elaborating about these
could give insight in their meaning (4.3). A synopsis is added to create an overview (4.4).
4.1 General frequencies
The frequencies, as they are found from, analyzing the incident/accident reports, hold information on
itself, regardless of the results from the actual research. The distribution of frequencies regarding
certain aspects is discussed (4.1.1) after which some points of interest are highlighted (4.1.2).
4.1.1 Frequency distribution The frequencies as they are viewed in Table 6 are set out against the new view aspects. Hence, a
derivation regarding the acceptance and understanding of new view theory can be made using this
table. Predominant presences of new view thinking for several aspects are seen in the table below
(Table 19).
SAFETY ASPECTS YES NO RATIO
Human error seen as symptom (HES) 25 11 2,3
Shared responsibility (SR) 26 18 1,4
Control Loop (CL) 36 14 2,6
Lack of folk models (LOFM) 37 10 3,7
Non-counterfactual view (NCOUNT) 25 13 1,9
Non-judgmental view (NJUDG) 24 14 1,7
Table 19 new view presences in general frequencies
The fact that contributing factors that led to human error are generally being seen as a symptom
might be the recognition that there is often more to an incident/accident besides the role of the
human (end user). Taking into account that the viewing of human error as a symptom takes a
dominant place in the body of thought of the new view and adding to that the experience from past
investigations, this outcome was more or less expected. The figures regarding the use of control loops
and the lack of folk models indicate high familiarity with, and acceptance of the new view theorem.
Since it is easy to grasp theory and easy to implement, this also is an expected outcome. To create an
overview for the remainder of this paragraph, all other cases are marked in green in the following table
(Table 20).
SAFETY ASPECTS YES NO N/A
Human error seen as symptom (HES) 25 11 16
Hindsight bias avoidance (HSBA) 16 19 17
Shared responsibility (SR) 26 18 8
Safety – II (S-II) 7 43 2
Control Loop (CL) 36 14 2
Lack of folk models (LOFM) 37 10 5
Non-counterfactual view (NCOUNT) 25 13 14
Non-judgmental view (NJUDG) 24 14 14
Non-proximal view (NPROX) 22 19 11

Evaluating Contemporary Safety Views and Models in Incident/Accident Investigation
Reports
29
Casualties resulting from incident/accident
(CRFM)
4 48
Table 20 Frequencies other than those with predominant new view presence
The high marking of S-II as “NO” shows that during an investigation the emphasis still lies upon
finding failure. This in contrast to the high marking of “YES” regarding control loops, where effective
feedback mechanisms which include part of successful barriers, thus S-II, are dulled. The unnatural or
unorthodox way of approaching an incident/accident with S-II, which is by instead of looking for
failure, the aim is to understand normal operation and investigate the incident/accident from there on
further might be an explanation that S-II is relatively less applied.
4.1.2 Points of interest There are several points of interest to be found when looking closely at the table above (Table 20).
Some of them can directly be related to the theorem that is described in the literature review (4.1.2a),
others add to the research without validating the theory (4.1.2b).
4.1.2a Validating theory
With respect to the validating of the theory as it is described in the literature review, there are two
points of interest:
1. HES in relation to NJUDG, NPROX, NCOUNT
2. NPROX in relation to SR
ad 1 HES in relation to NJUDG, NPROX, NCOUNT
Based upon the theory, it is expected that whenever HES is present, NJUDG, NPROX & NCOUNT will
also be present. Judging from the frequencies in (Table 20) this expectation is depicted. Regarding
“YES” the number of markings are very close together (25, 25, 24, 22 red.). This backs up the theory.
ad 2 NPROX in relation to SR
The presence of NPROX to some extent creates an expectation of SR presence; in vice versa, this does
not necessarily have to be the case. This is exactly what is depicted when looking at (Table 20),
proving the theory to be correct.
4.1.2b Separate findings
Some statements regarding separate findings can be made, this findings are:
1. CRFM in relation to S-II
2. Marking of HSBA and HES as “N/A”
ad 1 CRFM in relation to S-II
Table 20 shows that from 52 incident/accident reports, in 48 cases there were no casualties. In 43 of
these cases, S-II was marked as “NO”. An explanation might be that whenever the severity of an
accident is low, further explanation of successful barriers is deemed less important. It could also imply
that focus lies on finding failures during investigations.
ad 2 Marking of HSBA and HES as “N/A”
HSBA and HES are respectively marked “N/A” in 17 and 16 cases. Although this is not necessarily
expected, it is explainable. The sixteen cases regarding HES arose from the non human-factor
incident/accident reports. Since the avoiding of hindsight bias revolves around the presence of
humans, in these incident/accident reports it is often marked “N/A”.

Evaluating Contemporary Safety Views and Models in Incident/Accident Investigation
Reports
30
4.2 Significant results
Significant results imply a significant change in the approach. These changes are exactly the
phenomenon that this research explores. Taking the presented, to be executed, cross-tests in the
methodology as division in explaining these relations, this subparagraph is divided in two.
Independent/dependent cross-tests are cross-test that are executed between one independent
nominal variable and a dependent nominal variable and explore the direct relation between these in
the usage by DSB (4.1.1). The results of the external dependency cross-tests give an indication of the
approach of DSB toward dependent variables in comparison to each other. The points of interest of
these are discussed (4.1.1). For the internal dependency cross-tests the same is done (4.1.2).
4.2.1 External dependency cross-tests Executing cross-tests where dependent variables are put against independent variables gives an
insight in the relation between safety aspects in the incident/accident reports where the concerning
independent variables are present. The results that are yielded from these cross-test gives a view on
the way DSB approaches incidents/accidents in certain situations when certain safety views are
present. The significant results from the external dependency cross-tests are addressed below.
4.2.1a End-user / Model
The results of this cross-test shows that the DSB applies significantly more epidemiological model in
cases where an end user (operator) is involved in comparison to non end user incident/accident
reports. Also, in non end user incident/accident reports significantly more sequential model is applied
in comparison to end user incident/accident reports. This implies that the DSB does not see it fit to
look deeper into the organizational aspects that contributed toward the incident/accident when no
operator is involved. With regards to the cases where an operator is involved the DSB tends to act fair
by analyzing the deeper organizational aspects that may have contributed to the accident.
4.2.1b End-user * T2 / Model
The results of this cross-test imply that in all non end user incident/accident reports in period two,
significantly more sequential model is used in comparison to the epidemiological model, regarding the
end user incident/accident reports in period two. This is also the case other way around. Namely, the
epidemiological model is significantly more applied in all end user incident/accident reports in time
period two in comparison to the non end user incident/accident reports in that same period.
The fact that the same cross-test with the incident/accident reports in period one did not yield
significant results implies that the DSB has increased the application in epidemiological model in
period two when end user is involved. In other words, the DSB decreased the use in sequential model
in all end user cases in period two. A reason for the increase of epidemiological model usage in period
two could be that the current epidemiological model is finished in development around 2003. Taking
in account that the sample used in this research is divided between two periods (namely 1999 till 2006
and 2007 till 2013), makes it plausible the investigators at DSB had more time to familiarize with the
epidemiological model.
4.2.2 Internal dependency cross-tests As in the previous section, executing cross-tests where dependent variables are put against other
dependent variables gives an insight in the relation between safety aspects in the incident/accident
reports where the concerned dependent variables are present. Discussing the results of these cross-
tests gives a view on the way in which the DSB approaches incidents/accidents in certain situations
when specific safety views are present. Much like the previous section the significant results from the
internal dependency cross-tests are addressed below. For every result the meaning is discussed and a
reason for the presented behaviour is sought.

Evaluating Contemporary Safety Views and Models in Incident/Accident Investigation
Reports
31
4.2.2a HES / SR
The results of this cross-test implies that in incident/accident reports where human error is seen as a
symptom, shared responsibility is significantly more used than in incident/accident reports where
human error is seen as cause. This is also the case when the cross-test is executed the other way
around. Namely, in incident/accident reports where shared responsibility is used, human error is
significantly more seen as a symptom than in incident/accident reports where shared responsibility is
not used.
This result shows that when human error is seen as symptom the DSB tends to go deeper into the
organisation to search for pathogens of latent failures. By applying equal focus to all parties involved,
DSB tends to recommend a greater safety quality to the regarding authority. This outcome was to be
expected since these aspects are quite closely linked when considering the guidance.
4.2.2b HES / NPROX
The result of this cross-test implies that in incident/accident reports where human error is seen as
symptom, non-proximal approach is significantly more used than in incident/accident reports where
human error is seen as cause. Considering the theory, this outcome was expected.
4.2.2c HES / Model
This cross-test result implies that in all incident/accident reports where human error is seen as a
symptom, the epidemiological model is significantly more used than where human error is seen as
cause. This is also the case when the cross-test is executed the other way around. Namely, in all
incident/accident reports where epidemiological model is used, human error is significantly more seen
as symptom than incident/accident reports that use the sequential model. This is a logical outcome
according to the theory. Because accepting human error as symptom means that there is explored for
more than only the error of the end users. This includes exploring active and latent errors in all parties
involved. Finding the usage of epidemiological model in incident/accident reports where human error
is seen as symptom proves that the researchers of DSB executed a more thorough approach to find
these active and latent errors in all parties involved.
4.2.2d SR / NPROX
This cross-test result implies that in incident/accident reports where shared responsibility is used, there
is significantly more non-proximal approach used than in incident/accident reports where no shared
responsibility was found. Presence of shared responsibility does not necessarily indicate the presence
of a non-proximal view; this test shows that investigators actively abstain from using a proximal view.
4.2.2e SR / Model
This cross-test result implies that in all incident/accident reports where shared responsibility is used,
there is significantly more epidemiological model applied, with respect to the incident/accident reports
where no shared responsibility was included. This is also the case when the cross-test is executed the
other way around. Namely, in all incident/accident reports where sequential model is used there is
significantly less shared responsibility applied. Using an approach in which all parties are treated as
equal, needs a more thorough and in-depth investigation, also considering the organizational aspects.
An epidemiological approach therefore is the more suitable choice. This is most probably the reason
for the preference for the use of this model in these cases.
4.2.2f Model / NPROX
This cross-test result implies that in all incident/accident reports where an epidemiological model is
used, there is significantly more use of a non-proximal approach, with respect to the incident/accident
reports that used a sequential model. This is expected just like the previous cross-test (1.1.2e). To
Evaluating Contemporary Safety Views and Models in Incident/Accident Investigation
Reports
32
involve organisational factors into the safety responsibility the investigation needs a more distal
approach and the result of this cross-test proves this.
4.3 Non significant results
Non-significant results at first sight do not give insight in relations between aspects. Although no
significant change was measured, these results can provide interesting information.
4.3.1 External dependency cross-tests The non-significant results from the external dependency cross-tests are addressed below. For every
result the meaning is discussed and a reason for the presented behaviour is sought.
4.3.1a Period / Elements
The results of the cross-test conducted on the exploration of the usage of elements between periods
have shown that there are no significant changes between periods in usage of these elements. This
implies that a change in time or period does not have any influence on the choice of the investigators
regarding the individual elements. The lack in significance could mean that the DSB is not totally
familiar with the new safety thinking aspects or it could also mean that they deliberately did not use
the elements because they did not see them fit.
4.3.1b EU / Elements
The results of the cross-test conducted on the exploration of the usage of elements between end user
and non end user incident/accident reports has shown that there are no significant changes between
these in usage of the elements. This implies that there is no significant difference in the application of
elements between end user involved incident/accident reports and non end user involved
incident/accident reports. The only significant result is the effect of end user involvement in
incidents/accidents on model selection in incident/accident reports. This particular result is already
discussed thoroughly in the previous section. In overall this result would meant that the DSB is not
influenced by an involvement of end user in the usage of the safety aspects and therefore maintains its
objectivity.
4.3.1c Period controlled for EU versus Elements
In the cross-test where the effect of time period is explored on elements between end user involved
incident/accident reports and no end user involved incident/accident reports, there are no significant
results yielded. This implies that there is no significant difference in the use of the elements between
end user involved and no end user involved in both time periods. This means that the interpretation of
an incident/accident is not influenced by an involvement of an end-user in both periods. This could be
because the DSB is of the opinion that the method that they currently use for end user involved and
non end user involved, is effective in its current state and does not need improvement.
4.3.1d EU controlled for Period versus Elements
In this cross-test no significant results were yielded, except for the cross-test with model selection. The
significant result is already thoroughly discussed in the previous section. The results of this cross-test
imply that there is no significant difference in the use of the elements between time periods in both
end user and non end-user incident/accident reports, except for the model selection. Together with
the results of the latter cross-test (4.2.1c), this would mean that the investigators are not influenced by
both time and end user involvement with regards to the element use. This suggests that the DSB is not
changing their approach regardless of the change of incident/accident period or end user involvement
in an incident/accident.
Evaluating Contemporary Safety Views and Models in Incident/Accident Investigation
Reports
33
4.3.1e Fatal versus elements
The results of this cross-test imply that the safety aspects usage in fatal accidents is not significantly
different to the usage of safety aspects in non-fatal accidents. This suggests that the investigators are
not influenced by the emotional effects that fatalities might bring along and that the presence of a
testimony does not have significant influence over the element perception of the investigators.
4.3.2 Internal dependency cross-test In this section there is just one notable cross-test, namely the relation in usage of hindsight bias to
other safety aspects in incident/accident reports. The cross-test where the effect of the safety aspect
hindsight bias avoidance on the usage of other elements is explored has yielded no significant results.
This implies that a hindsight bias avoiding approach does not have any influence on the usage of
another element in incident/accident reports. According to the theory, hindsight bias safety aspect has
no direct relation with another safety aspect. Therefore this result is not out of the ordinary.
4.4 Synopsis
New view theory has been accepted by academics as an enhancement with regards to the old view.
However, its practice and accuracy had never been tested in practice until know. Since the results have
validated what has been stated in theory, a preference for the new view can be stated.
A change in time or period is not nearly an important factor in the change of aspect perception as was
expected. This could be due to factors within the system of investigators that cause to stick to
procedures. Another explanation for this test results might be that the DSB has been using new view
theory consistently from 1999 throughout 2014, thus not showing any difference in periods.
The low number of reports that include a fatal ending might account for the arguable lack in safety-II
presence. Further research exploring the normal operation might be deemed redundant in these cases.
However, if this is not the case, the low use of safety-II could indicate a deep-rooted problem where
the focus of an investigation still lies upon finding failure. Theory asks for an understanding of how
things usually go right, as a basis for explaining how things occasionally go wrong. (Hollnagel, 2014).

Evaluating Contemporary Safety Views and Models in Incident/Accident Investigation
Reports
34
5 Conclusion
The evolvement of safety thinking and its aspects have changed in the sense that an increase in the
use of new view aspects is visible. The easy-to-grasp aspects are embraced and often used, whereas
safety-II in particular falls behind. Although the perception of aspects has changed between 1999 and
2014, the sheer passing of time has proven to play a less than expected role in this. Despite the
seemingly deep-rooted focus on failure –in contrast with new view theory-, an increased familiarity
and embracement of new view theory was found. Taking in account that most of the incident/accident
reports are no fatal casualty incident/accident reports and the possible restraint created by the
unorthodox way of the approach of SII might account for the lack of this use of SII. Still, a shift from a
failure-focused process to a way of working in which success lies at the basis has proven to be difficult,
but a development regarding the new view is visible.
Since time does not seem to account for the positive changes regarding safety thinking, it is
recommended for the DSB to actively familiarize with new view theory. The target here should be a
change in mind-set and the way of approaching a mishap. The DSB seems to have the knowledge of
new view theory, but is selective (knowingly or unknowingly) in its application. The assessment tool
including the guidance makes for a good starting point in changing this.
Furthermore the safety view theory has been validated by means of a set of cross-tests. Although this
was already widely accepted by academics, its validity had never been checked in practice.

Evaluating Contemporary Safety Views and Models in Incident/Accident Investigation
Reports
35
Bibliography
Books:
Safety-I and Safety-II - The past and the future of safety
http://www.ashgate.com/isbn/9781472423085
Eric Holnagel May 2014
Publications:
A New Accident Model for Engineering Safer Systems
http://sunnyday.mit.edu/accidents/safetyscience-single.pdf
Nancy Leveson
Models and Methods - Guidance for safety proffessionals
http://www.academia.edu/3446538/Accident_Analysis_Models_and_Methods_Guidance_for_Safety_Prof
essionals
Peter Underwood and Dr. Patrick Waterson - May 2013
An STPA Primer
http://sunnyday.mit.edu/STPA-Primer-v0.pdf
Version 1, August 2013
The Field Guide to Human Error
Draft, August 2000
http://www.leonardo-in-flight.nl/PDF/FieldGuide%20to%20Human%20Error.PDF
Sidney Dekker
EUROPEAN ORGANISATION FOR THE SAFETY OF AIR NAVIGATION EUROCONTROL
EXPERIMENTAL CENTRE REVISITING THE « SWISS CHEESE » MODEL OF ACCIDENTS EEC Note
No. 13/06 Project Safbuild
https://www.eurocontrol.int/eec/gallery/content/public/document/eec/report/2006/017_Swiss_Cheese
_Model.pdf
Issued: October 2006
Fault Tree Analysis (FTA): Concepts and Applications
http://www.hq.nasa.gov/office/codeq/risk/docs/ftacourse.pdf
Bill Vesely NASA HQ
Analysis, Causality and Proof in Safety Investigations
https://www.atsb.gov.au/media/27767/ar2007053.pdf
ATSB TRANSPORT SAFETY RESEARCH REPORT Aviation Research and Analysis Report – AR-2007-053
Analysis, Causality and Proof in Safety Investigations
The Human Factors Analysis and Classification System–HFACS
https://www.nifc.gov/fireInfo/fireInfo_documents/humanfactors_classAnly.pdf
Scott A. Shappell FAA Civil Aeromedical Institute Oklahoma City
February 2000
THE HUMAN FACTORS ANALYSIS AND THE HUMAN FACTORS ANALYSIS AND CLASSIFICATION
SYSTEM (HFACS) CLASSIFICATION SYSTEM (HFACS)
Evaluating Contemporary Safety Views and Models in Incident/Accident Investigation
Reports
36
http://www.slc.ca.gov/About/Prevention_First/2002/Presentation%20by%20Douglas%20Wiegmann.pdf
Douglas Wiegmann, Ph.D. University of Illinois and Scott Shappell, Ph.D. Civil Aerospace Medical
Institute
Reliability Block Diagram (RBD)
http://www.reliabilityeducation.com/rbd.pdf
ITEM Software, Inc 2007
An Introduction to Fault Tree Analysis (FTA)
http://www2.warwick.ac.uk/fac/sci/wmg/ftmsc/modules/modulelist/peuss/slides/section_11b_fta_lectur
e_slides_compatibility_mode.pdf
Dr Jane Marshall Product Excellence using 6 Sigma Module
PEUSS 2011/2012
Study on Developments in Accident Investigation Methods: A Survey of the “State-of-the-Art”
http://www.iaea.org/inis/collection/NCLCollectionStore/_Public/40/012/40012565.pdf
Erik Hollnagel and Josephine Speziali
January 2008
Websites:
http://www.onderzoeksraad.nl/en/sectoren/aviation?filters%5Btype%5D=Afgeronde
Last consulted on: February 2015
https://hva.academia.edu
http://hfacs.com/hfacs-framework.html
Last consulted on: March 2015
https://explorable.com/interrater-reliability
https://explorable.com/bobo-doll-experiment
http://www.biochemia-medica.com/2012/22/276
Last consulted on: April 2015
http://www.biostathandbook.com/variabletypes.html#nominal
http://www.biostathandbook.com/chiind.html
http://www.biostathandbook.com/small.html
http://www.biostat.umn.edu/~susant/Fall09ph6414/Lesson12.pdf
http://www.socscistatistics.com/tests/fisher/default2.aspx
http://www.gpower.hhu.de/
Last consulted on: May 2015
Works of previous investigation: Next to the literature that is presented in this section, the research team of this thesis research used
the available data, created by Tim van Rooij and Bas metzelaar as feedback. Also the research results of
a previous research team, consisting of Dr. Nektarios Karanikas and Pedram Soltani, were used.