Embed Size (px)
Citation preview

http://www.diva-portal.org
This is the published version of a paper published in European Urology.
Citation for the original published paper (version of record):
Bovinder Ylitalo, E., Thysell, E., Jernberg, E., Lundholm, M., Crnalic, S. et al. (2017)Subgroups of castration-resistant prostate cancer bone metastases defined through an inverserelationship between androgen receptor activity and immune response.European Urology, 71(5): 776-787https://doi.org/10.1016/j.eururo.2016.07.033
Access to the published version may require subscription.
N.B. When citing this work, cite the original published paper.
Permanent link to this version:http://urn.kb.se/resolve?urn=urn:nbn:se:umu:diva-131852
E U R O P E A N U R O L O G Y 7 1 ( 2 0 1 7 ) 7 7 6 – 7 8 7
avai lable at www.sciencedirect .com
journal homepage: www.europeanurology.com
Platinum Priority – Prostate CancerEditorial by Martijn Lolkema, Reno Debets and Ronald de Wit on pp. 788–789 of this issue
Subgroups of Castration-resistant Prostate Cancer Bone
Metastases Defined Through an Inverse Relationship Between
Androgen Receptor Activity and Immune Response
Erik Bovinder Ylitalo a, Elin Thysell a, Emma Jernberg a, Marie Lundholm a, Sead Crnalic b,Lars Egevad c, Par Stattin d, Anders Widmark e, Anders Bergh a, Pernilla Wikstrom a,*
a Department of Medical Biosciences, Pathology, Umea University, Umea, Sweden; b Department of Surgery and Perioperative Sciences, Orthopedics, Umea
University, Umea, Sweden; c Section of Urology, Department of Surgical Science, Karolinska Institutet, Stockholm, Sweden; d Department of Surgery and
Perioperative Sciences, Urology & Andrology, Umea University, Umea, Sweden; e Department of Radiation Sciences, Oncology, Umea University, Umea,
Sweden
Article info
Article history:
Accepted July 19, 2016
Associate Editor:Giacomo Novara
Keywords:
Bone metastasis
Castration-resistance
Immune response
Metabolism
Prostate cancer
Abstract
Background: Novel therapies for men with castration-resistant prostate cancer (CRPC)are needed, particularly for cancers not driven by androgen receptor (AR) activation.Objectives: To identify molecular subgroups of PC bone metastases of relevance fortherapy.Design, setting, and participants: Fresh-frozen bone metastasis samples from men withCRPC (n = 40), treatment-naıve PC (n = 8), or other malignancies (n = 12) were charac-terized using whole-genome expression profiling, multivariate principal componentanalysis (PCA), and functional enrichment analysis. Expression profiles were verified byreverse transcription–polymerase chain reaction (RT-PCR) in an extended set of bonemetastases (n = 77) and compared to levels in malignant and adjacent benign prostatetissue from patients with localized disease (n = 12). Selected proteins were evaluatedusing immunohistochemistry. A cohort of PC patients (n = 284) diagnosed at trans-urethral resection with long follow-up was used for prognostic evaluation.Results and limitations: The majority of CRPC bone metastases (80%) was defined as AR-driven based on PCA analysis and high expression of the AR, AR co-regulators (FOXA1,HOXB13), and AR-regulated genes (KLK2, KLK3, NKX3.1, STEAP2, TMPRSS2); 20% werenon–AR-driven. Functional enrichment analysis indicated high metabolic activity andlow immune responses in AR-driven metastases. Accordingly, infiltration of CD3+ andCD68+ cells was lower in AR-driven than in non–AR-driven metastases, and tumor cellHLA class I ABC immunoreactivity was inversely correlated with nuclear AR immuno-reactivity. RT-PCR analysis showed low MHC class I expression (HLA-A, TAP1, and PSMB9mRNA) in PC bone metastases compared to benign and malignant prostate tissue andbone metastases of other origins. In primary PC, low HLA class I ABC immunoreactivitywas associated with high Gleason score, bone metastasis, and short cancer-specificsurvival. Limitations include the limited number of patients studied and the singlemetastasis sample studied per patient.Conclusions: Most CRPC bone metastases show high AR and metabolic activities and lowimmune responses. A subgroup instead shows low AR and metabolic activities, but high
Tar
immune responses.* Corresponding author. DSweden. Tel. +46 90 78537E-mail address: pernilla.wi
http://dx.doi.org/10.1016/j.eururo.2016.07.0330302-2838/# 2016 European Association of Urology. Published by ElsevierBY-NC-ND license (http://creativecommons.org/licenses/by-nc-nd/4.0/).
geted therapy for these groups should be explored.
epartment of Medical Biosciences, Umea University, 901 85 Umea,52; Fax: +46 90 [email protected] (P. Wikstrom).
B.V. This is an open access article under the CC
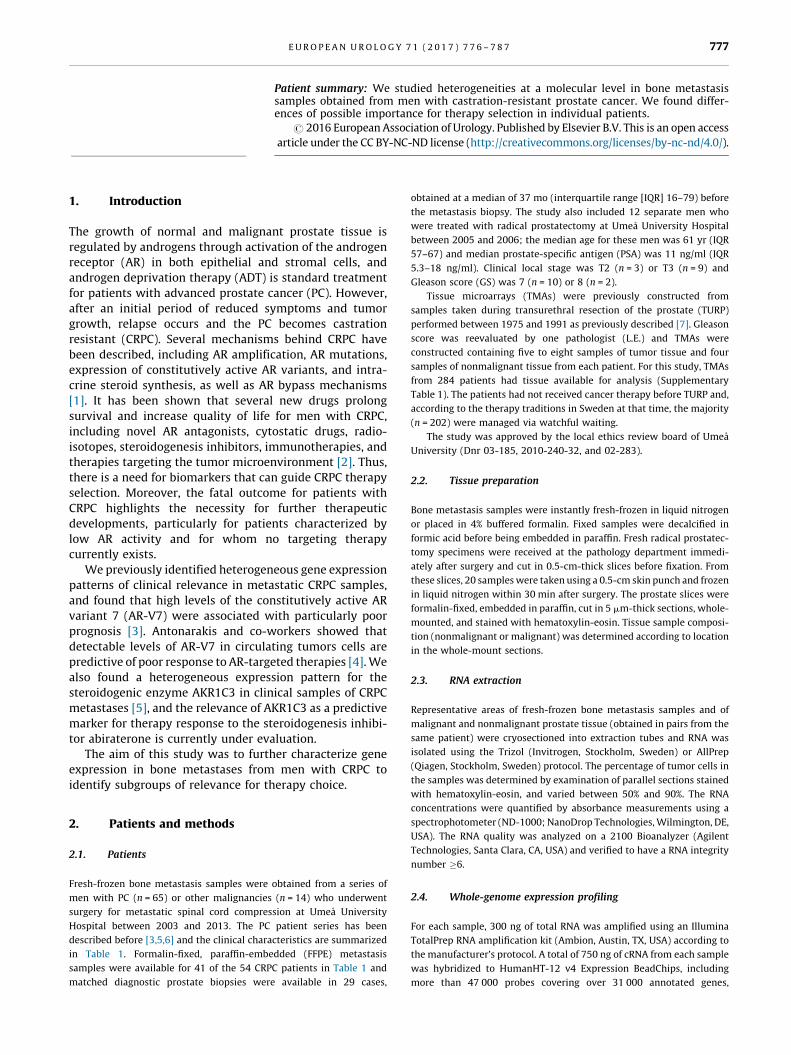
Patient summary: We studied heterogeneities at a molecular level in bone metastasissamples obtained from men with castration-resistant prostate cancer. We found differ-ences of possible importance for therapy selection in individual patients.
# 2016 European Association of Urology. Published by Elsevier B.V. This is an open access
article under the CC BY-NC-ND license (http://creativecommons.org/licenses/by-nc-nd/4.0/).
E U R O P E A N U R O L O G Y 7 1 ( 2 0 1 7 ) 7 7 6 – 7 8 7 777
1. Introduction
The growth of normal and malignant prostate tissue is
regulated by androgens through activation of the androgen
receptor (AR) in both epithelial and stromal cells, and
androgen deprivation therapy (ADT) is standard treatment
for patients with advanced prostate cancer (PC). However,
after an initial period of reduced symptoms and tumor
growth, relapse occurs and the PC becomes castration
resistant (CRPC). Several mechanisms behind CRPC have
been described, including AR amplification, AR mutations,
expression of constitutively active AR variants, and intra-
crine steroid synthesis, as well as AR bypass mechanisms
[1]. It has been shown that several new drugs prolong
survival and increase quality of life for men with CRPC,
including novel AR antagonists, cytostatic drugs, radio-
isotopes, steroidogenesis inhibitors, immunotherapies, and
therapies targeting the tumor microenvironment [2]. Thus,
there is a need for biomarkers that can guide CRPC therapy
selection. Moreover, the fatal outcome for patients with
CRPC highlights the necessity for further therapeutic
developments, particularly for patients characterized by
low AR activity and for whom no targeting therapy
currently exists.
We previously identified heterogeneous gene expression
patterns of clinical relevance in metastatic CRPC samples,
and found that high levels of the constitutively active AR
variant 7 (AR-V7) were associated with particularly poor
prognosis [3]. Antonarakis and co-workers showed that
detectable levels of AR-V7 in circulating tumors cells are
predictive of poor response to AR-targeted therapies [4]. We
also found a heterogeneous expression pattern for the
steroidogenic enzyme AKR1C3 in clinical samples of CRPC
metastases [5], and the relevance of AKR1C3 as a predictive
marker for therapy response to the steroidogenesis inhibi-
tor abiraterone is currently under evaluation.
The aim of this study was to further characterize gene
expression in bone metastases from men with CRPC to
identify subgroups of relevance for therapy choice.
2. Patients and methods
2.1. Patients
Fresh-frozen bone metastasis samples were obtained from a series of
men with PC (n = 65) or other malignancies (n = 14) who underwent
surgery for metastatic spinal cord compression at Umea University
Hospital between 2003 and 2013. The PC patient series has been
described before [3,5,6] and the clinical characteristics are summarized
in Table 1. Formalin-fixed, paraffin-embedded (FFPE) metastasis
samples were available for 41 of the 54 CRPC patients in Table 1 and
matched diagnostic prostate biopsies were available in 29 cases,
obtained at a median of 37 mo (interquartile range [IQR] 16–79) before
the metastasis biopsy. The study also included 12 separate men who
were treated with radical prostatectomy at Umea University Hospital
between 2005 and 2006; the median age for these men was 61 yr (IQR
57–67) and median prostate-specific antigen (PSA) was 11 ng/ml (IQR
5.3–18 ng/ml). Clinical local stage was T2 (n = 3) or T3 (n = 9) and
Gleason score (GS) was 7 (n = 10) or 8 (n = 2).
Tissue microarrays (TMAs) were previously constructed from
samples taken during transurethral resection of the prostate (TURP)
performed between 1975 and 1991 as previously described [7]. Gleason
score was reevaluated by one pathologist (L.E.) and TMAs were
constructed containing five to eight samples of tumor tissue and four
samples of nonmalignant tissue from each patient. For this study, TMAs
from 284 patients had tissue available for analysis (Supplementary
Table 1). The patients had not received cancer therapy before TURP and,
according to the therapy traditions in Sweden at that time, the majority
(n = 202) were managed via watchful waiting.
The study was approved by the local ethics review board of Umea
University (Dnr 03-185, 2010-240-32, and 02-283).
2.2. Tissue preparation
Bone metastasis samples were instantly fresh-frozen in liquid nitrogen
or placed in 4% buffered formalin. Fixed samples were decalcified in
formic acid before being embedded in paraffin. Fresh radical prostatec-
tomy specimens were received at the pathology department immedi-
ately after surgery and cut in 0.5-cm-thick slices before fixation. From
these slices, 20 samples were taken using a 0.5-cm skin punch and frozen
in liquid nitrogen within 30 min after surgery. The prostate slices were
formalin-fixed, embedded in paraffin, cut in 5 mm-thick sections, whole-
mounted, and stained with hematoxylin-eosin. Tissue sample composi-
tion (nonmalignant or malignant) was determined according to location
in the whole-mount sections.
2.3. RNA extraction
Representative areas of fresh-frozen bone metastasis samples and of
malignant and nonmalignant prostate tissue (obtained in pairs from the
same patient) were cryosectioned into extraction tubes and RNA was
isolated using the Trizol (Invitrogen, Stockholm, Sweden) or AllPrep
(Qiagen, Stockholm, Sweden) protocol. The percentage of tumor cells in
the samples was determined by examination of parallel sections stained
with hematoxylin-eosin, and varied between 50% and 90%. The RNA
concentrations were quantified by absorbance measurements using a
spectrophotometer (ND-1000; NanoDrop Technologies, Wilmington, DE,
USA). The RNA quality was analyzed on a 2100 Bioanalyzer (Agilent
Technologies, Santa Clara, CA, USA) and verified to have a RNA integrity
number �6.
2.4. Whole-genome expression profiling
For each sample, 300 ng of total RNA was amplified using an Illumina
TotalPrep RNA amplification kit (Ambion, Austin, TX, USA) according to
the manufacturer’s protocol. A total of 750 ng of cRNA from each sample
was hybridized to HumanHT-12 v4 Expression BeadChips, including
more than 47 000 probes covering over 31 000 annotated genes,
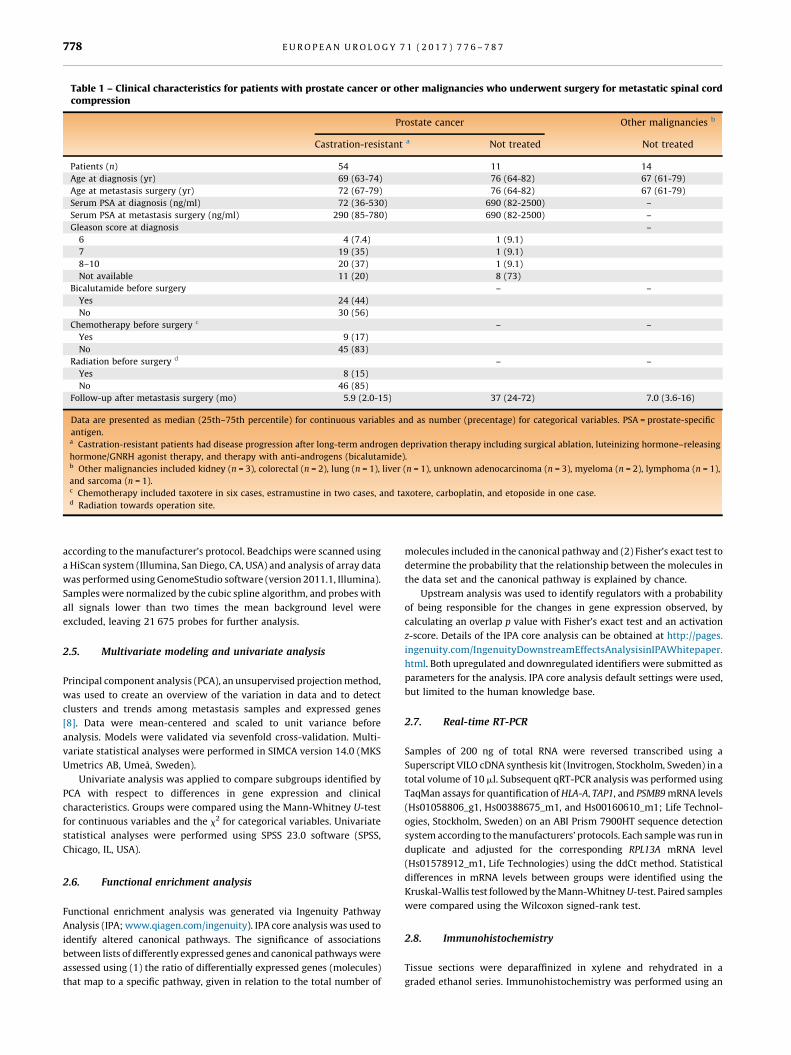
Table 1 – Clinical characteristics for patients with prostate cancer or other malignancies who underwent surgery for metastatic spinal cordcompression
Prostate cancer Other malignancies b
Castration-resistant a Not treated Not [11_TD$DIFF]treated
Patients (n) 54 11 14
Age at diagnosis (yr) 69 (63-74) 76 (64-82) 67 (61-79)
Age at metastasis surgery (yr) 72 (67-79) 76 (64-82) 67 (61-79)
Serum PSA at diagnosis (ng/ml) 72 (36-530) 690 (82-2500) –
Serum PSA at metastasis surgery (ng/ml) 290 (85-780) 690 (82-2500) –
Gleason score at diagnosis –
6 4 (7.4) 1 (9.1)
7 19 (35) 1 (9.1)
8–10 20 (37) 1 (9.1)
Not available 11 (20) 8 (73)
Bicalutamide before surgery – –
Yes 24 (44)
No 30 (56)
Chemotherapy before surgery c – –
Yes 9 (17)
No 45 (83)
Radiation before surgery d – –
Yes 8 (15)
No 46 (85)
Follow-up after metastasis surgery (mo) 5.9 (2.0-15) 37 (24-72) 7.0 (3.6-16)
Data are presented as median (25th–75th percentile) for continuous variables and as number (precentage) for categorical variables. PSA = prostate-specific
antigen.a Castration-resistant patients had disease progression after long-term androgen deprivation therapy including surgical ablation, luteinizing hormone–releasing
hormone/GNRH agonist therapy, and therapy with anti-androgens (bicalutamide).b Other malignancies included kidney (n = 3), colorectal (n = 2), lung (n = 1), liver (n = 1), unknown adenocarcinoma (n = 3), myeloma (n = 2), lymphoma (n = 1),
and sarcoma (n = 1).c Chemotherapy included taxotere in six cases, estramustine in two cases, and taxotere, carboplatin, and etoposide in one case.d Radiation towards operation site.
E U R O P E A N U R O L O G Y 7 1 ( 2 0 1 7 ) 7 7 6 – 7 8 7778
according to the manufacturer’s protocol. Beadchips were scanned using
a HiScan system (Illumina, San Diego, CA, USA) and analysis of array data
was performed using GenomeStudio software (version 2011.1, Illumina).
Samples were normalized by the cubic spline algorithm, and probes with
all signals lower than two times the mean background level were
excluded, leaving 21 675 probes for further analysis.
2.5. Multivariate modeling and univariate analysis
Principal component analysis (PCA), an unsupervised projection method,
was used to create an overview of the variation in data and to detect
clusters and trends among metastasis samples and expressed genes
[8]. Data were mean-centered and scaled to unit variance before
analysis. Models were validated via sevenfold cross-validation. Multi-
variate statistical analyses were performed in SIMCA version 14.0 (MKS
Umetrics AB, Umea, Sweden).
Univariate analysis was applied to compare subgroups identified by
PCA with respect to differences in gene expression and clinical
characteristics. Groups were compared using the Mann-Whitney U-test
for continuous variables and the x2 for categorical variables. Univariate
statistical analyses were performed using SPSS 23.0 software (SPSS,
Chicago, IL, USA).
2.6. Functional enrichment analysis
Functional enrichment analysis was generated via Ingenuity Pathway
Analysis (IPA; www.qiagen.com/ingenuity). IPA core analysis was used to
identify altered canonical pathways. The significance of associations
between lists of differently expressed genes and canonical pathways were
assessed using (1) the ratio of differentially expressed genes (molecules)
that map to a specific pathway, [14_TD$DIFF]given [15_TD$DIFF]in relation to the total number of
molecules included in the canonical pathway and (2) Fisher’s exact test to
determine the probability that the relationship between the molecules in
the data set and the canonical pathway is explained by chance.
Upstream analysis was used to identify regulators with a probability
of being responsible for the changes in gene expression observed, by
calculating an overlap p value with Fisher’s exact test and an activation
z-score. Details of the IPA core analysis can be obtained at http://pages.
ingenuity.com/IngenuityDownstreamEffectsAnalysisinIPAWhitepaper.
html. Both upregulated and downregulated identifiers were submitted as
parameters for the analysis. IPA core analysis default settings were used,
but limited to the human knowledge base.
2.7. Real-time RT-PCR
Samples of 200 ng of total RNA were reversed transcribed using a
Superscript VILO cDNA synthesis kit (Invitrogen, Stockholm, Sweden) in a
total volume of 10 ml. Subsequent qRT-PCR analysis was performed using
TaqMan assays for quantification of HLA-A, TAP1, and PSMB9 mRNA levels
(Hs01058806_g1, Hs00388675_m1, and Hs00160610_m1; Life Technol-
ogies, Stockholm, Sweden) on an ABI Prism 7900HT sequence detection
system according to the manufacturers’ protocols. Each sample was run in
duplicate and adjusted for the corresponding RPL13A mRNA level
(Hs01578912_m1, Life Technologies) using the ddCt method. Statistical
differences in mRNA levels between groups were identified using the
Kruskal-Wallis test followed by the Mann-Whitney U-test. Paired samples
were compared using the Wilcoxon signed-rank test.
2.8. Immunohistochemistry
Tissue sections were deparaffinized in xylene and rehydrated in a
graded ethanol series. Immunohistochemistry was performed using an
[(Fig._1)TD$FIG]
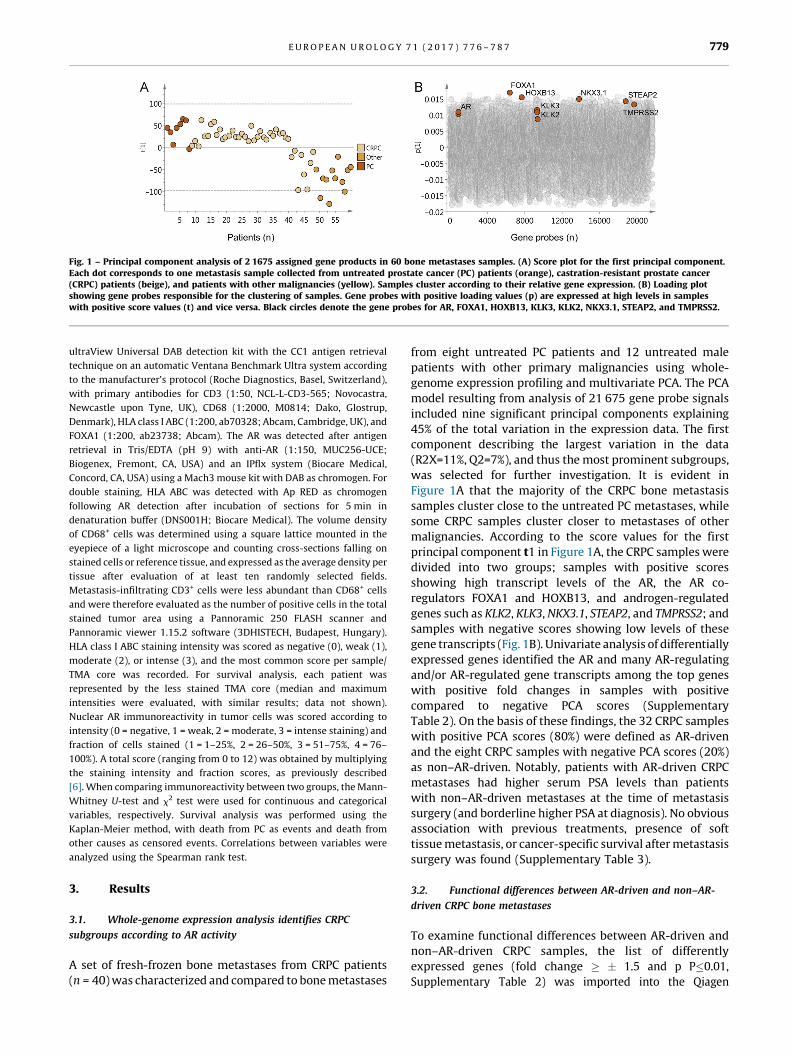
Fig. 1 – Principal component analysis of 2 1675 assigned gene products in 60 bone metastases samples. (A) Score plot for the first principal component.Each dot corresponds to one metastasis sample collected from untreated prostate cancer (PC) patients ( [6_TD$DIFF]orange), castration-resistant prostate cancer(CRPC) patients ( [7_TD$DIFF]beige), and patients with other malignancies ( [8_TD$DIFF]yellow). Samples cluster according to their relative gene expression. (B) Loading plotshowing gene probes responsible for the clustering of samples. Gene probes with positive loading values (p) are expressed at high levels in sampleswith positive score values (t) and vice versa. Black circles denote the gene probes for AR, FOXA1, HOXB13, KLK3, KLK2, NKX3.1, STEAP2, and TMPRSS2.
E U R O P E A N U R O L O G Y 7 1 ( 2 0 1 7 ) 7 7 6 – 7 8 7 779
ultraView Universal DAB detection kit with the CC1 antigen retrieval
technique on an automatic Ventana Benchmark Ultra system according
to the manufacturer’s protocol (Roche Diagnostics, Basel, Switzerland),
with primary antibodies for CD3 (1:50, NCL-L-CD3-565; Novocastra,
Newcastle upon Tyne, UK), CD68 (1:2000, M0814; Dako, Glostrup,
Denmark), HLA class I ABC (1:200, ab70328; Abcam, Cambridge, UK), and
FOXA1 (1:200, ab23738; Abcam). The AR was detected after antigen
retrieval in Tris/EDTA (pH 9) with anti-AR (1:150, MUC256-UCE;
Biogenex, Fremont, CA, USA) and an IPflx system (Biocare Medical,
Concord, CA, USA) using a Mach3 mouse kit with DAB as chromogen. For
double staining, HLA ABC was detected with Ap RED as chromogen
following AR detection after incubation of sections for 5 min in
denaturation buffer (DNS001H; Biocare Medical). The volume density
of CD68+ cells was determined using a square lattice mounted in the
eyepiece of a light microscope and counting cross-sections falling on
stained cells or reference tissue, and expressed as the average density per
tissue after evaluation of at least ten randomly selected fields.
Metastasis-infiltrating CD3+ cells were less abundant than CD68+ cells
and were therefore evaluated as the number of positive cells in the total
stained tumor area using a Pannoramic 250 FLASH scanner and
Pannoramic viewer 1.15.2 software (3DHISTECH, Budapest, Hungary).
HLA class I ABC staining intensity was scored as negative (0), weak (1),
moderate (2), or intense (3), and the most common score per sample/
TMA core was recorded. For survival analysis, each patient was
represented by the less stained TMA core (median and maximum
intensities were evaluated, with similar results; data not shown).
Nuclear AR immunoreactivity in tumor cells was scored according to
intensity (0 = negative, 1 = weak, 2 = moderate, 3 = intense staining) and
fraction of cells stained (1 = 1–25%, 2 = 26–50%, 3 = 51–75%, 4 = 76–
100%). A total score (ranging from 0 to 12) was obtained by multiplying
the staining intensity and fraction scores, as previously described
[6]. When comparing immunoreactivity between two groups, the Mann-
Whitney U-test and x2 test were used for continuous and categorical
variables, respectively. Survival analysis was performed using the
Kaplan-Meier method, with death from PC as events and death from
other causes as censored events. Correlations between variables were
analyzed using the Spearman rank test.
3. Results
3.1. Whole-genome expression analysis identifies CRPC
subgroups according to AR activity
A set of fresh-frozen bone metastases from CRPC patients
(n = 40) was characterized and compared to bone metastases
from eight untreated PC patients and 12 untreated male
patients with other primary malignancies using whole-
genome expression profiling and multivariate PCA. The PCA
model resulting from analysis of 21 675 gene probe signals
included nine significant principal components explaining
45% of the total variation in the expression data. The first
component describing the largest variation in the data
(R2X=11%, Q2=7%), and thus the most prominent subgroups,
was selected for further investigation. It is evident in
Figure 1A that the majority of the CRPC bone metastasis
samples cluster close to the untreated PC metastases, while
some CRPC samples cluster closer to metastases of other
malignancies. According to the score values for the first
principal component t1 in Figure 1A, the CRPC samples were
divided into two groups; samples with positive scores
showing high transcript levels of the AR, the AR co-
regulators FOXA1 and HOXB13, and androgen-regulated
genes such as KLK2, KLK3, NKX3.1, STEAP2, and TMPRSS2; and
samples with negative scores showing low levels of these
gene transcripts (Fig. 1B). Univariate analysis of differentially
expressed genes identified the AR and many AR-regulating
and/or AR-regulated gene transcripts among the top genes
with positive fold changes in samples with positive
compared to negative PCA scores (Supplementary
Table 2). On the basis of these findings, the 32 CRPC samples
with positive PCA scores (80%) were defined as AR-driven
and the eight CRPC samples with negative PCA scores (20%)
as non–AR-driven. Notably, patients with AR-driven CRPC
metastases had higher serum PSA levels than patients
with non–AR-driven metastases at the time of metastasis
surgery (and borderline higher PSA at diagnosis). No obvious
association with previous treatments, presence of soft
tissue metastasis, or cancer-specific survival after metastasis
surgery[4_TD$DIFF] was found (Supplementary Table 3).
3.2. Functional differences between AR-driven and non–AR-
driven CRPC bone metastases
To examine functional differences between AR-driven and
non–AR-driven CRPC samples, the list of differently
expressed genes (fold change � � 1.5 and p P�0.01,
Supplementary Table 2) was imported into the Qiagen
E U R O P E A N U R O L O G Y 7 1 ( 2 0 1 7 ) 7 7 6 – 7 8 7780
Ingenuity Pathway Analysis tool for assignment of altered
canonical pathways and identification of upstream regulators.
According to analysis of 617 upregulated and 906 down-
regulated gene transcripts, AR-driven CRPC metastases had
higher metabolic activity for biosynthesis of cholesterol,
pyrimidines, and spermine and degradation of fatty acids
and amino acids when compared to non–AR-driven samples
(Table 2). Among the downregulated canonical pathways in AR-
driven metastases, the cellular immune response was the most
obvious (Table 2). Upstream regulators predicted as responsible
for the differential expression observed between AR-driven and
non–AR-driven CRPC bone metastases are listed in Supple-
mentary Table 4. AR, SPDEF, and FOXA1 were among the top
activated genes that also showed increased mRNA levels in AR-
driven metastases, while several immune regulating genes
such as TGFB1, INFG, and other cytokines were predicted to be
inhibited, and some (CCL5, ETV5, PLAUR, and IFNAR2) also
showed reduced mRNA levels (Supplementary Table 4).
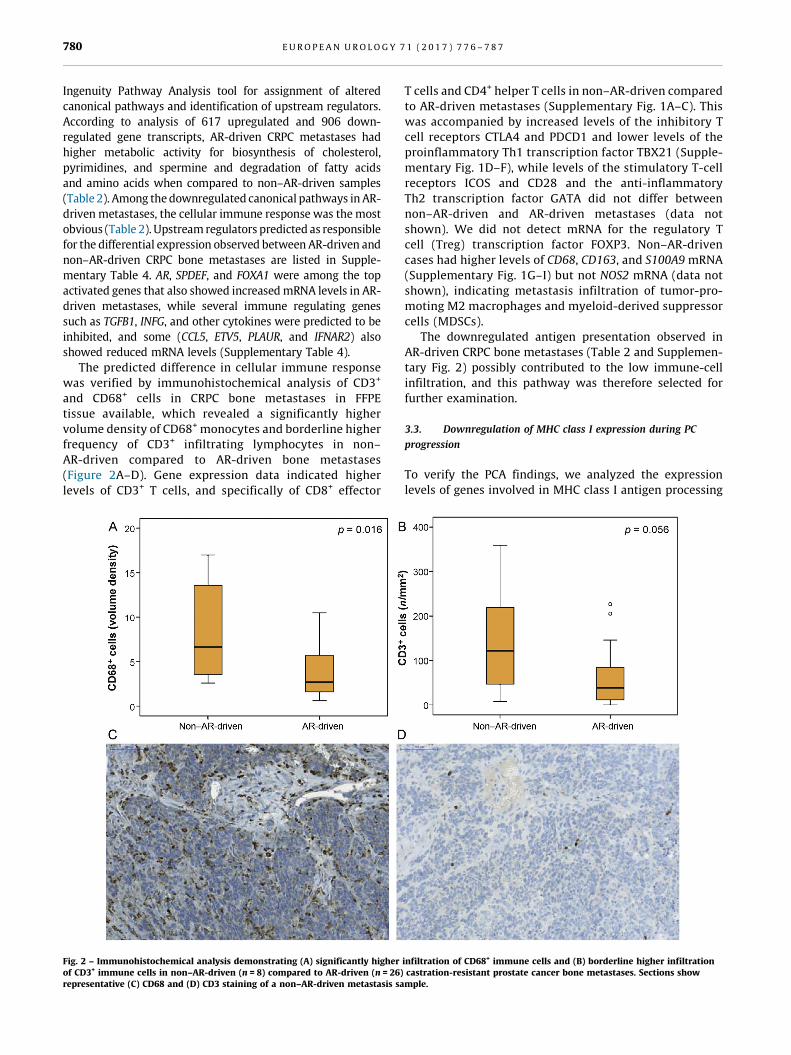
The predicted difference in cellular immune response
was verified by immunohistochemical analysis of CD3+[3_TD$DIFF]
and CD68+ cells in CRPC bone metastases in FFPE
tissue available, which revealed a significantly higher
volume density of CD68+[5_TD$DIFF] monocytes and borderline higher
frequency of CD3+ infiltrating lymphocytes in non–
AR-driven compared to AR-driven bone metastases
(Figure 2A–D). Gene expression data indicated higher
levels of CD3+ T cells, and specifically of CD8+ effector[(Fig._2)TD$FIG]
Fig. 2 – Immunohistochemical analysis demonstrating (A) significantly higherof CD3+ immune cells in non–AR-driven (n = 8) compared to AR-driven (n = 26)representative (C) CD68 and (D) CD3 staining of a non–AR-driven metastasis sa
T cells and CD4+ helper T cells in non–AR-driven compared
to AR-driven metastases (Supplementary Fig. 1A–C). This
was accompanied by increased levels of the inhibitory T
cell receptors CTLA4 and PDCD1 and lower levels of the
proinflammatory Th1 transcription factor TBX21 (Supple-
mentary Fig. 1D–F), while levels of the stimulatory T-cell
receptors ICOS and CD28 and the anti-inflammatory
Th2 transcription factor GATA did not differ between
non–AR-driven and AR-driven metastases (data not
shown). We did not detect mRNA for the regulatory T
cell (Treg) transcription factor FOXP3. Non–AR-driven
cases had higher levels of CD68, CD163, and S100A9 mRNA
(Supplementary Fig. 1G–I) but not NOS2 mRNA (data not
shown), indicating metastasis infiltration of tumor-pro-
moting M2 macrophages and myeloid-derived suppressor
cells (MDSCs).
The downregulated antigen presentation observed in
AR-driven CRPC bone metastases (Table 2 and Supplemen-
tary Fig. 2) possibly contributed to the low immune-cell
infiltration, and this pathway was therefore selected for
further examination.
3.3. Downregulation of MHC class I expression during PC
progression
To verify the PCA findings, we analyzed the expression
levels of genes involved in MHC class I antigen processing
infiltration of CD68+ immune cells and (B) borderline higher infiltrationcastration-resistant prostate cancer bone metastases. Sections showmple.
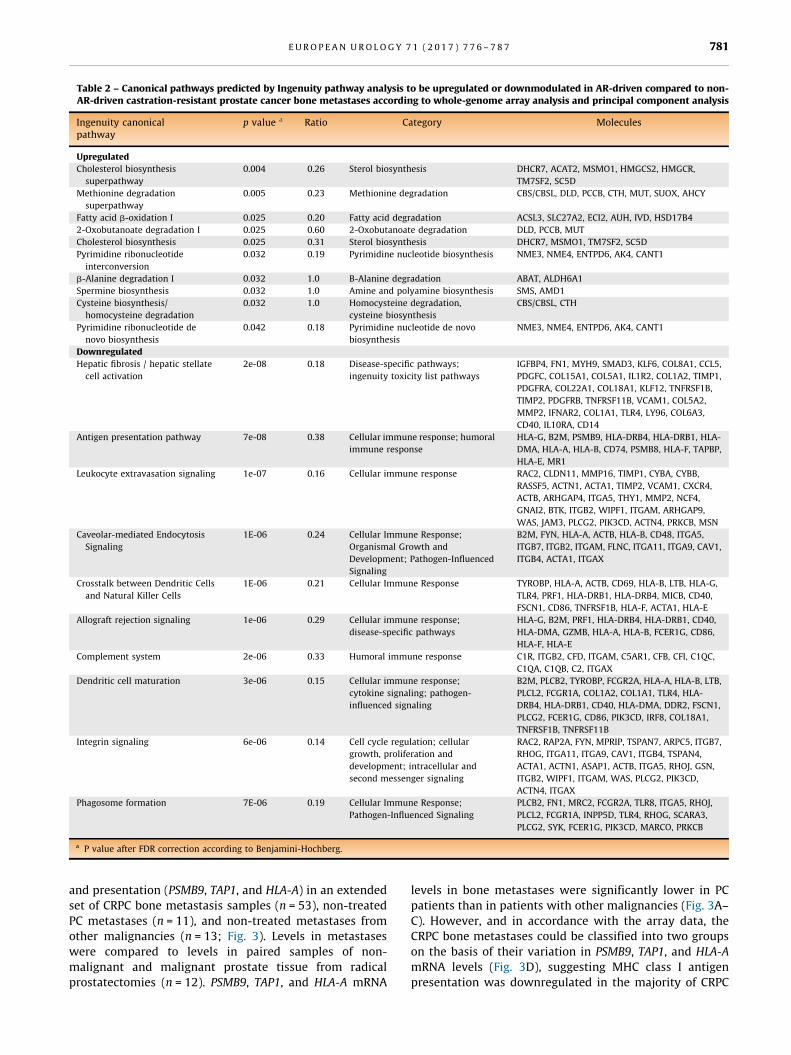
Table 2 – Canonical pathways predicted by Ingenuity pathway analysis to be upregulated or downmodulated in AR-driven compared to non-AR-driven castration-resistant prostate cancer bone metastases according to whole-genome array analysis and principal component analysis
Ingenuity canonicalpathway
p value a Ratio Category Molecules
Upregulated
Cholesterol biosynthesis
superpathway
0.004 0.26 Sterol biosynthesis DHCR7, ACAT2, MSMO1, HMGCS2, HMGCR,
TM7SF2, SC5D
Methionine degradation
superpathway
0.005 0.23 Methionine degradation CBS/CBSL, DLD, PCCB, CTH, MUT, SUOX, AHCY
Fatty acid b-oxidation I 0.025 0.20 Fatty acid degradation ACSL3, SLC27A2, ECI2, AUH, IVD, HSD17B4
2-Oxobutanoate degradation I 0.025 0.60 2-Oxobutanoate degradation DLD, PCCB, MUT
Cholesterol biosynthesis 0.025 0.31 Sterol biosynthesis DHCR7, MSMO1, TM7SF2, SC5D
Pyrimidine ribonucleotide
interconversion
0.032 0.19 Pyrimidine nucleotide biosynthesis NME3, NME4, ENTPD6, AK4, CANT1
b-Alanine degradation I 0.032 1.0 B-Alanine degradation ABAT, ALDH6A1
Spermine biosynthesis 0.032 1.0 Amine and polyamine biosynthesis SMS, AMD1
Cysteine biosynthesis/
homocysteine degradation
0.032 1.0 Homocysteine degradation,
cysteine biosynthesis
CBS/CBSL, CTH
Pyrimidine ribonucleotide de
novo biosynthesis
0.042 0.18 Pyrimidine nucleotide de novo
biosynthesis
NME3, NME4, ENTPD6, AK4, CANT1
Downregulated
Hepatic fibrosis / hepatic stellate
cell activation
2e-08 0.18 Disease-specific pathways;
ingenuity toxicity list pathways
IGFBP4, FN1, MYH9, SMAD3, KLF6, COL8A1, CCL5,
PDGFC, COL15A1, COL5A1, IL1R2, COL1A2, TIMP1,
PDGFRA, COL22A1, COL18A1, KLF12, TNFRSF1B,
TIMP2, PDGFRB, TNFRSF11B, VCAM1, COL5A2,
MMP2, IFNAR2, COL1A1, TLR4, LY96, COL6A3,
CD40, IL10RA, CD14
Antigen presentation pathway 7e-08 0.38 Cellular immune response; humoral
immune response
HLA-G, B2M, PSMB9, HLA-DRB4, HLA-DRB1, HLA-
DMA, HLA-A, HLA-B, CD74, PSMB8, HLA-F, TAPBP,
HLA-E, MR1
Leukocyte extravasation signaling 1e-07 0.16 Cellular immune response RAC2, CLDN11, MMP16, TIMP1, CYBA, CYBB,
RASSF5, ACTN1, ACTA1, TIMP2, VCAM1, CXCR4,
ACTB, ARHGAP4, ITGA5, THY1, MMP2, NCF4,
GNAI2, BTK, ITGB2, WIPF1, ITGAM, ARHGAP9,
WAS, JAM3, PLCG2, PIK3CD, ACTN4, PRKCB, MSN
Caveolar-mediated Endocytosis
Signaling
1E-06 0.24 Cellular Immune Response;
Organismal Growth and
Development; Pathogen-Influenced
Signaling
B2M, FYN, HLA-A, ACTB, HLA-B, CD48, ITGA5,
ITGB7, ITGB2, ITGAM, FLNC, ITGA11, ITGA9, CAV1,
ITGB4, ACTA1, ITGAX
Crosstalk between Dendritic Cells
and Natural Killer Cells
1E-06 0.21 Cellular Immune Response TYROBP, HLA-A, ACTB, CD69, HLA-B, LTB, HLA-G,
TLR4, PRF1, HLA-DRB1, HLA-DRB4, MICB, CD40,
FSCN1, CD86, TNFRSF1B, HLA-F, ACTA1, HLA-E
Allograft rejection signaling 1e-06 0.29 Cellular immune response;
disease-specific pathways
HLA-G, B2M, PRF1, HLA-DRB4, HLA-DRB1, CD40,
HLA-DMA, GZMB, HLA-A, HLA-B, FCER1G, CD86,
HLA-F, HLA-E
Complement system 2e-06 0.33 Humoral immune response C1R, ITGB2, CFD, ITGAM, C5AR1, CFB, CFI, C1QC,
C1QA, C1QB, C2, ITGAX
Dendritic cell maturation 3e-06 0.15 Cellular immune response;
cytokine signaling; pathogen-
influenced signaling
B2M, PLCB2, TYROBP, FCGR2A, HLA-A, HLA-B, LTB,
PLCL2, FCGR1A, COL1A2, COL1A1, TLR4, HLA-
DRB4, HLA-DRB1, CD40, HLA-DMA, DDR2, FSCN1,
PLCG2, FCER1G, CD86, PIK3CD, IRF8, COL18A1,
TNFRSF1B, TNFRSF11B
Integrin signaling 6e-06 0.14 Cell cycle regulation; cellular
growth, proliferation and
development; intracellular and
second messenger signaling
RAC2, RAP2A, FYN, MPRIP, TSPAN7, ARPC5, ITGB7,
RHOG, ITGA11, ITGA9, CAV1, ITGB4, TSPAN4,
ACTA1, ACTN1, ASAP1, ACTB, ITGA5, RHOJ, GSN,
ITGB2, WIPF1, ITGAM, WAS, PLCG2, PIK3CD,
ACTN4, ITGAX
Phagosome formation 7E-06 0.19 Cellular Immune Response;
Pathogen-Influenced Signaling
PLCB2, FN1, MRC2, FCGR2A, TLR8, ITGA5, RHOJ,
PLCL2, FCGR1A, INPP5D, TLR4, RHOG, SCARA3,
PLCG2, SYK, FCER1G, PIK3CD, MARCO, PRKCB
a P value after FDR correction according to Benjamini-Hochberg.
E U R O P E A N U R O L O G Y 7 1 ( 2 0 1 7 ) 7 7 6 – 7 8 7 781
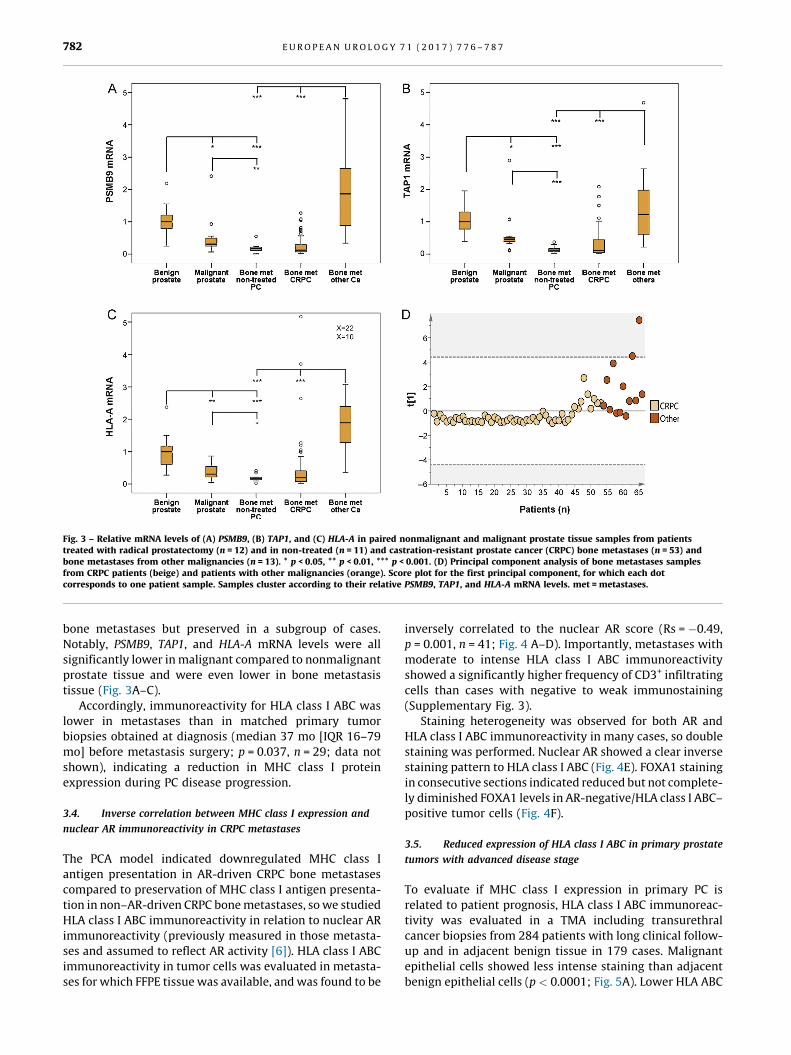
and presentation (PSMB9, TAP1, and HLA-A) in an extended
set of CRPC bone metastasis samples (n = 53), non-treated
PC metastases (n = 11), and non-treated metastases from
other malignancies (n = 13; Fig. 3). Levels in metastases
were compared to levels in paired samples of non-
malignant and malignant prostate tissue from radical
prostatectomies (n = 12). PSMB9, TAP1, and HLA-A mRNA
levels in bone metastases were significantly lower in PC
patients than in patients with other malignancies (Fig. 3A–
C). However, and in accordance with the array data, the
CRPC bone metastases could be classified into two groups
on the basis of their variation in PSMB9, TAP1, and HLA-A
mRNA levels (Fig. 3D), suggesting MHC class I antigen
presentation was downregulated in the majority of CRPC
[(Fig._3)TD$FIG]
Fig. 3 – Relative mRNA levels of (A) PSMB9, (B) TAP1, and (C) HLA-A in paired nonmalignant and malignant prostate tissue samples from patientstreated with radical prostatectomy (n = 12) and in non-treated (n = 11) and castration-resistant prostate cancer (CRPC) bone metastases (n = 53) andbone metastases from other malignancies (n = 13). * p < 0.05, ** p < 0.01, *** p < 0.001. (D) Principal component analysis of bone metastases samplesfrom CRPC patients (beige) and patients with other malignancies ( [6_TD$DIFF]orange). Score plot for the first principal component, for which each dotcorresponds to one patient sample. Samples cluster according to their relative PSMB9, TAP1, and HLA-A mRNA levels. met = metastases.
E U R O P E A N U R O L O G Y 7 1 ( 2 0 1 7 ) 7 7 6 – 7 8 7782
bone metastases but preserved in a subgroup of cases.
Notably, PSMB9, TAP1, and HLA-A mRNA levels were all
significantly lower in malignant compared to nonmalignant
prostate tissue and were even lower in bone metastasis
tissue (Fig. 3A–C).
Accordingly, immunoreactivity for HLA class I ABC was
lower in metastases than in matched primary tumor
biopsies obtained at diagnosis (median 37 mo [IQR 16–79
mo] before metastasis surgery; p = 0.037, n = 29; data not
shown), indicating a reduction in MHC class I protein
expression during PC disease progression.
3.4. Inverse correlation between MHC class I expression and
nuclear AR immunoreactivity in CRPC metastases
The PCA model indicated downregulated MHC class I
antigen presentation in AR-driven CRPC bone metastases
compared to preservation of MHC class I antigen presenta-
tion in non–AR-driven CRPC bone metastases, so we studied
HLA class I ABC immunoreactivity in relation to nuclear AR
immunoreactivity (previously measured in those metasta-
ses and assumed to reflect AR activity [6]). HLA class I ABC
immunoreactivity in tumor cells was evaluated in metasta-
ses for which FFPE tissue was available, and was found to be
inversely correlated to the nuclear AR score (Rs = �0.49,
p = 0.001, n = 41; Fig. 4 A–D). Importantly, metastases with
moderate to intense HLA class I ABC immunoreactivity
showed a significantly higher frequency of CD3+ infiltrating
cells than cases with negative to weak immunostaining
(Supplementary Fig. 3).
Staining heterogeneity was observed for both AR and
HLA class I ABC immunoreactivity in many cases, so double
staining was performed. Nuclear AR showed a clear inverse
staining pattern to HLA class I ABC (Fig. 4E). FOXA1 staining
in consecutive sections indicated reduced but not complete-
ly diminished FOXA1 levels in AR-negative/HLA class I ABC–
positive tumor cells (Fig. 4F).
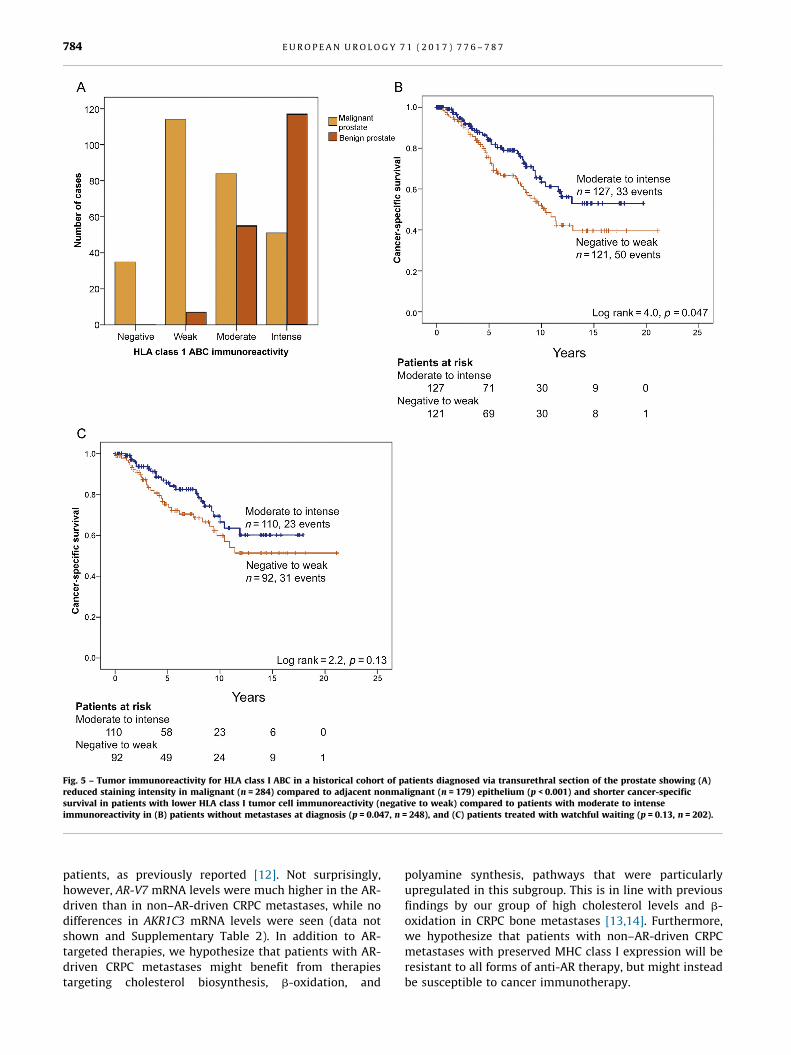
3.5. Reduced expression of HLA class I ABC in primary prostate
tumors with advanced disease stage
To evaluate if MHC class I expression in primary PC is
related to patient prognosis, HLA class I ABC immunoreac-
tivity was evaluated in a TMA including transurethral
cancer biopsies from 284 patients with long clinical follow-
up and in adjacent benign tissue in 179 cases. Malignant
epithelial cells showed less intense staining than adjacent
benign epithelial cells (p < 0.0001; Fig. 5A). Lower HLA ABC
[(Fig._4)TD$FIG]
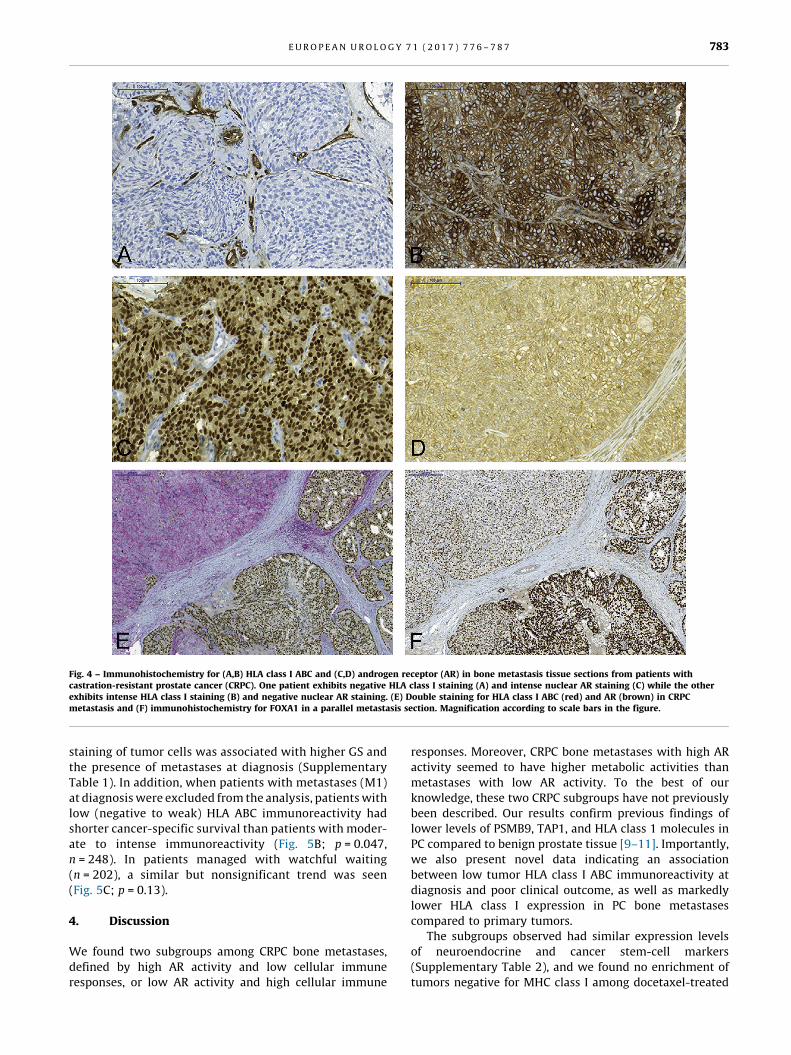
Fig. 4 – Immunohistochemistry for (A,B) HLA class I ABC and (C,D) androgen receptor (AR) in bone metastasis tissue sections from patients withcastration-resistant prostate cancer (CRPC). One patient exhibits negative HLA class I staining (A) and intense nuclear AR staining (C) while the otherexhibits intense HLA class I staining (B) and negative nuclear AR staining. (E) Double staining for HLA class I ABC (red) and AR (brown) in CRPCmetastasis and (F) immunohistochemistry for FOXA1 in a parallel metastasis section. Magnification according to scale bars in the figure.
E U R O P E A N U R O L O G Y 7 1 ( 2 0 1 7 ) 7 7 6 – 7 8 7 783
staining of tumor cells was associated with higher GS and
the presence of metastases at diagnosis (Supplementary
Table 1). In addition, when patients with metastases (M1)
at diagnosis were excluded from the analysis, patients with
low (negative to weak) HLA ABC immunoreactivity had
shorter cancer-specific survival than patients with moder-
ate to intense immunoreactivity (Fig. 5B; p = 0.047,
n = 248). In patients managed with watchful waiting
(n = 202), a similar but nonsignificant trend was seen
(Fig. 5C; p = 0.13).
4. Discussion
We found two subgroups among CRPC bone metastases,
defined by high AR activity and low cellular immune
responses, or low AR activity and high cellular immune
responses. Moreover, CRPC bone metastases with high AR
activity seemed to have higher metabolic activities than
metastases with low AR activity. To the best of our
knowledge, these two CRPC subgroups have not previously
been described. Our results confirm previous findings of
lower levels of PSMB9, TAP1, and HLA class 1 molecules in
PC compared to benign prostate tissue [9–11]. Importantly,
we also present novel data indicating an association
between low tumor HLA class I ABC immunoreactivity at
diagnosis and poor clinical outcome, as well as markedly
lower HLA class I expression in PC bone metastases
compared to primary tumors.
The subgroups observed had similar expression levels
of neuroendocrine and cancer stem-cell markers
(Supplementary Table 2), and we found no enrichment of
tumors negative for MHC class I among docetaxel-treated
[(Fig._5)TD$FIG]
Fig. 5 – Tumor immunoreactivity for HLA class I ABC in a historical cohort of patients diagnosed via transurethral section of the prostate showing (A)reduced staining intensity in malignant (n = 284) compared to adjacent nonmalignant (n = 179) epithelium (p < 0.001) and shorter cancer-specificsurvival in patients with lower HLA class I tumor cell immunoreactivity (negative to weak) compared to [1_TD$DIFF] patients with moderate to intenseimmunoreactivity in[9_TD$DIFF] (B) patients without metastases at diagnosis (p = 0.047, n = 248), and (C) patients treated with watchful waiting (p = 0.13, n = 202).
E U R O P E A N U R O L O G Y 7 1 ( 2 0 1 7 ) 7 7 6 – 7 8 7784
patients, as previously reported [12]. Not surprisingly,
however, AR-V7 mRNA levels were much higher in the AR-
driven than in non–AR-driven CRPC metastases, while no
differences in AKR1C3 mRNA levels were seen (data not
shown and Supplementary Table 2). In addition to AR-
targeted therapies, we hypothesize that patients with AR-
driven CRPC metastases might benefit from therapies
targeting cholesterol biosynthesis, b-oxidation, and
polyamine synthesis, pathways that were particularly
upregulated in this subgroup. This is in line with previous
findings by our group of high cholesterol levels and b-
oxidation in CRPC bone metastases [13,14]. Furthermore,
we hypothesize that patients with non–AR-driven CRPC
metastases with preserved MHC class I expression will be
resistant to all forms of anti-AR therapy, but might instead
be susceptible to cancer immunotherapy.
E U R O P E A N U R O L O G Y 7 1 ( 2 0 1 7 ) 7 7 6 – 7 8 7 785
Cancer immunotherapy is based on the fact that cancer
cells are immunogenic, and the aim of immunotherapy is to
strengthen the endogenous antitumor response via immu-
nologic interventions [15]. Tumors develop in an immune-
suppressed environment in which cytotoxic CD8+ T cells
and NK cells are repressed by inhibitory factors expressed
by tumor cells, Tregs, and MDSCs, and in which MDSCs and
type M2 macrophages instead promote tumor growth via
secretion of factors that stimulate angiogenesis and tumor
cell invasion [15,16]. Most cancer immunotherapies are
developed to strengthen cytotoxic T and NK cell activity via
tumor vaccination or to inhibit immune checkpoint path-
ways such as the CTLA-4 or PDCD1/PD-L1 pathways [15].
Very little is known about the immune cell profile in PC
[18_TD$DIFF]metastases. In primary PC, low tumor infiltration of T cells,
B cells, and monocytes has been observed in advanced
disease and associated with poor prognosis [17], although
recent studies highlight tumor infiltration of specific
lymphocyte/monocyte subtypes, such as FoxP3+ Tregs,
CD163+ M2 macrophages, and S100A9-positive inflamma-
tory cells, in lethal PC [18–22]. High blood fractions of Tregs
and MDSC have been related to poor prognosis in patients
with CRPC [23], as have a whole-blood–based mRNA profile
mirroring high monocyte/low lymphocyte numbers
[24]. Overall, this points to the rationale for using
immunotherapy for treatment of PC. Immunotherapies
that are being tested in the clinic for treatment of PC include
sipuleucel-T (dendritic cell–based vaccine using prostatic
acid phosphatase as antigen), Prostvac (viral-based vaccine
using PSA as antigen), GVAX (whole-cell–based vaccine),
tasquinimod (inhibitor of S100A9 and MDSC), and immune
checkpoint inhibitors such as ipilimumab (inhibitor of
CTLA-4) and pembrolizumab (inhibitor of PD-1)
[25]. Results from the present study highlight heterogene-
ities among CRPC bone metastases that might be important
to consider when choosing immunotherapy for individual
PC patients. For instance, the inverse correlation between
expression of MHC class I and AR-regulated genes probably
diminishes response to antigen-directed vaccines targeting
AR-stimulated genes (ACPP and PSA) in the majority of CRPC
cases with high AR activity (Supplementary Figure 4).
Instead, the high MHC class I expression, immune cell
infiltration, and levels of CTLA4, PDCD1, and S100A9
observed in non–AR-driven metastases suggest testing of
immune checkpoint inhibitors and Tasquinimod specifical-
ly in this subgroup of patients. However, the current study
includes a limited number of clinical CRPC bone metastases,
so the subgroup of 20% non–AR-driven cases is particularly
small. The results need to be verified in larger cohorts,
preferably including patients in trials for evaluation of
immune-strengthening therapies. Therapy-predicting mar-
kers in addition to low serum PSA levels could be MHC class
I expression in tumor cells and the immune cell profile in
metastasis tissue and blood. In patients with multimeta-
static disease, several metastases should be studied for
optimal information.
The molecular drivers behind the subgroups of CRPC
bone metastases observed are not known and need to
be examined further. We observed high levels of the AR
co-regulators FOXA1 and HOXB13, which might be
responsible for programming the AR cistrome in AR-driven
bone metastases [26], while the function of the prostate-
derived Ets factor SPDEF in PC is more controversial
[27,28]. The low immune-cell infiltration observed in AR-
driven metastases might be explained in part by low levels
of LYVE1 (Supplementary Table 4) and thus low predicted
numbers of lymphatic vessels, recently demonstrated as a
critical determinant of the metastatic process in colorectal
cancer through reduced immune cytotoxicity [29].
Low levels of the monocyte/lymphocyte chemoattractant
CCL5 and predicted low levels of pro-inflammatory
cytokines such as IFNG, TNF, CSF2, NFKB, and IL4
could obviously contribute as well. In non–AR-driven
metastases, the predicted activity of TGFb1, IL5, and other
anti-inflammatory factors might inhibit T-cell activity,
possibly via activation of Tregs and MDSC as discussed
above (Supplementary Table 4). The reduced expression of
MHC class I antigen–processing molecules in clinical PC
might be caused by structural defects, or possibly by
epigenetic, transcriptional, or post-transcriptional regula-
tion [30]. If so, there might be a possibility of restoring MHC
class I expression with IFNG or drugs inhibiting methyl-
ation or histone deacetylation [11,31,32]. The inverse
correlation observed between MHC class I expression and
AR activity is in line with previous results showing
increased lymphocyte density in human prostate after
ADT [33,34] and with the general effects of androgens in
suppressing both adaptive and innate immune responses
[35]. Taken together, these findings support the rationale
for treating PC patients with combinations of ADT and
immunotherapy [36].
5. Conclusions
In conclusion, the majority of CRPC bone metastases show
high AR activity, high metabolic activity, low MHC class I
expression and low numbers of infiltrating immune cells. By
contrast, a subgroup of metastases shows low AR and
metabolic activity, but high MHC class I expression and
immune cell infiltration. Targeted therapies for these two
CRPC subgroups should be explored.
Author contributions: Pernilla Wikstrom had full access to all the data in
the study and takes responsibility for the integrity of the data and the
accuracy of the data analysis.
Study concept and design: Wikstrom.
Acquisition of data: Bovinder Ylitalo, Egevad, Bergh, Wikstrom.
Analysis and interpretation of data: Bovinder Ylitalo, Thysell, Lundholm,
Wikstrom.
Drafting of the manuscript: Wikstrom.
Critical revision of the manuscript for important intellectual content:
Bovinder Ylitalo, Thysell, Jernberg, Lundholm, Crnalic, Egevad, Stattin,
Widmark, Bergh.
Statistical analysis: Thysell, Wikstrom.
Obtaining funding: Wikstrom.
Administrative, technical, or material support: Jernberg, Crnalic, Stattin,
Widmark, Bergh.
Supervision: None.
Other: None.
E U R O P E A N U R O L O G Y 7 1 ( 2 0 1 7 ) 7 7 6 – 7 8 7786
Financial disclosures: Pernilla Wikstrom certifies that all conflicts of
interest, including specific financial interests and relationships and
affiliations relevant to the subject matter or materials discussed in the
manuscript (eg, employment/affiliation, grants or funding, consultan-
cies, honoraria, stock ownership or options, expert testimony, royalties,
or patents filed, received, or pending), are the following: None.
Funding/Support and role of the sponsor: This study was supported by
grants from Swedish Research Council (K2013-64X-20407-04-3), the
Swedish Cancer Society (CAN 2013/845 and CAN 2013/1324), The
Swedish Foundation for Strategic Research (RB13-0119), Cancer
Research Foundation in Northern Sweden, Umea University, the county
of Vasterbotten, and the Erling-Persson Family Foundation. The sponsors
played no direct role in the study.
Acknowledgments: The authors are grateful to Pernilla Andersson and
Susanne Gidlund for excellent technical assistance.
Appendix A. Supplementary data
Supplementary data associated with this article can be
found, in the online version, at http://dx.doi.org/10.1016/j.
eururo.2016.07.033.
References
[1] Nelson PS. Molecular states underlying androgen receptor activa-
tion: a framework for therapeutics targeting androgen signaling in
prostate cancer. J Clin Oncol 2012;30:644–6.
[2] Omlin A, Pezaro C, Gillessen Sommer S. Sequential use of novel
therapeutics in advanced prostate cancer following docetaxel che-
motherapy. Ther Adv Urol 2014;6:3–14.
[3] Hornberg E, Ylitalo EB, Crnalic S, et al. Expression of androgen
receptor splice variants in prostate cancer bone metastases is
associated with castration-resistance and short survival. PLoS
One 2011;6:e19059.
[4] Antonarakis ES, Lu C, Wang H, et al. AR-V7 and resistance to
enzalutamide and abiraterone in prostate cancer. N Engl J Med
2014;371:1028–38.
[5] Jernberg E, Thysell E, Bovinder Ylitalo E, et al. Characterization of
prostate cancer bone metastases according to expression levels of
steroidogenic enzymes and androgen receptor splice variants. PLoS
One 2013;8:e77407.
[6] Crnalic S, Hornberg E, Wikstrom P, et al. Nuclear androgen receptor
staining in bone metastases is related to a poor outcome in prostate
cancer patients. Endocr Relat Cancer 2010;17:885–95.
[7] Hammarsten P, Karalija A, Josefsson A, et al. Low levels of phos-
phorylated epidermal growth factor receptor in nonmalignant and
malignant prostate tissue predict favorable outcome in prostate
cancer patients. Clin Cancer Res 2010;16:1245–55.
[8] Eriksson L, Antti H, Gottfries J, et al. Using chemometrics for
navigating in the large data sets of genomics, proteomics, and
metabonomics (gpm). Anal Bioanal Chem 2004;380:419–29.
[9] Blades RA, Keating PJ, McWilliam LJ, George NJ, Stern PL. Loss of HLA
class I expression in prostate cancer: implications for immunother-
apy. Urology 1995;46:681–6.
[10] Seliger B, Stoehr R, Handke D, et al. Association of HLA class I
antigen abnormalities with disease progression and early recur-
rence in prostate cancer. Cancer Immunol Immunother 2010;59:
529–40.
[11] Kitamura H, Torigoe T, Asanuma H, Honma I, Sato N, Tsukamoto T.
Down-regulation of HLA class I antigens in prostate cancer tissues
and up-regulation by histone deacetylase inhibition. J Urol
2007;178:692–6.
[12] Domingo-Domenech J, Vidal SJ, Rodriguez-Bravo V, et al. Suppres-
sion of acquired docetaxel resistance in prostate cancer through
depletion of notch- and hedgehog-dependent tumor-initiating
cells. Cancer Cell 2012;22:373–88.
[13] Thysell E, Surowiec I, Hornberg E, et al. Metabolomic characteriza-
tion of human prostate cancer bone metastases reveals increased
levels of cholesterol. PLoS One 2010;5:e14175.
[14] Iglesias-Gato D, Wikstrom P, Tyanova S, et al. The proteome of
primary prostate cancer. Eur Urol 2016;69:942–52.
[15] Mahoney KM, Rennert PD, Freeman GJ. Combination cancer immu-
notherapy and new immunomodulatory targets. Nat Rev Drug
Discov 2015;14:561–84.
[16] Marchesi M, Andersson E, Villabona L, et al. HLA-dependent tumour
development: a role for tumour associate macrophages? J Transl
Med 2013;11:247.
[17] Strasner A, Karin M. Immune Infiltration and Prostate Cancer. Front
Oncol 2015;5:128.
[18] Davidsson S, Ohlson AL, Andersson SO, et al. CD4 helper T cells, CD8
cytotoxic T cells, and FOXP3+ regulatory T cells with respect to
lethal prostate cancer. Mod Pathol 2013;26:448–55.
[19] Flammiger A, Weisbach L, Huland H, et al. High tissue density of
FOXP3+ T cells is associated with clinical outcome in prostate
cancer. Eur J Cancer 2013;49:1273–9.
[20] Lanciotti M, Masieri L, Raspollini MR, et al. The role of M1 and M2
macrophages in prostate cancer in relation to extracapsular tumor
extension and biochemical recurrence after radical prostatectomy.
BioMed Res Int 2014;2014:486798.
[21] Tidehag V, Hammarsten P, Egevad L, et al. High density of S100A9
positive inflammatory cells in prostate cancer stroma is associated
with poor outcome. Eur J Cancer 2014;50:1829–35.
[22] Lundholm M, Hagglof C, Wikberg ML, et al. Secreted factors from
colorectal and prostate cancer cells skew the immune response in
opposite directions. Sci Rep 2015;5:15651.
[23] Idorn M, Kollgaard T, Kongsted P, Sengelov L, Thor Straten P.
Correlation between frequencies of blood monocytic myeloid-de-
rived suppressor cells, regulatory T cells and negative prognostic
markers in patients with castration-resistant metastatic prostate
cancer. Cancer Immunol Immunother 2014;63:1177–87.
[24] Wang L, Gong Y, Chippada-Venkata U, et al. A robust blood gene
expression-based prognostic model for castration-resistant pros-
tate cancer. BMC Med 2015;13:201.
[25] Saad F, Miller K. Current and emerging immunotherapies for cas-
tration-resistant prostate cancer. Urology 2015;85:976–86.
[26] Pomerantz MM, Li F, Takeda DY, et al. The androgen receptor
cistrome is extensively reprogrammed in human prostate tumori-
genesis. Nat Genet 2015;47:1346–51.
[27] Cheng XH, Black M, Ustiyan V, et al. SPDEF inhibits prostate
carcinogenesis by disrupting a positive feedback loop in regulation
of the Foxm1 oncogene. PLoS Genet 2014;10:e1004656.
[28] Kim IJ, Kang TW, Jeong T, Kim YR, Jung C. HOXB13 regulates the
prostate-derived Ets factor: implications for prostate cancer cell
invasion. Int J Oncol 2014;45:869–76.
[29] Mlecnik B, Bindea G, Kirilovsky A, et al. The tumor microenviron-
ment and immunoscore are critical determinants of dissemination
to distant metastasis. Sci Transl Med 2016;8, 327ra26.
[30] Bukur J, Jasinski S, Seliger B. The role of classical and non-classical
HLA class I antigens in human tumors. Semin Cancer Biol 2012;22:
350–8.
[31] Chang CC, Pirozzi G, Wen SH, et al. Multiple structural and epige-
netic defects in the human leukocyte antigen class I antigen pre-
sentation pathway in a recurrent metastatic melanoma following
immunotherapy. J Biol Chem 2015;290:26562–75.
[32] Fonsatti E, Nicolay HJ, Sigalotti L, et al. Functional up-regulation of
human leukocyte antigen class I antigens expression by 5-aza-20-

E U R O P E A N U R O L O G Y 7 1 ( 2 0 1 7 ) 7 7 6 – 7 8 7 787
deoxycytidine in cutaneous melanoma: immunotherapeutic impli-
cations. Clin Cancer Res 2007;13:3333–8.
[33] Gannon PO, Poisson AO, Delvoye N, Lapointe R, Mes-Masson AM,
Saad F. Characterization of the intra-prostatic immune cell infiltra-
tion in androgen-deprived prostate cancer patients. J Immunol
Methods 2009;348:9–17.
[34] Sorrentino C, Musiani P, Pompa P, Cipollone G, Di Carlo E. Androgen
deprivation boosts prostatic infiltration of cytotoxic and regulatory
T lymphocytes and has no effect on disease-free survival in prostate
cancer patients. Clin Cancer Res 2011;17:1571–81.
[35] Trigunaite A, Dimo J, Jorgensen TN. Suppressive effects of andro-
gens on the immune system. Cell Immunol 2015;294:87–94.
[36] Drake CG, Sharma P, Gerritsen W. Metastatic castration-resistant
prostate cancer: new therapies, novel combination strategies and
implications for immunotherapy. Oncogene 2014;33:5053–64.