Embed Size (px)
Citation preview
ETHNICITY AND EQUALITY IN POST-COMMUNIST
ECONOMIC TRANSITION :
EVIDENCE FROM RUSSIA'S REPUBLICS
Donna Bahry
Vanderbilt University
The National Council for Eurasian and East European Researc h
910 17th Street, N.W.Suite 300
Washington, D .C. 20006
TITLE VIII PROGRAM
ProjectInformation*
Principal Investigator :
Donna Bahry
Council Contract Number :
814-07g
Date :
March 18, 200t
Copyright Informatio n
Scholars retain the copyright on works they submit to NCEEER . However, NCEEER possesse sthe right to duplicate and disseminate such products, in written and electronic form, as follows : (a)for its internal use ; (b) to the U.S. Government for its internal use or for dissemination to officials o fforeign governments ; and (c) for dissemination in accordance with the Freedom of Information Ac tor other law or policy of the U .S. government that grants the public access to documents held by th eU.S. government.
Additionally, NCEEER has a royalty-free license to distribute and disseminate papers submitte dunder the terms of its agreements to the general public, in furtherance of academic research ,scholarship, and the advancement of general knowledge, on a non-profit basis . All papersdistributed or disseminated shall bear notice of copyright . Neither NCEEER, nor the U .S .Government, nor any recipient of a Contract product may use it for commercial sale .
The work leading to this report was supported in part by contract or grant funds provided by the National Council fo rEurasian and East European Research, funds which were made available by the U.S. Department of State under TitleVIII (The Soviet-East European Research and Training Act of 1983, as amended) . The analysis and interpretationscontained herein are those of the author .
ii

Abstrac t
For ethnically diverse societies, as in Russia, the post-communist economic transition implies a
restructuring of the old cultural division of labor – the distribution of occupations and rewards amon g
ethnic groups . The Soviet commitment to affirmative action policies for non-Russian regions and thei r
resident minorities unraveled along with the USSR. And without central controls over employment and
wages, education, and investment, the federal government has far fewer levers to impose quotas or to
push industrial and urban development into minority areas . The question, then, is who bears the burde n
of economic dislocation and who benefits from new economic opportunities? This paper uses survey dat a
to explore the connections between ethnicity and economic transition in three republics of Russia –
Tatarstan, North Ossetia and Sakha (Yakutia) .
iii


Since the fall of communism, the social impacts of economic transition have become ever mor e
visible . Efforts to marketize and privatize have redrawn class boundaries, undermined traditional jo b
guarantees, and eroded the old social safety net . The result is a wider gap between rich and poor ,
especially in post-Soviet states .
For ethnically diverse societies, as in Russia, the transition also implies a restructuring of the ol d
cultural division of labor (CDL) – the distribution of occupations and rewards among ethnic groups . 1 The
Soviet commitment to affirmative action policies for non-Russian regions and their resident minoritie s
unraveled along with the USSR . And without central controls over employment and wages, education,
and investment, the federal government has far fewer levers to impose quotas or to push industrial an d
urban development into minority areas .
But how the advent of the market actually plays out among the Russian Federation's differen t
nationalities is far from clear. Given the old CDL, with non-Russians typically concentrated in les s
developed ethnic homelands and in lower-paying sectors, the economic transition might well reinforce old
disparities . On the other hand, dramatic devolution has given eponymous groups new powers to shap e
the local economy . Expanded home rule for titular nationalities could thus reward the in-group at the
expense of local Russian residents .
The question, then, is who bears the burden of economic dislocation and who benefits from ne w
economic opportunities? Do titular groups reap a disproportionate share of the pain or gain under hom e
rule? Equally important, how do subjective assessments of equality mesh with the actual distribution of
burdens and benefits?
This paper explores the connections between ethnicity and economic transition in three republics
of Russia – Tatarstan, North Ossetia and Sakha (Yakutia) . Tatarstan and Sakha have been leaders in the
quest for expanded republic rights, garnering some of the most dramatic concessions from the federal
government during the period of "high sovereignty" (1991-1999) . Both republics won control ove r
substantial shares of hard currency trade in local resources (oil in Tatarstan, and diamonds, gold, oil and
gas, among other things, in Sakha) . They have had the most discretion over local resources and arguabl y
1

the most leeway of any Russian regions in allocating rewards to local constituents . If home rule doe s
afford privileges for titular nationalities, it should do so in these two regions .
North Ossetia, in contrast, has been far less of a pioneer on issues of federal relations .
Lacking the resource endowments of a Tatarstan or a Sakha, and surrounded by conflicts in the Nort h
Caucasus, it had less to gain from pressing Moscow for greater autonomy . The local agenda has instea d
been dominated by disputes with neighboring regions . And these have in many ways reinforced local
dependence on Moscow .2
The focus here is on the experience of economic transition among the two major nationalities i n
each region – the titular group and Russians, who together make up over four-fifths of the population i n
each case. The following section addresses the dimensions of inequality in postcommunist Russia ; the
likely effects on the two major ethnic groups in each republic ; and the potential impacts of home rule .
The paper then presents empirical evidence on the degree of inequality in experiences with economi c
transition in the late 1990s, and on individual perceptions of bias .
Economic inequality and ethnic stratificatio n
Given the depth of Russian economic decline during the 1990s, the growth of inequality is hardl y
surprising . GDP dropped in real terms almost every year from 1990 through 1999 .3 By the end of the
decade, it was 57 percent of what it had been ten years earlier .4 Reported unemployment rose from
around 5 percent in 1992 to nearly 12 percent by 1997 . 5 And the Gini coefficient for disposable income
doubled from the late 1980s to 1993-95 . 6 During the first six years of Russia's market reforms (199 2
through 1997), at least one-fifth to one-quarter of the population lived below the official poverty line . '
Poverty was especially prevalent among single-parent households and those with more children ; among
people with less education ; and among those living in rura l areas.8
It was also more prevalent in Russia's republics than in predominantly Russian regions . In 1997 ,
for example, 12 of the Russian Federation's 21 republics had a poverty rate of 30 percent or more ,
compared to just nine of 58 Russian regions . (The average rate for the Russian Federation as a whole was
2
20.8 percent .) Of the eleven regions in the federation with the highest poverty rates (40 percent or more
of the population living below the poverty line), eight were republics . 9
The implications for different nationalities within republics are ambiguous, however . If rural
residence and lower levels of schooling were key determinants of poverty, then many non-Russians coul d
be at risk . Despite Soviet affirmative action programs promoting education and urbanization, most non -
Russian groups stiII lagged behind Iocal Russian residents on these dimensions by 1991 . Many of their
gains in education had come in non-technical – and thus lower priority – fields, while Russian s
constituted the majority of engineers, industrial specialists, etc . When it came to careers, indigenou s
nationalities typically worked in lower-paying sectors such as agriculture, trade or public services, whil e
Russians predominated in more lucrative fields such as heavy industry and construction .10
Research on Soviet-era employment and ethnicity in North Ossetia, for example, found that as of
the last Soviet census (1989) Ossetins were under-represented in industry, and especially in machine-
building/metal-working, but overrepresented in agriculture and trade. " Tatarstan had a similar division o f
labor.12 Parallel research in Sakha revealed an even greater disparity among Russians and Yakuts, with
far fewer of the titular nationality employed in any branch of industry, and far more in farming . 1 3
Yet the old CDL could well be superseded with the rise of home rule . Resurgent
ethnonationalism suggests heightened demand for indigenous leaders to reward their own, if only t o
compensate for past inequities . In fact, as Michael Hechter has argued, mobilization actually may require
such selective incentives .14 Since the quest for sovereignty typically faces low odds and promises only a
collective good, ethnic leaders must find other ways of rallying individual supporters . The promise o f
patronage can thus be a key resource for leaders seeking to build a constituency for expanded ethnic
rights .
Pressures to reward co-nationals should be especially intense in the postcommunist context. The
old political system gave titular groups the trappings of statehood while denying them real home rule .
Eponymous nationalities thus developed a sense of entitlement – of "owning" their territory and it s
3
political institutions – without the corresponding right to self-determination . 15 Ignoring the expectation s
for ethnic capture in these circumstances could leave local leaders vulnerable to outbidding .
Such straight-out ethnic capture can be costly, however. Demands to redress the old CDL are
likely to arise well before the titular nationality has enough skilled and experienced personnel to manag e
all key sectors of the local economy . Even where different ethnic groups possess similar levels o f
education and skills, they are still segmented by technical specialty, experience and professiona l
networks . Rapid, wholesale replacement could thus undermine the local economy .
Moreover, wholesale replacement could hardly fail to alienate local Russians . As the new local
out-group, they would provide a natural constituency for a central government seeking to contain regiona l
demands . Indigenous leaders may therefore find it more useful to spread the wealth and promote
solidarity at home. This would bolster their case for regional autonomy, and reduce their vulnerability to
a "divide and rule" strategy from above . Local cross-ethnic solidarity could be particularly valuable when
regional rights have been highly contingent on the political winds in Moscow .
Newly empowered indigenous leaders might thus opt for other, less disruptive ways of rewardin g
their own . Milton Esman shows, for example, that indigenous leaders in other ethnic transitions provide
for co-nationals by expanding the public sector . 16 The strategy typically includes adding slots i n
education, and especially in public universities ; expanding jobs in, and patronage through the stat e
bureaucracy ; and promoting new indigenous businesses via government contracts, credits and the like .
The net effect is to create new sources of rewards for the indigenous nationality without radically
displacing other groups .
As one example, Esman notes that the Quiet Revolution in the 1960s and the rise of the Part i
Quebecois led to dramatic growth of the public sector in Quebec.17 Part of the increase came in
education, as the provincial government took over schooling from the Catholic Church and expande d
opportunities in higher education . Another part came in the expansion of public enterprise and programs
to support French-owned firms. The result was to boost Francophone advancement in both governmen t
and business, helped along by a language policy that made French the official tongue in the province in
4
the 1970s . By the 1980s, old disparities between Francophones and Anglophones had largely declined . "
Research in the 1990's showed that Francophone social mobility was roughly equal to that o f
Anglophones in Canada as a whole ; and French-speakers had come to dominate the managerial rank s
previously held by English Canadians in Quebec . 1 9
Esman points to a similar process in Malaysia after independence in 1957 . 20 The new
government sought to correct Iong-term economic disadvantages for the native Bumiputra via a
combination of expanded public sector, public enterprise, and educational facilities . 21 1t also adopted a
language policy privileging the indigenous tongue in both the schools and the government . 22 With the
language favored and with pronounced affirmative action for the indigenous population, the old cultura l
division of labor began to erode. 23
Expanding the public sector can therefore provide a "positive sum" form of affirmative action fo r
the indigenous group . But it also carries some limitations . One is that it may be time-bound . The ability
and willingness to grow government may have been strong in the 1960s and 1970s, but the rise o f
neoliberalism has made such a strategy more doubtful since then. In fact, both Quebec and Malaysia late r
cut back public sector programs. More recent ethnonationalist movements might face much more
resistance to government expansion – most especially where economic transition is designed expressly t o
cut back the role of the state . And government expansion presumes that resources are available to financ e
new public programs .
A second limitation is that adding programs may help to minimize disruption for the ol d
dominant nationality (or other groups) but the "added" benefits may still be seen as preferential treatment .
Positive-sum affirmative action does not necessarily prevent the long-term disaffection and/o r
outmigration of non-indigenous nationalities, especially when language exclusivity comes into play .
Finally, members of the indigenous group might still see themselves as disadvantaged, despite thei r
advances. In Quebec, Francophones continued to see their own group as subject to inequality into th e
19905 . 24 And in Malaysia, indigenous nationals protested that advances fell short of full equality and
short of the government's targets for its campaign to promote indigenous interests . 25
5

Thus all options come with some serious costs . And each one is likely to yield a different pattern
of inequality. Ethnic capture implies that the titular group would dominate in economic life, with a
disproportionate share of new/private/foreign ventures, and with lower rates of unemployment, wag e
delays/cuts and unpaid leaves . Accommodation suggests that both titular groups and Russians woul d
share pain and gain evenly, with roughly equal opportunities and equal incidence of dislocation . Finally ,
it may be that the dominant factor is simply the old CDL – which would yield structural inequality . In
this case, pain and gain would be unequal, but depend more on the pre-existing CDL and distribution o f
specialties rather than ethnicity per se .
The experience of Russia's republics
Publicly, most republic leaders in Russia have taken pains to stress ethnic accommodation . Many
framed inclusive, civic appeals to all ethnic groups, emphasizing citizenship rather than ethnic origins a s
the basis for the local state . Most also adopted relatively inclusive language policies that recognized both
the titular language and Russian as state languages . And many republics pursued "soft" economic
transitions, retaining state ownership, preserving the elaborate social safety net of the communist era, an d
maintaining direct or indirect controls over local prices . 26 The official rationale was to preserve stability .
The strains of unmediated shock therapy appeared all too likely to intensify conflicts between Russian s
and titular nationalities .
The commitment to promoting ethnic peace was especially pronounced in Tatarstan and Sakha .
Governments in both cases explicitly emphasized a civic agenda, calling for interethnic accommodation .27
Both promoted the use of the indigenous language, but continued to use Russian as well in government ,
schools and workplaces . The government of Tatarstan also pioneered the concept of soft economi c
transition, with continued state intervention via price controls on local food products, a broader socia l
safety net, and substantial subsidies for agriculture . 2 8
In addition, Tatarstan pursued its own privatization policy, issuing separate local "privatizatio n
accounts" to supplement federal vouchers and limiting the resale of enterprise shares to designated buyer s
6
(within the republic). 29 In effect, the republic thus kept a substantial hold on the local economy . 30 Sakha
also retained major stakes in key local enterprises, most of them in the extractive industries . In fact, as
Viktoria Koroteeva observes, a substantial portion of republic residents' vouchers had to be investe d
outside the republic, since so few local enterprises were subject to ope n privatization.31
In North Ossetia, the agenda has focused on conflicts with neighboring regions and on copin g
with a massive inflow of refugees . The Georgian-South Ossetian conflict in the late 1980s and 1990 s
brought in an estimated 100,000 refugees from the South . And Ingush claims to the Prigorodnyi raion
prompted open fighting in late 1992 (and sporadic violence since) . 32 With respect to economic reform,
some accounts suggest little enthusiasm for market transition in a region that kept the designatio n
"socialist republic" well after other regions had dropped it . 3 3
Yet whatever the approach to interethnic relations or economic reform, all three regions have
experienced very similar patterns of political change since 1990 . The indigenous share of public
officialdom increased across the board . 34
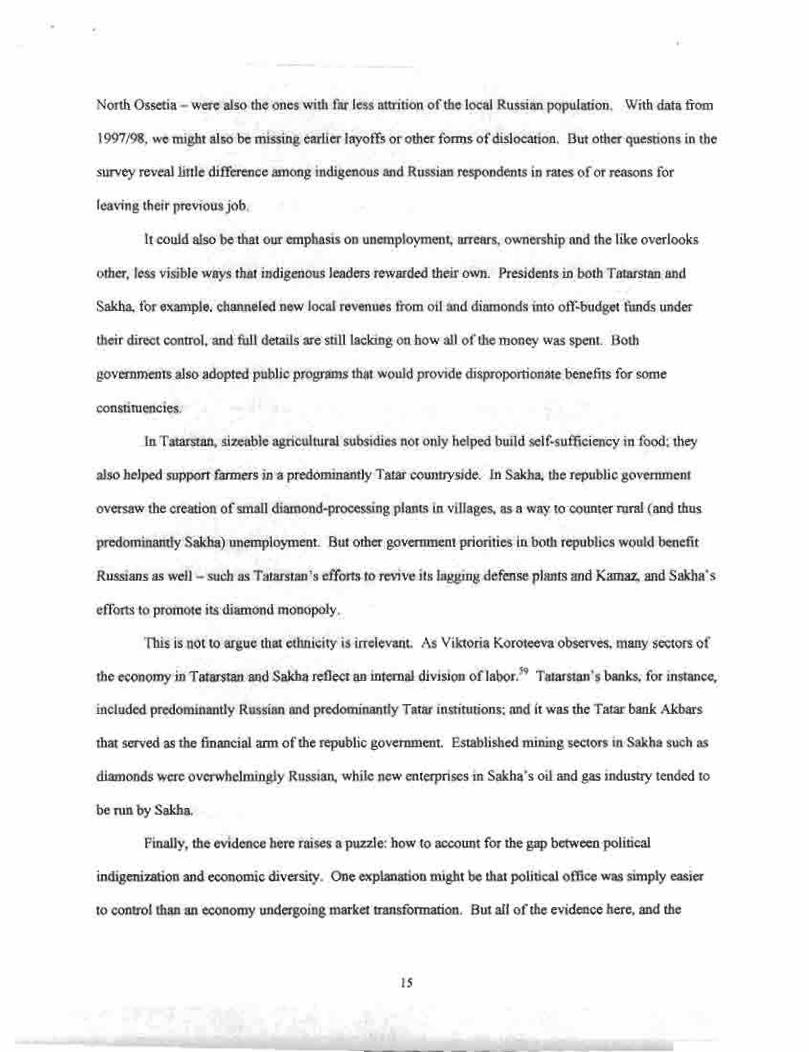
Table I (at the end of this paper) shows, for example, that the titular share of seats in republi c
legislatures rose substantially from 1990 to 1995 . In Tatarstan, where Tatars accounted for 48 .5 percen t
of the population in the 1989 census, their share of seats went from 58 percent as of 1990 to 73 .3 percent
five years later (Table 1).35 Other data on public offices in the executive branch and in local governmen t
suggest a similar picture . 36 In North Ossetia, the titular group constituted 53 percent of the population a s
of 1989, and held 70 percent of the seats in 1990. By 1995, they held 86 percent . 37 In Sakha, the Sakh a
(33.4 percent of the population at the last census) increased their share of seats from 46 .3 to 60 .8 percent
between 1990 and 1995 (Table 1) . Other data suggest that they also dominate in other branches of
government as well . As of the end of the 1990s they made up 59 percent of personnel in the executiv e
branch, and 63 percent of personnel at the city and raion level . 3 8
7
Thus where the USSR promoted ethnic "balance" in political representation, post-Sovie t
governments have rejected it . This is not to say that indigenous officials were underrepresented before;
far from it . But their increased representation is still striking, given the relative opening of the politica l
system . 39
The evidence is more mixed when it comes to economic pain and gain in the three regions . Some
research on elites suggests indigenization in economic as well as political leadership . Lilia Sagitova has
found, for example, that Tatars dominated the top slots in Tatarstan's major enterprises and government a t
the end of the 1990s . 40 In contrast, research on occupations suggests that the old CDL has endured . T. P .
Petrova and E. T. Miarikianova thus conclude that Soviet-era occupational differences were still in place
in Sakha, at least for Yakuts.41 And research comparing economic transition policies and thei r
consequences in Tatarstan and Sakha finds relatively little impact on ethnic inequality or life chances . As
Koroteeva notes, home rule brought new access to local resources, but these funded social and economi c
policies for all republic residents rather than a particular ethnic group . '
Thus there are different perspectives on how economic transition has played out in the republics ,
depending on the particular focus of research . My aim here is to extend the focus by examinin g
individual pain and gain more directly .
Data and analysis
To identify patterns of economic dislocation and privilege, the analysis here relies primarily on a
1997/98 survey in Tatarstan, Sakha and North Ossetia of roughly 1100 respondents each . (Details of th e
survey design and implementation are in Appendix 1 .) Respondents were offered the choice of bein g
interviewed in either Russian or the titular language, by same-nationality interviewers . Response rates in
the three republics were 87, 91 and 84 percent, respectively . The analysis also relies on elite interviews 1
conducted in Tatarstan and Sakha from 1997 t o 2001.43
To put experiences within the republics in context, I include data from Round VII of the Russia n
Longitudinal Monitoring Survey (RLMS), conducted in 1996 .44 (For details, see Appendix 1 .) That
round of the RLMS included 7812 adult respondents, 83 .5 percent of them Russians and 16 .5 percen t
8

non-Russians . 45 It thus allows us to compare economic experiences of Russians and titular nationalities in
our three republics with those of Russians and non-Russian nationalities in the country as a whole .
Economic advantage and disadvantage are assessed several ways. One set of measures explores
the distribution of managerial posts, with questions on the nationality of respondents' supervisors and o n
whether respondents themselves were heads or directors of their workplaces . A second set of measure s
examines employment status and income – both critical, given the growth of joblessness and incom e
inequality over the past decade .
Economic differentiation may also be more subtle, given the tendency to preserve jobs but dela y
or cut wages or hours, or send people on unpaid leaves . Various groups could also have differentia l
opportunities in the more lucrative types of new businesses, such as private firms and joint ventures .
Thus our indicators of an individual's economic situation include ownership at the workplac e
(government, foreign and private Russian), and experiences with unpaid wages, involuntary leave and pa y
cuts .
The scope of the public sector is evaluated several ways as well, in keeping with the pattern s
suggested by Esman : the number of employees in republic/local executive, legislative and judicia l
agencies; the number of places (students) in higher and secondary specialized education ; and the share o f
local employment in state-owned workplaces.
The analysis also includes subjective assessments of individual experiences with ethnic
discrimination and hostility, and perceptions of ethnic favoritism in general . These allow us to assess
both individual and collective judgments about the economic effects of nationality .
One final observation before turning to the data : the allocation of pain and gain may depend at
least in part on economic conditions in each region. Tatarstan has experienced the least dislocation, with
higher growth of nominal GDP, and slightly lower unemployment and poverty rates than Russia as a
whole (Table 2) . Sakha has had a far higher level of GDP per capita, but also a higher cost of living give n
its location and limited transportation into the republic (Table 2).46 It also experienced
a higher-than-average unemployment rate and level of poverty. North Ossetia, like other republics in the North
9
Caucasus, has fared worse . GDP has been less than a third of the all-Russian average ; unemployment has
been twice as high or more ; and the poverty level is substantially higher (Table 2) .
Ethnic dimensions of economic dislocatio n
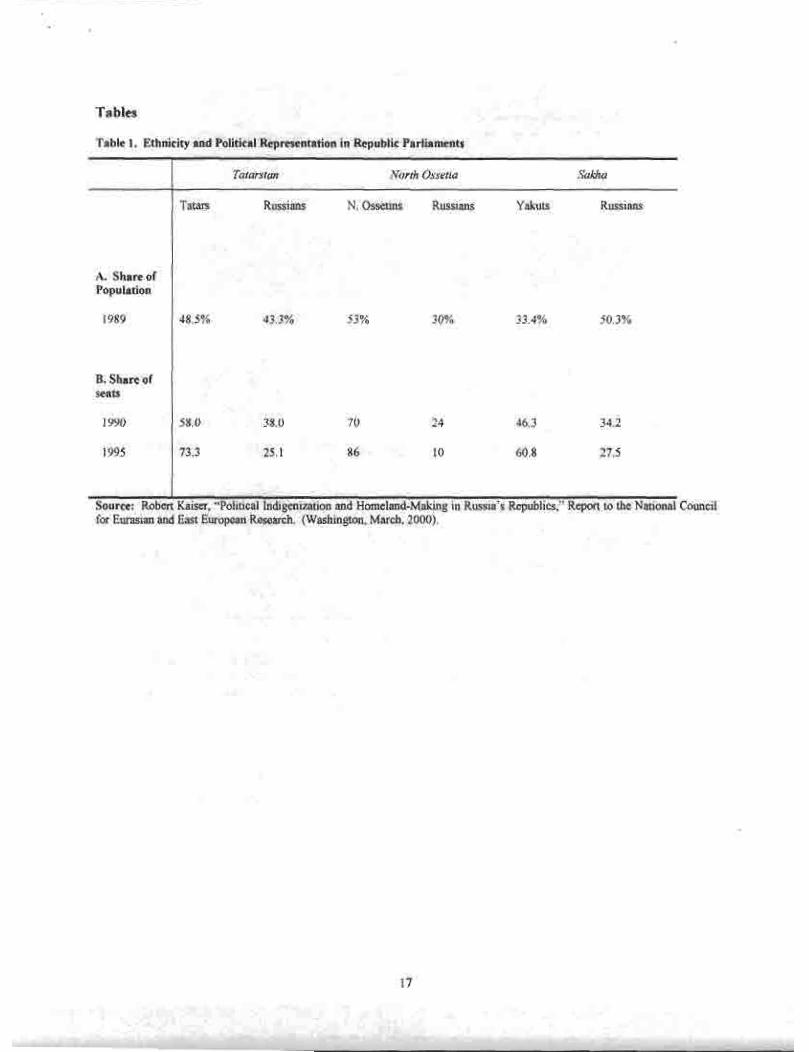
If the political systems in Tatarstan, North Ossetia and Sakha reflect the predominance o f
indigenous nationalities, the economic systems suggest more diversity . One indication is the distribution
of managers . We asked working respondents about the nationality of their supervisors at their main job ,
and the responses show that managerial posts were more evenly divided than political ones (Table 3) . We
also asked people whether they themselves were directors or heads of organizations . Here, too, the result s
suggest a more even distribution, though the numbers are too small in this case to come to a fir m
conclusion .
Individual experiences of pain and gain were even more diverse . The survey included questions
on various forms of dislocation, including unemployment, wage arrears, cuts in hours/pay, and unpai d
leave. For the most part, these all tended to offset each other: if one group experienced somewhat more
unemployment, the other might be subject to unpaid leave . On the other hand, income and wage data
reflect a systematic Russian advantage (Table 5) . The Russian "premium" ranged from nine percent for
current pay in North Ossetia to 91 percent for Sakha. Indigenous groups held an advantage in only on e
instance – Tatar pensioners had higher incomes than their Russian counterparts .
Thus most of the data on economic dislocation reveal countervailing disadvantages between
indigenous groups and Russians, while income and wage data reflect a consistent disparity . The picture i s
similar for the Russian Federation as a whole (Table 4) . Differences in government-versus-privat e
employment, arrears, wage and pay cuts between Russians and non-Russians were modest, though wit h
slightly more of an advantage for Russians . 47 The gap in wages and incomes also favored local Russia n
residents .
Within this overall pattern, however, there were some notable differences across republics . In the
case of Tatarstan, levels of unemployment, wage arrears, and unpaid leave were very similar betwee n
1 0
Tatars and Russians (Table 4) . Experiences with reductions in pay and hours were less so : Russian s
faced more cuts, apparently because they were more likely to work in big plants (such as Kamaz and the
defense industry) and in the "new economy . "
In Sakha, gaps between Sakha and Russians were larger, but also offset each other. In this case ,
the Sakha were far less likely to experience unpaid leaves or pay cuts, but they were somewhat mor e
likely to be jobless, and less likely to work in private or foreign firms (Table 4) . When it came to income
and wages, they faced the largest gap among the three republics – not surprisingly, given the continued
high concentration of Russians in diamond and gold mining and of Sakha in agriculture .
Economic differences also tended to balance each other out in North Ossetia, but with th e
positions of Ossetins and Russians reversed . Ossetins experienced higher levels of unemployment, and i f
they were employed, more frequently had jobs in private businesses . However, the private employment
in this case appeared to be largely informal (such as chelnoki, seamstresses/tailors, drivers) . This may b e
a product of the large number of resettled immigrants in the republic – lacking established networks,
many people simply have had to fend for themselves.
For the most part, then, pain and gain have offset each other . This becomes even clearer from th e
multivariate analysis in Tables 6a-c . The analysis, in Tables 6a-c, includes five dependent variables :
employment in a government-owned workplace ; employment in a privately-, self- or foreign-owned
workplace; experience with cuts in pay or hours ; unemployment; and wages . The data are assessed two
ways – first, with nationality as the sole explanatory variable, and then with a full model incorporating
controls for social and political background . Background variables include rural residence, gender ,
education, and age. The models also include the sector in which respondents are employed, to tap the
impact of the CDL. Two other variables are included as well – former CPSU membership (since that
might confer economic advantage) , 48 and immigrant status (i .e ., whether people were born in the republi c
or moved there).
1 1
As the first row in Tables 6a-c demonstrates, ethnicity taken alone has only a limited impact . It
proves significant across the board when it comes to government ownership of the workplace and

employment in the new economy . 49 But it has a less consistent effect on the other measures of pain and
gain. And once we add in background or structural variables, its impact diminishes . Thus we can explain
unemployment better by residence in a rural area . And we can explain the incidence of pay and wage cut s
better by immigrant status . Government ownership, employment in the new economy and pay levels ar e
better explained by economi c branch.50
The data in Tables 6a-c thus reinforce the conclusion that social and economic structure carrie s
more weight than nationality in shaping experiences with economic transition . This is borne out also by
correlations with earlier data on the CDL . Using an "index of representation" across different economi c
branches for each ethnic group (the group's share of employment in a given branch divided by its share o f
total employment), the correlations between 1989 and 1997 are .82 for Ossetins and .90 for Russians in
North Ossetia ; .70 and .78 in Sakha ; and .75 and .69 in Tatarstan . 5 1
Still, the public sector model suggests that efforts to boost the fortunes of indigenous group s
might be less overt. If Esman's model is correct, we should find that the republics have higher-tha n
average numbers of employees in government agencies, numbers of students in higher education, an d
public sector jobs . But while government is still heavily involved in all three regions, there is only
limited evidence that local political control has led to a larger-than-average public sector .
In fact, public sector data for Tatarstan and North Ossetia are very similar to those for the Russia n
Federation as a whole . Most people with jobs work in places where the government is a sole or par t
owner (Table 7, line E) . The RF average is 72 percent, with Tatarstan somewhat higher (80 percent) and
North Ossetia somewhat lower (68 percent) . 52 Both republics are also close to the Russian Federatio n
average for employment in republic and local government agencies (Table 7, line B) . And both regions
are similar to the average in higher education. Places in universities and institutes grew across the boar d
during the 1990s, and grew at similar rates in Tatarstan and North Ossetia, while secondary specialize d
education declined slightly .
1 2
In contrast, Sakha diverges sharply from the Russian Federation average, and comes much close r
to the public sector model . Government employment is more than twice that of the RF mean level . 53 This
might, of course, be a function of territory: Sakha accounts for 18 .2 percent of Russia's territory, but 1 . 7
percent of regional and local government employment . 54 Other evidence, though, reinforces th e
conclusion that Sakha did indeed expand the public sector . Table 7 reveals a dramatic increase in the
number of students in higher education over the period from 1990/91 to 1997/98 (69 percent in Sakha ,
compared to 15 percent for Russia as a whole) . 55 if we limit the data only to expansion in stat e
institutions, the increase is still 58 versus 8 percent. And secondary specialized education expanded i n
Sakha, while declining elsewhere .
Thus it appears that Sakha did pursue at least some parts of the public sector strategy that Esman
identified . Education was in fact a centerpiece of Sakha president Mikhail Nikolaev's domestic agenda ,
and with good reason: before the advent of sovereignty, Sakha had a much lower-than-average number o f
students in post-secondary institutions . Table 7 shows, for example, that North Ossetia, with 2/3 th e
population of Sakha, had more than twice as many university students in 1990/91 . Tatarstan, with 3 . 5
times the population of Sakha, had nearly nine times as many students . Standardizing these data to
control for differences in the size of the student-age population yields the same picture. The ratio of
college/university students to the total number of 18-to-24-year-olds was 20 .8 percent for Russia in 1990 ,
but 7 .5 percent for Sakha . 56 By 1997/98, the corresponding figures were 21 .7 percent for the Russian
Federation and 11 .7 percent for Sakha.
Perceptions of inequalit y
Thus far our data indicate little evidence of systematic ethnic differences in individual
experiences of economic transition . Self-reported data on discrimination seem to bear this out : compared
to the large numbers of people experiencing economic problems, relatively few people said that thei r
rights had been violated due to their nationality (Table 8) . More people reported that they had bee n
exposed to hostile treatment, however . S7 And perceptions of discrimination and hostile treatment were
more common among Russians than among indigenous groups . Only in Sakha – where ethnic difference s
encompass race – did the indigenous nationality report similar levels of discrimination and hostility .
1 3
But if individual experiences with discrimination were relatively limited, perceptions of collectiv e
discrimination were not . As Table 8 shows, a majority of Russians, and many Tatars, Ossetins and Sakh a
believed that nationality was important for access to good jobs and for high government posts . When
people were asked which groups were favored, Russians overwhelmingly saw themselves as havin g
limited access .
Conclusions
This essay began by asking how the burdens and benefits of economic transition are distribute d
when indigenous groups gain home rule . Our evidence reveals that the transition has followed two tracks
in the republics studied here, toward indigenous political dominance but economic diversity . On the
political side, indigenous groups gained disproportionate representation in elective and non-electiv e
public office . Transition thus heightened local political consolidation – a critical asset in dealing with an
unpredictable and divided central government . But on the economic side, the picture is much mor e
varied . There is less evidence of consistent advantage for indigenous groups. Instead, experiences wit h
the economic transition seem to be explained better by the continuing influence of the old CDL, wit h
countervailing advantages and disadvantages for indigenous groups and Russians .
The analysis presented here also provides only limited support for the public sector model . Two
of the three regions – Tatarstan and North Ossetia – show little sign of expanded public programs on ke y
indicators such as government ownership, higher education or government employment . Only Sakha
diverges, with substantially more employees in government, and more places in higher education . This
seems to stem from two things – the greater initial disparities between the Sakha and Russians, and acces s
to export revenues to help underwrite republic programs ,
It could be argued, though, that the pattern of offsetting pain and gain outlined here does no t
capture some other elements of the transition . If the most mobile Russian residents left earlier, we woul d
see relatively equal experiences only because one privileged group had already gone . But outmigration
was substantial only in Sakha. 58 The two regions with the more equal incomes and wages – Tatarstan and
1 4
North Ossetia – were also the ones with far less attrition of the local Russian population . With data fro m
1997/98, we might also be missing earlier layoffs or other forms of dislocation . But other questions in th e
survey reveal little difference among indigenous and Russian respondents in rates of or reasons fo r
leaving their previous job .
It could also be that our emphasis on unemployment, arrears, ownership and the like overlook s
other . less visible ways that indigenous leaders rewarded their own. Presidents in both Tatarstan an d
Sakha, for example, channeled new local revenues from oil and diamonds into off budget funds unde r
their direct control, and full details are still lacking on how all of the money was spent . Both
governments also adopted public programs that would provide disproportionate benefits for som e
constituencies .
In Tatarstan, sizeable agricultural subsidies not only helped build self-sufficiency in food ; they
also helped support farmers in a predominantly Tatar countryside . In Sakha, the republic government
oversaw the creation of small diamond-processing plants in villages, as a way to counter rural (and thu s
predominantly Sakha) unemployment . But other government priorities in both republics would benefit
Russians as well – such as Tatarstan's efforts to revive its lagging defense plants and Kamaz, and Sakha' s
efforts to promote its diamond monopoly .
This is not to argue that ethnicity is irrelevant . As Viktoria Koroteeva observes, many sectors o f
the economy in Tatarstan and Sakha reflect an internal division of labor .59 Tatarstan's banks, for instance ,
included predominantly Russian and predominantly Tatar institutions ; and it was the Tatar bank Akbars
that served as the financial arm of the republic government . Established mining sectors in Sakha such as
diamonds were overwhelmingly Russian, while new enterprises in Sakha's oil and gas industry tended t o
be run by Sakha .
Finally, the evidence here raises a puzzle : how to account for the gap between political
indigenization and economic diversity . One explanation might be that political office was simply easier
to control than an economy undergoing market transformation . But all of the evidence here, and th e
1 5

public statements of each government, confirm that all three retained substantial control of the loca l
economy.
Another explanation might focus on time : the economic situation may not change as quickly a s
the political system did . But other evidence challenges this argument . Titma, Tuma and Silver's researc h
on Estonia found, for example, that the income differential there (net of situational factors) shifted from a
slight advantage for Russians to a substantial premium for Estonians over the same period .60 Changes in
Quebec and Malaysia were also fairly rapid . Estonians, Quebecois and Malaysians did have th e
advantage of majority status, while the titular groups in the two "sovereignist" republics here (Tatarstan
and Sakha) were minorities . But while the numerical distribution is important, it seems to be les s critical
than policies that privilege the indigenous language . These, as Esman notes, are used to "raise the valu e
of the indigenous language," and can make a critical – and relatively quick – difference in rewards . 6 1
A third explanation for the distinction between political indigenization and economic diversit y
may be that republic governments have sought to provide different "goods" for different publics :
emphasizing political rewards and culture for the indigenous population and soft economic transition fo r
Russians. Lilia Sagitova has found, for example, that discussions of republic rights were couched
differently in Tatar-language versus Russian-language media in the 1990s . Tatar media focused o n
questions of language and culture, while local Russian media highlighted the economic side of loca l
autonomy . 62 And Dmitry Gorenburg has argued that republic leaders emphasized the economi c
advantages of sovereignty in general but also quietly promoted ethnic revival among titular groups . 6 3
The political payoff for republic governments seems to be mixed, however . Compared to the
pervasive incidence of economic pain, relatively few people see themselves as individual victims o f
discrimination . But most local Russians see pronounced collective discrimination in access to
government posts and good jobs . Measured transition may have limited the risks of heightened ethnic
stratification, but it has had much less effect on the subjective sense of inequality .
1 6
Tables
Table 1 . Ethnicity and Political Representation in Republic Parliament s
Tatarstan
North Ossetia
Sakha
Tatars
Russians
N . Ossetins
Russians
Yakuts
Russians
A. Share o fPopulatio n
1989 48 .5% 43 .3% 53% 30% 33 .4% 50 .3 %
B. Share o fseats
58 .0 38 .0 70 24 46,3 34 . 2199 0
1995 73 .3 25 .1 86 10 60 .8 27 .5
Source : Robert Kaiser, "Political Indigenization and Homeland-Making in Russia's Republics," Report to the National Counci lfor Eurasian and East European Research. (Washington. March. 2000) .
1 7

Table 2 . Economic Conditions in Tatarstan, North Ossetia and Sakha '
1992 1993 1994 1995 1996 1997 1998
A. Population (thous . )Tatarstan
3,6963,723 3,744 3,755 3,760 3 .767 3,77 4
North Ossetia 695 651 650 659 663 665 66 3Sakha 1 .093 1,074 1 .061 1 .036 1,023 1,016 1 .00 3
B . GDP per capita(thous . current rubles )2Tatarstan 3237 .0 10067 .2 15316 .1 17813 . 5North Ossetia 1345 .7 3526 .6 4780 .5 5127 . 4Sakha 8079 .6 19756 .0 26682 .6 29678 . 1Russian Federation 3583.7 9562.2 13230.0 15794. 1
C. Unemployment (%) 3Tatarstan 3 .6 3 .6 6 .1 6 .5 6 .5 7 .9 10 . 9North Ossetia 23 .3 30 .1 22.2 26 . 6Sakha 3 .4 3 .9 6 7 .1 6 .7 12 .6 13 . 6Russian Federation 5.2 5 .9 8.1 9.5 9 .7 11 .8 13 . 3
D. Percent of pop nbelow officia lpoverty line
Tatarstan 15 .4 22 .1 19 .3 17.9 19 . 9North Ossetia 33 .1 42 .8 38 .5 33 .9 35 . 3Sakha 22.7 29 .2 30 .4 28 .3 32 . 0Russian Federation 22.4 24 .7 22.1 20.8 23 . 8
_ E . Ratio of av gIncome/povertyLeve lTatarstan 238 205 217 242 21 7North Ossetia 139 137 137 158 15 0Sakha 200 163 169 187 16 3Russian Federation 240 195 206 226 197
' Blanks indicate that no data are available for a given year .2 Data on GDP per capita for the Russian Federation represent the sum of regional products, excluding som eservices carried out only at the federal level and not distributed among regions .
Unemployment data are defined according to ILO criteria : the percent of working-age population who do not hav ea paid job and are looking for one (p . 103) . (I .e ., the data are not limited only to people officially registered wit hemployment services . )
Source for ratio of average income/poverty level, 1994 : : Regiony Rossii. Statisticheskii sbornik, tom 2, (Moscow,1998), pp. 110-111 . All other data : Regiony Rossii. Statisticheskii sbornik. Tom 2. (Moscow, 1999), pp . 32-33 ;97-98 ; 128-29 ; 134-35; 279-81 .
1 8
Table 3 . Nationality of Supervisors (Working-Ag e Only)4
Tatarstan North Ossetia Sakh a
Of all employed, % whosesupervisers are:
Indigenous 54 .8 69.8 41 . 1Russian 38 .5 20 .7 43 . 2
(N) (530) (333) (609 )
% of each group who are head sof ents/orgs
0.8 1 .9 2 . 3Indigenous(N) (266) 1208) (263 )
Russian 1 .3 1 .7 1 . 6(N) (226) (119) (318)
Includes only people who are employed and of working-age (for women_ 18-54 ; for men, 18-59) .
Source : Ethnonationalism and Democratization Survey, 1997/98 .
1 9
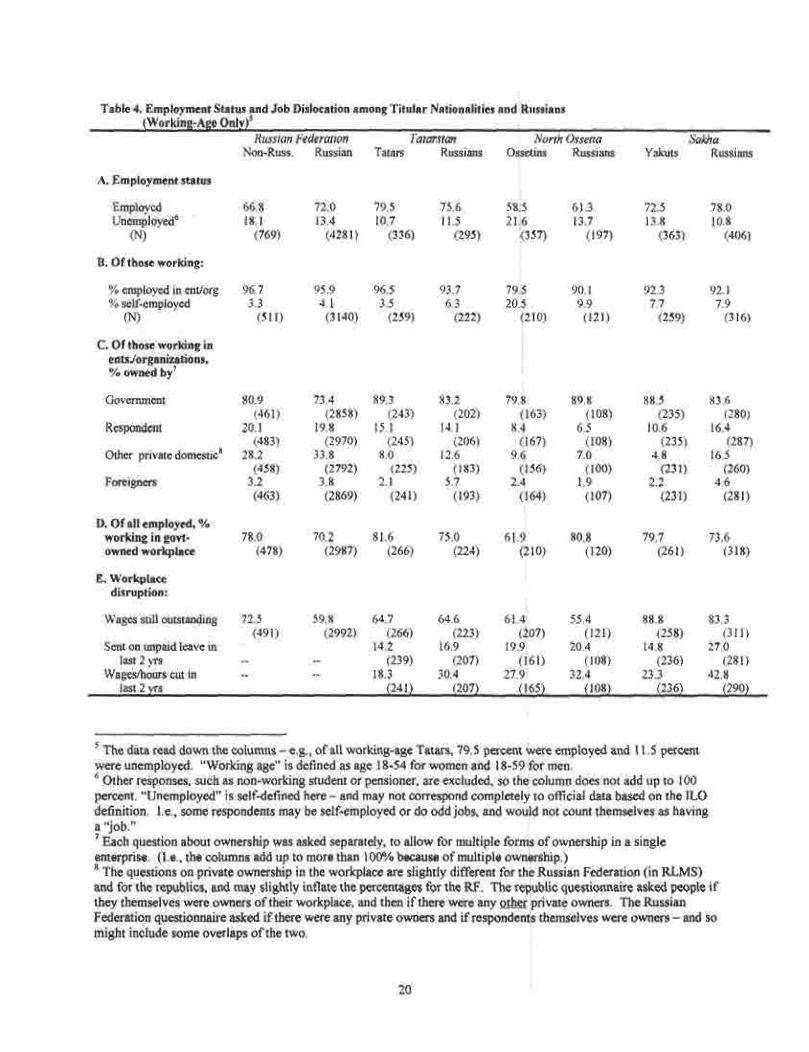
Table 4 . Employment Status and Job Dislocation among Titular Nationalities and Russian s(Working-Age Only)5
Russian Federation TatarstanTatars
RussiansNorth Ossetia Sakha
Yakuts
Russian sNon-Russ . Russian Ossetins Russian s
A . Employment statu s
Employed 66.8 72 .0 79 .5 75 .6 58 .5 61 .3 72 .5 78 . 0Unemployed6 18 .1 13 .4 10 .7 11 .5 21 .6 13 .7 13 .8 10 . 8
(N) (769) (4281) (336) (295) (357) (197) (363) (406 )
B . Of those working :
% employed in ent/org 96 .7 95 .9 96.5 93 .7 79 .5 90.1 92 .3 92 . 1% self-employed 3 .3 4 .1 3 .5 6 .3 20 .5 9 .9 7.7 7 . 9
(N) (511) (3140) (259) (222) (210) (121) (259) (316 )
C. Of those working i nents./organizations,% owned by7
Government 80 .9 73 .4 89 .3 83 .2 79 .8 89 .8 88 .5 83 . 6(461) (2858) (243) (202) (163) (108) (235) (280 )
Respondent 20 .1 19 .8 15 .1 14 .1 8 .4 6 .5 10 .6 16 . 4(483) (2970) (245) (206) (167) (108) (235) (287)
Other private domestic8 28 .2 33 .8 8 .0 12 .6 9 .6 7 .0 4 .8 16 . 5(458) (2792) (225) (183) (156) (100) (231) (260 )
Foreigners 3 .2 3 .8 2.1 5 .7 2 .4 1 .9 2 .2 4 . 6(463) (2869) (241) (193) (164) (107) (231) (281 )
D. Of all employed, %working in govt- 78 .0 70 .2 81 .6 75 .0 61 .9 80.8 79 .7 73 . 6owned workplace (478) (2987) (266) (224) (210) (120) (261) (318 )
E . Workplacedisruption :
72 .5 59 .8 64.7 64 .6 61 .4 55 .4 88 .8 83 . 3Wages still outstanding(491) (2992) (266) (223) (207) (121) (258) (311 )
Sent on unpaid leave in 14 .2 16 .9 19.9 20 .4 14 .8 27 . 0last 2 yrs (239) (207) (161) (108) (236) (281 )
Wages/hours cut in 18 .3 30 .4 27 .9 32 .4 23 .3 42 . 8last 2 yrs (241) (207) (165) (108) (236) (290)
5 The data read down the columns - e .g ., of all working-age Tatars, 79 .5 percent were employed and 11 .5 percentwere unemployed . "Working age" is defined as age 18-54 for women and 18-59 for men .6 Other responses, such as non-working student or pensioner, are excluded, so the column does not add up to 10 0percent . "Unemployed" is self-defined here - and may not correspond completely to official data based on the ILOdefinition . 1 .e ., some respondents may be self-employed or do odd jobs, and would not count themselves as havin ga "job . "
Each question about ownership was asked separately, to allow for multiple forms of ownership in a singl eenterprise . (I.e ., the columns add up to more than 100% because of multiple ownership . )8 The questions on private ownership in the workplace are slightly different for the Russian Federation (in RLMS )and for the republics, and may slightly inflate the percentages for the RF. The republic questionnaire asked people i fthey themselves were owners of their workplace, and then if there were any other private owners . The Russia nFederation questionnaire asked if there were any private owners and if respondents themselves were owners - and s omight include some overlaps of the two.
20

Sources for Table 4 :
Russian Federation : Russian Longitudinal Monitoring Survey, 1996Republics : Ethnonationalism and Democratization Survey, 1997/9 8
2 1

Table 5 . Income and Wages among Titular Nationalities and Russian s Russian Federation
Tatarstan
North Ossetia
.Sakh aNon-
Russians
Tatars
Russians
Ossetins
Russian sRussians
Yakuts
Russians
A. Mean personal income 9(thous . rubles)
451 .5
497 .4
478 .0
536 . 9(431)
(426)
(454)
(307)678 .2
996 . 0(431)
(459)
Working-age onl y
Pension-age only
B. Mean pay received frommain job10(thous. rubles, working-age only)
506 .1
618 .0
562 .4
654 .3
689,6
1042 . 2
(257)
(246)
(309)
(178)
(346)
(368 )
370 .4
332 .5
298 .7
374 .2
631 .6
807 . 4
(173)
(180)
(145)
(128)
(85)
(90 )
492 .7
528 .0
329 .3
380 .0
493 .4
538 .5
326 .4
622. 4(500)
(3079)
(266)
(223)
(209)
(120)
(260)
(315 )
C. Ratio of Russian toindigenous :
Mean personal income - 110 .2 112 .3 146 . 9total population
Mean personal income - 122 .1 116.3 151 . 1working-age only
Mean personal income - 89 .8 125 .3 127 . 8pension-age only
Mean pay from main job - 107 .2 115 .4 109 .1 190 . 7working-age only
9 Total personal income for previous 30 days .10 Total pay received for previous 30 days from main job . Respondents who were working but did not receive a pa yenvelope were coded as "0" .
Sources :
Russian Federation : Russian Longitudinal Monitoring Survey, 199 6Republics : Ethnonationalism and Democratization Survey, 1997/9 8
2 2

Table 6a. Tatarstan : Employment Status, Dislocation and Wages (Working Age Only)
A .
B.
C .
D .
E.
Govt. own
New ec.
Cut hours/ Unempl
Wage sUnpaid leave
1 . Nationality onl yRussian
- .38* .43** .49** .08 45 . 5
R2/Pseudo R2
.01 .01 .02 .00 .0 0
2 . Full model
- .52* .16 .43* .09 -
2 . 1Russian
Rural .34 - .20 - .28 -
.80** - 67 . 2
Female .57* -
.03 .36 .08 - 39 . 3
Educatio nSecondary -1 .34* .75 - .15 -
.89*** 141 .3 *
Higher - .79 .67 - .88* .92* 320 .1** *
Age .07 - .09 .06 -
.15 38 . 9
Immigrated torepublic - .19 - .14 .88** .31 - 28 . 2
Cpsu mbr - .64 .88* .15 -
.72 27 . 7
Work in :New ec .
164 .9* *
Ind/constr . .50 1 .31 * ** .10 -140 . 4
Agriculture 1 .47** - .89 - .07 -270 .8** *
Humanities/svc 1 .31** -1 .11** - .61* - 99. 6
Trade -
.87 .89* -.21 -295 .7***
Intercept 2 .63** -2.79** - .18 -2 .52*** 601 .7** *
1 .32 *
Adj ./pseudo R2 .17 .22 .11 .05 .0 9
516 516 427 704 434NColumns :
others .A . Logistic regression estimates . Dependent variable-1 if workplace owned by government : 0 if owned by
regression estimates .B . Logistic Dependent variable-1 if R worked in a private or foreign
enterprise/organization, 0 if R worked elsewhere .C. Ordinal logit estimates . Dependent variable=1 if R experienced both a cut in hours/pay and unpaid leave i n
past 2 years ; .5 if r experienced one of these ; and 0 if neither .
D. Logistic regression estimates . Dependent variable=1 if R reported being unemployed; 0 otherwise .
E. OLS estimates on pay for previous 30 days, in thousands of rubles . People who did not receive a
Pay envelope are counted as "0" .
* * * significant at p< .0 1* * significant at p .0 5* significant at p <.1 0
Source : Ethnonationalism and Democratization Survey, 1997/98
2 3
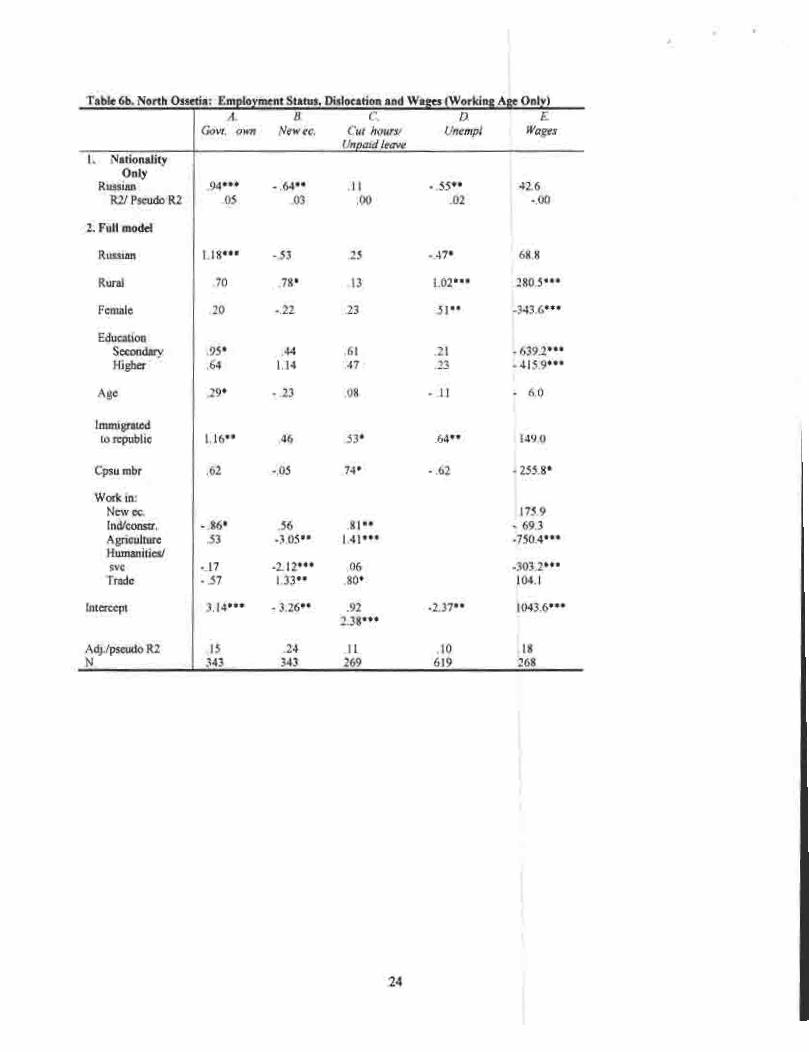
Table 6b. North Ossetia : Employment Status, Dislocation and Wages (Working Age Only)A .
B.
C.
D.
E.Govt. own
New ec. Cut hours/ Unempl!
WagesUnpaid leave
1 .
NationalityOnl y
Russian .94*** - .64** .11 - .55** 42 . 6R2/ Pseudo R2 .05 .03 .00 .02 -00
2. Full model
Russian 1 .18*** - .53 .25 - .47* 68 . 8
Rural .70 .78* .13 1 .02*** 280 .5** *
Female .20 - .22 .23 .51** -343 .G** *
EducationSecondary .95* .44 .619 21 - 639 .2** *Higher .64 1 .14 .47 .23 - 415 .9** *
Age .29* - .23 .08 - .11 -
6 . 0
Immigratedto republic 1 .16** .46 .53* .64** 149 . 0
Cpsu mbr .62 - .05 .74* - .62 - 255 .8 *
Work in :New ec. 175 . 9Ind/constr. - .86* .56 .81** - 69 . 3Agriculture .53 -3 .05** 1 .41*** -750 .4** *Humanities/svc - .17 -2 .12*** .06 -303 .2** *Trade - .57 1 .33** .80* 104 . 1
Intercept 3 .14*** -3 .26** .92 -2 .37** 1043 .6** *2 .38** *
Adj ./pseudo R2 .15 .24 .11 .10 .1 8N 343 343 269 619 268
2 4

Table 6c. Sakha : Employment Status, Dislocation and Wages (Working Age Only)
A .
B.
C.
D.
E.
Govt . own
New ec.
Cut hours/ Unempl Wages
Unpaid leave
1 . Nationality only
Russian - .34* .48** .92*** .08 259 .9** *
Pseudo R2 .01 .02 .06 .00 .0 1
2 . Full model
- .27 .60* .19 .20 55 . 1Russian
Rural .55 .24 - .43* .63** -314 .0* *
Female .14 - .59** - .39* - .01 -117 . 9
EducationSecondary .05 .49 - .10 - .29 144 . 5
Higher .07 1 .23** - .70* - .48 692 .8** *
Age .11 .20* .11 - . 53** 6 . 0
Immigrated to .1 9
republic .19 .48 .62** 69 .9
Cpsu mbr .31 - .55 - .22 - .22 -303 . 2
Work in :25 .2New cc .
Ind/constr . - .18 .95 *** .46* - 86 .6
Agriculture - .95** .46 .13 -257 . 5
Humanities/svc .83* -1 .39*** - .14 - 79 . 4
Trade - .73* .47 - .42 36 . 2
Intercept 2 .38** -1 .10 -1 .22* -5 .71*** 492 . 4
.5 0
Adj ./pseudo R2 .09 .17 .13 .08 .0 6
N 546 546 511 772 511
2 5
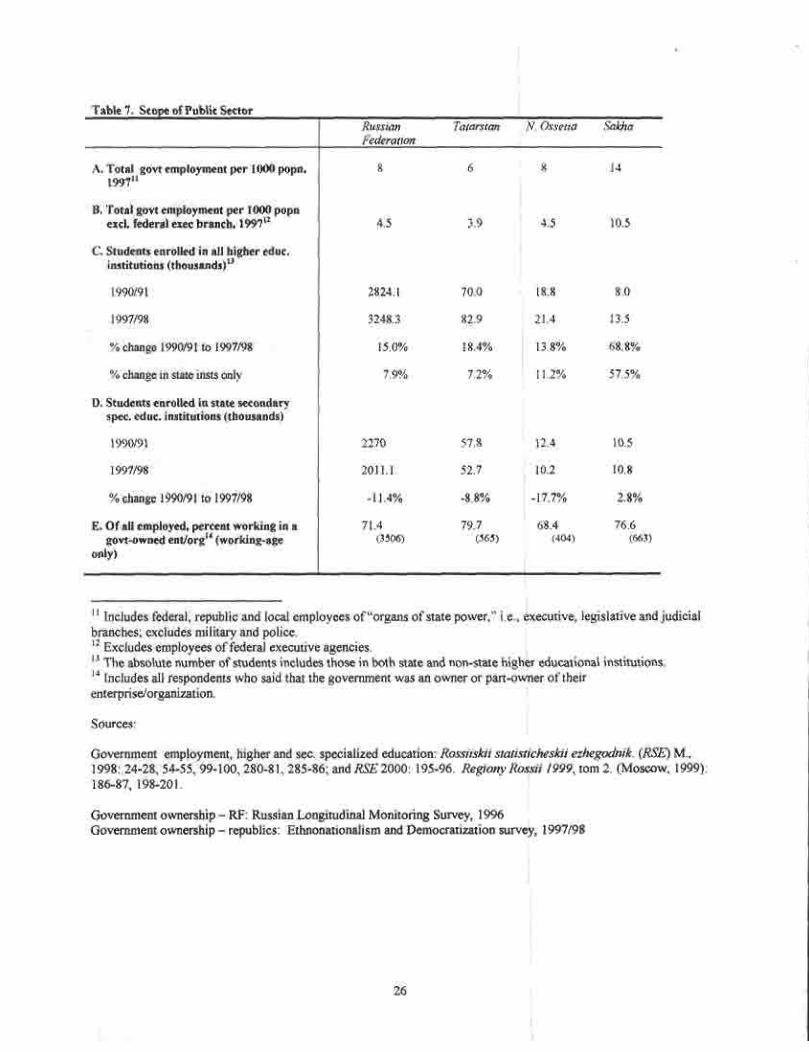
Table 7 . Scope of Public Sector
RussianFederation
Tatarstan N. Ossetia Sakh a
A. Total govt employment per 1000 popn, 8 6 8 1 41997"
B . Total govt employment per 1000 pop nexcl . federal exec branch, 1997" 4 .5 3 .9 4 .5 10 . 5
C. Students enrolled in all higher educ .institutions (thousands)'
1990/91 2824 .1 70 .0 18 .8 8 .0
1997/98 3248 .3 82 .9 21 .4 13 . 5
% change 1990/91 to 1997/98 15 .0% 18 .4% 13 .8% 68 .8 %
% change in state insts only 7 .9% 7 .2% 11 .2% 57 .5 %
D. Students enrolled in state secondaryspec . educ. institutions (thousands )
1990/91 2270 57 .8 12 .4 10 . 5
1997/98 2011 .1 52 .7 10 .2 10. 8
% change 1990/91 to 1997/98 -11 .4% -8 .8% -17 .7% 2 .8 %
E . Of all employed, percent working in a 71 .4 79 .7 68 .4 76 . 6govt-owned ent/org14 (working-age (3506) (565) (404) (663 )
only)
11 Includes federal, republic and local employees of "organs of state power," i.e., executive, legislative and judicialbranches; excludes military and police .
12 Excludes employees of federal executive agencies .13 The absolute number of students includes those in both state and non-state higher educational institutions .
14 Includes all respondents who said that the government was an owner or part-owner of thei renterprise/organization .
Sources :
Government employment, higher and sec . specialized education : Rossiiskii statisticheskii ezhegodnik. (RSE) M .,1998: 24-28, 54-55, 99-100, 280-81, 285-86 ; and RSE 2000: 195-96 . Regiony Rossii 1999, tom 2 . (Moscow, 1999) :186-87, 198-201 .
Government ownership - RF : Russian Longitudinal Monitoring Survey, 199 6Government ownership - republics : Ethnonationalism and Democratization survey, 1997/9 8
2 6
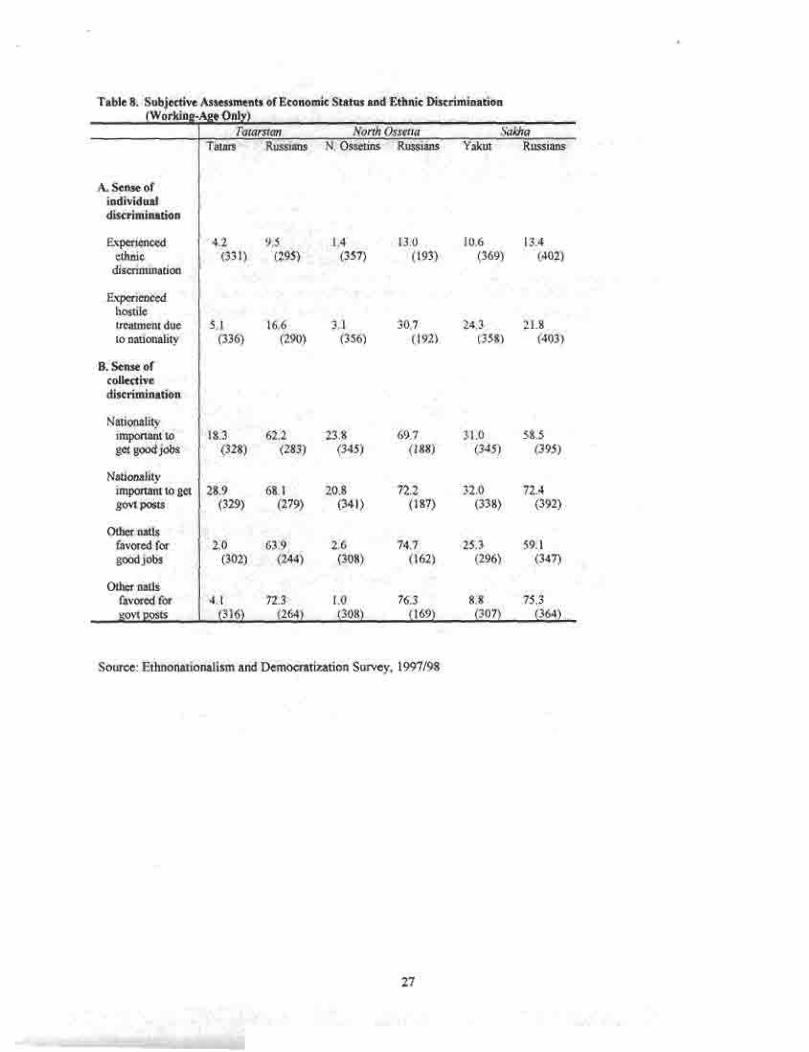
Table 8 . Subjective Assessments of Economic Status and Ethnic Discriminatio n (Working-Age Only)
Tatarstan NorthOssetia .SakhaTatars
Russians N.Ossetins Russians
Yakut
Russians
A . Sense ofindividualdiscriminatio n
Experiencedethni c
discriminatio n
Experiencedhostil etreatment du eto nationality
B. Sense ofcollectivediscriminatio n
Nationalityimportant toget good job s
Nationalit yimportant to getgovt posts
Other natlsfavored forgood job s
Other natlsfavored forgovt posts
4 .2
9 .5
1 .4
13 .0
10 .6
13 . 4
(331)
(295)
(357)
(193)
(369)
(402 )
5 .1
16 .6
3 .1
30 .7
24 .3
21 . 8(336)
(290)
(356)
(192)
(358)
(403 )
18.3
62 .2
23 .8
69 .7
31 .0
58. 5(328)
(283)
(345)
(188)
(345)
(395 )
28 .9
68 .1
20 .8
72 .2
32 .0
72. 4(329) (279)
(341)
(187)
(338)
(392 )
2 .0
63 .9
2 .6
74 .7
25 .3
59 . 1
(302)
(244)
(308)
(162)
(296)
(347 )
4 .1
72 .3
1 .0
76 .3
8 .8
75 . 3 (316) (264) (308) (169) (307) (364)
Source : Ethnonationalism and Democratization Survey, 1997/9 8
2 7
Appendix 1 . Survey data
A. Design and implementation of surveys in Tatarstan, North Ossetia and Sakh a
The surveys analyzed here were fielded by Paragon Research International (under the direction o fMichael Swafford) and Polina Kozyreva and Mikhail Kosolapov of Demoscope in Moscow .Questionnaires were written in Russian, translated and blind-back-translated in each of the three titula r
languages . Questionnaires were pretested in each republic before being finalized .The sample design was developed with two goals in mind : to compare responses of the titular
nationality and local Russian residents, and to allow inferences about the entire adult population . SinceRussians and titular groups were not evenly distributed within each region, the design included aprobability sample with a target of 1000 respondents in each republic (including respondents of othe rnationalities), and an oversample in each case for the underrepresented group, to insure roughly equa lnumbers of indigenous and Russian residents .
The sample was stratified first by urban-rural units within each republic . (Some remote parts o fSakha were excluded due to very low population density and inaccessibility by public transport .) Urbanareas were then stratified further by population size, the largest cities were chosen with certainty, andsample selection for smaller cities was based on probability proportional to size (PPS) . Cities were thensubdivided into districts, and districts were selected at random for inclusion in the sample . Within eachdistrict, field staff compiled a list of all dwellings and then chose dwellings for inclusion systematicallystarting with a random number . Within each dwelling, a respondent was chosen based on the Kishprocedure. Rural areas were selected for inclusion from the regions that had been randomly selected instage two . Within each one thus selected, villages were further stratified by ethnic composition (so tha tinterviewers with the appropriate language fluency could be assigned to each village), and then those wit hat least 100 inhabitants were ordered by size and selected by PPS . Within each village selected,households were selected systematically from residence registration books, and within each household, arespondent was selected using the Kish procedure ,
Interviewers made up to three attempts to contact respondents . Interviews were conducted face -to-face, in respondents' homes . Response rates were 87 percent in Tatarstan, 91 percent in North Ossetia ,and 84 percent in Sakha. Respondents in all but a few cases were interviewed by same-nationalityinterviewers, and were given the option of using the titular language or Russian for the interview . Tenpercent of the cases were checked ex-post, to insure that sampling and interview procedures had bee nfollowed correctly .
B. The Russian Longitudinal Monitoring Surve y
RLMS is an ongoing survey under the direction of the Carolina Population Center, first fielded i n1992 . 1t focuses on the economic and social consequences of the transition for the Russian Federation .The data used here are from Round VII, fielded in the fall of 1996 by Paragon Research International an dDemoscope. Respondents were drawn by a multistage probability sample, stratified by geographica lfactors, level of urbanization, and ethnicity . The sample included 38 primary sampling units (psu's), 3 2in Russian regions, 5 in republics (the Komi, Chuvash, Tatar, Kabardino-Balkar, and Udmurt republics) ,and one in the Khanty-Mansiisk A .O. (Data from Tatarstan are excluded from the analysis here .) Thesampling unit was the household, and interviews were conducted face-to-face with all adult member sexcept those temporarily living away from home . All interviews were in Russian. For information onsurvey design and sampling, see the CPC website at www.cpc.unc.edu/projects/rlms/rlmshome/html .
2 8
Appendix 2 . Questionnaire items and variables used in the analysis
A. Republic questionnair e
1 . Type of ownership at workplace : Respondents with a job in the previous 30 days were asked fou rquestions about ownership :
a. Is the government an owner or co-owner of your enterprise or organization? [yes; no ]b. Is any foreign firm or foreign private entity an owner or co-owner of your ent/org ?[yes ; no]c. Are you personally an owner or co-owner of the ent/org in which you work? [yes ; no ]d. Is any other Russian private entity, group of enterprises, private firm or bank an owneror co-owner of your ent/org? [yes; no]
2 . Employment status : Please look at this card and tell me what you mostly did in the past 3 0days . . . .
a. Worked for hire permanently or temporaril yb. Engaged in private enterprise (trade, business, farming )c. Was on maternity or medical leaved. Was on unpaid leavee. Was on pension and did not wor kf. Was a full-time student and did not wor kg. Temporarily unemploye dh. Other
3 . Work in organization or individually : Working respondents were asked,
At that job, are you working in an enterprise or organization [1], orAre you working individually [2] ?
4 . Workplace disruption : Working respondents were asked,
Have you encountered such things as at that job in the past 2 years . . . .
Involuntary cut in pay or hours? [yes ; no]
Involuntary unpaid leave? [yes ; no ]
At present, have you received all the money you were supposed to receive for that job, o rnot? [yes; no ]
5 . Personal income : Please try to remember your personal money income over the past 30 days .Include everything — wages, bonuses, profits, pay from odd jobs, pensions, stipends, materia lassistance, incidental earnings, and other monetary receipts, including those in valiuta — bu ttranslate the valiuta into rubles .
rubles
6 . Wages : Respondents who were paid at work during the past 30 days were asked :
29

How much in all did you receive for that work in the past 30 days, after taxes ?
ruble s
Those who worked but did not receive any pay were assigned a "0" .
7 . Nationality : What is your nationality?
8 . Education : Tell me, please, what is your education? [CARD ]
a. No education, illiterat eb. Primaryc. Incomplete secondaryd. Secondarye. Secondary specializedf. Incomplete higherg. Higherh. Advanced degre ei. Other
9 . CPSU membership : Earlier many people joined the CPSU . Were you a member or candidat emember of the CPSU?
MemberCandidateNeither
Recoded so that 1=member : 0=candidate or non-member .
10 . Economic branch : Working respondents were asked :
Where — in what enterprise or organization are you working? We are not interested in th ename. Please tell us what that enterprise/organization does, such as a factory, school ,farm or a grocery store .
11, Ethnic hostility : Have you personally encountered hostility in everyday life in this republic du eto your nationality . . .
In open formNot openly, but you felt itHave not encountered hostility
3 0

12 . Collective discrimination :
A. Do you think that a person's nationality in this republic affects his chances to get th ebest jobs?
Ye sNo
B. Which nationality has more opportunities to get the best jobs in this republic ?
C. Do you think that a person's nationality in this republic affects his chances to hold ahigh government post ?
Ye sNo
D. Which nationality has more opportunities to get a high government post in thi srepublic ?
B. . Russian Longitudinal Monitoring Survey
1 . Type of ownership at workplace : Respondents with a job in the previous 30 days were asked fou rquestions about ownership :
a. Is the government an owner or co-owner of your enterprise or organization? [yes ; no]b. Are any foreign firms or foreign private entities owners or co-owners of your ent/org?[yes; no ]c. Are any Russian private entities, groups of enterprises, or private firms owners or co -owner of your ent/org? [yes ; no ]d. Are you personally an owner or co-owner of the ent/org in which you work? [yes ; no]
2 . Employment status : Please look at this card and tell me what you mostly did in the past 3 0days . . . .
a. student in secondary school or PTUb. fulltime student in a higher educational inst . or tekhnikumc. not working due to health reasons; invalidd. nonworking pensionere. on paid maternity leav ef. on maternity leave with guaranteed return to jobg. housewife; caring for other family members, childrenh. temporarily unemployed for other reasons and looking for worki. temporarily unemployed for other reasons and not looking for wor k
3 1
j. Private farmer [fermer]k. Entrepreneur1 . Working in an enterprise/organizatio nm. Working, but not in an enterprise/organizatio ni . Other
For Table 4, this was recoded so employed=e,f,j,k,I,m ; and unemployed=h,i .
3. Work in organization or individually : Working respondents were asked ,
At that job, are you working in an enterprise or organization [1], orAre you working individually [2] ?
4. Workplace disruption : At present does your enterprise owe you any money, which for som ereason you have not received on time? [yes ; no ]
5. Pay : How much money did you receive from your main place of work in the last 30 days, afte rtaxes? If you received some or all of it in valiuta, please translate that into rubles and give me thetotal sum .
rubles
3 2
Notes
Data for this study were collected with support from the National Science Foundation (SBR 9601417 and OP P0082781) and the National Council for Eurasian and East European Research . Thanks are due to the Institute forEuropean, Russian and Eurasian Studies of The George Washington University, and the staff of the Europea nReading Room of the Library of Congress for their research support .
The term is from Michael Hechter, "Group Formation and the Cultural Division of Labor," American Journal ofSociology 84, 2, 1978, pp . 293-318 .
2Julian Birch notes, for example, that North Ossetia has relied heavily on aid from Moscow to cope with refugee sfrom the South, and on political support from Moscow in the ongoing battle with Ingushetia . See "Ossetiya – Landof Uncertain Frontiers and Manipulative Elites," Central Asian Survey 18, 4, 1999, pp. 501-34 .
3Branko Milanovic, Income, Inequality and Poverty During the Transition from Planned to Market Economy(Washington, D .C . : World Bank, 1999), p . 197 ; European Bank for Reconstruction and Development . TransitionReport 2000: Employment, Skills and Transition (London, EBRD, 2000), p. 65 .
4 Ibid .
'Reported unemployment rates are from Regiony Rossii : Statisticheskii sbornik 1998, tom 2 (Moscow, Goskomstat,1998), p . 89 ; and Regiony Rossii : Statisticheskii sbornik 1999, tom 2 (Moscow, Goskomstat, 1999), p . 97 . Thesevolumes give slightly different figures for the same year, but the differences are extremely small .
6Milanovic, Income, Inequality and Poverty, p . 41 .
7Regiony Rossii: Statisticheskii sbornik 1999, tom 2, p . 134 . The EBRD reports a poverty level for 2000 of 3 5percent . Transition Report 2000, p. 204 .
8Jeanine D . Braithwaite, "The Old and New Poor in Russia , " in Jeni Klugman, ed ., Poverty in Russia: Public Policyand Private Responses (Washington, D.C ., World Bank, 1997), pp . 29-64; Michael Lokshin and Barry Popkin, "Th eEmerging Underclass in the Russian Federation : Income Dynamics, 1992-1996," Economic Development andCultural Change, 47, 1999, pp . 803-829.
9 The twelve republics with poverty levels of 30 percent or more in 1997 (and the total percentage of the populatio nbelow the poverty line) included Ingushetia (76 .9), Tyva (62 .4), Dagestan (53 .9), Mari-El (52 .1), Kalmykia (46) ,Buryatia (44 .3), Karachaevo-Cherkessk (41), Adygeia (40 .2), Kabardino-Balkharia (39 .8), Altai republic (39 .2),Mordovia (38 .6), and North Ossetia (33 .9) . Seven of these are in the North Caucasus . (No data are available forChechnya.) The nine Russian regions with poverty levels of 30+ were : Chita oblast (61 .2), Altai krai (45 .7),Kurgan oblast (42 .6), Novosibirsk oblast (39 .3), Penza oblast (38), Stavropol' krai (34 .8), Sakhalin oblast (32 .8),Saratov oblast (32.1), and Kirov oblast (30 .8) . See Regiony Rossii. Statisticheskii sbornik, tom . 2, 1999, pp . 134-35 .
101 am using the terms "titular" and "indigenous " interchangeably, to avoid repeating the same term. Note thoughthat there is some controversy on the question of who should be counted as "indigenous, " since many local Russians– and other nationalities – have long-established roots in each region .
A . B . Dzadziev, "Otraslevoi sostav zaniatogo naseleniia Severnoi Osetii (1959-1989 gg.)," in Voprosy sotsiologi iSevernoi Osetii (Vladikavkaz., 1993), p . 45 ; and L . K . Gostieva and A . B . Dzadziev, "Ocherki ob etnopolitichesko isituatsii" in Severnaia Osetia: etnopoliticheskie protsessy 1990-1994. Ocherki . Dokumenty. Khronika. Tom 1(Moscow, Institut etnologii i antropologii, 1995), pp . 14-76 . Dzadziev and Gostieva calculated representation acros seconomic branches from 1989 census data, by taking the proportion of a nationality group employed in a give nbranch and dividing it by the proportion of all employed in that branch within the republic .
3 3
12Viktoria Koroteeva, Ekonomicheskie interesy i natsionalizm (Moscow, Rossiiskii gosudarstvennyi gumanitarny iuniversitet, 2000), p . 151 . Roza Musina provides additional data in "The Problems of Sovereignty and Interethni cRelations in the Republic of Tatarstan," in Marjorie Mandelstam Balzer, ed ., Culture Incarnate : NativeAnthropology from Russia (Armonk, N.Y., M. E. Sharpe, 1995), pp . 113-22 .
13 V . B . Ignat'eva, "Promyshlennoe osvoenie Yakutii i ego vliianie na sotsial'noe razvitie korennykh narodov," i nNatsional'naia politika v region . Po materialam Respubliki Sakha (Yakutia) (Yakutsk, Yakutskii nauchnyi tsent rSibirskogo otdeleniia RAN, 1993), p . 46 ; and V . B. Ignat'eva, Natsional'nyi sostav naseleniia Yakutii (Yakutsk ,Yakutskii nauchnyi tsentr Sibirskogo otdeleniia RAN, 1994), p . 99 . Ignat'eva's data are calculated in the same wa yas those by Dzadziev and Gostieva .
14 Michael Hechter, "Nationalism as Group Solidarity," Ethnic and Racial Studies, 10, 4, October 1987, pp . 415-26 ;see also, Ronald Rogowski, in Edward Tiryakian and Ronald Rogowski, eds . New Nationalisms of the DevelopedWest .' Toward Explanation (Boston, Allen and Unwin, 1985) .
15Rogers Brubaker, Nationalism Reframed: Nationhood and the National Question in the New Europe (Cambridge ,Cambridge University Press, 1996) .
16 Milton Esman, "Ethnic Politics and Economic Power," Comparative Politics . 19, 1987, pp . 295 - 318 .
17Esman, "Ethnic Politics . "
18 Daniel Shapiro and Morton Stelcner, "Language and Earnings in Quebec . Trends over Twenty Years, 1970-1990," Canadian Public Policy - Analyse de Politiques, 23, 2, 1997, pp . 115-40 .
'19Hugh McRoberts, "Language and Mobility : A Comparison of Three Groups," in Monica Boyd et al ., eds.Ascription and Achievement : Studies in Mobility and Status Attainment in Canada (Ottawa, Carleton Universit yPress, 1985), pp . 335-56 ; Christopher Taucar, Canadian Federalism and Quebec Sovereignty (New York, PeterLang, 2000) ; Richard Wanner, "Expansion and Ascription : Trends in Educational Opportunity in Canada, 1920 -1994," The Canadian Review of Sociology and Anthropology, 36, 1999, pp . 409-42
20Esman, "Ethnic Politics . "
21 Goh Ban Lee, "Restructuring Society in Malaysia : Its Impact on Employment and Investment," in S .W. R . de ASamarasinghe and Reed Coughlan, editors, Economic Dimensions of Ethnic Conflict (London, Pinter, 1991), pp . 74-95 .
22 Charles Hirschman, "Political Independence and Educational Opportunity in Peninsular Malaysia," Sociology ofEducation, 52, 1979, pp. 67-83; Su-ling Pong, "Preferential Policies and Secondary School Attainment in Peninsula rMalaysia," Sociology of Education, 66, 1993, pp . 245-61 .
23Lee, "Restructuring Society," pp . 80-93 ;
24Leslie Laczko, "Language, Region, Race, Gender and Income : Perceptions of Inequalities in Quebec and Englis hCanada, " in Alan Frizzell and Jon Pammett, eds. Social Inequality in Canada (Ottawa, Carleton University Press,1996), pp . 107-26 .
25 Lee, "Restructuring Society," pp . 91-2 .
26Darrell Slider, "Privatization in Russia's Regions " Post-Soviet Affairs, 10, 1994, pp . 367-96 .
27 Marjorie Mandelstam Balzer, "Homelands, Leadership and Self Rule : Observations on Interethnic Relations in theSakha Republic," Polar Geography, 19, 1995, pp . 284-305; Marjorie Mandelstam Balzer and Uliana Alekseevn aVinokurova, "Nationalism, Interethnic Relations and Federalism : the Case of the Sakha Republic, " Europe-AsiaStudies, 48, 1, 1996, pp . 101-20; Oleg Morozov, "Tatarstanskaia model' sotsial 'no-ekonomicheskikh reform," i n
34
Ekonomicheskie reformy v regionakh Rossiiskoi Federatsii : Opyt i perspektivy (Moscow, Institut sovremenno ipolitiki, 1998), pp . 85-95; Katherine Graney, "Institutionalizing National Communities in Post-Soviet Russia : Th ePolitics of State Symbols, Public Space, and Culture in Tatarstan and Bashkortostan," American Political Scienc eAssociation annual meeting, 1998 .
28The strategy is outlined in Perspektivy razvitiia regionov Rossii : Formula Tatarstana, (Kazan, Tsent rekonomicheskikh i sotsial 'nykh issledovanii pri Kabinete Ministrov RT, 2001) .
29 Vremya i den'gi (Kazan') 22 June 2000, p . 2 .
30The speaker of the republic parliament, Farid Mukhametshin, noted in a speech to the World Congress of Tatars i n1999 that the republic had avoided the worst fallout of the 1998 financial crisis by retaining golden stakes i nenterprises and excluding non-local banks from setting up shop in the republic . (Author's notes, Kazan', Jun e1999) .
31 Koroteeva, Ekonomicheskie interesy, p . 118 .
32Birch, "Ossetiya . " Note that the expulsion of the Ingush created the opportunity to resettle southern refugees i nabandoned areas.
33Nezavisimaia gazeta, 8 July 1992, p . 3 . North Ossetia has also faced substantial problems with alcohol smugglin gfrom the South. (Raw alcohol is trucked in for processing and bottling in North Ossetia .) One estimate suggestedthat bootleggers smuggled in some $600 million in raw alcohol during 1996 . See Obshchaia gazeta, 31 July- 6
August 1997, p . 2 .
34NNote,, though, that the pattern of political indigenization has varied across the republics as a whole . In some, theindigenous nationality actually lost ground in legislative elections. See Robert Kaiser, "Political Indigenization an dHomeland-Making in Russia's Republics, " Report to the National Council for Eurasian and East Europea nResearch, March, 2000 .
35The Tatar share was roughly the same as of 2000 (95 out of 130 seats), according to Lilia Sagitova ,"Neravenstvo," unpublished ms ., (Kazan', Institut Istorii AN RT, 2001) . By unofficial accounts, the Tatar share ofthe population by then was slightly over 50 percent . Earlier data on public office are more difficult to locate ; butone source suggests that the Tatar share of party and government posts had been closer to half just before the onse tof perestroika . See K. S . Idiatullina, Regional 'noe politicheskoe liderstvo v Rossii: Put' evoliutsii (Kazan', Karpol ,1997) .
36For example, Tatars outnumbered Russians by a factor of two or three to one in councils of the four largest citiesin the mid-1990s – including predominantly Russian cities such as Kazan and Naberezhnye Chelny . See Tatarstan :Osnovy politicheskogo ustroistva i kratkaia kharakteristika ekonomiki (Moscow, Panorama, 1996) . (Thisbreakdown by nationality is based on coding of Tatar and Russian names . )
37 1 could not find published information on how the ethnic makeup of the republic population changed, bu tunofficial data suggest that Russians had dropped from 30 percent in 1989 to 26 percent by 2000 .
I .E. Spiridonova, "Aktual'nye problemy etnokul'turnogo vzaimodeistvia v RS (Ya) : 90-e gody XX veka, " in V.N . Ivanov, ed ., Etnosotsial'noe razvitie respubliki Sakha (Yakutia) (Novosibirsk, Nauka, 2000), p. 204 .Spiridonova puts the Yakut share of the population at 40 percent as of 1996. Another source gives the proportion sfor 1994 as 39 .6 percent Yakut and 45 .5 percent Russian . See Respublika Sakha v tsifrakh. Kratkii statisticheskiisbornik (Yakutsk, Goskomstat RS, 1998), p. 12.
39 Explanations for political indigenization vary . Robert Kaiser, in "Political Indigenization," suggests that it may b ethe product of network and clan politics, and these predictably lead to greater representation for the indigenousnationalities . John Loewenhardt highlights more overt efforts to control public office by manipulating electoralreturns, in "The 1996 Presidential Elections in Tatarstan," Journal of Communist Studies and Transition Politic s
3 5
13, 1, March, 1997, pp . 132-44 ; and "The Village Votes : The December 1999 Elections in Tatarstan's Pestrets yDistrict," Journal of Communist Studies and Transition Politics 16, 3, September, 2000, pp . 113-22 .
40Sagitova, "Neravenstvo," and "Osobennosti rynochnoj ekonomiki v RT," Zvezdapovolzh'ia (Kazan'), 14 Jun e2000, p . 3 .
41"Tendentsii etnosotial'nogo razvitia Sakha i Russkikh," in Ivanov, Etnosotsial'noe razvitie Respubliki Sakh a(Yakutiia), pp . 135-62 .
42 Koroteeva, Ekonomicheskie interesy .
43 I conducted interviews with public officials, journalists, scholars and others in Tatarstan, each year from 1997 t o2001 and in Sakha in 1997 and 1999-2001 . Travel to North Ossetia was ruled out due to the continuing violenc ethere.
44 To facilitate comparisons, both the republic survey data and the RLMS are weighted here .
45 Only working-age respondents are included in the analysis, however .
46In 1997, for example, the capital city, Yakutsk, had the second highest cost-of-living in the country (lower onl ythan the capital of Chukotka) . RFE/RL Newsline, 25 August 1997, cited in Eastview Publications Universa lDatabase of Russian Newspapers.
47 The RLMS also included a question on unpaid leaves in the past year (the data were not included in Table 4because the corresponding question for the republics focused on the previous 2 years) . Among non-Russians, 8 . 9percent had been sent on unpaid leave; among Russians, 7 .6 percent .
48Ian McAllister and Stephen White, "The Legacy of the Nomenklatura : Economic Privilege in PostcommunistRussia," Coexistence, 32, 1995, pp. 217-39 .
49Note that these are not mutually exclusive, since some firms may have a mix of private and governmen townership .
50 The one exception is in North Ossetia, where Russians were significantly more likely to work in government -owned organizations . This may be related to other facets of the CDL not captured in the data here – greater Russia nconcentration in defense production and in military/police units .
51The 1997/98 data are from the republic surveys ; the 1989 data, from Dzadziev, "Otraslevoi sostav" ; Gostieva andDzadziev, "Ocherki" ; Ignat'eva, "Promyshlennoe osvoenie" and "Natsional'nyi sostav" ; and Koroteeva,Ekonomicheskie interesy .
52 The Russian regional statistical handbook lists the percentage of workers employed in "state-owned" or "mixed -ownership" workplaces as 58 .4 percent for the Russian Federation in 1997, and 73 .5 for Tatarstan, 71 .0 for NorthOssetia, and 74 .8 for Sakha. See Regiony Rossii. Statisticheskii Sbornik 1999 , tom 2, pp . 86-87 .
53A statistical handbook for Sakha lists fewer employees, but it appears to include only federal and republic-leve lgovernment workers and to exclude local government personnel . Respublika Sakha (Yakutia) za gody suvereniteta(1990-2000 gg) (Yakutsk, Goskomstat RS, 2000), p . 10 .
54RSE 2000, pp . 19-21, 26-27 .
55 Spiridonova reports that the share of students of Sakha nationality in higher education was actually lower by theend of the 1990s than it had been in 1989, due to the opening of filiali in predominantly Russian areas such a sMirnyi and Neriungri . See "Aktual'nye problemy," p . 204 .
36

56Sakha ranked higher when it came to the proportion of adults with higher education, since many people simpl ywent to universities or institutes outside the republic .
57 See Balzer and Vinokurova's account of such incidents in "Nationalism, Interethnic Relations and Federalism, "pp . 108-111 .
58And by some accounts, outmigration from Sakha was higher among other nationalities of the former Soviet Union ,many of whom returned home to newly independent countries to claim citizenship .
59 Ekonomicheskie interesy, pp . 165-67 .
60Mikk Titma, Nancy Brandon Tuma and Brian D . Silver, "Winners and Losers in the Postcommunist Transition :New Evidence from Estonia," Post-Soviet Affairs, 12, 2, 1998, pp . 114-36 . Aadne Aasland and Tone Flotten fin dsimilar evidence of economic differentiation in their surveys of Estonia and Latvia . Slays were more likely to beunemployed or out of the labor force (net of age, gender, education and rural residence) . "Ethnicity and Socia lExclusion in Estonia and Latvia," Europe-Asia Studies, 53, 7, 2001, pp. 1023-49 .
61 Esman, "Ethnic Politics . "
62 Lilia Sagitova, Etnichnost' v sovremennom Tatarstane (Kazan', Tatpoligraf, 1998) .
63 "Regional Separatism in Russia : Ethnic Mobilisation or Power Grab?" Europe-Asia Studies, 51, 1999, pp. 245 -74 .
3 7