Embed Size (px)
Citation preview

Estimation of Size-Specific Mortality Rates in Zooplankton Populations by Periodic SamplingAuthor(s): Michael LynchSource: Limnology and Oceanography, Vol. 28, No. 3 (May, 1983), pp. 533-545Published by: American Society of Limnology and OceanographyStable URL: http://www.jstor.org/stable/2835833 .
Accessed: 18/06/2014 13:12
Your use of the JSTOR archive indicates your acceptance of the Terms & Conditions of Use, available at .http://www.jstor.org/page/info/about/policies/terms.jsp
.JSTOR is a not-for-profit service that helps scholars, researchers, and students discover, use, and build upon a wide range ofcontent in a trusted digital archive. We use information technology and tools to increase productivity and facilitate new formsof scholarship. For more information about JSTOR, please contact [email protected].
.
American Society of Limnology and Oceanography is collaborating with JSTOR to digitize, preserve andextend access to Limnology and Oceanography.
http://www.jstor.org
This content downloaded from 194.29.185.145 on Wed, 18 Jun 2014 13:12:17 PMAll use subject to JSTOR Terms and Conditions
Limnol. Oceanogr., 28(3), 1983, 533-545 ? 1983, by the American Society of Limnology and Oceanography, Inc.
Estimation of size-specific mortality rates in zooplankton populations by periodic sampling'
Michael Lynch Department of Ecology, Ethology and Evolution, University of Illinois, Vivarium Building, Champaign 61820
Abstract Many populations of small, mobile organisms cannot be analyzed with standard demograph-
ic techniques. A method is introduced for estimating patterns of size-specific mortality for such species from periodic samples. The technique does not require that individuals be marked or recaptured and may be extended to age and other quantitative characters so long as the class distribution of the population and the rate of flux of individuals between classes can be accurately determined. The most serious difficulty in applying the technique seems to be the ability to sample adequately populations that are patchy in space. However, even if the problem of patchiness cannot be eliminated, so long as the size-frequency distribution can be accurately described, the technique generates the correct pattern of size-specific mor- tality and will provide minimum estimates of mortality for the different classes. Preliminary results presented for four species of planktonic cladocerans suggest that more widespread application of the technique may allow an empirical test of the assumptions on which zoo- plankton community theory is based.
Existing theory of zooplankton com- munity structure critically rests on as- sumptions relating the mortality patterns of natural zooplankton populations with body size. It is well known that verte- brate predators (fish and salamanders) se- lectively prey on large zooplankton and that invertebrate predators preferentially remove small species and instars (Hall et al. 1976). Since vertebrate predators are thought to effectively remove the large invertebrate predators, it is frequently suggested, either explicitly or implicitly, that herbivorous zooplankton living in the presence of vertebrates will be subject to more intense mortality as they become larger; the opposite pattern is expected in vertebrate-free environments (Allan 1974; Dodson 1974; Kerfoot 1975; Hall et al. 1976; Lynch 1977, 1979, 1980). These arguments are often invoked to explain species distributions, morphologies, and life histories, even though the size-spec- ificity of mortality in natural zooplankton
I The work was supported by the Department of Ecology, Ethology and Evolution, the University of Illinois Research Board, the Illinois Water Re- sources Center, NIH Biomedical Research Support Grant, and NSF grant DEB-7811773.
populations has never actually been mea- sured.
Actual size-dependent mortality pat- terns in zooplankton communities could be very different from theoretical expec- tations. In many environments vertebrate and invertebrate predators coexist. Non- predatory sources of mortality, such as starvation, disease, and physiological stress may also be important. Unless the relative importance of all of these sources of mortality is known, measuring the size- specificity of individual mortality sources, although valuable in itself, provides no information on the pattern of size-specific mortality from a zooplankter's perspec- tive.
Standard mark and recapture tech- niques cannot be easily applied to the zooplankton since most of them molt at regular intervals. Even were marking possible, zooplankton generally live in such large populations that enormous numbers of individuals would have to be labeled before an appreciable probability of recapture was attained. Furthermore, marking of small individuals may often alter their appearance or impair their be- havior in ways that could magnify their vulnerability.
Some models do exist that allow a par-
533
This content downloaded from 194.29.185.145 on Wed, 18 Jun 2014 13:12:17 PMAll use subject to JSTOR Terms and Conditions
534 Lynch
titioning of the mortality incurred by zoo- plankton populations without marking or recovering individuals, but these are ex- tremely restrictive either with respect to the number of classes dealt with (Argen- tesi et al. 1974; Seitz 1979; Taylor and Slatkin 1981) or to the population char- acteristics assumed (e.g. stationary size distribution, constant recruitment, ab- sence of prerecruitment mortality, uni- form distribution of individuals within classes) (Smith cited in Cooper 1965; Fa- ger 1973; Van Sickle 1977). I have de- veloped a more general technique that may be applied to any population for which the size structure and size-specific growth and reproductive rates can be pe- riodically and accurately assessed. Al- though it is expressed here primarily in the context of size-specific mortality, the model may be rederived in terms of any other characters (including age) so long as the flux rates of individuals into and out of classes can be predicted.
Many people helped collect and ana- lyze the data: C. Agger, L. Friel, R. Gib- son, P. Heinzen, T. Hoban, B. Lindberg, B. Monson, A. Morden, L. Mueller, M. Sandheinrich, M. Schaffer, L. Schmitt, D. Snyder, K. Spitze, R. Sterner, J. Vizek, and L. Weider. I also thank S. Portnoy for consultation on the variance derivations, and A. Ghent, R. Keen, and S. Portnoy for comments.
The theory A knowledge of the size-abundance
distribution and the size-specific growth and reproductive rates of a population al- lows one to predict the number of indi- viduals in a specific size class at some future date under the assumptions of no mortality in that size class,
x-1 Nx, = Nx,o + GixPix
w w
i-x+l i=l
[where No,n Nx t are densities (No.. m-2) of individuals in size class x at times 0 and t, G1, the expected number of indi- viduals in size class i at time 0 that would
grow into and remain in size class x over time period (O,t), Pi, the probability of individuals in Gi, surviving to enter size class x, G,,i the expected number of in- dividuals in size class x at time 0 growing into size class i over time period (O,t), Ri, the expected number of newborns derived from size class i and accumulat- ing in size class x over time period (O,t) (weighted by their probability of survival before entering size class x), and w the index for the last size class].
Let the expected size of an individual at time t (Bt) be described by the general growth function
Bt = g(Bo)
and designate the lower bound of size class x as Lx. Then the minimum size at time 0 necessary to enter size class x by time t is
MX = g-'(Lx). If we assume that all individuals of equal size behave homogeneously with respect to growth, all individuals with MX S Bo < Lx will reside in a size class -x at time t. The potential number of size classes which individuals may grow through dur- ing time (O,t) depends on the magnitude of t as well as on the width of the des- ignated size classes. Since the object is to estimate size-class-specific mortality rates, it is important that these parame- ters be set so that over (O,t) individuals go through a minimum number of size classes. For completeness in the follow- ing derivation, I allow for the possibility that some individuals may pass through one entire size class over (O,t). The fol- lowing boundary conditions then apply:
Gi, = 0 for i x x-3, GX,i = O for i x + 3,
GW,W+2 GW'W+l GW-1,W+1 Go,, GO,2 = O0
and w
ii., x = ? for x - 3.
The growth of individuals into and out of the size classes is estimated as follows. If MX Lx-1, then
This content downloaded from 194.29.185.145 on Wed, 18 Jun 2014 13:12:17 PMAll use subject to JSTOR Terms and Conditions
Estimating size-specific mortality 535
Gx-2,x= 0,
GX-1,X= Nx-,,0 IX-1,x
(where IX-_,x is the proportion of individuals in size class x - 1 for which Mx S Bo < Mx+,). If Mx < LX, then size class x receives recruits from the two smaller size classes:
GX-2,X = Nx2,0 'Ix-2,x
and
GX_1,X= NX-1,0(1 - Ix-1,x+1).
Depending on the degree of precision acceptable for determining the size- abundance distribution of the popula- tion, one can use different methods of es- timating the I values. If individuals are assigned to size classes without record- ing their precise sizes, one must assume a uniform distribution of individuals within each class. However, when pre- cise measurements of individuals are re- corded, the distribution of individuals within size classes can be determined, and more accurate estimates of the flux rates are possible.
The predicted flux of individuals be- tween size classes by growth provides a sufficient base for estimating instanta- neous size-specific mortality rates (mx) for x > 2. mx (day-') is determined by com- paring the actual density of individuals in a size class at time t with that predict- ed in the absence of mortality. (GX-2,X + GX-1 X) is actually the maximum expected influx of individuals into size class x when there is no mortality in size classes x - 2 and x - 1. Thus, so as not to inflate the mortality rate estimate for size class x, its potential recruits should be weighted by their probability of surviving to enter size class x as in Eq. 1; for instance, Gx-,,x should be reduced by an appropriate function involving mx- . Unfortunately, this exact approach is not possible; the mortality rates of the first two size classes cannot be determined until their expect- ed influx of newborns is known, which in turn requires a knowledge of the mortal- ity rates of adults. Thus, prerecruitment mortality between size classes has been ignored in previous attempts to partition
the death rate among classes (cf. a deri- vation by F. E. Smith cited in Cooper 1965).
This problem can be partially avoided by assuming that the recruits to any size class x are at time 0 sufficiently close to LX that their mortality rate is about equal to that of size class x. The validity of this assumption can be maximized by making the size class widths considerably greater than the expected growth increments, i.e. LX - MX < LX - LX-,. The instantaneous mortality rates for x - 3 are then approx- imated by
mx = {ln[Nx,o + (Gx-,,x + GX-2,X) x exp(-mx t/2) - (Gx,x+l + Gx,x+2)]
- ln[Nx,t1}/t, (2) which can be solved by Newton's meth- od or other suitable numerical tech- niques.
Once the mortality rates of adults have been determined, the rate of production of offspring can be derived. The total number of eggs from adults of size class x hatching during time (0,dt) is equal to the total number of eggs laid during time (-D, -D + dt) that survive to hatching, where D is the egg development time. For live bearers, such as cladocerans and rotifers,
bxNx,o dt = lx[Nx,o x exp(-rxD)] x exp(-mxD) dt (3)
[where bx is the instantaneous birth rate for size class x (day-'), lx the instanta- neous rate of egg laying by size class x (day-'), and rx = (In Nx,t - ln Nx 0)/t the size-class-specific growth rate (day-')].
Integrating Eq. 3 and assuming the pa- rameters defined above to be constant over (0,t), we find the expected produc- tion of newborns by size class x over (0,t) is
RX= lx x exp(-mxD) rt
x NX o0 x exp[-rx(D - T)] dr,
which simplifies to
RX= IxNx0 x exp[-(mx + rx)D] x [exp(rxt) - l]/rx. (4)
This content downloaded from 194.29.185.145 on Wed, 18 Jun 2014 13:12:17 PMAll use subject to JSTOR Terms and Conditions
536 Lynch
The instantaneous rate of egg laying, lx, can be expressed in terms of a more easily measured parameter, the mean clutch size for the size class, as follows. The total number of eggs and embryos attributable to size class x at time 0 is
Ex o= lx f NX x exp(mxr) dr.
Noting that IN,T = NX,o exp(rxr) and inte- grating, we find the egg ratio for size class x to be
-x x {1 - exp[-(mx + rx)D]} mx + rx
(5) Rearranging Eq. 5 and substituting for lx in Eq. 4 gives
R= Cx,oNX,o(mx + rx)[exp(rxt) - 1] rx{exp[(mx + rx)D] - 1}
Finally, when the sampling interval (O,t) is long enough for some individuals born during (O,t) to grow through the first size class, it is necessary to partition Rx into RX,1 and RX,2. This requires an esti- mate of the time, s, it takes a newborn of size B* to grow to size L2. The instanta- neous rate of growth for an individual of size Bo is
q(Bo) = {ln[g(BO)] - ln Bo}/t
so that
dtB* =q(B*) x B*.
Then rL21
B= B {ln[g(B )]-ln B *} dB
most forms of which can be solved by numerical integration techniques.
If s : t, then RX,2= 0,
and
RX,1 =Rx
if s < t, all juveniles born over the inter- val (0, t - s) will be in size class 2, so that
CX,ONx,O(mx + rx) R {exp[rx(t - s)] - 1}
rx{exp[(mx + rx)D] - 1}
and
RX,1 = Rx -Rx,2.
Note that RX 2 is not yet weighted by mor- tality incurred in the first size class.
Equations for the mortality rates of the first two size classes can now be derived, assuming that size classes 1 and 2 do not reproduce. For size class 1,
ml = {ln[Nj,O + ERxj - (G1,2 + G1,3)] x=3
- ln[Ni,t]}/t. For the second size class, if s : t,
M2= {ln[N2,0 + G1,2 x exp(-m1t/2) -(G2,3 + G2,4)] - ln[N2,t]}/t;
if s <t,
M2= (ln{N2,0 + [N1,o(1- 1,3) x exp(-m1s/2)] w
+ [exp(--m,s) YRX,2] x=3
- (G2,3 + G2,4)} - ln[N2,t])/t.
Applications with planktonic cladocerans
Size-specific mortality rates were esti- mated on several occasions for a popula- tion of Daphnia pulex in a temporary en- vironment, Busey Pond, Illinois, an old oxbow with a maximum width of 5 m and a maximum depth of 1.5 m. The patterns of size-specific mortality simultaneously falling on three smaller Cladocera (Bos- mina longirostris, Ceriodaphnia lacus- tris, and Diaphanosoma leuchtenber- gianum) were examined in Dynamite Lake, Illinois. This shallow (2-m max depth), dilute lake has a surface area of about 0.6 ha.
The application of the periodic sam- pling technique requires that the size- abundance distribution of a population be accurately determined. Routine sampling was by 16 evenly spaced vertical hauls from a 10- x 10-m sampling grid with a 63-,um Wisconsin net with a 13-cm mouth
This content downloaded from 194.29.185.145 on Wed, 18 Jun 2014 13:12:17 PMAll use subject to JSTOR Terms and Conditions
Estimating size-specific mortality 537
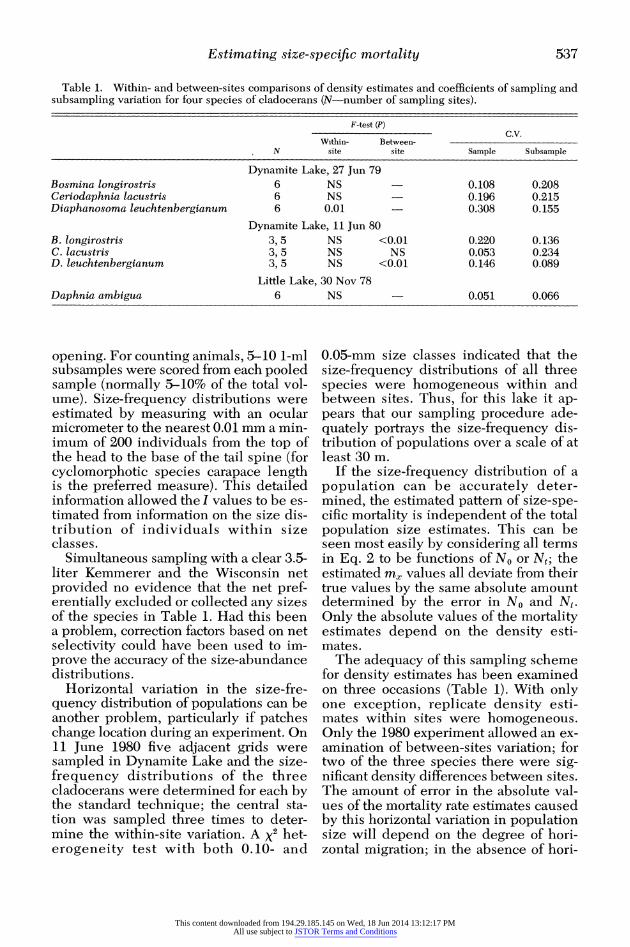
Table 1. Within- and between-sites comparisons of density estimates and coefficients of sampling and subsampling variation for four species of cladocerans (N-number of sampling sites).
F-test (P) C.V.
Within- Between- N site site Sample Subsample
Dynamite Lake, 27 Jun 79 Bosmina longirostris 6 NS 0.108 0.208 Ceriodaphnia lacustris 6 NS 0.196 0.215 Diaphanosoma leuchtenbergianum 6 0.01 0.308 0.155
Dynamite Lake, 11 Jun 80 B. longirostris 3, 5 NS <0.01 0.220 0.136 C. lacustris 3, 5 NS NS 0.053 0.234 D. leuchtenbergianum 3, 5 NS <0.01 0.146 0.089
Little Lake, 30 Nov 78 Daphnia ambigua 6 NS 0.051 0.066
opening. For counting animals, 5-10 1-ml subsamples were scored from each pooled sample (normally 5-10% of the total vol- ume). Size-frequency distributions were estimated by measuring with an ocular micrometer to the nearest 0.01 mm a min- imum of 200 individuals from the top of the head to the base of the tail spine (for cyclomorphotic species carapace length is the preferred measure). This detailed information allowed the I values to be es- timated from information on the size dis- tribution of individuals within size classes.
Simultaneous sampling with a clear 3.5- liter Kemmerer and the Wisconsin net provided no evidence that the net pref- erentially excluded or collected any sizes of the species in Table 1. Had this been a problem, correction factors based on net selectivity could have been used to im- prove the accuracy of the size-abundance distributions.
Horizontal variation in the size-fre- quency distribution of populations can be another problem, particularly if patches change location during an experiment. On 11 June 1980 five adjacent grids were sampled in Dynamite Lake and the size- frequency distributions of the three cladocerans were determined for each by the standard technique; the central sta- tion was sampled three times to deter- mine the within-site variation. A x2 het- erogeneity test with both 0.10- and
0.05-mm size classes indicated that the size-frequency distributions of all three species were homogeneous within and between sites. Thus, for this lake it ap- pears that our sampling procedure ade- quately portrays the size-frequency dis- tribution of populations over a scale of at least 30 m.
If the size-frequency distribution of a population can be accurately deter- mined, the estimated pattern of size-spe- cific mortality is independent of the total population size estimates. This can be seen most easily by considering all terms in Eq. 2 to be functions of No or Nt; the estimated m, values all deviate from their true values by the same absolute amount determined by the error in No and Nt. Only the absolute values of the mortality estimates depend on the density esti- mates.
The adequacy of this sampling scheme for density estimates has been examined on three occasions (Table 1). With only one exception, replicate density esti- mates within sites were homogeneous. Only the 1980 experiment allowed an ex- amination of between-sites variation; for two of the three species there were sig- nificant density differences between sites. The amount of error in the absolute val- ues of the mortality rate estimates caused by this horizontal variation in population size will depend on the degree of hori- zontal migration; in the absence of hori-
This content downloaded from 194.29.185.145 on Wed, 18 Jun 2014 13:12:17 PMAll use subject to JSTOR Terms and Conditions
538 Lynch
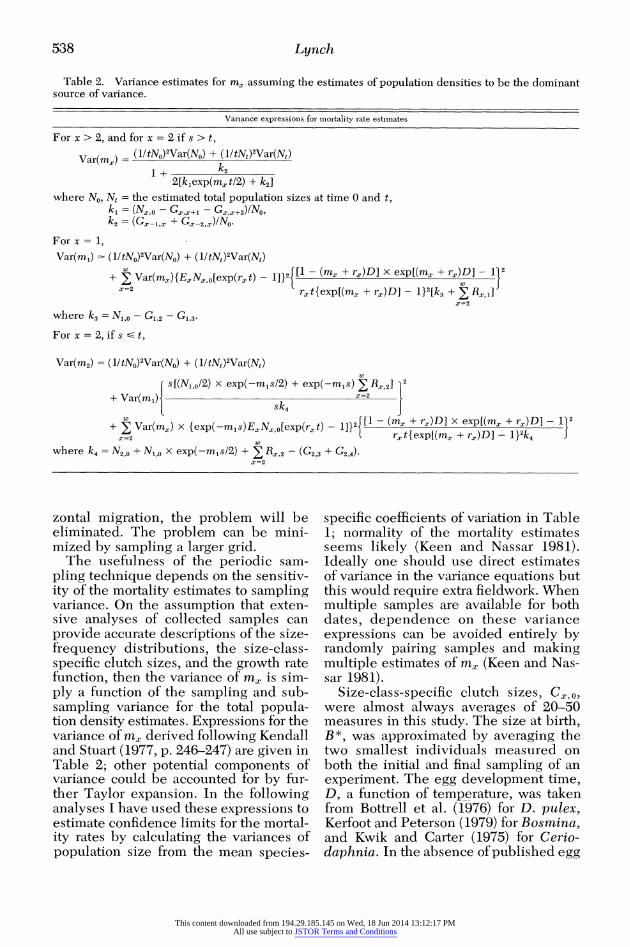
Table 2. Variance estimates for m, assuming the estimates of population densities to be the dominant source of variance.
Variance expressions for mortality rate estimates
For x > 2, and for x = 2 if s > t,
Var(m,) = (1/tNo)2Var(No) + (l/tNt)2Var(Nt) 1 + k2
2[k,exp(mxt/2) + k2]
where No, Nt = the estimated total population sizes at time 0 and t, ki = (Nx,o - Gx,x+l - Gx,x+2)lNo, k2 = (Gx-1,x + Gx-2,x)/NO
For x = 1,
Var(ml) = (1/tNo)2Var(NO) + (l/tNt)2Var(Nt)
+ w
Var(m-){E N o[exp(r t)-1]}2{[1 - (mx + rx)D] x exp[(mx + rx)D] - 112 x=2 rxt{exp[(mx + rx)D] - 1}2[k3 + RX,1]
x=2
where k3 = N1,0 - G1,2 - G1,3.
For x = 2, if s S t,
Var(m2) = (1/tNo)2Var(NO) + (l/tNt)2Var(Nt)
s[(N1,0/2) x exp(-mls/2) + exp(-mls) R 2
+ Var(ml). x=2
sk, + Va(I{ep(ms2 ]}2{[I - {exp[(mxD]+r xpD]- + rx)D] - }2
+ E Var(mx) x {exp(-m1s)ExNx,o[exp(rxt) - (mx + rx)D] - 1p 2 k - x=2 r
w
where k4 = N2,0 + N1,o x exp(-m1s/2) + E Rx,2 - (G2,3 + G2,4). x=2
zontal migration, the problem will be eliminated. The problem can be mini- mized by sampling a larger grid.
The usefulness of the periodic sam- pling technique depends on the sensitiv- ity of the mortality estimates to sampling variance. On the assumption that exten- sive analyses of collected samples can provide accurate descriptions of the size- frequency distributions, the size-class- specific clutch sizes, and the growth rate function, then the variance of m, is sim- ply a function of the sampling and sub- sampling variance for the total popula- tion density estimates. Expressions for the variance of m, derived following Kendall and Stuart (1977, p. 246-247) are given in Table 2; other potential components of variance could be accounted for by fur- ther Taylor expansion. In the following analyses I have used these expressions to estimate confidence limits for the mortal- ity rates by calculating the variances of population size from the mean species-
specific coefficients of variation in Table 1; normality of the mortality estimates seems likely (Keen and Nassar 1981). Ideally one should use direct estimates of variance in the variance equations but this would require extra fieldwork. When multiple samples are available for both dates, dependence on these variance expressions can be avoided entirely by randomly pairing samples and making multiple estimates of m, (Keen and Nas- sar 1981).
Size-class-specific clutch sizes, CXQ0, were almost always averages of 20-50 measures in this study. The size at birth, B*, was approximated by averaging the two smallest individuals measured on both the initial and final sampling of an experiment. The egg development time, D, a function of temperature, was taken from Bottrell et al. (1976) for D. pulex, Kerfoot and Peterson (1979) for Bosmina, and Kwik and Carter (1975) for Cerio- daphnia. In the absence of published egg
This content downloaded from 194.29.185.145 on Wed, 18 Jun 2014 13:12:17 PMAll use subject to JSTOR Terms and Conditions
Estimating size-specific mortality 539
09
20 -
10 * Dophnlo pulex Dophnlo pulex 0 5 - Dlophonosomo E Busey Pond Busey Pond Dynamite Lake E 13-15 June 1978 20-23 Aug 1979 6-9 Aug 1979
00 I0 20 30 00 I0 20 30 0 3 05 07 09 1
zi05 060 0 ? 0 1 OX 0
04 Lk 0.5 . 0.: 0 0 - 0
F- I A *
(D ~ ~ ~ ~ ~ ~ ~ LNT ONDO (m
aJO 3 -aBosmlno 0e 4 04 4 a 4 - anal .Dynamite Lake
6-9 Aug 1979 0'.,
05 0I 3 Ceriodophnlo 0 O Cerlodophnlo 03Cerlodophnlo 02 03 04 05Dynamite Lake Dynamite Lake Dynamite Lake 9-11 July 1979 25-27 July 1979 6-9 Aug 1979
02 0.3 0.4 05 0 6 0 2 0 3 04 0 5 0 6 0.2 03 04 05 06
LENGTH ON DAY 0 (m m)
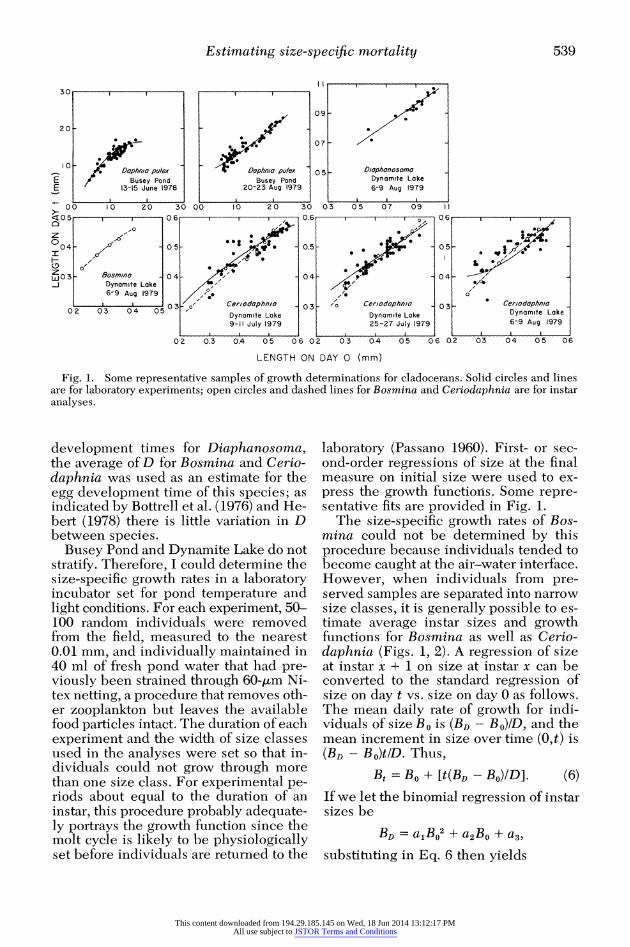
Fig. 1. Some representative samples of growth determinations for cladocerans. Solid circles and lines are for laboratory experiments; open circles and dashed lines for Bosmina and Ceriodaphnia are for instar analyses.
development times for Diaphanosoma, the average of D for Bosmina and Cerio- daphnia was used as an estimate for the egg development time of this species; as indicated by Bottrell et al. (1976) and He- bert (1978) there is little variation in D between species.
Busey Pond and Dynamite Lake do not stratify. Therefore, I could determine the size-specific growth rates in a laboratory incubator set for pond temperature and light conditions. For each experiment, 50- 100 random individuals were removed from the field, measured to the nearest 0.01 mm, and individually maintained in 40 ml of fresh pond water that had pre- viously been strained through 60-,m Ni- tex netting, a procedure that removes oth- er zooplankton but leaves the available food particles intact. The duration of each experiment and the width of size classes used in the analyses were set so that in- dividuals could not grow through more than one size class. For experimental pe- riods about equal to the duration of an instar, this procedure probably adequate- ly portrays the growth function since the molt cycle is likely to be physiologically set before individuals are returned to the
laboratory (Passano 1960). First- or sec- ond-order regressions of size at the final measure on initial size were used to ex- press the growth functions. Some repre- sentative fits are provided in Fig. 1.
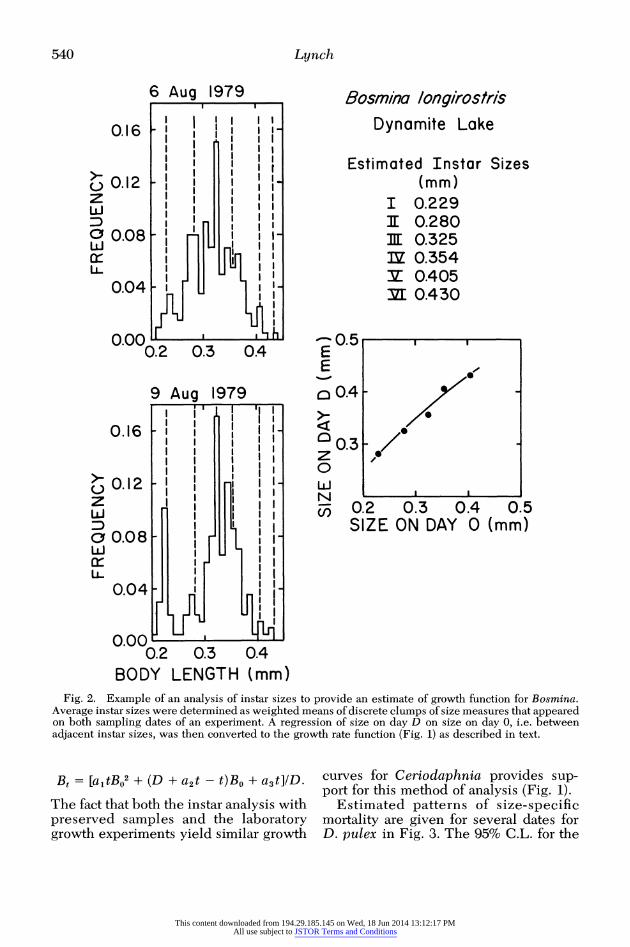
The size-specific growth rates of Bos- mina could not be determined by this procedure because individuals tended to become caught at the air-water interface. However, when individuals from pre- served samples are separated into narrow size classes, it is generally possible to es- timate average instar sizes and growth functions for Bosmina as well as Cerio- daphnia (Figs. 1, 2). A regression of size at instar x + 1 on size at instar x can be converted to the standard regression of size on day t vs. size on day 0 as follows. The mean daily rate of growth for indi- viduals of size BO is (BD - BO)/D, and the mean increment in size over time (0,t) is (BD- BO)tD. Thus,
Bt = BO + [t(BD- Bo)/D]. (6)
If we let the binomial regression of instar sizes be
BD = a1BO2 + a2BO + a3, substituting in Eq. 6 then yields
This content downloaded from 194.29.185.145 on Wed, 18 Jun 2014 13:12:17 PMAll use subject to JSTOR Terms and Conditions
540 Lynch
6 Aug 1979 Bosmina Iongirostr/s
0.16 hX Dynamite Lake
I I ' l l I Estimated Instar Sizes t O.12 (mm)
IE .
z (m 9 AugI 0.229
00.08' H31:0.280 a 0.08 -H 111:0.325 x IZ 0.354I I
LL~ I I 2~~~~ 0.4 05 0.04 -
I ~ ~~~L 0.430
0.2 0.3 0.4 E .
9 Aug 1979 QO.4-
0.16 '' I
~0.12 I i
z ~~~~0.2 0.3 0.4 0.5
BOD8 L H (mSIZEONDAY(mm)
0.04 I
0.00 0.2 0.3 0.4
BODY LENGTH (mm) Fig. 2. Example of an analysis of instar sizes to provide an estimate of growth function for Bosmina.
Average instar sizes were determined as weighted means of discrete clumps of size measures that appeared on both sampling dates of an experiment. A regression of size on day D on size on day 0, i.e. between adjacent instar sizes, was then converted to the growth rate function (Fig. 1) as described in text.
Bt = [a1tB02 + (D + a2t - t)Bo + a3t]ID.
The fact that both the instar analysis with preserved samples and the laboratory growth experiments yield similar growth
curves for Ceriodaphnia provides sup- port for this method of analysis (Fig. 1).
Estimated patterns of size-specific mortality are given for several dates for D. pulex in Fig. 3. The 95% C.L. for the
This content downloaded from 194.29.185.145 on Wed, 18 Jun 2014 13:12:17 PMAll use subject to JSTOR Terms and Conditions
Estimating size-specific mortality 541
1. 9 MAY'1978 18' 23 MAY 1978 13'-15 JUNE 1978
0O.8 4' >0.4
L L 0 .4 r_ _ _ _ _ _ _ _
H_ 11-13 JULY 1978 20-23 AUG 1979 .j08
o-- 0 04 - -- - - - -
2 ~~~~~~18-20 JUNE 1979 u)- 4 I I 0 4 I I I I I l l I D 0.8 1.6 2.4 0 LV Z 1.23IU-SE '
gz 0.8 t >
0.8 0979 BUSEY POND 0.4 N
H 0.0 ~~~~14-17 SEP 1979
-0.4 I I I I I __
~0.8 1.6 2.4 0.8 1.6 2.4 BODY LENGTH (mm)
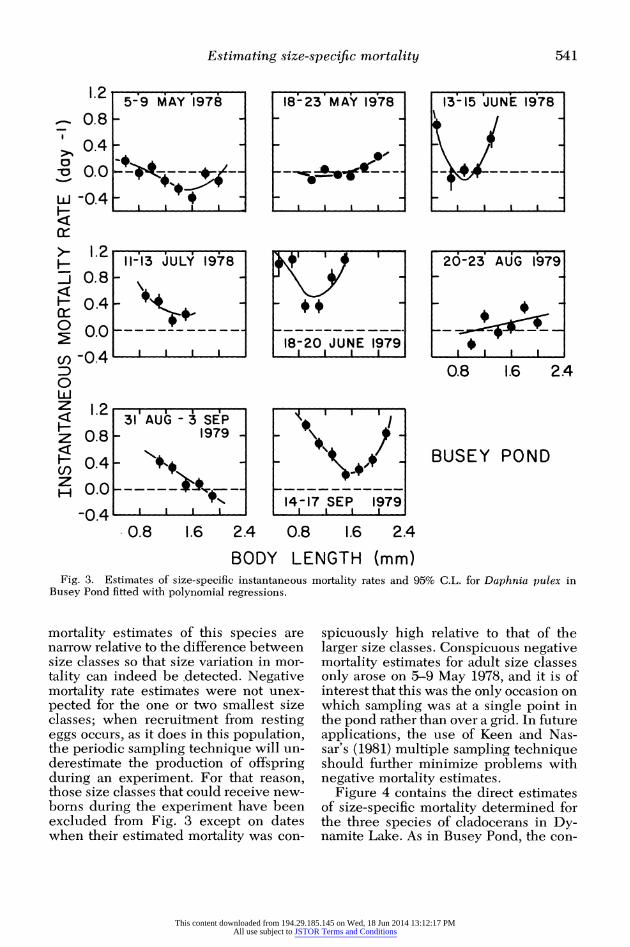
Fig. 3. Estimates of size-specific instantaneous mortality rates and 95% C.L. for Daphnia pulex in Busey Pond fitted with polynomial regressions.
mortality estimates of this species are narrow relative to the difference between size classes so that size variation in mor- tality can indeed be .detected. Negative mortality rate estimates were not unex- pected for the one or two smallest size classes; when recruitment from resting eggs occurs, as it does in this population, the periodic sampling technique will un- derestimate the production of offspring during an experiment. For that reason, those size classes that could receive new- borns during the experiment have been excluded from Fig. 3 except on dates when their estimated mortality was con-
spicuously high relative to that of the larger size classes. Conspicuous negative mortality estimates for adult size classes only arose on 5-9 May 1978, and it is of interest that this was the only occasion on which sampling was at a single point in the pond rather than over a grid. In future applications, the use of Keen and Nas- sar's (1981) multiple sampling technique should further minimize problems with negative mortality estimates.
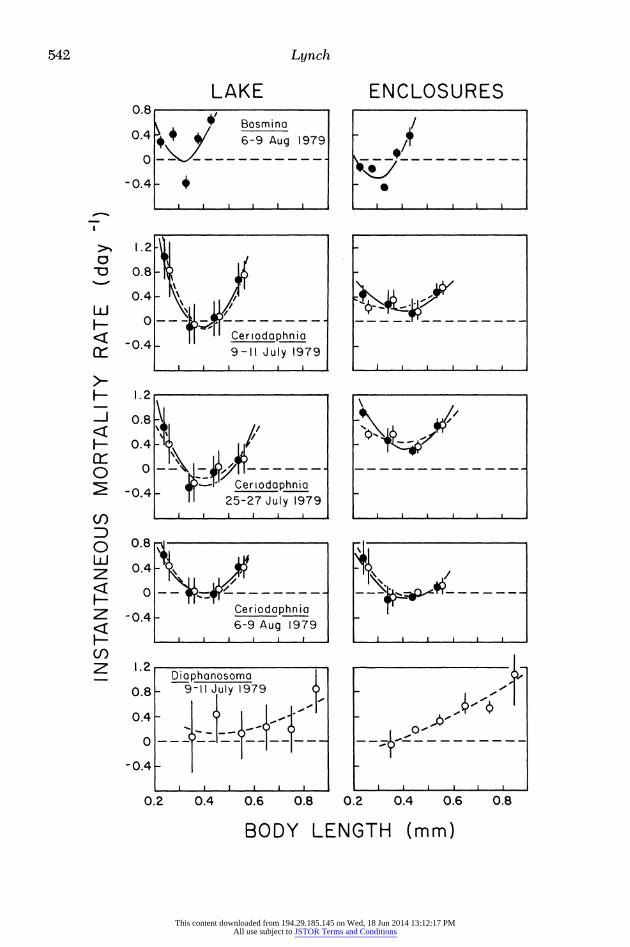
Figure 4 contains the direct estimates of size-specific mortality determined for the three species of cladocerans in Dy- namite Lake. As in Busey Pond, the con-
This content downloaded from 194.29.185.145 on Wed, 18 Jun 2014 13:12:17 PMAll use subject to JSTOR Terms and Conditions
542 Lynch
LAKE ENCLOSURES 0.8
Bosmina 0. - Aug 1979
-0.4 F k l I I I . I
, .
>- 1.2
0 0.8
0Q4 -
H 'Ceriodohn0 9-11 July 1979
I ~ ~~ ~ ~ ,__l_l_l_ _l_,_l_l_ _l_l_l_l
- 1.2
<[0.8 \\ >+ - - -F-? -- -
H - 0.4 1 9
0 ?
Z -C0.4 Ceriodaphnia 4 -25-27 July 1979
r) I
___ I K 1979
Derphdnohn a
- 0.8 - D911July19079 -
-0.4-
0.2 0.4 0.6 0.8 0.2 0.4 0.6 0.8
BODY LENGTH (mm)
This content downloaded from 194.29.185.145 on Wed, 18 Jun 2014 13:12:17 PMAll use subject to JSTOR Terms and Conditions
Estimating size-specific mortality 543
fidence limits for the m, values were generally small enough that size-specific- ity of mortality could be discerned. With the exception of Bosmina, significantly negative mortality estimates were rare.
Parallel experiments were run on each date in Dynamite Lake in triplicate 1.0- m-diameter polyethylene enclosures ex- tending from the lake surface to the sed- iments. The bottoms of these chambers consisted of a rigid hoop across which was stretched 0.5-cm netting, the purpose being to separate fish predation from the other components of mortality (potential physiological problems and invertebrate predation) operating on the cladoceran populations (Lynch et al. 1981). The en- closure results further implicate horizon- tal heterogeneity as a potential factor contributing to negative mortality rate es- timates. Stirring the enclosures before sampling effectively eliminated any pos- sibility of spatial heterogeneity and gave rise to negative mortality rates much less frequently than did the lake. In a total of four experiments the proportion of size- specific mortality rates significantly <0 at the 0.05 level in the lake and bags were: Bosmina-0.57 (N = 21) and 0.27 (N = 30), Ceriodaphnia (using laboratory growth functions)-0.06 (N = 17) and 0.00 (N = 37), and Diaphanosoma-0.28 (N -
25) and 0.05 (N = 74). The higher incidence of negative mor-
tality estimates in Bosmina is troubling, particularly because it is consistent be- tween enclosures and lake on a given date (Fig. 4). The most likely explanation is that the growth rate expressions for this species are erroneous, perhaps because Kerfoot and Peterson's (1979) instar du- ration times do not apply to this popula- tion. Some laboratories have been highly successful in handling Bosmina (C. Goulden pers. comm.), and the use of
more delicate and sensitive techniques may permit direct estimates of Bosmina growth rates in the future.
Actually the mortality model can tol- erate a fair amount of error in the growth rate function, as can be seen by compar- ing the patterns of size-specific mortality for Ceriodaphnia generated by using the growth functions from direct observa- tions and from instar analyses given in Fig. 1. In all six cases illustrated in Fig. 4 the two patterns of mortality are nearly identical.
Finally, a comparison of estimated mortality rates between enclosures places some confidence in the replicability of the technique. As can be seen by the ranges of size-specific mortality rates plotted in Fig. 4, the differences between enclo- sures tend to be quite small, generally less than the width of the 95% C.L. in the lake.
Discussion In light of the potential complications
that could have arisen in the estimation of m, by periodic sampling but did not, these preliminary results suggest that the insights into size-specific mortality gen- erated by the model may be well worth the large amount of work necessary for its application. Extension of this kind of analysis to a variety of populations and environments should allow critical eval- uation of several of the assumptions im- plicit in the theoretical foundations of zooplankton community ecology. For ex- ample, application of the technique to the cladocerans of Dynamite Lake, a lake with an extremely dense planktivorous fish population, cast serious doubt on the widely accepted assumption that direct size-selective predation by fish is the dominant selective force operating on such communities (Lynch et al. 1981);
Fig. 4. Estimates of size-specific instantaneous mortality rates for three species of planktonic cladocer- ans in Dynamite Lake. 95% C.L. are provided for lake values, means and ranges for enclosures. Solid circles and curves are for estimates derived using instar analyses; open circles and dashed curves are for values derived from laboratory experiments.
This content downloaded from 194.29.185.145 on Wed, 18 Jun 2014 13:12:17 PMAll use subject to JSTOR Terms and Conditions
544 Lynch
these results have recently been corrob- orated by experimental manipulations of fish densities (M. Vanni in prep.).
Clearly the estimation of size-specific mortality rates by periodic sampling is not satisfactory in all respects. For organisms living in homogeneous environments like unstratified lakes and ponds, the deter- mination of size-specific flux rates may be accomplished under controlled labora- tory conditions, by enclosing individuals in the field (Threlkeld 1979), or by instar analysis. However, these techniques will often be inappropriate when individuals encounter an unpredictable array of en- vironmental conditions during an exper- iment, as in the case of vertically migrat- ing zooplankton in stratified waters. It might be possible to resort to instar anal- ysis to estimate the growth function in such cases, provided that the duration of the different instars (which may be a function of vertical distribution) can be ascertained.
As with any demographic technique applied to the plankton, the periodic sampling technique is sensitive to the horizontal distribution of populations. An accurate estimate of the size-frequency distribution of the population is particu- larly critical for determining the correct pattern of size-specific mortality. There is no evidence that this is a problem for the populations described here, but that does not imply that a different or more elabo- rate sampling procedure might not be preferable in other settings. A more se- rious problem may be estimating popu- lation size. As is true of population mor- tality rates (Keen and Nassar 1981; Polishchuk and Ghilarov 1981; Lynch 1982), negative size-specific mortality rates may arise when, because of sam- pling error, an abnormally large popula- tion size is estimated on the second date or an abnormally small value on the first date. The multiple sampling approach suggested by Keen and Nassar (1981) is the most judicious method of minimizing this problem.
It is worth emphasizing that even if population densities cannot be estimated
with absolute certainty, the model still provides the correct pattern of size-spe- cific mortality so long as the size-fre- quency distributions and flux rates of in- dividuals between classes are accurately known. A simple knowledge of the shape of the mortality functions for natural zoo- plankton populations would substantially improve our understanding of the evo- lutionary ecology of zooplankton com- munities, since most speculations on these functions have been concerned more with their shape than with their ab- solute value. This is with good reason. The evolution of many life history traits depends not so much on the absolute val- ue of mortality as on its age-specific pat- tern (Charnov and Schaffer 1973).
If we assume that the sampling scheme is sufficiently accurate to describe the size-frequency distribution of the popu- lation, it is possible to estimate the min- imal mortality rates for the size classes. Under these conditions, the true mortal- ity rate
mx = mx + 0
for all x. Estimating the constant 0 re- quires that M^ x be known for at least one size class which, of course, is impossible to determine with absolute certainty. However, noting that M'ix ? 0 for all x, and letting the minimum estimated mortality rate be min(mx), we find that a minimal estimate of 0 is -min(mx).
Ultimately, the efficacy of the periodic sampling technique, as with all demo- graphic techniques, would be much more firmly established if the mortality esti- mates that it generates could be com- pared with those independently derived by other methods. Yet the technique was developed for use with those organisms that are not amenable to analysis by ex- isting demographic techniques. These initial results from the replicate bag ex- periments provide a good, but internal, test of the model, and the refinement of techniques to minimize the variance of the parameter estimates will further en- hance the level of confidence that can be placed on any single mortality function.
This content downloaded from 194.29.185.145 on Wed, 18 Jun 2014 13:12:17 PMAll use subject to JSTOR Terms and Conditions
Estimating size-specific mortality 545
References ALLAN, J. D. 1974. Balancing competition and
predation in cladocerans. Ecology 55: 622-629. ARGENTESI, F., R. DEBERNARDI, AND G. DICOLA.
1974. Mathematical models for the analysis of population dynamics in species with continu- ous recruitment. Mem. Ist. Ital. Idrobiol. 31: 245-275.
BOTTRELL, H. H., AND OTHERS. 1976. A review of some problems in zooplankton production studies. Norw. J. Zool. 24: 419-456.
CHARNov, E. L., AND W. M. SCHAFFER. 1973. Life- history consequences of natural selection: Cole's result revisited. Am. Nat. 107: 791-793.
COOPER, W. E. 1965. Dynamics and productivity of a natural population of a fresh-water amphi- pod, Hyallela azteca. Ecol. Monogr. 35: 377- 394.
DODSON, S. I. 1974. Zooplankton competition and predation: An experimental test of the size-ef- ficiency hypothesis. Ecology 55: 605-613.
FAGER, E. W. 1973. Estimation of mortality coef- ficients from field samples of zooplankton. Lim- nol. Oceanogr. 18: 297-301.
HALL, D. J., S. T. THRELKELD, C. W. BURNS, AND P. H. CROWLEY. 1976. The size-efficiency hypothesis and the size structure of zooplank- ton communities. Annu. Rev. Ecol. Syst. 7: 177- 208.
HEBERT, P. D. 1978. The population biology of Daphnia (Crustacea, Daphnidae). Biol. Rev. 53: 387-426.
KEEN, R., AND R. NASSAR. 1981. Confidence in- tervals for birth and death rates estimated with the egg-ratio technique for natural populations of zooplankton. Limnol. Oceanogr. 26: 131-142.
KENDALL, M., AND A. STUART. 1977. The adv- anced theory of statistics, v. 1. Distribution the- ory, 4th ed. Macmillan.
KERFOOT, W. C. 1975. The divergence of adjacent populations. Ecology 56: 1298-1313.
, AND C. PETERSON. 1979. Ecological in- teractions and evolutionary arguments: Inves-
tigations with predatory copepods and Bosmi- na. Fortschr. Zool. 25: 159-196.
KWIK, J. K., AND J. C. CARTER. 1975. Population dynamics of limnetic Cladocera in a beaver pond. J. Fish. Res. Bd. Can. 32: 341-346.
LYNCH, M. 1977. Fitness and optimal body size in zooplankton populations. Ecology 58: 763- 774.
. 1979. Predation, competition, and zoo- plankton community structure: An experimen- tal study. Limnol. Oceanogr. 24: 253-272.
* 1980. The evolution of cladoceran life his- tories. Q. Rev. Biol. 55: 23-42.
* 1982. How well does the Edmondson-Pa- loheimo model approximate instantaneous birth rates? Ecology 63: 12-18.
, B. MONSON, M. SANDHEINRICH, AND L. WEIDER. 1981. Size specific mortality rates in zooplankton populations. Int. Ver. Theor. An- gew. Limnol. Verh. 21: 363-368.
PASSANO, L. M. 1960. Molting and its control, p. 473-527. In T. H. Waterman [ed.], The physi- ology of Crustacea, v. 1. Metabolism and growth. Academic.
POLISHCHUK, L. V., AND A. M. GHILAROV. 1981. Comparison of two approaches used to calcu- late zooplankton mortality. Limnol. Oceanogr. 26: 1162-1167.
SEITZ, A. 1979. On calculation of birth rates and death rates in fluctuating populations with con- tinuous recruitment. Oecologia 41: 343-360.
TAYLOR, B. E., AND M. SLATKIN. 1981. Estimat- ing birth and death rates of zooplankton. Lim- nol. Oceanogr. 26: 143-158.
THRELKELD, S. T. 1979. The midsummer dynam- ics of two Daphnia species in Wintergreen Lake, Michigan. Ecology 60: 165-179.
VAN SICKLE, J. 1977. Mortality rates from size dis- tributions. The application of a conservative law. Oecologia 27: 311-318.
Submitted: 12 May 1981 Accepted: 16 September 1982
This content downloaded from 194.29.185.145 on Wed, 18 Jun 2014 13:12:17 PMAll use subject to JSTOR Terms and Conditions