Embed Size (px)
Citation preview

1
Projection Of Mortality Rates At Advanced Ages In Canada With A New Lee-Carter Type Model
Louis G. Doray Kim O. Tang
Presented at the Living to 100 Symposium Orlando, Fla.
January 5–7, 2011 Copyright 2011 by the Society of Actuaries. All rights reserved by the Society of Actuaries. Permission is granted to make brief excerpts for a published review. Permission is also granted to make limited numbers of copies of items in this monograph for personal, internal, classroom or other instructional use, on condition that the foregoing copyright notice is used so as to give reasonable notice of the Society’s copyright. This consent for free limited copying without prior consent of the Society does not extend to making copies for general distribution, for advertising or promotional purposes, for inclusion in new collective works or for resale.

2
Abstract
Proper mortality forecast at advanced ages is an important challenge for
demographers and actuaries. For this particular population, it has been shown that
logistic models for the force of mortality (such as Perks’ and Kannisto’s models)
usually provide very good modeling and forecasts (Thatcher, Kannisto and Vaupel,
1998). However, these models are not frequently used in actuarial practice. In
demography, the Lee-Carter model, which offers a simple methodology, has been
preferred (Lee and Carter, 1992) for forecasting.
In this paper, we will show that the modeling and forecasting of advanced age
population can be improved by combining features of the logistic model for the
force of mortality, and the Lee-Carter model. This combination has been inspired by
a linear reparametrization of the logistic models taken in Doray (2008).
In particular, our model will be applied to the Canadian male population aged 70 to
99 years old and to the Canadian female population aged 80 to 105 years old. The
results of our model will be compared to those of two well-known models, the
original Lee-Carter model for each sex, and the logistic model of Lee-Carter (Lee,
2000) for each sex. For both sexes, we found that the use of our model presents
values closer to the observations and that the forecasts are quite realistic.
Keywords:
Logistic models, Lee-Carter model, advanced age population, mortality rate, central
rate of mortality, force of mortality, forecast methods, singular value decomposition,
time series, Box-Jenkins method.

3
0. Introduction
Abilities of older people vary greatly according to the age group in which they are.
Given that the Canadian population is getting older and that the needs of older
people will be increasing, the elaboration of administrative and budgetary plans
based on the most accurate demographic projections is essential.
This paper has been written with this objective in mind, projecting mortality at
advanced ages for the Canadian population, males aged 70 to 99 and females aged
80 to 105.
On 19 July 2002, in an article which appeared in Le Devoir newspaper, F. Nault, a
Statistics Canada demographer, was analyzing the 2001 census. The over age 80
population had increased by 41% in 10 years in Canada, while the 45-64 age group
had increased by 36%, in spite of the massive arrival of baby-boomers in this age
group. Centenarians were more numerous than ever in Canada: they were 3795 in
2001 and 3125 in 1996, an increase of 21% in 5 years.
Population ageing is not a phenomenon particular to Canada. Throughout the world,
this situation is more and more pronounced since the end of the fifties, especially in
developed countries. For example, in 2006, among the G8 countries, Canada was
the third oldest country, with a median population age of 36.8 years, after the United
States and Russia.
The principal causes related to this ageing phenomenon are well known: the fall in
the birth rate and the increase in longevity. But beyond these reasons, this situation
takes on great importance with the public decision makers. They must avoid deficits
in budgets and guarantee an adequate financing of various government programs
such as recruitment of manpower, job creation, social housing, old-age pensions and
health care. All this requires exhaustive studies and accurate projections to quantify
and qualify the ageing population.
The paper is organized as follows.
In section 1, we review some logistic models for the force of mortality for the old-
age population, models which have been successfully used in many countries.

4
In section 2, we present the Lee-Carter model and its modified forms. Lee and
Carter (1992) used extrapolation to project mortality, a model first applied in the
US. They modeled the central rate of mortality at age x for a given time period t,
with three series.
In section 3, Doray and Tang propose a new modified Lee-Carter model, which
combines features of Kannisto’s model and the Lee-Carter model.
Section 4 will present the data available in Canada at advanced ages, for males and
females (1976-2005), taken from the Canadian Longevity Database (males aged 70
to 99 years and females aged 80 to 105 years).
In section 5, using these two populations, we will compare the results of three
models, the original Lee-Carter model, the logistic model of Lee-Carter and Doray
and Tang’s model, for the values of the parameters, the modeling errors, and the
projected mortality rates for the period 2006-2035. Doray and Tang’s model will be
seen to have the smallest mean absolute relative error among the three models.
1. Logistic models for the force of mortality
The 1970's witnessed a clear fall in mortality as well as an increase in the number of
deaths at advanced ages (Kannisto, 1996). In this context, appropriate modeling of
this population group is essential.
Many mathematical models have studied the evolution of the force of mortality for
the advanced age population, for example exponential or logistic models.
In 1998, Thatcher, Kannisto and Vaupel wrote a monograph studying the population
aged 80 to 120 years in 13 countries (Austria, Denmark, England and Wales,
Finland, France, West Germany, Iceland, Italy, Japan, Netherlands, Norway,
Sweden and Switzerland ). Those countries were selected according to strict quality
criteria of the data, described in their work (Thatcher et al., 1998).
Their monograph revealed many interesting conclusions:
1- Gompertz model (µx = Beµx ) produced the largest errors;
2- Weibull's model ( µx = axb ) was only slightly better;

5
3- Heligman and Pollard (1980) model (qx / px = GHx), was the third worst model.
These three models were overestimating mortality beyond age 100.
In all the countries, for the periods 1960-70, 1970-80, 1980-90, and for the cohort
born in 1871-1880, the best fitting models for the old-age population were the
model of Perks’ (1932)
x
x
x Ce
BeA
1 ,
and its special case with the parameters A=0 and B=C, Kannisto’s model
(Kannisto, 1992),
x
x
x Be
Be
1 .
Perks' and Kannisto's models are both logistic-type models. As x tends to infinity, µx
tends to a constant, equal to 1 for Kannisto's and B/C for Perks' model, contrarily to
exponential models such as Gompertz or Makeham, where the force of mortality
tends to infinity.
Doray (2008) has shown for Kannisto's model, that the logit of µx, defined as
logit
x
xx
1
log,
could be expressed, after a reparametrization, as a linear function of the parameters
a and µ,
logit µx = a + µx,
where a= log B. Note that since µx is less than 1 for Kannisto's model, µx / (1- µx )
is positive and its logarithm can always be taken.
Introducing random errors, a linear model was then defined. Its parameters were
estimated by weighted least-squares, and their properties (consistency, asymptotic
unbiasedness and normality) developed.

6
2. The Lee-Carter model and its modifications
Lee and Carter introduced their model in 1992 to project mortality in the US for
both sexes combined, with extrapolation methods. They modeled the central rate of
mortality at age x for a given time period t, denoted mx,t , with three series,
ax, the average level of mortality at age x
bx, the rate of improvement of the level of mortality at age x, and
kt, the level of mortality at time t, as
txtxxtx kbam ,,log ,
where εx,t is a random error for age x at time t.
The central rate of mortality, defined as the number of deaths at age x divided by the
average number of people of age x who lived during period t, is seen to be an
exponential function of parameters depending on age x and time t.
During the projection, only the parameter kt is extrapolated with the Box-Jenkins
time series method.
Lee and Carter have also suggested that each sex be modeled separately. Since its
development, this model has been used in many countries, including Japan and
Italy. It has also been used to model morbidity and fertility, besides mortality.
Many desirable features have made it popular among demographers and actuaries. It
gives a good fit to data and it requires the extrapolation of only one parameter.
Moreover, uncertainties can be considered during projections. Finally, the method is
simple to use.
However, the Lee-Carter model has also aroused many criticisms. Its principal
problems are a temporal invariability of parameters ax and bx, unverified in reality,
as well as the divergence created between sexes and regions. The case of Canada is
a good example, where we observe that the differences between life expectancies
for males and females seem to diminish over time. Moreover, the differences in life
expectancies between the provinces remain constant over time (Paquette, 2006).
The Lee-Carter model however, only projects divergence situations in the long term.

7
Lee and Nault have submitted proposals to correct this problem (Lee and Nault,
1993).
Furthermore, the Lee-Carter method shares the disadvantages of other methods of
projection based on extrapolation. The historical tendency of mortality is certainly
not a guarantee for the future. Also, advances in medicine, changes in lifestyle and
the appearance of new diseases are not considered. In spite of all this, experimental
studies have shown that the the model gives good results when it is used over the
period 1900 to 1990 (Lee, 2000).
Various modifications to the basic model have been proposed in the literature, for
example the augmented common factor Lee-Carter method (Li and Lee, 2005). This
method solves the long term divergence problems between sexes, ethnic groups and
regions in the original Lee-Carter model. It requires partitioning of the population to
be projected, by similar characteristics, which may be the sex or the socio-economic
status of certain groups of the population studied.
Statistics Canada has compared the augmented common factor Lee-Carter method
with the Lee-Carter model for the period 1971-2002 and concluded that the method
of Li and Lee produced better modeling and projections for Canada. The problems
of divergence between sexes and regions were greatly eliminated (Paquette, 2006).
Another modification to the Lee-Carter model which has been considered in the
literature is the Lee-Carter logistic model (Lee, 2000)
logit txtxx
tx
txtx kba
m
mm ,
,
,, 1
log
.
3. A new modified Lee-Carter model
Tuljapurkar, Li and Boe (2000) examined mortality in the G7 countries for the
years 1950 to 1994. They noticed that for all the countries in this period, mortality
at each age was decreasing exponentially at a more or less constant rate. In this

8
section, we will try to improve the performance of the Lee-Carter model for
modeling and projecting the old-age population.
As written in Section 1, logistic models for the force of mortality, such as Perks' or
Kannisto's, were the best ones to model mortality of advanced age population in
industrialized countries. Also, after reparametrizing Kannisto's model, the logit of
µx , could be expressed as a linear function of two parameters.
Combining features of Kannisto’s model and the Lee-Carter model, Doray and Tang
propose a new model for the old-age population, where the logit of µx is modeled as
a function analogous to the one in the Lee-Carter model,
logit
tx
txtx
,
,, 1
log
= ax + bx kt + εx,t .
To estimate the parameters of the model, we will first review the method of Lee and
Carter for the model
log (qx,t) = ax + bx kt + εx,t (1)
where
qx,t is the rate of mortality at age x and time t
ax is the average level of mortality at age x
bx is the rate of change of the level of mortality at age x
kt is the level of mortality at time t and
εx,t is a random error with mean 0 and variance σ2.
Note that the original Lee-Carter model was defined with the natural logarithm of
the central rate of mortality; relations and approximations relating the central rate of
mortality mx,t to the probability of death qx,t yield negligible approximation errors.
However, the difference between qx,t and the force of mortality which is very small
when qx,t is small, grows larger as qx,t increases.
The uniqueness of solutions imposes two constraints:

9
1) 1 xb
;
2) 0 tk
.
Let us adopt the following notation. The right upper index will indicate the
number of the estimation (since each parameter is estimated, then reestimated). So,
separately for males and females, the Lee-Carter method goes through the following
steps:
1- A first estimate of the average level of mortality according to age is calculated
with the average over time for the model,
T
qâ t
tx
x
)ln( ,1
where T is the total number of reference years.
2- Singular value decomposition of matrix ln(qx,t)-âx1 gives preliminary estimates
for parameters bx and kt , which we denote bx
SVD and ktSVD.
3- With the uniqueness conditions, we obtain
x
SVDx
SVDx
xb
bb
ˆ
ˆˆ
;
x
SVDx
SVDtt bkk ˆˆˆ1
4- We obtain the second estimate of kt , that is k̂ 2t, by requiring equality between
the expected and observed numbers of deaths,
Dt = ∑ Nx,t qx,t ,
where Nx,t is the population aged x at time t and Dt is the total number of deaths in
year t.
5- Finally, we obtain the parameters

10
k̂t = k̂ 2
t - Average ( k̂ 2t ) and âx = âx
1 + bx Average ( k̂ 2t ).
6- After this, with the Box-Jenkins time series method, we project the series of the
level of mortality at time t. The extent of the projection period was chosen as 30
years.
7- We have projected the qx values for the years 2015, 2025 and 2035 and we have
compared our modeling and projections with the observed values for years 1976,
1986, 1996 and 2005.
This method is applied analogously for the other two models, the logistic model of
Lee-Carter (Lee, 2000)
logit(qx,t) = ax + bx kt + εx,t, (2)
and the model we propose
logit(µx,t) = ax + bx kt + εx,t (3)
where we used the approximation µx+0.5 = - ln px .
4. Canadian data available at advanced ages
Analyzing the quality of data provided by Statistics Canada at old ages, Bourbeau
and Lebel (2000) have concluded that between ages 80 and 99, the quality of data
of Statistics Canada is good. Over age 100, they found many cases of
overestimation of age at death or age declared during the census.
The Human Mortality Database (HMD) is a database created by the Max Planck
Institute for Demographic Research in Rostock and the Department of Demography
of the University of California at Berkeley. It contains comparable data from 34
countries including Canada (Canadian Longevity Database or Base de données sur
la longévité canadienne, BDLC). Statistics Canada and BDLC present similar, but
not totally identical data. For example, Statistics Canada presents data for ages 0 to
99 by single year and then for the open interval 100+, while BDLC presents data

11
for ages 0 to 109 and then the age group 110+. We have used the BDLC data for
Canada, which are more easily accessible, specifically the national tables entitled
Deaths, Population, Tables - Males and Tables – Females.
In Canada, a new mortality tendency has been observed since the beginning of the
seventies (Lee and Nault, 1993), when lower mortality rates have been observed
among men and women. Technological and medical advances of this period as well
as the establishment of an universal system of medical and hospital insurance are
responsible for this. With the Box-Jenkins time series method, a reference period of
less than 30 years is not very reliable. For these reasons, we have kept 30 years of
data as reference and only data of years 1976 to 2005 were used in the models.
After many trials, the following ages were selected for our models: males aged 70
to 99 and females aged 80 to 105.
So, for the three models used in Section 5, the data come from the BDLC, as
corrected by Bourbeau et al. (2003). The last check of our data goes back to
February 2008.
5. Projected mortality rates with three models
In this section, we will present and analyze the results of our modeling and
projections until 2035 for males and females. To avoid any ambiguity, the three
models compared, the Lee-Carter model, the logistic model of Lee-Carter and
Doray and Tang’s model, appear in Table 1. We will first look at the parameters of
the models, then the modeling errors, and finally the projection results.
5.1 Modeling results
The average level of mortality at age x, ax,does not change with time and represents
the basic level of observed mortality. This parameter is valid over the modeling and
projection periods, that is between 1976 and 2035 (Table 2).

12
Figure 3.1 shows that for men up to age 85, the average levels of mortality with age
are more or less similar for the 3 models. Beyond age 85, these levels diverge from
each other: they become lower for Model 1 and higher for Model 3. For Model 2, at
these high ages, the average levels of mortality with age are between those of
Models 1 and 3. For women, the curves of the basic level of mortality look like
those of men (Figure 3.2). However, the differentiation mentioned previously
appears a bit earlier, around age 80.
This parameter alone does not reveal much. However, as expected, for the same
ages, the basic level of mortality is lower among women than men.
The rate of change of mortality at age x, bx, also does not change with time. It
indicates which rates decrease more slowly with respect to others, in response to
changes in the level of mortality at time t (kt). It is valid during the modeling period
(1976-2005) and the projection period (2006-2035). It is defined as
dt
dkb
dt
qdt
xtx )ln( ,
.
Table 3 contains the results. For men, Figure 3.3 shows that the rate of change in
mortality at each age decreases in a constant way. Moreover, the 3 models yield
similar numbers. Figure 3.4 shows this rate of change for women. The decrease is
more erratic than the one observed in men. At high ages, according to the model
considered, this rate differs. Beyond age 90, bx becomes negative and seems higher
for Model 3 and lower for Model 1. Model 2 presents a rate between these other
two models.
In summary, for both sexes, there is no constancy of the rate of change of mortality
across ages, in conformity with the observations. However, for the same ages, let us
mention that this parameter differs a lot with sex: it is higher for women and lower
for men.
The level of mortality at time t, kt, (Table 4) does not change with age. This
parameter represents the change in mortality with time. It is the only parameter that

13
will be projected. For both men and women, it does not vary much with the models:
Figures 3.5 and 3.6 present decreasing and superimposed curves. However, by
comparing this parameter between sexes, we observe that at advances ages, the
change in mortality over time is lower among women, in accordance with
observations.
5.2 Modeling errors
Table 5 gives the average modeling errors for each model. It reveals, for both men
and women, that Model 3, which we have proposed, produce the smallest errors for
the period 1976-2005. Indeed, for men, the average absolute relative errors vary
between 11% and 23% for Model 1, between 5% and 7% for Model 2 and between
2% and 5% for Model 3. For women, these errors vary between 14% and 16% for
Model 1, between 5% and 8% for Model 2 and between 1% and 6% for Model 3.
Finally, let us discuss briefly the error terms of the 3 modelings. For a given year
(across the ages), the error terms are not randomly distributed: the errors decrease as
ages increase. This is however not true when the ages are fixed and we study the
error terms across time, as shown in Table 5.
5.3 Projection Results
The projection of the level of mortality at time t is done with the Box-Jenkins time
series method (Table 6). For the three models, for males, we concluded that an
ARIMA(1, 2, 1) model was the best possible choice, while for women, an ARIMA(1,
1, 1) seemed to be the choice.
Figure 3.7 shows, both for men and women, that projections over the years 2006-
2035 follow the decreasing trendency observed in the modeling period 1976-2005..
However, by comparing both sexes, we observe that, at advanced ages, the level of
mortality at time t, is much lower in women.
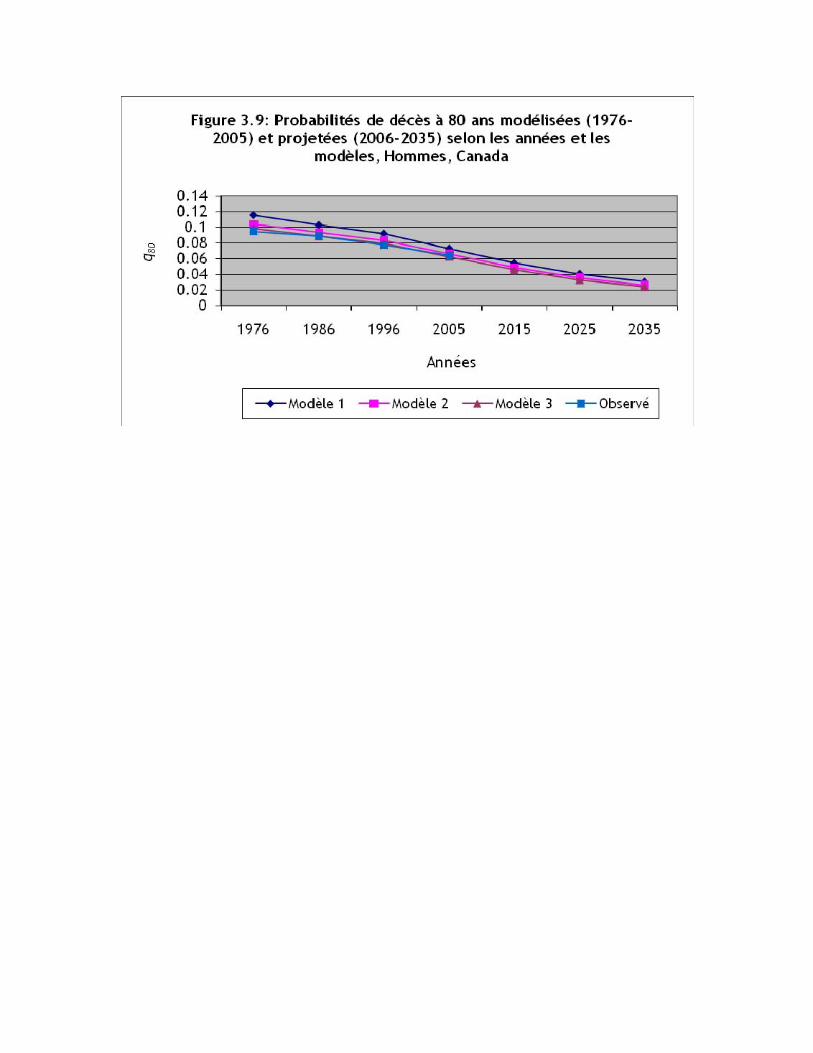
The following Tables and Figures show the modelings and projections of the rate of
mortality for the various models for men (Table 7 and Figures 3.8 to 3.11) and

14
women (Table 8 and Figures 3.12 to 3.14). The projections follow the tendency of
the last 30 years, in accordance with the modeling. However, Figures 3.11 and 3.14
show an increasing tendency for the rates of mortality, a phenomenon which does
not appear in other Figures. As explained by one of the reviewers, one reason for
this might be the fact that, because of medical developments, more persons reach
the age of 100. In the past, you needed to be much stronger yhan nowadays to reach
that age. Compared to the past, the effect of medical developments results in an on
average less healthy population at higher ages.
Consistent with the modelings, we observe, both for men and women, that Model 3
predicts the lowest rates of mortality, for all ages and all years. Moreover, we note
that the phenomenon of convergence between the rates of mortality of men and
women does appear in our numbers.
6- Conclusion
In this paper, we have explained the importance of a good projection of mortality at
advanced ages. Also, we have presented the principal models for projecting
mortality at advanced ages (Gompertz, Heligman-Pollard, Lee-Carter, Weibull, and
Perks and Kannisto's logistic models).
Our study was concentrated on mortality at advanced ages in Canada for separate
sexes. Consequently, we used the BDLC data (Canadian Longevity Database). For
historical and practical reasons, we restricted our modeling to data of years 1976 to
2005. Ages were also restricted, 80 to 105 for women and 70 to 99 for men.
Our principal objective was to compare three models: the original Lee-Carter
model, the logistic model of Lee-Carter and a logistic model we have proposed for
the force of mortality, inspired by a linear reparametrisation of Kannisto's model
(Doray, 2008).

15
The results we have obtained are rather interesting. By following the Lee-Carter
method, we obtained the estimates of the parameters of the 3 models, in order to
establish their performance in modeling mortality at advanced ages. Since they all
have the same number of parameters, the best fitting model should be the one which
best projects mortality. Our results were conclusive: it was Model 3. This model
yielded the smallest mean relative absolute errors, between 1% and 6% for women
and between 2% and 5% for men.
The next step would be to compare the 3 models by modeling and projecting on a
provincial and territorial basis and try to find a way, if possible, to correct the
divergence problems, similarly to what Lee and Li (2005) have done.
References:
Base de données sur la longévité canadienne (BDLC). Département de
démographie, Université de Montréal. Data extracted 30 August 2007.
<www.bdlc.umontreal.ca>.
Bourbeau, R. and Lebel, A. (2000) Mortality Statistics for the Oldest-Old: An
Evaluation of Canadian Data. Demographic Research 2: 2.
Bourbeau, R., Martel, S. and Blackburn, M-E. (2003). Corrections des données sur
les décès dans la Base de données sur la longévité canadienne. Unpublished Report.
Département de démographie, Université de Montréal.
Doray, L.G. (2008). Inference for Logistic-type Models for the Force of Mortality,
International Symposium on Living to 100 and Beyond, Society of Actuaries, SOA
Monograph M–LI08–1, 18p.
Heligman, L. and Pollard, J. H. (1988) The age pattern of mortality. Journal of the
Institute of Actuaries 107, 49-80.

16
Human Mortality Database (HMD). University of California at Berkeley and Max
Planck Institute for Demographic Research. Last update 2005.
<www.mortality.org>.
Kannisto, V. (1992). Presentation at a workshop on old-age mortality, Odense
University, Odense, Denmark.
Kannisto, V. (1996) The Advancing Frontier of Survival, Odense Monographs on
Population Aging, Volumes 1 and 3.
Lee, R. and Carter, L. (1992). Modeling and forecasting U.S. mortality. Journal of
the American Statistical Association 87: 419, 659–671.
Lee, R. D. and Nault, F. (1993) Modeling and Forecasting Provincial Mortality in
Canada. Paper presented at the World Congress of the International Union for the
Scientific Study of Population (IUSSP). Montréal. Canada. August 24th Septembre
1993.
Lee, R. D. (2000). The Lee-Carter method for forecasting mortality, with various
extensions and applications. North American Actuarial Journal 4: 1, 80–93.
Li, N. and Lee, R. D. (2005). Coherent mortality forecasts for a group of
populations: an extension of the Lee-Carter method. Demography 42: 3, 575-594.
Paquette, L. (2006) Projections de la mortalité pour le Canada, les provinces et les
territories 2003-2056, Mémoire de maîtrise, Département de démographie,
Université de Montréal, Montréal, Canada.
Perks, W. (1932). On some experiments on the graduation of mortality statistics,
Journal of the Institute of Actuaries, 63, 12-40.

17
Thatcher A.R., Kannisto, V. and Vaupel, J.W. (1998). The Force of Mortality at
Ages 80-120, Monographs on Population Aging, 5, Odense University Press,
Odense, Denmark.
<http://www.demogr.mpg.de/Papers/Books/Monograph5/start.htm>.
Tuljapurkar, S., Li, N. and Boe, C. (2000) A Universal Pattern of Mortality change
in the G7 Countries. Nature 405: 6788, 789-792.

Table 1 : Model Identification
Model 1 : Lee-Carter 1992 ln(qx,t) = ax + bx kt + ε’x,t
Model 2 : Lee-Carter 2000 logit(qx,t) = ax + bx kt + ε’x,t
Model 3 : Doray and Tang logit(µx,t) = ax + bx kt + ε’x,t

Table 2 : Average level of mortality with age, sex and model, Canada, 1976-2035
Men Women age Model 1 Model 2 Model 3 age Model 1 Model 2 Model 3 70 -3.18204352 -3.28621335 -3.34798480 70 - - - 71 -3.09994952 -3.20401163 -3.26619025 71 - - - 72 -3.01211363 -3.10639781 -3.16349007 72 - - - 73 -2.92795170 -3.01400630 -3.06695287 73 - - - 74 -2.84909954 -2.92368320 -2.97058693 74 - - - 75 -2.76511384 -2.83188699 -2.87488945 75 - - - 76 -2.69251090 -2.74427428 -2.77904223 76 - - - 77 -2.60984435 -2.65359010 -2.68432985 77 - - - 78 -2.53237834 -2.56187247 -2.58486689 78 - - - 79 -2.43764964 -2.45946466 -2.47867963 79 - - - 80 -2.34984465 -2.35620163 -2.36689588 80 -2.68285313 -2.82212896 -2.90808643 81 -2.28004820 -2.27114133 -2.27320069 81 -2.61013183 -2.72632202 -2.79980805 82 -2.20448766 -2.17979448 -2.17294290 82 -2.49898175 -2.60596237 -2.67531693 83 -2.12992218 -2.08659285 -2.06883178 83 -2.42451699 -2.50764020 -2.56376644 84 -2.04441816 -1.98726338 -1.96158795 84 -2.30064416 -2.37581928 -2.42895382 85 -1.98786549 -1.90549822 -1.86407107 85 -2.23057711 -2.28030206 -2.31915593 86 -1.91010244 -1.81131377 -1.75981165 86 -2.10688355 -2.15100462 -2.18836502 87 -1.83997317 -1.72004886 -1.65499098 87 -2.07258864 -2.06616628 -2.07289442 88 -1.76856245 -1.62881939 -1.55060379 88 -2.00765884 -1.97088585 -1.95929172 89 -1.70781454 -1.54677561 -1.45398422 89 -1.91531557 -1.85578625 -1.83080868 90 -1.62823928 -1.44926762 -1.34394308 90 -1.81411188 -1.73755991 -1.70263810 91 -1.56338634 -1.35568830 -1.22907071 91 -1.74328285 -1.63447816 -1.57875691 92 -1.49464389 -1.26142562 -1.11510407 92 -1.67944975 -1.54007716 -1.46344834 93 -1.42293499 -1.16851871 -1.00499108 93 -1.58783294 -1.42574068 -1.33380891 94 -1.36893652 -1.08795424 -0.90197701 94 -1.52458925 -1.33474938 -1.22257004 95 -1.31904734 -1.01131981 -0.80141663 95 -1.47090713 -1.24346100 -1.10218756 96 -1.26406472 -0.92970785 -0.69459324 96 -1.40569526 -1.14690428 -0.98008726 97 -1.21119492 -0.84970276 -0.58734459 97 -1.34281080 -1.05208705 -0.85763837 98 -1.16048632 -0.77143503 -0.47964220 98 -1.28229674 -0.95913704 -0.73476038 99 -1.11193811 -0.69497966 -0.37137763 99 -1.22418125 -0.86819017 -0.61137828
100 - - - 100 -1.16850076 -0.77938682 -0.48739310 101 - - - 101 -1.11528396 -0.69286555 -0.36268582 102 - - - 102 -1.06452870 -0.60875775 -0.23713266 103 - - - 103 -1.01626053 -0.52720540 -0.11057787 104 - - - 104 -0.97048443 -0.44835016 0.01713162 105 - - - 105 -0.92716795 -0.37228938 0.14622521


Table 3 : Rate of change of the mortality rate with age, sex and model, Canada, 1976-2035

Men Women
age Model1 Model 2 Model 3 age Model 1 Model 2 Model 3 70 0.07210403 0.06890087 0.06708072 70 - - -
71 0.07364519 0.07057112 0.06881078 71 - - - 72 0.07067324 0.06794568 0.06637011 72 - - -
73 0.06859812 0.06621208 0.06481716 73 - - - 74 0.06498966 0.06299572 0.06181034 74 - - - 75 0.06351102 0.06184477 0.06083741 75 - - -
76 0.05839836 0.05711693 0.05632533 76 - - -
77 0.05724180 0.05629042 0.05568006 77 - - -
78 0.05317639 0.05262208 0.05223995 78 - - -
79 0.05318571 0.05298184 0.05280129 79 - - -
80 0.04962112 0.04981081 0.04986796 80 0.11679365 0.11609824 0.12962301 81 0.04571715 0.04622303 0.04647334 81 0.10646365 0.10643680 0.11905998 82 0.04222711 0.04310457 0.04359209 82 0.10560140 0.10626795 0.11920961 83 0.03773650 0.03890163 0.03958120 83 0.09558087 0.09675447 0.10877402 84 0.03654737 0.03809266 0.03903154 84 0.09708688 0.09915176 0.11139111 85 0.02884471 0.03039679 0.03136613 85 0.08700481 0.08954897 0.10063427 86 0.02695992 0.02878421 0.02996127 86 0.09116394 0.09481379 0.10677859 87 0.02299737 0.02492884 0.02621587 87 0.06675536 0.07025309 0.07941956 88 0.02021345 0.02220168 0.02356413 88 0.05534959 0.05881441 0.06595362 89 0.01646125 0.01838041 0.01973760 89 0.05068624 0.05470418 0.06191195 90 0.01640892 0.01862241 0.02024864 90 0.05053625 0.05536356 0.06350186 91 0.01121704 0.01301513 0.01438885 91 0.04100080 0.04564489 0.05192641 92 0.00840677 0.00998806 0.01125019 92 0.03234847 0.03653749 0.04202905 93 0.00840130 0.01012837 0.01156463 93 0.03142079 0.03610946 0.04093458 94 0.00504955 0.00634316 0.00748746 94 0.02574822 0.02999839 0.03346290 95 0.00141127 0.00185783 0.00225268 95 0.01517380 0.01793892 0.01896466 96 -0.00071640 -0.00082957 -0.00095761 96 0.00989592 0.01180430 0.01114627 97 -0.00265628 -0.00340344 -0.00419014 97 0.00501254 0.00587297 0.00328339 98 -0.00440631 -0.00585483 -0.00745348 98 0.00054480 0.00017253 -0.00463990 99 -0.00596533 -0.00817327 -0.01075550 99 -0.00348456 -0.00525870 -0.01262770 100 - - - 100 -0.00706764 -0.01039369 -0.02070626 101 - - - 101 -0.01020391 -0.01520644 -0.02890661 102 - - - 102 -0.01288864 -0.01965663 -0.03724242 103 - - - 103 -0.01513995 -0.02372898 -0.04577019 104 - - - 104 -0.01697398 -0.02739921 -0.05453228 105 - - - 105 -0.01840931 -0.03064254 -0.06357948
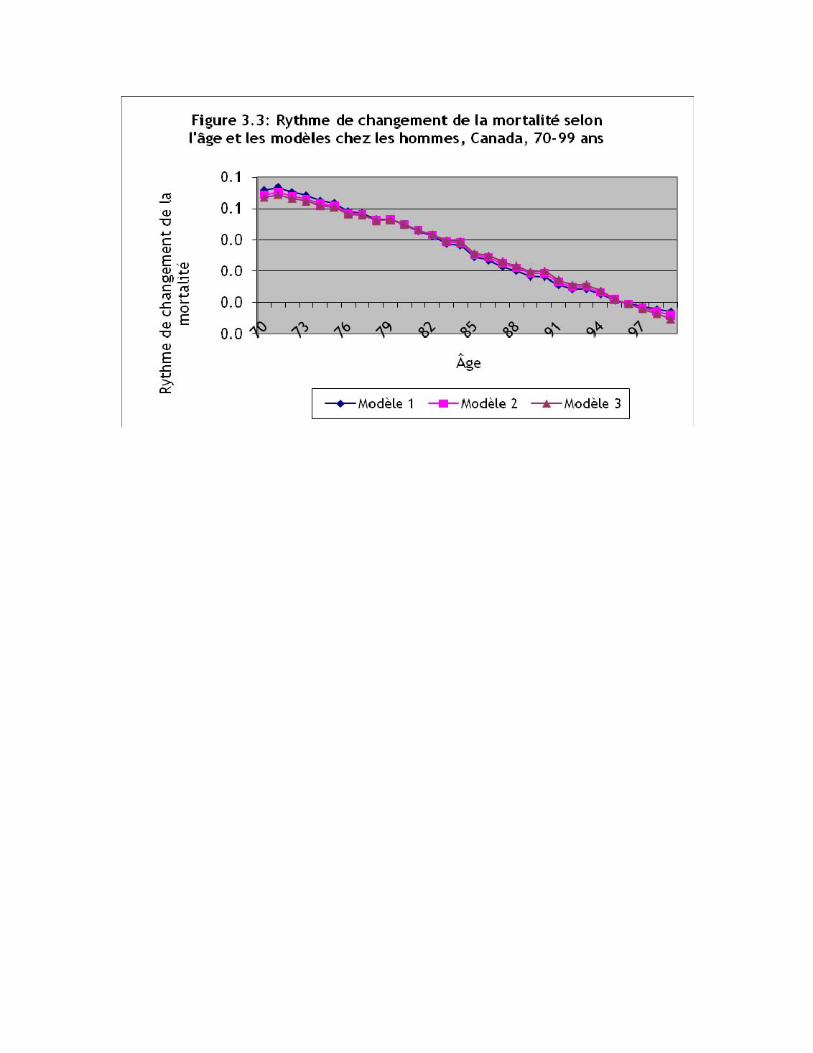


Table 4 : Level of mortality at time t with sex and model, Canada Men aged 70-99 and Women aged 80-105
Men Women year Model 1 Model 2 Model 3 year Model 1 Model 2 Model 3 1976 3,88639709 4,05277458 4,15219965 1976 2,10101073 2,29260980 2,20443316 1977 3,08214516 3,22147394 3,30342473 1977 1,46895410 1,63963291 1,60009796 1978 2,80790686 2,93454718 3,00643774 1978 1,17242414 1,31618924 1,29093220 1979 2,24891058 2,35564595 2,41435598 1979 0,71867233 0,83745826 0,84062370 1980 2,56230167 2,68890120 2,75841973 1980 0,92727254 1,01451811 0,98217089 1981 2,02793548 2,14111265 2,20283933 1981 0,48842658 0,56032392 0,55866325 1982 2,26937817 2,40061245 2,47308538 1982 0,77010512 0,81841024 0,77918204 1983 1,83121644 1,95326041 2,02134751 1983 0,36962653 0,39709061 0,38203760 1984 1,56637357 1,68386555 1,75002045 1984 0,23191346 0,24180937 0,22876217 1985 1,83844729 1,97325656 2,05079021 1985 0,43498194 0,44002995 0,40488683 1986 1,50489732 1,63267488 1,70811268 1986 0,61428450 0,61608550 0,56198960 1987 1,08563939 1,18901836 1,25043770 1987 0,29317147 0,28475714 0,25297404 1988 1,45111270 1,56394465 1,63316645 1988 0,39201985 0,38289173 0,34163717 1989 0,84408954 0,92535190 0,97745927 1989 0,03367894 0,01908828 0,00580633 1990 0,31581745 0,36828882 0,40296912 1990 -0,07561404 -0,09771536 -0,10555413 1991 0,16402720 0,21198563 0,24497182 1991 -0,20801061 -0,23286518 -0,23100251 1992 -0,24428977 -0,21319935 -0,19029964 1992 -0,47671243 -0,51150982 -0,49099919 1993 0,00519922 0,04329495 0,07086017 1993 -0,09032436 -0,11570677 -0,12410362 1994 -0,38461008 -0,37114273 -0,35846283 1994 -0,14715241 -0,17147978 -0,17371049 1995 -0,46839225 -0,46776572 -0,46288146 1995 -0,16793118 -0,18673184 -0,18376207 1996 -0,75461969 -0,77850844 -0,78884034 1996 -0,24636651 -0,27327605 -0,26702294 1997 -0,96374853 -1,00947297 -1,03326328 1997 -0,12746842 -0,16027277 -0,16642327 1998 -1,08356291 -1,14527854 -1,17876150 1998 -0,27700924 -0,32465452 -0,32406915 1999 -1,49641299 -1,58953097 -1,64276708 1999 -0,42775314 -0,48618341 -0,47653579 2000 -2,60456586 -2,75725974 -2,84602562 2000 -0,78810859 -0,85524029 -0,81821522 2001 -3,25054125 -3,45025643 -3,56785999 2001 -0,98315477 -1,05609564 -1,00593089 2002 -3,68891079 -3,92999761 -4,07344491 2002 -1,06952751 -1,14634806 -1,09135864 2003 -4,07137234 -4,35641314 -4,52733531 2003 -1,38078668 -1,46826901 -1,39233983 2004 -5,00146743 -5,36410487 -5,58326232 2004 -1,66692270 -1,77000254 -1,67851602 2005 -5,47930124 -5,90707918 -6,16769367 2005 -1,88369964 -2,00454403 -1,90465318


Table 5 : Modeling errors with sex and model, Canada, 1976-2005
Men Women

Type of error Year Model 1 Model 2 Model 3 Model 1 Model 2 Model 3 Mean relative 1976 -11.5 -3.3 0.7 -8.9 -1.1 2.7
Error (%) 1986 -22.4 -5.2 -1.5 -13.2 -5.2 -1.4 1996 -11.0 -3.8 -0.1 -12.1 -4.2 -0.4 2005 -6.4 0.7 4.3 -13.5 -5.7 -2.0
Mean absolute 1976 14.2 6.2 3.1 16.0 8.2 6.1 Relative error 1986 22.4 5.2 2.1 14.3 5.4 1.6
(%) 1996 12.7 6.0 2.8 14.8 6.0 1.9 2005 11.0 4.8 4.4 14.3 5.7 2.2
Mean error 1976 0.006433 -0.000562 -0.003984 -0.000704 -0.008033 -0.012249 1986 0.011127 0.005374 0.002495 0.012033 0.005613 0.002405
1996 0.005073 -0.000001 -0.002569 0.006861 0.001122 -0.001492 2005 -0.002967 -0.007187 -0.009409 0.010683 0.005939 0.004318
Mean absolute 1976 0.014923 0.008080 0.005978 0.024829 0.016194 0.014863 Error 1986 0.011127 0.005502 0.003217 0.016062 0.006116 0.002662
1996 0.010191 0.005911 0.004187 0.017073 0.007595 0.003353 2005 0.012170 0.009245 0.009471 0.014031 0.006002 0.004503
Mean 1976 0.000255 0.000105 0.000083 0.000783 0.000407 0.000371 Quadratic 1986 0.000143 0.000037 0.000020 0.000322 0.000049 0.000008
Error 1996 0.000124 0.000045 0.000034 0.000349 0.000073 0.000017 2005 0.000329 0.000281 0.000276 0.000240 0.000046 0.000031
Table 6 : Level of mortality at time t (modeled 1976 to 2005 and projected 2006 à 2035) with sex and model, Canada
Men Women year Model 1 Model 2 Model 3 Model 1 Model 2 Model 3 1976 3.8864 4.0528 4.1522 2.1010 2.2926 2.2044 1977 3.0821 3.2215 3.3034 1.4690 1.6396 1.6001 1978 2.8079 2.9345 3.0064 1.1724 1.3162 1.2909 1979 2.2489 2.3556 2.4144 0.7187 0.8375 0.8406

1980 2.5623 2.6889 2.7584 0.9273 1.0145 0.9822 1981 2.0279 2.1411 2.2028 0.4884 0.5603 0.5587 1982 2.2694 2.4006 2.4731 0.7701 0.8184 0.7792 1983 1.8312 1.9533 2.0213 0.3696 0.3971 0.3820 1984 1.5664 1.6839 1.7500 0.2319 0.2418 0.2288 1985 1.8384 1.9733 2.0508 0.4350 0.4400 0.4049 1986 1.5049 1.6327 1.7081 0.6143 0.6161 0.5620 1987 1.0856 1.1890 1.2504 0.2932 0.2848 0.2530 1988 1.4511 1.5639 1.6332 0.3920 0.3829 0.3416 1989 0.8441 0.9254 0.9775 0.0337 0.0191 0.0058 1990 0.3158 0.3683 0.4030 -0.0756 -0.0977 -0.1056 1991 0.1640 0.2120 0.2450 -0.2080 -0.2329 -0.2310 1992 -0.2443 -0.2132 -0.1903 -0.4767 -0.5115 -0.4910 1993 0.0052 0.0433 0.0709 -0.0903 -0.1157 -0.1241 1994 -0.3846 -0.3711 -0.3585 -0.1472 -0.1715 -0.1737 1995 -0.4684 -0.4678 -0.4629 -0.1679 -0.1867 -0.1838 1996 -0.7546 -0.7785 -0.7888 -0.2464 -0.2733 -0.2670 1997 -0.9637 -1.0095 -1.0333 -0.1275 -0.1603 -0.1664 1998 -1.0836 -1.1453 -1.1788 -0.2770 -0.3247 -0.3241 1999 -1.4964 -1.5895 -1.6428 -0.4278 -0.4862 -0.4765 2000 -2.6046 -2.7573 -2.8460 -0.7881 -0.8552 -0.8182 2001 -3.2505 -3.4503 -3.5679 -0.9832 -1.0561 -1.0059 2002 -3.6889 -3.9300 -4.0734 -1.0695 -1.1463 -1.0914 2003 -4.0714 -4.3564 -4.5273 -1.3808 -1.4683 -1.3923 2004 -5.0015 -5.3641 -5.5833 -1.6669 -1.7700 -1.6785 2005 -5.4793 -5.9071 -6.1677 -1.8837 -2.0045 -1.9047 2006 -6.0996 -6.5885 -6.8876 -2.0061 -2.1384 -2.0336 2007 -6.6725 -7.2233 -7.5617 -2.1284 -2.2723 -2.1623 2008 -7.2611 -7.8738 -8.2513 -2.2507 -2.4061 -2.2910 2009 -7.8445 -8.5191 -8.9357 -2.3730 -2.5399 -2.4194 2010 -8.4297 -9.1661 -9.6218 -2.4952 -2.6737 -2.5478 2011 -9.0142 -9.8125 -10.3074 -2.6175 -2.8074 -2.6760 2012 -9.5990 -10.4591 -10.9931 -2.7397 -2.9412 -2.8040 2013 -10.1837 -11.1056 -11.6788 -2.8618 -3.0748 -2.9319 2014 -10.7684 -11.7522 -12.3645 -2.9840 -3.2085 -3.0597 2015 -11.3531 -12.3988 -13.0502 -3.1061 -3.3421 -3.1873 2016 -11.9378 -13.0453 -13.7359 -3.2282 -3.4758 -3.3148 2017 -12.5225 -13.6919 -14.4215 -3.3503 -3.6093 -3.4421 2018 -13.1072 -14.3385 -15.1072 -3.4723 -3.7429 -3.5693 2019 -13.6919 -14.9850 -15.7929 -3.5944 -3.8764 -3.6964 2020 -14.2767 -15.6316 -16.4786 -3.7164 -4.0099 -3.8233 2021 -14.8614 -16.2781 -17.1643 -3.8383 -4.1434 -3.9501 2022 -15.4461 -16.9247 -17.8500 -3.9603 -4.2768 -4.0767 2023 -16.0308 -17.5713 -18.5357 -4.0822 -4.4102 -4.2032 2024 -16.6155 -18.2178 -19.2214 -4.2041 -4.5436 -4.3295 2025 -17.2002 -18.8644 -19.9071 -4.3260 -4.6770 -4.4557 2026 -17.7849 -19.5109 -20.5927 -4.4478 -4.8103 -4.5818 2027 -18.3696 -20.1575 -21.2784 -4.5696 -4.9436 -4.7077 2028 -18.9543 -20.8041 -21.9641 -4.6914 -5.0769 -4.8335 2029 -19.5390 -21.4506 -22.6498 -4.8132 -5.2101 -4.9591

2030 -20.1238 -22.0972 -23.3355 -4.9349 -5.3434 -5.0846 2031 -20.7085 -22.7437 -24.0212 -5.0567 -5.4765 -5.2100 2032 -21.2932 -23.3903 -24.7069 -5.1783 -5.6097 -5.3352 2033 -21.8779 -24.0369 -25.3926 -5.3000 -5.7428 -5.4603 2034 -22.4626 -24.6834 -26.0783 -5.4217 -5.8760 -5.5852 2035 -23.0473 -25.3300 -26.7639 -5.5433 -6.0090 -5.7100

Table 7: Rates of mortality with age, year and model

Men Canada
Model 1 Model 2 Model 3
age year qx,t qx,t qx,t
70 1976 0.0549 0.0471 0.0434 1986 0.0463 0.0402 0.0372 1996 0.0393 0.0342 0.0318 2005 0.0280 0.0243 0.0225 2015 0.0183 0.0157 0.0143 2025 0.0120 0.0101 0.0091 2035 0.0079 0.0065 0.0058
80 1976 0.1157 0.1039 0.0982 1986 0.1028 0.0932 0.0885 1996 0.0919 0.0836 0.0794 2005 0.0727 0.0660 0.0625 2015 0.0543 0.0486 0.0456 2025 0.0406 0.0357 0.0330 2035 0.0304 0.0261 0.0238
90 1976 0.2092 0.2020 0.1983 1986 0.2012 0.1948 0.1915 1996 0.1939 0.1879 0.1847 2005 0.1794 0.1738 0.1707 2015 0.1629 0.1571 0.1537 2025 0.1480 0.1418 0.1379 2035 0.1345 0.1278 0.1234
99 1976 0.3214 0.3256 0.3280 1986 0.3260 0.3300 0.3322 1996 0.3304 0.3343 0.3365 2005 0.3398 0.3437 0.3458 2015 0.3520 0.3558 0.3576 2025 0.3645 0.3680 0.3692 2035 0.3774 0.3804 0.3807
Table 8: Rates of mortality with age, year and model

Women, Canada
Model 1 Model 2 Model 3
age t qx,t qx,t qx,t
80 1976 0.0874 0.0720 0.0655 1986 0.0735 0.0601 0.0539 1996 0.0664 0.0545 0.0488 2005 0.0549 0.0450 0.0401 2015 0.0476 0.0388 0.0342 2025 0.0413 0.0334 0.0293 2035 0.0358 0.0288 0.0251
90 1976 0.1812 0.1665 0.1591 1986 0.1681 0.1540 0.1469 1996 0.1610 0.1477 0.1409 2005 0.1482 0.1360 0.1298 2015 0.1393 0.1276 0.1215 2025 0.1310 0.1196 0.1137 2035 0.1232 0.1120 0.1064
100 1976 0.3063 0.3093 0.3091 1986 0.3095 0.3131 0.3146 1996 0.3114 0.3151 0.3174 2005 0.3150 0.3190 0.3228 2015 0.3177 0.3220 0.3271 2025 0.3205 0.3250 0.3313 2035 0.3233 0.3281 0.3355