Embed Size (px)
Citation preview

ESMA Risk Dashboard No. 4, 2016

ESMA Risk Dashboard No. 4, 2016 2
ESMA Risk Dashboard No. 4, 2016
© European Securities and Markets Authority, Paris, 2016. All rights reserved. Brief excerpts may be reproduced or translated provided the source is cited adequately. The reporting period of this document is 1 July 2016 to 30 September 2016, unless indicated otherwise. Legal reference of this Report: Regulation (EU) No 1095/2010 of the European Parliament and of the Council of 24 November 2010 establishing a European Supervisory Authority (European Securities and Markets Authority), amending Decision No 716/2009/EC and repealing Commission Decision 2009/77/EC, Article 32 “Assessment of market developments”, 1. “The Authority shall monitor and assess market developments in the area of its competence and, where necessary, inform the European Supervisory Authority (European Banking Authority), and the European Supervisory Authority (European Insurance and Occupational Pensions Authority), the ESRB and the European Parliament, the Council and the Commission about the relevant micro-prudential trends, potential risks and vulnerabilities. The Authority shall include in its assessments an economic analysis of the markets in which financial market participants operate, and an assessment of the impact of potential market developments on such financial market participants.” The charts and analyses in this report are, fully or in parts, based on data not proprietary to ESMA, including from commercial data providers and public authorities. ESMA uses these data in good faith and does not take responsibility for their accuracy or completeness. ESMA is committed to constantly improving its data sources and reserves the right to alter data sources at any time. The third-party data used in this publication may be subject to provider-specific disclaimers, especially regarding its ownership, its reuse by non-customers and, in particular, the accuracy, completeness or timeliness of the data provided and the provider’s liability related to those. Please consult the websites of the individual data providers, whose names are detailed throughout this report, for more details on these disclaimers.
European Securities and Markets Authority (ESMA) Risk Assessment and Economics Department 103, Rue de Grenelle FR–75007 Paris [email protected]

ESMA Risk Dashboard No. 4, 2016 3
ESMA Risk Dashboard
R.1
Main risks
Risk segments Risk categories Risk sources
Risk Outlook Risk Outlook
Outlook
Overall ESMA remit Liquidity
Macroeconomic environment
Systemic stress Market
Low interest rate environment
Securities markets Contagion
EU sovereign debt markets
Investors Credit
Market functioning
Infrastructures and services Operational
Political and event risks Note: Assessment of main risks by risk segments for markets under ESMA remit since last assessment, and outlook for forthcoming quarter. Assessment of main risks by risk categories and sources for markets under ESMA remit since last assessment, and outlook for forthcoming quarter. Risk assessment based on categorisation of the ESA Joint Committee. Colours indicate current risk intensity. Coding: green=potential risk, yellow=elevated risk, orange=high risk, red=very high risk. Upward arrows indicate an increase in risk intensities, downward arrows a decrease, horizontal arrows no change. Change is measured with respect to the previous quarter; the outlook refers to the forthcoming quarter. ESMA risk assessment based on quantitative indicators and analyst judgement.
ESMA’s 3Q16 overall risk assessment remains unchanged from 2Q16. Market developments at the beginning of 3Q16 were dominated by the strong reactions to the outcome of the UK referendum, reflecting high economic and political uncertainty. In the same manner, markets were taken by surprise and briefly disrupted by the outcome of the US Presidential Election in early November. Investment fund liquidity remained a concern following the temporary redemption suspensions by several open-ended UK real estate funds. From mid-July volatility abated and equity prices recovered, yet concerns about financials remained with banks’ valuations reaching historical lows. While main risks remain high, our outlook for market, liquidity and contagion risk is now assessed to be stable. From a wider perspective, the low yield environment and related sustained concerns with regard to excessive risk taking persisted. Geopolitical and economic uncertainty impacted on macroeconomic forecasts, weakening the EU economic growth outlook in the medium-long term.
Risk summary
In 3Q16, risks in the markets under ESMA remit
remained at high levels, reflecting very high risk
in securities markets, and elevated risk for
investors, infrastructures and services. Our
assessment of the individual risk categories did
not change from 2Q16, with market and credit risk
remaining very high due to the persisting low-
interest rate environment, high uncertainty in EU
growth prospects and geopolitical developments
and due to recent turmoil in the banking market.
Liquidity risk in 3Q16 is still assessed as high, as
liquidity pressures were registered in equity and
corporate bond markets as well as in segments
of the fund industry. Contagion risk remains high,
driven by high levels of interconnectedness
between different segments of financial markets
amplified by the low-yield environment and
associated incentives for high risk taking. The risk
outlook is stable across all risk categories,
reflecting market signs of absorption of the
uncertainty and volatility following the UK
referendum in early 3Q16.
Systemic stress declined in 3Q16 after having
ticked up in late June following the UK
referendum. The improvements in both equity
and bond markets, with valuations reinforced by
supportive EA monetary policy, explained most of
the reduction in the composite indicator of
systemic stress (CISS) (R.2). Despite this, key
risk sources remained, including the weak and
uneven economic growth outlook in the EU, slow
implementation of national structural reforms and
uncertainty related to the political developments
around the outcome of the UK referendum.
R.2 ESMA composite systemic stress indicator
Systemic risk decreased in first part of 3Q16
-0.4
-0.2
0
0.2
0.4
0.6
Sep-12 Sep-13 Sep-14 Sep-15 Sep-16
Equity market contribution Bond market contribution
Money market contribution ESMA CISS
Correla tion contribution
Note: ESMA version of the ECB-CISS indicator measuring systemic s tress insecurities markets. I t focuses on thr ee financial market segments: equity, bondand money markets, aggregated through s tandar d portfolio theory. It is based on
securities market indicators such as volatilities and risk spreads.Sources: ECB, ESMA.

ESMA Risk Dashboard No. 4, 2016 4
Risk sources
Macroeconomic environment: Economic
recovery in 3Q16 proceeded at a moderate pace
in EU, with persisting growth divergences across
EU Member States. Particularly in the UK, the
outlook for growth in the short to medium term
has weakened. As a result, the GPB depreciated
significantly, falling more than 15% against the
EUR since the UK referendum. UK slower growth
may weigh also on the euro area export growth in
the longer term. In the Eurozone signals on the
impact of the UK referendum vote were mixed. In
July 2016 the Purchasing Managers Index
reached a seven-month high – however with
divergences between Member States. On the
other hand, uncertainty is expected to slow
private consumption and investment growth.
Overall, the cumulated GDP loss associated with
the UK leaving the EU is expected to be in the
range of 1 to 2.75% in the UK, and of 0.25 to 0.5%
in the Eurozone, according to simulations by the
European Commission.1 In the medium-to-long
term economic outlook risk sources are Brexit-
related political developments and the potential
prospect of monetary policy inside and outside
the EU becoming less accommodative.
Low-interest rate environment: Risks stemming
from the low-interest environment persisted as
monetary policies in the EU remained
accommodative. ECB and BoE continued with
outright purchases of investment-grade bonds
issued by non-financial corporates. Both EU
corporate and sovereign bond spreads continued
on average to decrease in 3Q16 (R.8 and R.12).
Sustained search-for-yield strategies thus
remained a source of concern. Particularly, in
3Q16 investments into emerging market equity
and bond funds have increased markedly, with
inflows of EUR 27.3bn, the highest since 3Q14.
Conversely, redemptions from equity funds
investing in EU increased by 25bn, as recent EU
bank equities’ performance may have weighed
on investors’ appetite for EU equity funds (R.25).
Funds investing in EU bonds registered instead
inflows of EUR 2.9bn in 3Q16 (R.26); towards the
end of the reporting period, signs of a potential
trend-reversal emerged and need to be
monitored. In this context, excessive risk-taking
and capital misallocation coupled with the
economic and political uncertainty following the
UK referendum are potential risk sources in the
medium-term outlook.
EU sovereign debt markets: Long-term EU
sovereign bond risk premia, on average, edged
1 European Commission (DG ECFIN) (2016), “The
economic outlook after the UK referendum: a first
down in 3Q16, reflecting the results of the
combination of investors seeking safer assets,
given heightened uncertainty after the UK
referendum, the low-interest rate environment
and supportive monetary policy. Issuance of
sovereign bond with long-dated maturities
increased. Related to the ultra-low interest rate
environment, investors preferred the added yield
of long dated maturities and at the same time EU
governments were extending the average life of
their public debt locking in low borrowing rates.
Market functioning: No significant disruptions in
the functioning of EU markets were observed in
3Q16. EU financial markets proved to be resilient
during the period of high market volatility
observed at the beginning of 3Q16. In 3Q16 the
new EU Benchmark Regulation entered into force
and the Euribor was designated as a critical
benchmark. As such, it is now subject to a college
of supervisors for the key decisions. In 3Q16 two
banks ceased contributing to the Euribor, with
now 20 banks contributing.
Political and event risk: The UK EU referendum
created substantial uncertainty regarding the
future economic outlook and EU institutional
arrangements, with key aspects to be negotiated
over the coming months, and possibly years.
Focus on the news flow and announcements may
result in intensified political and event risk,
contributing to uncertainty and greater asset price
volatility in EU markets. An indication of this
market reactiveness is the recent and sustained
fall in the GBP, triggered by the announcement of
the UK Prime Minister that the procedure to leave
EU will be started by March 2017. In November,
financial markets experienced a period of
additional volatility in the run-up to the US
Presidential elections as electoral uncertainties
weighed on market sentiment. The unexpected
election outcome triggered initial falls in global
markets, which were however quickly reversed.
Going forward, additional market uncertainties
may result from important electoral events in
some EU Member States.
Risk categories
Market risk – very high, outlook stable: Market
risk remained very high, yet now with a stable
outlook. Markets continued to be highly reactive
to political and event risks. At the beginning of
3Q16 equity prices decreased in the wake of the
UK referendum outcome, yet rebounded from the
second week of July (R.17). EU financial sector
equity prices were particularly affected after the
assessment for the Euro Area and the EU”, Institutional Paper 032, July.

ESMA Risk Dashboard No. 4, 2016 5
referendum, but also in the two days following the
EBA stress test results (-6.7%) and towards the
end of 3Q16. Here, additional concerns related to
the level of non-performing loans in some banks
and concerns related to bank business models in
a low-interest rate environment contributed to
price pressures. Volatility in equity and foreign
exchange markets followed a similar pattern.
Market expectation of equity price volatility
1MVSTOXX increased (+10% at the beginning of
July reaching 28%, against a long-term average
of 25%), but reverted in the remainder of 3Q16
(19% at end 3Q16) (R.7). In the foreign exchange
market, implied volatilities for 3M options on main
exchange rates increased slightly in the first week
of July before falling back to the downward trend
initiated after the peak of mid-June (R.6).
Liquidity risk – high, outlook stable: Liquidity risk
remained high, yet now with a stable outlook.
Equity market illiquidity increased, reaching a
level above the two-year moving average (R.4).
Similarly, EU corporate bond markets continued
to register liquidity pressures for most of 3Q16
(R.13). In the wake of the UK referendum signs
of stress in the government bond collateral
markets were also observed with increased
levels of repo specialness (R.11). On the other
hand, sovereign bid-ask spreads decreased
slightly (R.9). Market liquidity concerns emerged
also in the recent price developments in UK
property markets and related redemption
suspensions or withdrawal discounts of several
real estate funds observed in July 2016. The AuM
of UK real estate funds in August 2016 stood at
EUR 33.5bn, 10% less than their value before the
UK referendum. This highlighted the potential
vulnerability of funds that offer daily redemption
while investing in potentially illiquid assets.
Additionally, in 3Q16 UK-domiciled equity funds
saw redemptions of EUR 4.2bn.
Contagion risk – high, stable outlook: Contagion
risk remained high, yet now with a stable outlook
as tensions after the UK referendum have eased.
Concerns remained regarding the increasing
interconnectedness of the asset management
sector with the banking and insurance sectors
and the associated potential for spillovers. High
correlation in market valuation across sectors
continued to being observed at the beginning of
3Q16 (R.27). Both correlations between the
yields on ten-year German sovereign benchmark
bond and other EU countries’ sovereign bond
yield and their dispersion increased in early
3Q16, before reverting at the end of the reporting
2 CPMI-IOSCO: Guidance on cyber resilience for
financial market infrastructures.
period (R.16). Within the hedge fund industry
intra-sectorial contagion increased following the
UK referendum, in particular with regard to funds
reinforcing the sector’s performance trend.
Credit risk – very high, outlook stable: Credit risk
remained at a very high level, with a stable
outlook. In 3Q16 high yield bond issuance
amounted to EUR 21bn (+50% compared to
3Q15) and investment grade bond issuance
amounted to EUR 161.8bn (+48% from June
2016). Corporate bond spreads decreased on
average by 25.6% in 3Q16 across all rating
categories except for AAA-rated bonds whose
spread increased from 15bps in 2Q16 to 20bps in
3Q16. The difference between AAA-rated and
BBB-rated bond yield spreads decreased by
31bps to 92bps (R.12). However, high valuations
in the corporate bond markets fuelled by the
combination of the accommodative monetary
policy and search-for-yield strategies may
indicate inadequately low default risk premia. An
indication for this is the recent decoupling of
spreads in the corporate bond and corporate
CDS markets. In 3Q16 corporate bond spreads
decreased by about 20 bps while corporate CDS
spreads declined by about 10 bps.
Operational risk – elevated, stable outlook:
Operational risk remained elevated, with a stable
outlook. Technology and conduct risks remain a
key concern both within and outside the EU.
Regarding cyber-security CPMI/IOSCO released
guidance on cyber resilience for financial market
infrastructures2 and the EU Parliament approved
the adoption of the first EU-wide rules on
cybersecurity 3, which impose a minimum level of
security for digital technologies, networks and
services across all EU Member States. Conduct
risk issues emerged in the context of a US lawsuit
against a group of international banks accused of
manipulation on the main Australian benchmark
rate. Additionally, in September 2016 the U.S.
Department of Justice has proposed a very high
settlement for Deutsche Bank for its alleged mis-
selling of residential mortgage-backed securities
before the 2008 financial crisis. On a positive
note, the EU financial market infrastructure
proved to be resilient through the period of high
volatility registered in early 3Q16. However, on 6
October 2016 the GBP suffered a sudden fall of
6.1% in two minutes on Asian venues against the
USD before recovering most of its losses.
Causes are still investigated, however this “flash-
crash” style event highlights the importance of
appropriate trading halt mechanisms.
3 Directive on security of network and information systems.
ESMA Risk Dashboard No. 4, 2016 6
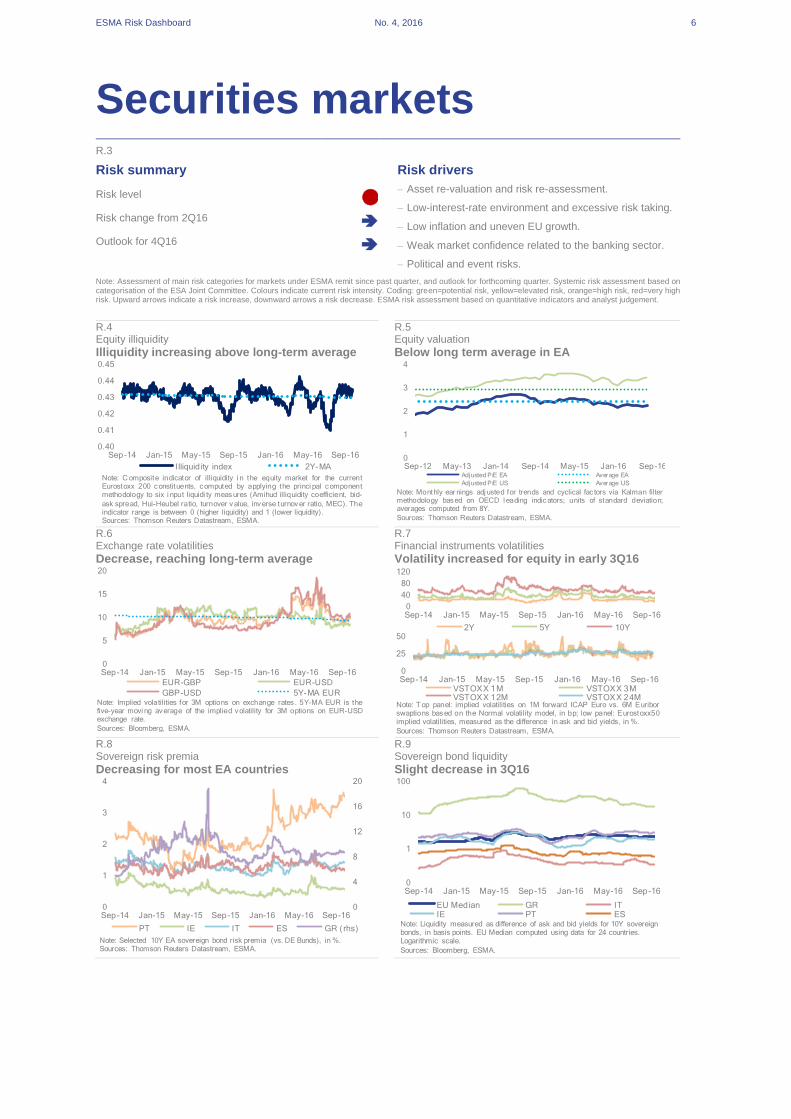
Securities markets R.3
Risk summary Risk drivers
Risk level – Asset re-valuation and risk re-assessment.
– Low-interest-rate environment and excessive risk taking.
– Low inflation and uneven EU growth.
– Weak market confidence related to the banking sector.
– Political and event risks.
Risk change from 2Q16
Outlook for 4Q16
Note: Assessment of main risk categories for markets under ESMA remit since past quarter, and outlook for forthcoming quarter. Systemic risk assessment based on categorisation of the ESA Joint Committee. Colours indicate current risk intensity. Coding: green=potential risk, yellow=elevated risk, orange=high risk, red=very high risk. Upward arrows indicate a risk increase, downward arrows a risk decrease. ESMA risk assessment based on quantitative indicators and analyst judgement.
R.4 R.5 Equity illiquidity Equity valuation
Illiquidity increasing above long-term average Below long term average in EA
R.6 R.7 Exchange rate volatilities Financial instruments volatilities
Decrease, reaching long-term average Volatility increased for equity in early 3Q16
R.8 R.9 Sovereign risk premia Sovereign bond liquidity
Decreasing for most EA countries Slight decrease in 3Q16
0.40
0.41
0.42
0.43
0.44
0.45
Sep-14 Jan-15 May-15 Sep-15 Jan-16 May-16 Sep-16
Illiquid ity index 2Y-MA
Note: C omposite indicator of illiquidity i n the equity market for the currentEurostoxx 200 constituents, computed by applying the princi pal componentmethodology to six i nput liquidi ty measures (Amihud illiquidity coefficient, bid-
ask spread, Hui-Heubel ratio, turnover value, inverse turnover ratio, MEC). Theindicator range is between 0 (higher liquidity) and 1 (lower liquidity).Sources: Thomson Reuters Datastream, ESMA.
0
1
2
3
4
Sep-12 May-13 Jan-14 Sep-14 May-15 Jan-16 Sep-16Adjusted P/E EA Average EA
Adjusted P/E US Average US
Note: Monthly ear nings adj usted for trends and cyclical fac tors via Kalman filtermethodology based on OECD l eading indicators; units of standard deviation;averages computed from 8Y.
Sources: Thomson Reuters Datastream, ESMA.
0
5
10
15
20
Sep-14 Jan-15 May-15 Sep-15 Jan-16 May-16 Sep-16
EUR-GBP EUR-USD
GBP-USD 5Y-MA EURNote: Implied volatilities for 3M options on exchange rates. 5Y-MA EUR is thefive-year movi ng average of the implied volatility for 3M options on EUR-USDexchange rate.
Sources: Bloomberg, ESMA.
0
25
50
Sep-14 Jan-15 May-15 Sep-15 Jan-16 May-16 Sep-16VSTOXX 1M VSTOXX 3MVSTOXX 12M VSTOXX 24M
Note: T op panel: implied volatilities on 1M forward ICAP Euro vs. 6M Euriborswaptions based on the Normal volatility model, in bp; low panel: Eurostoxx50implied volatilities, measured as the difference in ask and bid yields, in %.
Sources: Thomson Reuters Datastream, ESMA.
0
40
80
120
Sep-14 Jan-15 May-15 Sep-15 Jan-16 May-16 Sep-16
2Y 5Y 10Y
0
4
8
12
16
20
0
1
2
3
4
Sep-14 Jan-15 May-15 Sep-15 Jan-16 May-16 Sep-16
PT IE IT ES GR ( rhs)
Note: Selected 10Y EA sovereign bond risk premia (vs. DE Bunds), in %.Sources: Thomson Reuters Datastream, ESMA.
0
1
10
100
Sep-14 Jan-15 May-15 Sep-15 Jan-16 May-16 Sep-16
EU Median GR ITIE PT ES
Note: Liquidity measured as difference of ask and bid yields for 10Y sovereign bonds, in basis points. EU Median computed using data for 24 countries. Logarithmic scale.
Sources: Bloomberg, ESMA.
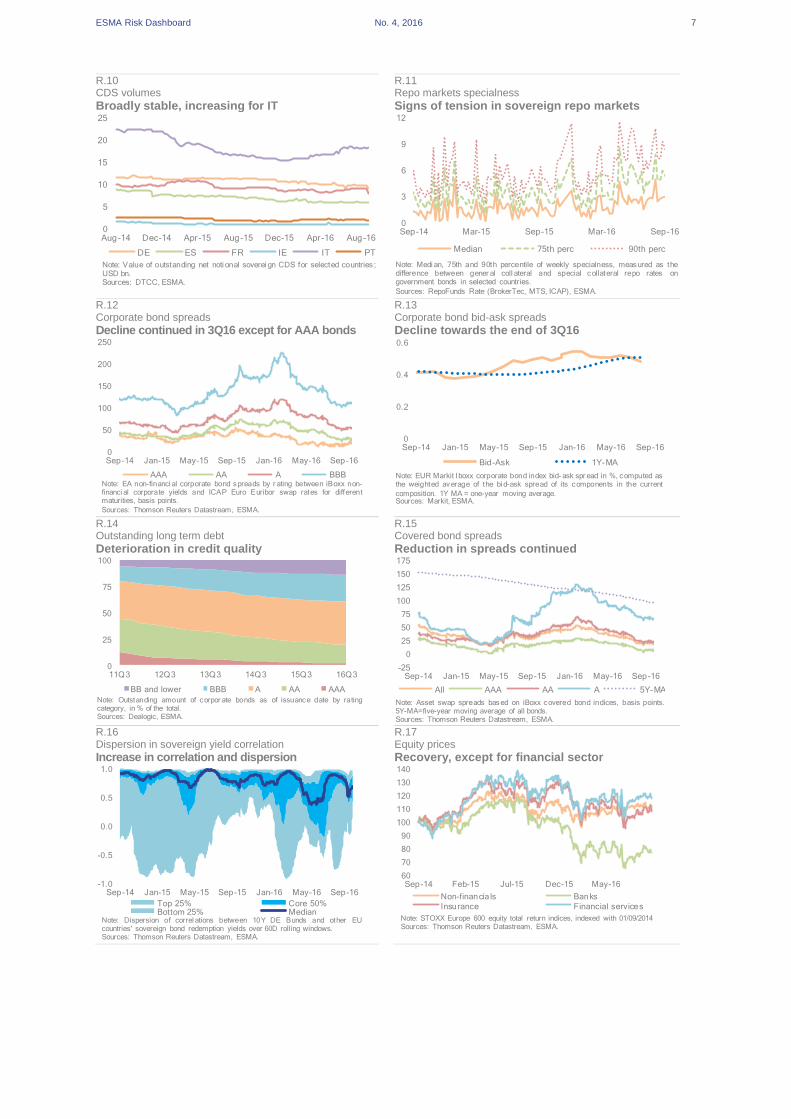
ESMA Risk Dashboard No. 4, 2016 7
R.10 R.11 CDS volumes Repo markets specialness
Broadly stable, increasing for IT Signs of tension in sovereign repo markets
R.12 R.13 Corporate bond spreads Corporate bond bid-ask spreads
Decline continued in 3Q16 except for AAA bonds Decline towards the end of 3Q16
R.14 R.15 Outstanding long term debt Covered bond spreads
Deterioration in credit quality Reduction in spreads continued
R.16 R.17 Dispersion in sovereign yield correlation Equity prices
Increase in correlation and dispersion Recovery, except for financial sector
0
5
10
15
20
25
Aug-14 Dec-14 Apr-15 Aug-15 Dec-15 Apr-16 Aug-16
DE ES FR IE IT PT
Note: Value of outstanding net noti onal soverei gn CDS for selected countries ;USD bn.Sources: DTCC, ESMA.
0
3
6
9
12
Sep-14 Mar-15 Sep-15 Mar-16 Sep-16
Median 75th perc 90th perc
Note: Medi an, 75th and 90th percentile of weekly specialness, measured as thedifference between gener al coll ateral and special collateral repo rates ongovernment bonds in selected countries.
Sources: RepoFunds Rate (BrokerTec, MTS, ICAP), ESMA.
0
50
100
150
200
250
Sep-14 Jan-15 May-15 Sep-15 Jan-16 May-16 Sep-16
AAA AA A BBBNote: EA non-financi al corporate bond spreads by r ating between iBoxx non-financi al corporate yields and ICAP Euro Euribor swap rates for differentmaturities, basis points.
Sources: Thomson Reuters Datastream, ESMA.
0
0.2
0.4
0.6
Sep-14 Jan-15 May-15 Sep-15 Jan-16 May-16 Sep-16
Bid-Ask 1Y-MA
Note: EUR Markit Iboxx corporate bond index bid- ask spr ead in %, computed asthe weighted average of the bi d-ask spread of its components in the current
composition. 1Y MA = one-year moving average.Sources: Markit, ESMA.
0
25
50
75
100
11Q3 12Q3 13Q3 14Q3 15Q3 16Q3
BB and lower BBB A AA AAA
Note: Outstanding amount of corpor ate bonds as of issuance date by ratingcategory, in % of the total.Sources: Dealogic, ESMA.
-25
0
25
50
75
100
125
150
175
Sep-14 Jan-15 May-15 Sep-15 Jan-16 May-16 Sep-16
All AAA AA A 5Y-MA
Note: Asset swap spreads based on iBoxx covered bond indices, basis points.5Y-MA=five-year moving average of all bonds.Sources: Thomson Reuters Datastream, ESMA.
-1.0
-0.5
0.0
0.5
1.0
Sep-14 Jan-15 May-15 Sep-15 Jan-16 May-16 Sep-16
Top 25% Core 50%Bottom 25% Median
Note: Dispersion of correl ations between 10Y DE Bunds and other EUcountries' sovereign bond redemption yields over 60D rolling windows.Sources: Thomson Reuters Datastream, ESMA.
60
70
80
90
100
110
120
130
140
Sep-14 Feb-15 Jul-15 Dec-15 May-16
Non-financia ls Banks
Insurance Financial services
Note: STOXX Europe 600 equity total return indices, indexed with 01/09/2014Sources: Thomson Reuters Datastream, ESMA.

ESMA Risk Dashboard No. 4, 2016 8
R.18 R.19 Debt issuance growth Net sovereign debt issuance
Negative HY issuance growth rates Negative for EU
R.20 R.21 HY issuance Hybrid capital issuance and outstanding
Sustained but lower in 3Q16 Increased issuance
R.22 R.23 Debt maturity Debt redemption profile
Lengthened maturity profile Medium-term bank financing needs
-2
-1
0
1
2
AB
S 1
4Q
3
AB
S 1
5Q
3
AB
S 1
6Q
3
HY
14
Q3
HY
15
Q3
HY
16
Q3
IG 1
4Q
3
IG 1
5Q
3
IG 1
6Q
3
CB
14
Q3
CB
15
Q3
CB
16
Q3
MB
S 1
4Q
3
MB
S 1
5Q
3
MB
S 1
6Q
3
MM
14
Q3
MM
15
Q3
MM
16
Q3
SO
V 1
4Q
3
SO
V 1
5Q
3
SO
V 1
6Q
3
10% 90% Current MedianNote: Growth rates of issuance vol ume, in %, normalised by standard devi ationfor the following bond classes: asset backed securities (ABS); high-yield (HY);investment grade (IG); cover ed bonds (CB); mortgage backed securities (MBS);
money market (MM); sovereign (SOV). Percentiles computed fr om 12Q rollingwindow. All data incl ude securities with a maturity hi gher than 18M. Barsdenote the range of val ues between the 10th and 90th percentiles. A missingdiamond indicates no issuance for the previous quarter.Sources: Dealogic, ESMA.
-150
-100
-50
0
50
100
150
-80
-60
-40
-20
0
20
40
60
AT
BE
BG
CY
CZ
DE
DK
EE EL
ES FI
FR
HR
HU IE IT LT
LU
LV
MT
NL
PL
PT
RO
SE SI
SK
UK
EU
1Y high 1Y low 16Q3
Note: Quarterly net issuance of EU sovereign debt by country, EUR bn. N etissuance calcul ated as the differ ence between new issuance over the quarterand outstanding debt maturing over the quarter. Highest and lowes t quarterly
net issuance in the past year are reported. EU total on right-hand scale.Sources: Dealogic, ESMA.
40
0
40
80
120
11Q3 12Q3 13Q3 14Q3 15Q3 16Q3
EU USA Asia ex JP Latin America
Note: Quarterly data on high-yield corporate bond issuance by region ofissuance, in EUR bn.Sources: Dealogic, ESMA.
0
150
300
450
600
750
900
0
5
10
15
20
25
30
35
11Q3 12Q3 13Q3 14Q3 15Q3 16Q3Outstanding (rhs) Issuance5Y-MA Issuance
Note: Outstandi ng amount computed as the cumulative sum of previ ouslyissued debt minus the cum ulative sum of matured debt prior to refer ence date,EUR bn. Accor ding to Deal ogic classification, hybrid capital refers to
subordinated debt Tier 1 capital mainly with perpetual maturity.Sources: Dealogic, ESMA.
-0.6
-0.4
-0.2
0.0
0.2
0.4
0.6
Sovere igns Banks Industr ials Util ities
EU AVG EU MIN (if on scale)
EU MAX (if on scale) CGIIPS
Non-CGIIPSNote: Quarterly change in m aturity of outstanding debt by sec tor and countrygroups in the EU, years. CGIIPS include C Y, GR, IT, IE, PT and ES. Min and Maxmay not be displayed where they are out of the scale provided in the graph.
Sources: Dealogic, ESMA.
1Q16 2Q16 3Q16 1Q16 2Q16 3Q16 1Q16 2Q16 3Q16 1Q16 2Q16 3Q16 -10
0
10
20
30
-40
0
40
80
120
16Q3 16Q4 17Q1 17Q2 17Q3 17Q4 18Q1 18Q2 18Q3 18Q4 19Q1 19Q2 19Q3
Banks Ind and Util
Financials (rhs) Banks -1Y
Ind and Util-1Y Financials -1Y (rhs)
Note: Quarterly redemptions over a 3Y-horizon by European private corporates(banks, non-bank financials, and industrials and utilities), current and change overlast year (dotted lines), EUR bn. Excluding bank redemptions to central banks.
Sources: Dealogic, ESMA.

ESMA Risk Dashboard No. 4, 2016 9
Investors R.24
Risk summary Risk drivers
Risk level – Sustained search for yield.
– Correlation in asset prices and increase in redemptions.
– Deterioration of quality of securities in portfolios.
– Uncertainty on economic outlook and political
developments in EU.
Risk change from 2Q16
Outlook for 4Q16
Note: Assessment of main risk categories for markets under ESMA remit since past quarter, and outlook for forthcoming quarter. Systemic risk assessment based on categorisation of the ESA Joint Committee. Colours indicate current risk intensity. Coding: green=potential risk, yellow=elevated risk, orange=high risk, red=very high risk. Upward arrows indicate a risk increase, downward arrows a risk decrease. ESMA risk assessment based on quantitative indicators and analyst judgement.
R.25 R.26 Cumulative global investment fund flows EU bond fund net flows
Inflows for EM funds, outflows for EU equity funds Increasing inflows into HY and EM funds
R.27 R.28 RoR volatilities by fund type Liquidity risk profile of EU bond funds
Volatilities rebounded in 3Q16 Stable liquidity and mixed maturity changes
R.29 R.30 Retail fund synthetic risk and reward indicator Leverage by investment fund type
Risks decreasing across fund types Leverage declined for mixed and real-estate funds
-300
0
300
600
900
1200
1500
1800
2100
2400
Sep-14 Jan-15 May-15 Sep-15 Jan-16 May-16 Sep-16
North America EF North America BFEmerging markets EF Emerging markets BFEurope EF Europe BF
Note: Cumul ative net fl ows into bond and equity funds (BF and EF) over timesince 2004 by regional investment focus, EUR bn.Sources: Thomson Reuters Lipper, ESMA.
-12
-4
4
12
20
28
Sep-14 Mar-15 Sep-15 Mar-16 Sep-16
Government Emerging HY
Corporate MixedBonds OtherNote: 2M cumulative net flows for bond funds , EUR bn. Funds investing incorporate and government bonds that qualify for another category are onlyreported once (e.g. funds investing in emerging government bonds will be
reported as emergi ng; funds investi ng in HY corporate bonds will be reported asHY).Sources: Thomson Reuters Lipper, ESMA.
0
7
14
21
28
Sep-14 Jan-15 May-15 Sep-15 Jan-16 May-16 Sep-16
Alternatives Equity BondCommodity Mixed Real Estate
Note: Annualised 40D historical return volatility of EU domiciled mutual funds, in %.Sources: Thomson Reuters Lipper, ESMA.
-5
15
35
55
75
3 5 7 9
Liq
uid
ity
M aturity
Corporate BF Other BF HY funds
Loan funds Government BF Mixed fundsNote: F und type is reported according to their average liquidity ratio, as apercentage (Y-axis), the effective average maturity of their assets (X-axis) andtheir size. Each series is reported for 2 years, i.e. 2015 (mid tones) and 2016(hue).
Sources: Thomson Reuters Lipper, ESMA.
1
3
5
7
Sep-14 Jan-15 May-15 Sep-15 Jan-16 May-16 Sep-16
Equity Bond
Alternative Commodity
Money Market Real Estate
Note:The calculated Synthetic Risk and Rewar d Indicator is based on ESMASRRI guidelines . It is computed via a simple 5Y annualised volatility measurewhich is then translated i nto categories 1-7 (with 7 representi ng higher levels
of volatility).Sources:Thomson Reuters Lipper, ESMA.
1.0
1.1
1.2
1.3
Jul-14 Nov-14 Mar-15 Jul-15 Nov-15 Mar-16 Jul-16
Bond Equity Mixed Real estate
Note: EA Investment funds' lever age by fund type computed as the AuM/NAVratio.Sources: ECB, ESMA.

ESMA Risk Dashboard No. 4, 2016 10
R.31 R.32 Financial market interconnectedness Hedge fund interconnectedness
Increase for hedge funds and MMFs Interconnectedness increased for destabilising HFs
0
20
40
60
80
0
5
10
15
20
25
11Q2 12Q2 13Q2 14Q2 15Q2 16Q2Total funds Hedge funds
Bond funds MMFs ( rhs)
Note: Loan and debt securities vis-à-vis MFI counterparts, as a share of totalassets. EA investm ent funds and MMFs, in %. Total funds includes: bond funds,equity funds, mixed funds, real estate funds, hedge funds, MMFs and other non-
MMFs investment funds. Data until 16Q2..Sources: ECB, ESMA.
-0.02
-0.01
0
0.01
0.02
Aug-12 Aug-13 Aug-14 Aug-15 Aug-16
Destabiliser HF (coeff. +) Stabiliser HF (coeff. -)
Note: Systemic stress indicator based on products of fractions of regressions withpositive (negative) estimated coefficient i ndividual fund return's impact onaverage retur n of sector significant at 99% level and respective average
estimators. C oefficients stem from VAR m odels regressi ng i ndividual fund returnson lags and general financial market indices. Measures aggregated acrossindividual regressions. Data until September 2015.Sources: Barclayhedge, Eurekahedge, TASS, HFR, ESMA.

ESMA Risk Dashboard No. 4, 2016 11
Infrastructures and services R.33
Risk summary Risk drivers
Risk level – Operational risks, incl. insufficient technology management,
cyber-attacks, integrity of benchmark panel.
– Conduct risk, incl. intentional or accidental behaviour by
individuals, market abuse.
– Systemic relevance of individual operations, incl. market
share, complexity of operations, interconnectedness with
other infrastructures or financial activities, system
substitutability.
Risk change from 2Q16
Outlook for 4Q16
Note: Assessment of main risk categories for markets under ESMA remit since past quarter, and outlook for forthcoming quarter. Systemic risk assessment based on categorisation of the ESA Joint Committee. Colours indicate current risk intensity. Coding: green=potential risk, yellow=elevated risk, orange=high risk, red=very high risk. Upward arrows indicate a risk increase, downward arrows a risk decrease. ESMA risk assessment based on quantitative indicators and analyst judgement.
R.34 R.35 Market concentration Settlement fails
Dispersion among equity indices increased Fails less volatile for government bonds
R.36 R.37 IRS clearing Euribor – Dispersion in contributions
Clearing decreased for OIS Ticked up in early 3Q16
R.38 R.39 Euribor – Dispersion of submission levels Rating changes
Stable in 3Q16 Negative for non-financials and sovereigns
0
20
40
60
80
100
Sep-14 Jan-15 May-15 Sep-15 Jan-16 May-16 Sep-16
Top 25% Core 50% Bottom 25% Median
Note: Concentration of notional value of equity tr ading by national indicescomputed as a 22D-MA of the Herfi ndahl-Hirschmann Index, i n %. Indicesincluded are FTSE100, CAC 40, DAX, FTSE MIB, IBEX35, AEX, OMXS30,
BEL20, OMXC20, OMXH25, PSI20, ATX.Sources: BATS, ESMA.
0
3
6
9
Sep-14 Jan-15 May-15 Sep-15 Jan-16 May-16 Sep-16
Corporate bonds 6M-MA corp
Equities 6M-MA equities
Government bonds 6M-MA govNote: Share of failed settlement i nstructions i n the EU, in % of value, one-weekmoving averages. 6M-MA=six-month moving average. Free-of-paymenttransactions not considered.
Sources: National Competent Authorities, ESMA.
40
50
60
70
80
90
100
Sep-14 Jan-15 May-15 Sep-15 Jan-16 May-16 Sep-16
Swap Basis Swap OIS FRA
Note: OTC interest rate derivatives cleared by CCPs, in % of total notionalamount.Sources: DTCC, ESMA.
0
0.1
0.2
0.3
Sep-14 Jan-15 May-15 Sep-15 Jan-16 May-16 Sep-16
Note: Normalised difference i n percentage poi nts between the highes tcontribution submitted by panel banks and the corresponding Euribor rate. Thechart shows the maximum difference across the 8 Euribor tenors.
Sources: European Money Markets Institute, ESMA.
-0.4
-0.2
0.0
0.2
0.4
Sep-14 Jan-15 May-15 Sep-15 Jan-16 May-16 Sep-16
TOP15 CORE70
BOTTOM15 RAW_EURIBOR3M
EURIBOR3M ECB_RATE
Note: Dispersion of 3M Euribor submissions , in %. The "Raw 3M Euribor" rateis calculated without trimming the top and bottom submissions of the panel forthe 3M Euribor.
Sources: European Money Markets Institute, ESMA.
-60
-45
-30
-15
0
15
30
10H2 11H2 12H2 13H2 14H2 15H2Covered Bond FinancialsInsurance Non financialsSovereign Structured Finance
Note: Drift of ratings from all credit rating agencies, excluding CERVED andICAP, by asset class computed as percentage number of upgrades minuspercentage number of downgrades. Data until end 2015.Sources: CEREP, ESMA.

ESMA Risk Dashboard No. 4, 2016 12