Embed Size (px)
Citation preview

EIOPA REGULAR USE EIOPA-BoS/21-467
25 October 2021
RISK DASHBOARD
October 20211
Risks Level Trend
(Past 3 months)
Outlook2
(Next 12 months)
1. Macro risks High
2. Credit risks Medium
3. Market risks Medium
4. Liquidity and funding risks3 Medium
5. Profitability and solvency Medium
6. Interlinkages and imbalances Medium
7. Insurance (underwriting) risks Medium
8. Market perceptions Medium
9. ESG related risks4 Medium
Note: The structural break as of Q1 2020 related to the Brexit withdrawal agreement and represented with a dashed line indicates
a break in the number of undertakings of the time series and rebalance of the country weights. Additionally, adjusted time series
for EU27 before Q1 2020 are also disclosed to reflect potential variations driven by the structural break in the sample. No expert
judgement has been applied in any risk category.
1 Reference date for company data is Q2-2021 for quarterly indicators and 2020-YE for annual indicators. The cut-off date for most market indicators is mid-September 2021. 2 The Outlook displayed for the next 12 months is based on the responses received from 29 national competent authorities
(NCAs) and ranked accordingly to the expected change in the materiality of each risk (substantial decrease, decrease, unchanged,
increase and substantial increase). 3 From October 2021, a new ESG related risks category and an enhancement of the liquidity and funding risks category are
included in the EIOPA’s risk dashboard. For the latter, the trend shown has been computed with the reviewed past risk level. 4 Environmental, Social and Governance (ESG) related risks. For further details please see footnote 3.

2
Key observations:
- Risk levels for the European insurance sector remain overall constant. - Macro risks remain at high level, amid upward revision of inflation forecasts.
The 10 years swap rates have slightly decreased across currencies in the third
quarter of 2021. Unemployment rates remain high but on a decreasing trend. Monetary policies remain accommodative.
- Credit risks remain at medium level, amid fiscal measures and accommodative
monetary policy. CDS spreads remained at low levels, broadly stable compared to the previous assessment. The median average credit quality of insurers’ investments slightly deteriorated as well as the share of investments in below
investment grade. - Market risks remain at medium level. Bond and equity markets remained
stable. The median investment in equities continued to slightly increase.
- Profitability and solvency risks remain at medium level, with solvency positions for life and non-life solos undertakings slightly deteriorating. While, SCR ratio for groups continued improving. Given the high returns obtained during the
first two quarters of the year, the return indicators reported an improvement. The net combined ratio reported a decrease.
- Interlinkages and imbalances risks remain at medium level, with a decreasing
trend. Insurance groups’ median exposure to banks, insurances and domestic sovereign debt decreased.
- Insurance risks remain at medium level, with year-on-year premium growth for non-life showing a noteworthy recovering since the beginning of 2020. Similarly, year-on-year premium growth for life showed an increase for the second
consecutive quarter. - Market perceptions remain at medium level. The life and non-life insurance
sector underperformed the stock market and the median price-to-earnings ratio
decreased. - Climate risk are at medium level, with transaction risk and physical risk slightly
improving. The catastrophe loss ratio decreased compared to the previous
quarter, albeit it doesn’t encompass yet the potential negative impact linked to the EU floods events in summer 2021.

3
Macro risks
Level: high
Trend: constant
Macro risks remain at high level. Forecasts for GDP growth for the main geographical
areas continue to be revised downward while forecasts for inflation for main geographical
areas show an upward trend, with an average above 2%. Unemployment rate for the
main geographical areas remains high around 7% albeit decreasing. Weighted average
of 10 years swap rates decreased slightly, around 0.3% across main currencies. Monetary
policies remain accommodative across jurisdictions.
Forecasted GDP growth at global level stands at an average of 5.75% for the next four quarters until Q2 2022. Expectations of EU GDP growth for the forecast horizon are in line with the global average. Compared to the previous assessment, forecasts for the last quarters of 2021 have been revised downwards.
The latest data on unemployment rates across geographical areas shows slight improvement, decreasing further from 7% to 6.6%.
Note: Average of forecasts four quarters ahead, weighted
average for Euro area, United Kingdom, Switzerland, United
States, BRICS. The dashed line indicated a break after UK
exit and rebalancing of the country weights.
Source: Bloomberg Finance L.P.
Note: Weighted average for EU, Switzerland, United States,
China. The dashed line indicated a break after UK exit and
rebalancing of the country weights.
Source: Refinitiv
Fiscal balances remain highly negative across jurisdictions with an average of -7% of GDP, as a consequence of the supporting fiscal packages by governments.
Forecasted inflation for the next four quarters until Q2 2022 has been revised upwards to 2.67%, particularly driven by market expectations in EU and US.
Note: Weighted average for EU, UK and United States. The
dashed line indicated a break after UK exit and rebalancing of
the country weights.
Source: Refinitiv
Note: Average of forecasts four quarters ahead, weighted
average for Euro area, United Kingdom, Switzerland, United
States, BRICS. The dashed line indicated a break after UK exit
and rebalancing of the country weights.
Source: Bloomberg Finance L.P.

4
The indicator on the 10 years swap rates decreased slightly to 0.2%.
The credit to GDP gap continues to increase to 2.38% from 1.9% in the fourth quarter 2020. The credit to GDP gap in the Euro Area increased to 1.6%.
Note: Weighted average for EUR, GBP, CHF, USD. The dashed
line indicates a break after UK exit and rebalancing of the country weights.
Source: Refinitiv
Note: Weighted average for Euro area, United Kingdom,
Switzerland, United States, China. The dashed line indicates a break after UK exit and rebalancing of the country weights.
Source: BIS
Monetary policies across all major central banks have been accommodative with extraordinary measures in response to the Covid-19 crisis. The average policy rate stands at 0.01%. The balance sheets of the major central banks have been increasing at a slower pace than one year ago.
Note: Weighted average for Euro area, United Kingdom, Switzerland, United States. The dashed line indicates a break
after UK exit and rebalancing of the country weights.
Source: Bloomberg Finance L.P.

5
Credit risks
Level: medium
Trend: constant
Credit risks remain at medium level, amid fiscal and monetary support. The CDS spreads
remained at low levels across all market segments. There has been also a slight increase
in investments in unsecured financial bonds. The median average credit quality of
insurers’ investments slightly deteriorated. The median of below investment grade assets
(with a credit quality step higher than 3) in insurers’ portfolios increased with an
increased heterogeneity across the insurance groups.
In the third quarter 2021, CDS spreads for European sovereign bonds slightly decreased to 10.17bps. Insurers’ exposures to this asset class hover around 30% of total assets in Q2-2021.
Spreads for unsecured financial bonds slightly decreased (-3bps) standing at 52bps. Median exposures of EU27 insurers’ investments slightly increased from 7.9% in Q1-2021 to 8.7% in Q2 -2021.
Note: Left scale shows the distribution of exposures (inter-
quartile range and median), right scale the risk measure. The
dashed line indicates a break after UK exit and exclusion of UK
undertakings from the distributions.
Source: Refinitiv, QFG (N2021 Q2=92)
Note: Left scale shows the distribution of exposures (inter-
quartile range and median), right scale the risk measure. . The
dashed line indicates a break after UK exit and exclusion of UK
undertakings from the distributions.
Source: Refinitiv, QFG (N2021 Q2=81)
Spreads for secured financial bonds slightly decreased
below 5bps to 4.30bps. Median exposures of EU27 slightly decreased from 2.3% to 2.1% of total assets in Q2-2021.
Spreads for non-financial corporate bonds hover
around 79bps. Median exposure to non-financial corporate bond for EU27 remained around to 10% of total assets in Q2-2021.
Note: Left scale shows the distribution of exposures (inter-
quartile range and median), right scale the risk measure.
The dashed line indicates a break after UK exit and exclusion
of UK undertakings from the distributions.
Source: Bloomberg Finance L.P., QFG (N2021 Q2=75)
Note: Left scale shows the distribution of exposures (inter-
quartile range and median), right scale the risk measure.
The dashed line indicates a break after UK exit and exclusion
of UK undertakings from the distributions.
Source: Bloomberg Finance L.P., QFG (N2021 Q2=81)

6
The household debt-to-income ratio slightly hovered around 104%. The median exposures to loans and mortgages remained to low level at 0.26% of total assets for Q4-2020.
The median average credit quality step slightly deteriorated from 1.89 to 1.95, corresponding to an S&P rating between AA and A.
Note: Left scale shows the distribution of exposures (inter-
quartile range and median), right scale the risk measure
(weighted average of EA and UK).
The dashed line indicates a break after UK exit and exclusion
of UK undertakings from the distributions. Source: QFG (N2021
Q2=92), ECB
Note: Distribution of indicator (interquartile range, median).
The dashed line indicates a break after UK exit and exclusion
of UK undertakings from the distributions.
Source: QFG (N2021 Q2=89)
The median of below investment grade assets (with a credit quality step higher than 3) increased back from 1.29% to 1.44% in Q2-2021 and the range of the distribution remains quite wide.
The correlation between the debt-service ratio of non-financial corporations and corporate bond spreads declined from 0.2 to 0.12. The debt service ratio decreased for all the countries considered. No new data was available since the previous assessment. No updates are available.
Note: Distribution of indicator (interquartile range, median).
Includes both internal and external credit ratings. Time series
revised - denominator now excludes assets for which no rating
shall be reported.
The dashed line indicates a break after UK exit and exclusion of UK undertakings from the distributions.
Source: QFG (N2021 Q2=90)
Note: Correlation between the debt-service ratio of non-
financial corporates and the spread of non-financial corporate
bonds based on a 12-quarter rolling window.
The dashed line indicates a break after UK exit and exclusion
of UK undertakings from the distributions. Source: BIS, Bloomberg Finance L.P.

7
Market risks
Level: medium
Trend: constant
Market risks remain at medium level. Volatility in bond market and equity market
remained at low levels. Median insurers’ investment in bonds and property remained
stable, while the median investment in equities continued to slightly increase. Spread of
investment returns over guaranteed interest rate decreased from 7.6% 2019 to 3.6% in
2020. Duration mismatch continue to widened, with the median standing at -7 years.
The index on the expected yield volatility for the Euro bund remained around 33.6bps in the second quarter 2021. Median exposures to bonds hovered around 58% of total assets in Q2-2021.
Volatility of equity prices remained at low levels at 180bps. Median exposures to equity remained around 6% of total assets in Q2-2021.
Note: Left scale shows the distribution of exposures (inter-
quartile range and median), right scale the risk measure. The
dashed line indicates a break after UK exit and exclusion of UK
undertakings from the distributions.
Source: Bloomberg Finance L.P., QFG (N2021 Q2=92)
Note: Left scale shows the distribution of exposures (inter-
quartile range and median), right scale the risk measure. The
dashed line indicates a break after UK exit and exclusion of UK
undertakings from the distributions.
Source: Bloomberg Finance L.P., QFG (N2021 Q2=92)
The indicator on the annual growth rate of property prices further decreased from 1.3% in Q3-2020 to 0.33% in Q4-2020. No further updates were available compared to the
previous assessment. Median exposures to property remains stable at around 3% of total assets in Q2-2021.
The median spread of investment returns over guaranteed rates decreased from 7.6% to 3.6% at the end of 2020.
Note: Left scale shows the distribution of exposures (inter-
quartile range and median), right scale the risk measure. From
Q1-2019 time series revised due to changes in source data
from the ECB. The dashed line indicates a break after UK exit
and exclusion of UK undertakings from the distributions.
Source: QFG (N2021 Q2=93); ECB
Note: Distribution of indicator (interquartile range, median).
Source: ARS (N2020=393)

8
The median for the indicator on the concentration of assets hover around 40% in Q2-2021, around the same level of the previous assessment.
The distribution of the duration mismatch indicator declined from 2019 to 2020, with the median mismatch standing at around -7 years. Duration mismatch is based on the modified duration of the fixed income assets and of the liabilities. Duration of the liabilities does not take into account optionalities such as a future profit participation.
Note: Herfindal Hirshman index computed on six balance
sheet asset classes (government bonds, corporate bonds,
equities, properties, cash and cash equivalents and loans and
mortgages). Distribution of indicator (interquartile range,
median). The dashed line indicates a break after UK exit and
exclusion of UK undertakings from the distributions.
Source: QFG (N2021 Q2=93)
Note: Distribution of indicator (interquartile range, median).
Source: Assets QFG (N2021 Q1=89); Liabilities AFG (N2020=88)
-10.0
-8.0
-6.0
-4.0
-2.0
0.0
2016-YE 2017-YE 2018-YE 2019-YE 2020-YE
Duration mismatch (years)
Adjusted for EU27

9
Liquidity and funding risks
Level: medium
Trend: constant
Liquidity and funding risks remain at medium level. Cash holdings and liquid assets ratio
remained broadly stable. Sustainability of cash flows position decreased, while the
liquidity indicator slightly increased. Bond issuance increased in Q2-2021. Similarly,
catastrophe bond issuance substantially raised, with a large majority of cat bonds issued
covering US multi-risk natural catastrophe (earthquakes and storms).
The median on cash holdings remains broadly stable at 0.52% in Q2-2021 in comparison with the previous quarter.
The distribution of the liquid assets to total assets ratio remains broadly stable, with a median standing at 45% in Q2-2021.
Note: Distribution of indicator (interquartile range, median).
Source: QRS (N2021 Q2=1,817).
Note: Distribution of indicator (interquartile range, median).
Source: QFG (N2021 Q2=1,754).
The median lapse rates in life business remained around 3% in Q1-2021 since the previous year, while the upper quartile decreased to 4.3% (-0.4 p.p.). The first lapse rates figures after the COVID-19 outbreak in Europe, do not indicate an overall substantial deterioration.
The median of the sustainability of cash flow position decreased to 2.5% in 2020 from 5% in 2019. Similarly, the lower tail fall moved downwards entering the negative territory.
Note: Distribution of indicator (interquartile range, median).
The dashed line indicates a break after UK exit and exclusion
of UK undertakings from the distributions. Source: QFG (N2020 Q4=82)
Note: Distribution of indicator (interquartile range, median).
Source: ARS (N2020=2,365).
0.0%0.2%0.4%0.6%0.8%1.0%1.2%1.4%1.6%1.8%
Cash holdings
30%
35%
40%
45%
50%
55%
60%
Liquid assets ratio
0.0%
1.0%
2.0%
3.0%
4.0%
5.0%
6.0%
Lapse rate (life)
Adjusted for EU27
-2%
0%
2%
4%
6%
8%
10%
12%
14%
2016-YE 2017-YE 2018-YE 2019-YE 2020-YE
Sustainability of cash flows position

10
The median of the funding via repos remained stable at around 0% in Q2-2021 in comparison with the previous quarter, while the upper quartile raised from 0.1% to 1.6%.
Catastrophe bond issuance increased in Q2-2021 to USD 5,081 million. Issued volumes were 24% higher than announced, with an average multiplier standing at 2.9. The large majority of cat bonds issued covered US multi-risk natural catastrophe (storms and earthquakes).
Note: Distribution of indicator (interquartile range, median).
Source: ARS (N2020=102).
Note: Volumes in USD mn, spread in per cent.
Source: http://artemis.bm
Bond issuance volumes raised to 5.5 billion EUR for Q2-2021. The average ratio of coupons to maturity increased to 0.23 from 0.13.
Note: Volume in EUR mn
Source: Bloomberg Finance L.P.
0.0
1.0
2.0
3.0
4.0
5.0
6.0
-1,000
1,000
3,000
5,000
7,000
9,000
2017-Q
2
2017-Q
3
2017-Q
4
2018-Q
1
2018-Q
2
2018-Q
3
2018-Q
4
2019-Q
1
2019-Q
2
2019-Q
3
2019-Q
4
2020-Q
1
2020-Q
2
2020-Q
3
2020-Q
4
2021-Q
1
2021-Q
2
Cat Bond Issuance
increase in announced volume (USD mn, lhs)
announced volume (USD mn, lhs)
multiplier (spread / expected annual loss) (rhs)
0.0
0.2
0.4
0.6
0.8
1.0
1.2
1.4
0
1,000
2,000
3,000
4,000
5,000
6,000
7,000
8,000
9,000
10,000
Bond issuance
Issued volume (EUR mn, lhs)
Average Coupon / Maturity (rhs)

11
Profitability and solvency
Level: medium
Trend: constant
Profitability and solvency risks remain at medium level. Solvency positions for solos life
and non-life undertakings slightly deteriorated since the first quarter-2021, while the SCR
ratio for groups continued improving. Given the high returns obtained during the first two
quarters of the year, return on excess of assets over liabilities, as well as, return to assets
and premiums improved. While, the net combined ratio reported a decrease. The
expected profits in future premiums showed a moderate improvement.
The median of the net combined ratio for non-life business dropped to 93% in Q2-2021, from 95% in Q1-2021, remaining below pre-COVID levels. Similarly, the upper percentile slightly decreased to 99% (-1.1 p.p.) in the same quarter.
The whole distribution of the return on investments for life solo undertakings shifted downwards since 2019, with a median of 5.1% in 2020 (-4.2 p.p. compared to the previous year). This deterioration is mostly driven by the negative develoment in financial markets in the first quarter of 2020 following the COVID-19 crisis.
Note: Distribution of indicator (interquartile range, median).
The dashed line indicates a break after UK exit and exclusion
of UK undertakings from the distributions.
Source: QRS (N2021 Q2=1,374).
Note: Distribution of indicator (interquartile range, median).
Source: ARS (N2020=420).
The distribution range of ratio of assets over liabilities remained broadly stable, with a median standing around 110% in Q2-2021.
The distribution of return on excess of assets over liabilities (based on statutory accounts) shifted upward, with a median standing at 10.8% in Q2-2021 (6.4% in Q4-2020). The high returns obtained during the first half of 2021 shifted the median closer to the pre-COVID levels.
Note: Distribution of indicator (interquartile range, median).
The dashed line indicates a break after UK exit and exclusion
of UK undertakings from the distributions.
Source: QFG (N2021 Q2=92).
Note: Distribution of indicator (interquartile range, median).
Q2 figures annualised. The dashed line indicates a break after
UK exit and exclusion of UK undertakings from the
distributions.
Source: QFG and ARG (N2021 Q2=86).
75%
80%
85%
90%
95%
100%
105%
Net combined ratio - non-life
Adjusted for EU27
-2.0%
0.0%
2.0%
4.0%
6.0%
8.0%
10.0%
12.0%
2017-YE 2018-YE 2019-YE 2020-YE
Investment return - life
Adjusted for EU27
100%
104%
108%
112%
116%
120%
Assets over liabilities
Adjusted for EU27
0.0%
5.0%
10.0%
15.0%
20.0%
Return on excess of assets over liabilities
Adjusted for EU27

12
The distribution of return on assets (based on statutory accounts) moved upwards, with a median standing around 0.7% in Q2-2021 (0.4% in Q4-2020). The noteworthy returns obtained during the first two quarters of the year drives the raise in the distribution above the pre-COVID.
The median return to premiums shifted upwards to 4.8% in Q2-2021 from 3.5% in Q4-2020. Similarly, the two tails of the distribution moved in the same direction, exceeding the pre-COVID levels. The raise on returns in the first half of the year drives the shift, partially eased by the increase in premiums.
Note: Distribution of indicator (interquartile range, median). Q2
figures annualized. The dashed line indicates a break after UK
exit and exclusion of UK undertakings from the distributions.
Source: QFG and ARG (N2021 Q2=86).
Note: Distribution of indicator (interquartile range, median).
The dashed line indicates a break after UK exit and exclusion
of UK undertakings from the distributions.
Source: “Total” QFG (N2021 Q2=85).
The median SCR ratios for groups continued shifting upwards, standing at 235% in Q2-2021 (230% in Q1-2021). The upward movement in the last quarter is triggered by the increase in the eligible own funds, in particular, for the most significant groups in the sample.
The median SCR ratio for non-life solo undertakings slightly dropped to 211% in Q2-2021 in comparison with the previous quarter (214% in Q1-2021).
Note: Distribution of indicator (interquartile range, median).
The dashed line indicates a break after UK exit and exclusion
of UK undertakings from the distributions.
Source: “Total” QFG (N2021 Q2=92).
Note: Distribution of indicator (interquartile range, median).
The dashed line indicates a break after UK exit and exclusion
of UK undertakings from the distributions.
Source: QRS (N2021 Q2=1,084).
0.0%
0.2%
0.4%
0.6%
0.8%
1.0%
1.2%
Return on assets
Adjusted for EU27
0.0%
1.0%
2.0%
3.0%
4.0%
5.0%
6.0%
7.0%
8.0%
Return to premiums
Adjusted for EU27
140%
160%
180%
200%
220%
240%
260%
SCR ratio - groups
Adjusted for EU27
100%
150%
200%
250%
300%
350%
SCR ratio - non-life
Adjusted for EU27

13
The median of SCR ratio for life solo undertakings slightly shifted downward to 219% in Q2-2021 (226% in Q1-2020) after the raises observed in the last quarters.
The median SCR ratio of life solo companies excluding the impact of transitional measures increased to 194.4% in 2020 from 165% in 2019, mainly driven by the sample adjustment after the exclusion of UK as of 2020. When considering the adjusted for EU27 figures, the median decreased by 8% in 2020 from 211.6% in 2019.
Note: Distribution of indicator (interquartile range, median).
The dashed line indicates a break after UK exit and exclusion
of UK undertakings from the distributions.
Source: QRS (N2021 Q2=395).
Note: Distribution of indicator (interquartile range, median).
Source: ARS (N2020=249).
The median of tier 1 capital in total own funds moved upwards to 89% in Q2-2021 from 87.6% in the previous quarter.
The median share of expected profit in future premiums as a percentage of total eligible own funds slightly increased to 3% in comparison with the previous quarter.
Note: Distribution of indicator (interquartile range, median).
The dashed line indicates a break after UK exit and exclusion
of UK undertakings from the distributions.
Source: QFG (N2021 Q2=93).
Note: Distribution of indicator (interquartile range, median).
The dashed line indicates a break after UK exit and exclusion
of UK undertakings from the distributions.
Source: QRS (N2021 Q2=1,887).
100%
150%
200%
250%
300%
350%
SCR ratio - life
Adjusted for EU27
100%
150%
200%
250%
300%
350%
Solvency ratio - life (without transitionals)
Adjusted for EU27
75%
80%
85%
90%
95%
100%
Tier 1 own fundsto total own funds
Adjusted for EU27
0%
2%
4%
6%
8%
10%
12%
14%
16%
Expected Profit in Future Premiums
Adjusted for EU27

14
Interlinkages & imbalances
Level: medium
Trend: decrease
Interlinkages and imbalances risks remain at medium level in Q2-2021, with a decreasing
trend. Insurance groups’ median exposure to banks, insurances and domestic sovereign
debt decreased. While, the median investments in other financial institutions slightly
increased. The median of premiums ceded to reinsurers, as well as, insurers’ derivative
holdings dropped since the last assessment. There have been no substantial changes
reported for “non-insurance” liabilities of insurers.
The median investment in banks as a share of total assets slightly decreased to 14% in Q2-2021, from 15% in the previous quarter. While, the two tails of the distribution remain broadly stable.
The median of investment exposures to insurers slightly dropped, standing around 1.6% of total assets in Q2-2021 in comparison with the previous quarter.
Note: Distribution of indicator (interquartile range, median).
Banks comprise all activities identified with NACE code
K.64.1.9. The dashed line indicates a break after UK exit and
exclusion of UK undertakings from the distributions. Source: QFG (N2021 Q2=88).
Note: Distribution of indicator (interquartile range, median).
Insurances comprise all activities identified with NACE code
K65, excluding K65.3. The dashed line indicates a break after
UK exit and exclusion of UK undertakings from the distributions.
Source: QFG (N2021 Q2=88).
The distribution of investments in other financial institutions shifted upwards, with the median standing at 20.7% in Q2-2021.
The median share of domestic sovereign debt slightly decreased to 12% in Q2-2021 in comparison with the last quarter. While, the range of the distribution remains around the same levels as in the previous quarters.
Note: Distribution of indicator (interquartile range, median).
Other financial institutions comprise all activities identified
with NACE codes K66, K65.3 and K64 excluding K64.1.9. The
dashed line indicates a break after UK exit and exclusion of UK undertakings from the distributions. The distribution of Q1-
2020 has been revised.
Source: QFG (N2021 Q2=89).
Note: Distribution of indicator (interquartile range, median).
The dashed line indicates a break after UK exit and exclusion
of UK undertakings from the distributions.
Source: QRS (N2021 Q2=1,191).
0%
5%
10%
15%
20%
25%
Investments in banks
Adjusted for EU27
0.0%
0.5%
1.0%
1.5%
2.0%
2.5%
3.0%
Investments in insurances
Adjusted for EU27
10%
15%
20%
25%
30%
Investments in other financial institutions
Adjusted for UE27
0%
5%
10%
15%
20%
25%
30%
Investment in domestic sovereign debt
Adjusted for EU27

15
The median of premiums ceded to reinsurers dropped to 5% in Q2-2021 from 6% in Q2-2021. Similarly, the upper quartile decreased from 11.5% to 10%. The movements are potentially driven by the seasonality observed also in previous years.
The median exposure to derivatives of total assets slightly decreased to 0.35% in Q2-2021 from 0.46% Q1-2021.
Note: Distribution of indicator (interquartile range, median).
The dashed line indicates a break after UK exit and exclusion
of UK undertakings from the distributions.
Source: QFG (N2021 Q2=87).
Note: Distribution of indicator (interquartile range, median).
The dashed line indicates a break after UK exit and exclusion
of UK undertakings from the distributions.
Source: QFG (N2021 Q2=92).
The median of “non-insurance” liabilities of insurers remains broadly stable, standing at 4.4%.
Note: Distribution of indicator (interquartile range, median).
The dashed line indicates a break after UK exit and exclusion of UK undertakings from the distributions.
Source: QFG (N2021 Q2=92).
0%
2%
4%
6%
8%
10%
12%
14%
Reinsurance part of premium
Adjusted for EU27
0.0%
0.5%
1.0%
1.5%
2.0%
2.5%
3.0%
3.5%
Derivative holdings
"Adjusted for EU27"
0.0%
2.0%
4.0%
6.0%
8.0%
10.0%
Insurers "non-insurance" liabilities
Adjusted for EU27

16
Insurance (underwriting) risks
Level: medium
Trend: increase
Insurance risks remain at medium level in Q2-2021, with an increasing trend. Year-on-year
premium growth for non-life reported a noteworthy recovering, showing the first increase
since the beginning of 2020. Year-on-year premium growth for life showed an increase for
the second consecutive quarter. The median exposure of the loss ratio raised after reaching
the lowest value during the previous quarter.
The distribution of the life premium growth shifted upwards, with a median standing around 7% in Q2-2021 (1.7% in Q1-2021). Similarly, the upper tail raised by 19 p.p. to 34.6%. This reflects an improvement from the distress of the Covid-19.
The median non-life premium growth increased to 3.6% for the first time since the COVID outbreak in Q2-2021 (0.9% in Q1-2021). Similarly, the two tails of the distribution shifted upwards, reflecting a positive trend among the majority of insurers.
Note: Year-on-year change in gross written premiums.
Distribution of indicator (interquartile range, median). The
dashed line indicates a break after UK exit and exclusion of UK
undertakings from the distributions.
Source: QFG (N2021 Q2=83).
Note: Year-on-year change in gross written premiums.
Distribution of indicator (interquartile range, median). The
dashed line indicates a break after UK exit and exclusion of UK
undertakings from the distributions.
Source: QFG (N2021 Q2=78).
The median exposure of the loss ratio increased to 62% in Q1-2021 from 59.5% in Q1-2021. While, the upper tail decreased to 72% in the same quarter.
Note: Distribution of indicator (interquartile range, median).
The dashed line indicates a break after UK exit and exclusion
of UK undertakings from the distributions.
Source: QRS (N2021 Q2=1,361).
-30%
-20%
-10%
0%
10%
20%
30%
40%
Premium growth - life
Adjusted for EU27
-10%
-5%
0%
5%
10%
15%
20%
Premium growth - non-life
Adjusted for EU27
40%
45%
50%
55%
60%
65%
70%
75%
80%
85%
Loss ratio (gross)
Adjusted for EU27

17
Market perceptions
Level: medium
Trend: constant
Market perceptions remain at medium level. Insurance life and non-life stocks underperformed
the market. The median price-to-earnings ratio of insurance groups in the sample decreased
from the previous quarter. The median of CDS spreads of insurers remained at low level. Insurers’
external ratings remain broadly stable while the numbers of insurers’ external negative outlooks
have been higher than the positive ones.
Life and non-life insurers underperformed the market by 4% and 6% respectively, in line with the previous quarter. There have been some data resubmission also for the previous quarter.
The median price-to-earnings (P/E) ratio of insurance groups in the sample decreased from 14% to 11.8%.
Note: Out-(under-)performance over 3-month periods vs Stoxx
600.Source: Refinitiv
Note: Distribution of indicator (interquartile range, median).
Source: Refinitiv
The distribution of insurers’ CDS spreads remain at low levels, with the median level for the insurers in the sample around 40bps.
Insurers’ external ratings remained overall stable since the October 2020 risk assessment.
Note: Distribution of indicator (interquartile range, median).
Source: Refinitiv Source: Standard & Poor’s via Refinitiv

18
Negative changes in rating outlooks have been more than the positive changes.
Source: Standard & Poor’s via Refinitiv
19
Environmental, Social and Governance (ESG) related risks
Level: medium
Trend: constant
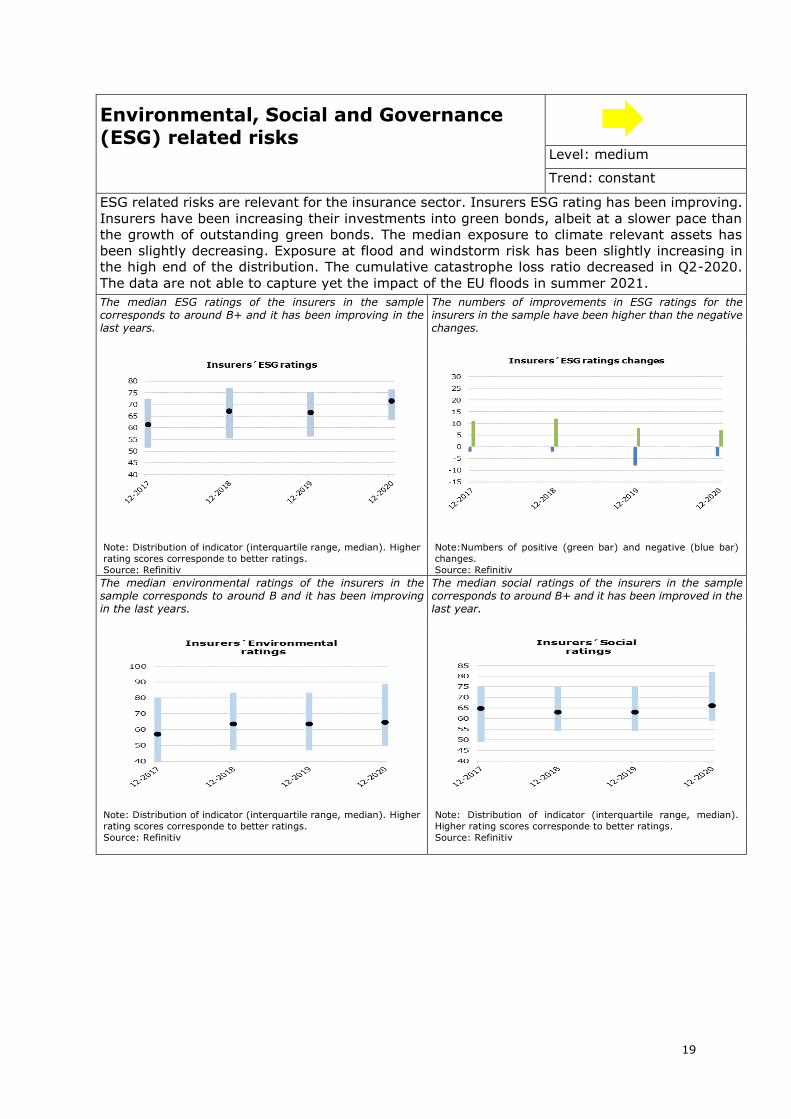
ESG related risks are relevant for the insurance sector. Insurers ESG rating has been improving.
Insurers have been increasing their investments into green bonds, albeit at a slower pace than
the growth of outstanding green bonds. The median exposure to climate relevant assets has
been slightly decreasing. Exposure at flood and windstorm risk has been slightly increasing in
the high end of the distribution. The cumulative catastrophe loss ratio decreased in Q2-2020.
The data are not able to capture yet the impact of the EU floods in summer 2021.
The median ESG ratings of the insurers in the sample corresponds to around B+ and it has been improving in the last years.
The numbers of improvements in ESG ratings for the insurers in the sample have been higher than the negative changes.
Note: Distribution of indicator (interquartile range, median). Higher
rating scores corresponde to better ratings.
Source: Refinitiv
Note:Numbers of positive (green bar) and negative (blue bar)
changes.
Source: Refinitiv
The median environmental ratings of the insurers in the sample corresponds to around B and it has been improving in the last years.
The median social ratings of the insurers in the sample corresponds to around B+ and it has been improved in the last year.
Note: Distribution of indicator (interquartile range, median). Higher
rating scores corresponde to better ratings.
Source: Refinitiv
Note: Distribution of indicator (interquartile range, median).
Higher rating scores corresponde to better ratings.
Source: Refinitiv

20
The median ESG ratings of the insurers in the sample corresponds to around B+ and it has been improving in the last years.
The median investments in green bonds over corporate bonds have been steadily increasing to 2.3%, but at a slower pace than the increase in amount of green bonds outstanding.
Note: Distribution of indicator (interquartile range, median). Higher
rating scores corresponde to better ratings.
Source: Refinitiv
Note: Distribution of indicator (interquartile range, median). Source: Refinitiv, QRS (N2021 Q2=1,377).
The median growth of insurers’ investment in green bonds has been increasing. The y-o-y growth of green bond outstanding has also been volatile and it increased in the last quarter.
The median exposure toward climate relevant assets has been slightly decreasing and it stands at 3.15% of total assets.
Note: Distribution of indicator (interquartile range, median).
Source: Refinitiv, QRS (N2021 Q2=1,377).
Note: The six climate-relevant sectors (agriculture, fossil fuel,
utilities, energy-intensive, transport and housing) based on their
greenhouse gas emissions and mapped at NACE Rev2 4-digit
level. Source: Refinitiv, QRS (N2021 Q2=1768).

21
The exposure to flood risk has been slightly decreasing, especially in the high end of the distributions.
The exposure to windstorm risk has remained stable at low levels.
Source: EIOPA Pilot dashboard on insurance protection gap for
natural catastrophes, Eurostat Refinitiv, ARG (N2021 Q2=109).
Source: EIOPA Pilot dashboard on insurance protection gap for
natural catastrophes, Eurostat Refinitiv, ARG (N2021 Q2=109).
The cumulative catastrophe loss ratio decreased in the second quarter-2021. The recent weather events in Europe are not yet included in the data.
Note: Cumulative year-to-date loss ratio calculated based on
Munich Re, Hannover Re and Everest Re.
Source: Bloomberg Finance L.P.
0%
5%
10%
15%
20%
25%
30%
Catastrophe loss ratio

22
APPENDIX
Level of risk Very high
High
Medium
Low
Trend Large increase
Increase
Constant
Decrease
Large decrease
Arrows show changes when compared to the previous quarter.
Description of risk categories
Macro risks
Macro risk is an overarching category affecting the whole economy. EIOPA’s contribution
focuses on factors such as economic growth, state of the monetary policies, consumer
price indices and fiscal balances which directly impact the insurance industry. The
indicators are developed encompassing information on the main jurisdictions where
European insurers are exposed to both in terms of investments and product portfolios.
Credit risks
The category measures the vulnerability of the European insurance industry to credit
risk. To achieve this aim, credit-relevant asset class exposures of the (re)insurers are
combined with the relevant risk metrics applicable to these asset classes. For instance,
the holdings of government securities are combined with the credit spreads on European
sovereigns.
Market risks
Market risk is, for most asset classes, assessed by analysing both the investment
exposure of the insurance sector and an underlying risk metric. The exposures give a
picture of the vulnerability of the sector to adverse developments; the risk metric,
usually the volatility of the yields of the associated indices, gives a picture of the current
level of riskiness. The risk category is complemented by an indicator which captures the
difference between guaranteed interest rates and investment returns.
Liquidity and funding risks
This category aims at assessing the vulnerability of the European insurance industry to
liquidity shocks. The set of indicators encompasses the lapse rate of the life insurance
sector with high lapse rate signalling a potential risk, holdings of cash & cash equivalents
as a measure of the liquidity buffer available, and the issuance of catastrophe bonds,
where a very low volume of issuance and/or high spreads signals a reduction in demand
which could form a risk.
Profitability and solvency
The category scrutinises the level of solvency and profitability of the European insurance
industry. Both dimensions are analysed for the overall industry (using group data) and
include a breakdown for the life and non-life companies (using solo data). In detail, the
solvency level is measured via solvency ratios and quality of own funds. Standard

23
profitability measures for the whole industry are complemented by indicators such as
the combined ratio and the return on investments specifically applied to the non-life and
life industry respectively.
Interlinkages and imbalances
Under this section various kinds of interlinkages are assessed, both within the insurance
sector, namely between primary insurers and reinsurers, between the insurance sector
and the banking sector, as well as interlinkages created via derivative holdings.
Exposure towards domestic sovereign debt is included as well.
Insurance (underwriting) risks
As indicators for insurance risks gross written premiums of both life and non-life
business are an important input. Both significant expansion and contraction are taken
as indicators of risks in the sector; the former due to concerns over sustainability and
the latter as an indicator of widespread contraction of insurance markets.
Market perception
This category encompasses the financial markets’ perception of the healthiness and
profitability of the European insurance sector. For this purpose, relative stock market
performances of European insurance indices against the total market are assessed, as
well as fundamental valuations of insurance stocks (price/earnings ratio), CDS spreads
and external ratings/rating outlooks.
Environmental, Social and Governance (ESG) related risks
This risk category aims at assessing the vulnerability of the European insurance industry
to Environmental, Social and Governance (ESG) risks but also to capture these kind of
risks that may emerge and rise in the near future. The set of indicators encompasses
ESG ratings of listed insurers signalling low insurers' attention to ESG factors and hence
could increase their reputational and operational risk, the share of green bonds in
insurers’ portfolios and share of climate relevant assets based on their greenhouse gas
emissions as a measure of exposure towards transition risk, exposure at risk of NatCat
events, economic damage caused by weather and climate-related extreme events and
catastrophe loss ratio as a flag for potential physical risk. Information on claims and
insurance losses due to natural catastrophes also contribute to this risk category.
Abbreviations
AFG Annual Financial Stability Reporting for Groups
ARS Annual Prudential Reporting for Solo Entities
QFG Quarterly Financial Stability Reporting for Groups
QRS Quarterly Prudential Reporting for Solo Entities
QFT Quarterly Fast Track Reporting (pre-Solvency II, for around 32 large
insurance groups on a best effort basis)
Notes
- Sample size for the different indicators may vary according to availability and
consistency of the reported information.
- Vertical dashed lines where displayed in the graphs that signal the structural
change in the series driven by the transition from Solvency I to Solvency II
reporting.

24
EIOPA Risk Dashboard October 2021 © European Insurance and Occupational Pensions Authority (EIOPA), Frankfurt, 2021. All rights reserved. This report provides an interim risk-update, updating previous Risk Dashboards. Legal basis of this report is Regulation (EU) No 1094/2010 of the European Parliament and of the Council of 24 November 2010 establishing a European Supervisory Authority (European Insurance and Occupational Pensions Authority), and in particular Article 32 (Assessment of market developments) thereof. The charts and analyses found in this report are occasionally based on third party material. EIOPA is not responsible for the accuracy or completeness of such data. Third party material is protected by intellectual property rights such as copyright, tradename or similar rights, and may be subject to other terms and conditions. Therefore, reproduction and further distribution of such material is subject to the permission of that third party.