Embed Size (px)
Citation preview

ESMA Risk Dashboard No. 1, 2018
ESMA Risk Dashboard No. 1, 2018 2
ESMA Risk Dashboard No. 1, 2018
© European Securities and Markets Authority, Paris, 2018. All rights reserved. Brief excerpts may be reproduced or translated provided the source is cited adequately. The reporting period of this Report is 1 October 2017 to 31 December 2017, unless indicated otherwise. Legal reference of this Report: Regulation (EU) No 1095/2010 of the European Parliament and of the Council of 24 November 2010 establishing a European Supervisory Authority (European Securities and Markets Authority), amending Decision No 716/2009/EC and repealing Commission Decision 2009/77/EC, Article 32 “Assessment of market developments”, 1. “The Authority shall monitor and assess market developments in the area of its competence and, where necessary, inform the European Supervisory Authority (European Banking Authority), and the European Supervisory Authority (European Insurance and Occupational Pensions Authority), the ESRB and the European Parliament, the Council and the Commission about the relevant micro-prudential trends, potential risks and vulnerabilities. The Authority shall include in its assessments an economic analysis of the markets in which financial market participants operate, and an assessment of the impact of potential market developments on such financial market participants.” The information contained in this publication, including text, charts and data, exclusively serves analytical purposes. It does not provide forecasts or investment advice, and does not prejudice, preclude or influence in any way past, existing or future regulatory or supervisory obligations on market participants. The charts and analyses in this report are, fully or in parts, based on data not proprietary to ESMA, including from commercial data providers and public authorities. ESMA uses these data in good faith and does not take responsibility for their accuracy or completeness. ESMA is committed to constantly improving its data sources and reserves the right to alter data sources at any time. The third-party data used in this publication may be subject to provider-specific disclaimers, especially regarding its ownership, its reuse by non-customers and, in particular, the accuracy, completeness or timeliness of the data provided and the provider’s liability related to those. Please consult the websites of the individual data providers, whose names are detailed throughout this report, for more details on these disclaimers. Where third-party data are used to create any chart, table or analysis the third party is identified and credited as the source. In each case, ESMA is cited by default as a source, reflecting any data management, cleaning, processing, matching, analytical, editorial or other adjustments to raw data undertaken.
European Securities and Markets Authority (ESMA) Risk Analysis and Economics Department 103, Rue de Grenelle FR–75007 Paris [email protected]
ESMA Risk Dashboard No. 1, 2018 3
ESMA Risk Dashboard
R.1
Main risks
Risk segments Risk categories Risk sources
Risk Outlook Risk Outlook
Outlook
Overall ESMA remit Liquidity
Macroeconomic environment
Systemic stress Market
Low interest rate environment
Securities markets Contagion
EU sovereign debt markets
Investors Credit
Infrastructure disruptions, incl. cyber risks
Infrastructures and services Operational
Political and event risks
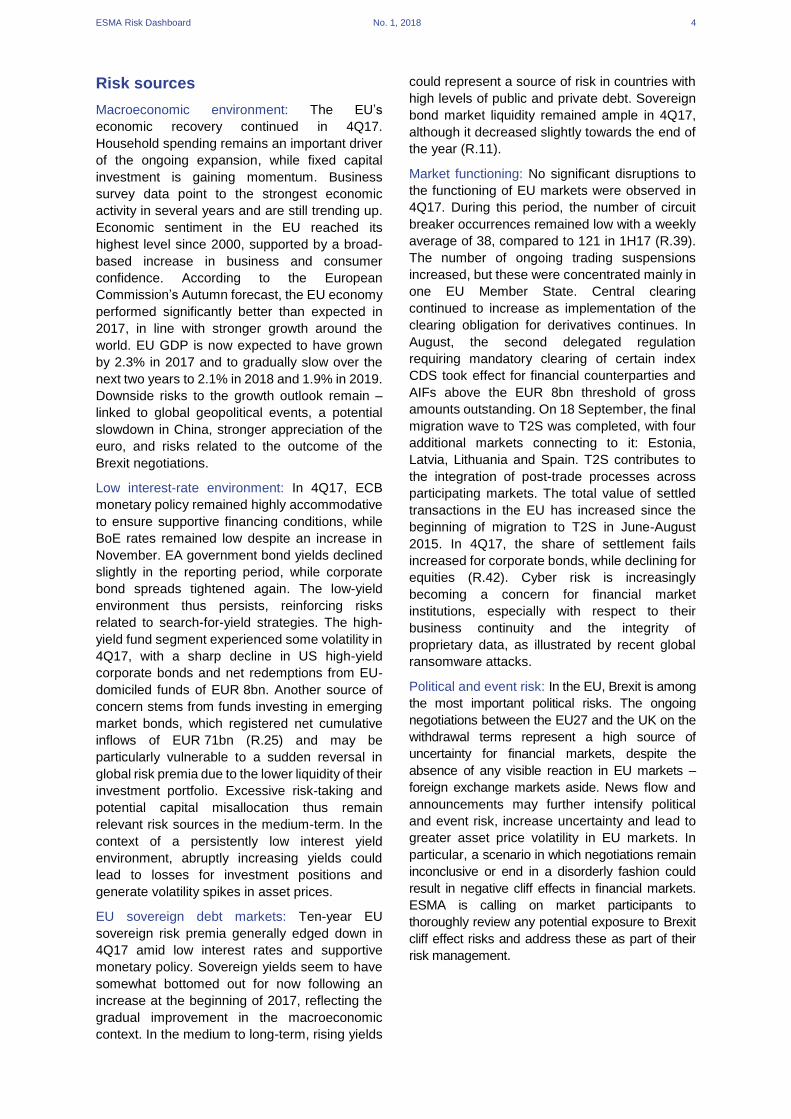
Note: Assessment of main risks by risk segments for markets under ESMA remit since last assessment, and outlook for forthcoming quarter. Assessment of main risks by risk categories and sources for markets under ESMA remit since last assessment, and outlook for forthcoming quarter. Risk assessment based on categorisation of the ESA Joint Committee. Colours indicate current risk intensity. Coding: green=potential risk, yellow=elevated risk, orange=high risk, red=very high risk. Upward arrows indicate an increase in risk intensities, downward arrows a decrease, horizontal arrows no change. Change is measured with respect to the previous quarter; the outlook refers to the forthcoming quarter. ESMA risk assessment based on quantitative indicators and analyst judgement.
ESMA’s 4Q17 overall risk assessment is unchanged from 3Q17. EU financial markets remained calm during the quarter, with limited reactivity to global geopolitical events. While benign market conditions prevailed during the reporting period, February 2018 saw severe market corrections and the return of equity market volatility, confirming our prevailing valuation concerns. ESMA’s market risk assessment remains very high. However, our assessment for credit risk has improved from very high to high. The outlook for market, liquidity and contagion risks is stable. Operational risk continues to be elevated, with a deteriorating outlook, due to Brexit-related risk to business operations and the mounting risk of cyber-attacks. The main sources of risk remain a potential repricing of risk premia and geopolitical developments whose effects may spill over to global financial markets. On the perimeter of global securities markets, the latter months saw extreme volatility in the prices of virtual currencies and strong growth in Initial Coin Offerings.
Risk summary
Risks in the markets under ESMA’s remit
remained at high levels, reflecting very high risk
in securities markets and elevated risk for
investors, infrastructures and services. ESMA’s
market risk assessment was again very high.
While benign market conditions prevailed during
the reporting period, the beginning of February
2018 saw severe market corrections and the
return of equity market volatility, confirming our
prevailing valuation concerns. On the other hand,
the level of credit risk eased from very high to
high, reflecting a strengthening macroeconomic
environment and higher credit ratings in several
EU member states, although the deterioration in
outstanding corporate ratings persisted. Liquidity
risk in 4Q17 remained high despite
improvements in securities markets. Operational
risk was elevated, but with a deteriorating risk
outlook as concerns mount over potential cyber-
attacks. The risk outlook was stable across the
other risk categories. On the perimeter of global
securities markets, the latter months saw an
extraordinary rise and subsequent fall in prices of
virtual currencies, as well as growing issuance of
Initial Coin Offerings (ICOs). ESMA has warned
against the substantial risks associated with
investments in virtual currencies and ICOs.
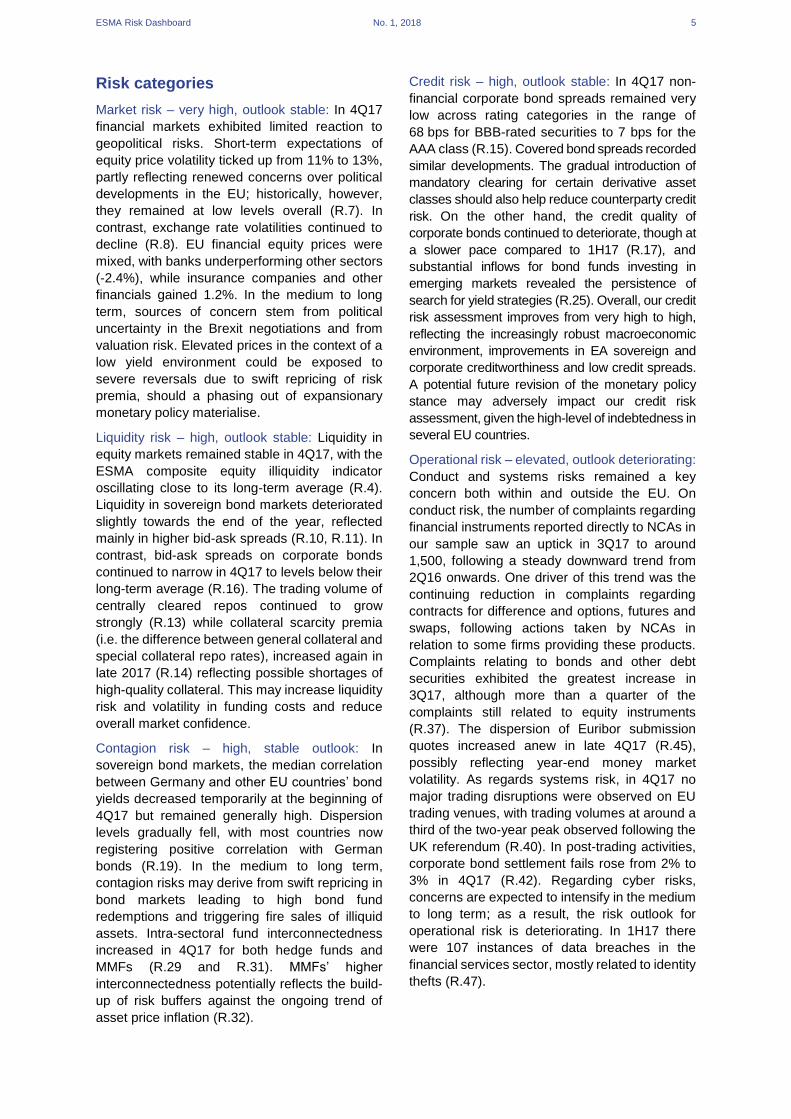
Systemic stress remained at very low levels in
4Q17, based on the composite systemic stress
indicator (R.2). Within securities markets, bond
markets again registered the highest contribution
to the systemic stress measure.
R.2 ESMA composite systemic stress indicator
Systemic risk broadly stable
-0.4
-0.2
0
0.2
0.4
0.6
Dec-13 Dec-14 Dec-15 Dec-16 Dec-17
Equity market contribution Bond market contribution
Money market contribution ESMA CISS
Correlation contribution
Note: ESMA version of the ECB-CISS indicator measuring sys temic str ess insecurities markets. It focuses on three financial market segments: equity , bondand money markets , aggregated through standard portfolio theory. It is based on
securities market indicators such as volatilities and risk spreads.Sources: ECB, ESMA.
ESMA Risk Dashboard No. 1, 2018 4
Risk sources
Macroeconomic environment: The EU’s
economic recovery continued in 4Q17.
Household spending remains an important driver
of the ongoing expansion, while fixed capital
investment is gaining momentum. Business
survey data point to the strongest economic
activity in several years and are still trending up.
Economic sentiment in the EU reached its
highest level since 2000, supported by a broad-
based increase in business and consumer
confidence. According to the European
Commission’s Autumn forecast, the EU economy
performed significantly better than expected in
2017, in line with stronger growth around the
world. EU GDP is now expected to have grown
by 2.3% in 2017 and to gradually slow over the
next two years to 2.1% in 2018 and 1.9% in 2019.
Downside risks to the growth outlook remain ‒
linked to global geopolitical events, a potential
slowdown in China, stronger appreciation of the
euro, and risks related to the outcome of the
Brexit negotiations.
Low interest-rate environment: In 4Q17, ECB
monetary policy remained highly accommodative
to ensure supportive financing conditions, while
BoE rates remained low despite an increase in
November. EA government bond yields declined
slightly in the reporting period, while corporate
bond spreads tightened again. The low-yield
environment thus persists, reinforcing risks
related to search-for-yield strategies. The high-
yield fund segment experienced some volatility in
4Q17, with a sharp decline in US high-yield
corporate bonds and net redemptions from EU-
domiciled funds of EUR 8bn. Another source of
concern stems from funds investing in emerging
market bonds, which registered net cumulative
inflows of EUR 71bn (R.25) and may be
particularly vulnerable to a sudden reversal in
global risk premia due to the lower liquidity of their
investment portfolio. Excessive risk-taking and
potential capital misallocation thus remain
relevant risk sources in the medium-term. In the
context of a persistently low interest yield
environment, abruptly increasing yields could
lead to losses for investment positions and
generate volatility spikes in asset prices.
EU sovereign debt markets: Ten-year EU
sovereign risk premia generally edged down in
4Q17 amid low interest rates and supportive
monetary policy. Sovereign yields seem to have
somewhat bottomed out for now following an
increase at the beginning of 2017, reflecting the
gradual improvement in the macroeconomic
context. In the medium to long-term, rising yields
could represent a source of risk in countries with
high levels of public and private debt. Sovereign
bond market liquidity remained ample in 4Q17,
although it decreased slightly towards the end of
the year (R.11).
Market functioning: No significant disruptions to
the functioning of EU markets were observed in
4Q17. During this period, the number of circuit
breaker occurrences remained low with a weekly
average of 38, compared to 121 in 1H17 (R.39).
The number of ongoing trading suspensions
increased, but these were concentrated mainly in
one EU Member State. Central clearing
continued to increase as implementation of the
clearing obligation for derivatives continues. In
August, the second delegated regulation
requiring mandatory clearing of certain index
CDS took effect for financial counterparties and
AIFs above the EUR 8bn threshold of gross
amounts outstanding. On 18 September, the final
migration wave to T2S was completed, with four
additional markets connecting to it: Estonia,
Latvia, Lithuania and Spain. T2S contributes to
the integration of post-trade processes across
participating markets. The total value of settled
transactions in the EU has increased since the
beginning of migration to T2S in June-August
2015. In 4Q17, the share of settlement fails
increased for corporate bonds, while declining for
equities (R.42). Cyber risk is increasingly
becoming a concern for financial market
institutions, especially with respect to their
business continuity and the integrity of
proprietary data, as illustrated by recent global
ransomware attacks.
Political and event risk: In the EU, Brexit is among
the most important political risks. The ongoing
negotiations between the EU27 and the UK on the
withdrawal terms represent a high source of
uncertainty for financial markets, despite the
absence of any visible reaction in EU markets ‒
foreign exchange markets aside. News flow and
announcements may further intensify political
and event risk, increase uncertainty and lead to
greater asset price volatility in EU markets. In
particular, a scenario in which negotiations remain
inconclusive or end in a disorderly fashion could
result in negative cliff effects in financial markets.
ESMA is calling on market participants to
thoroughly review any potential exposure to Brexit
cliff effect risks and address these as part of their
risk management.
ESMA Risk Dashboard No. 1, 2018 5
Risk categories
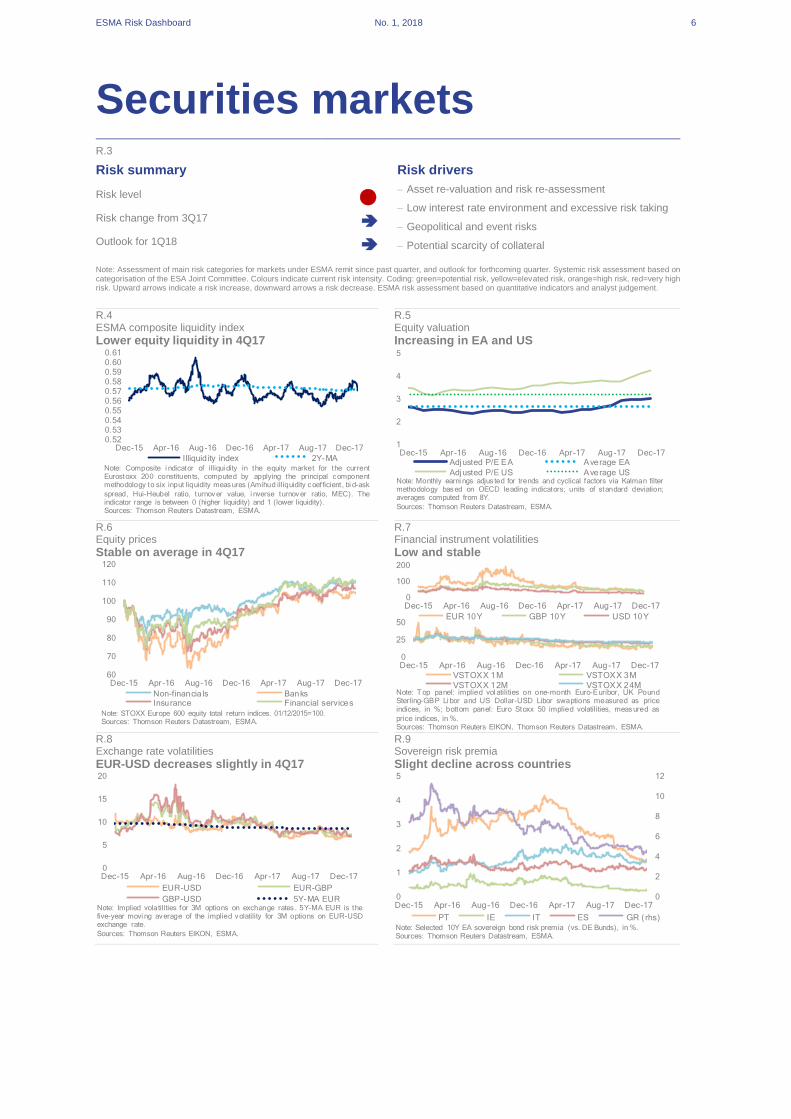
Market risk – very high, outlook stable: In 4Q17
financial markets exhibited limited reaction to
geopolitical risks. Short-term expectations of
equity price volatility ticked up from 11% to 13%,
partly reflecting renewed concerns over political
developments in the EU; historically, however,
they remained at low levels overall (R.7). In
contrast, exchange rate volatilities continued to
decline (R.8). EU financial equity prices were
mixed, with banks underperforming other sectors
(-2.4%), while insurance companies and other
financials gained 1.2%. In the medium to long
term, sources of concern stem from political
uncertainty in the Brexit negotiations and from
valuation risk. Elevated prices in the context of a
low yield environment could be exposed to
severe reversals due to swift repricing of risk
premia, should a phasing out of expansionary
monetary policy materialise.
Liquidity risk – high, outlook stable: Liquidity in
equity markets remained stable in 4Q17, with the
ESMA composite equity illiquidity indicator
oscillating close to its long-term average (R.4).
Liquidity in sovereign bond markets deteriorated
slightly towards the end of the year, reflected
mainly in higher bid-ask spreads (R.10, R.11). In
contrast, bid-ask spreads on corporate bonds
continued to narrow in 4Q17 to levels below their
long-term average (R.16). The trading volume of
centrally cleared repos continued to grow
strongly (R.13) while collateral scarcity premia
(i.e. the difference between general collateral and
special collateral repo rates), increased again in
late 2017 (R.14) reflecting possible shortages of
high-quality collateral. This may increase liquidity
risk and volatility in funding costs and reduce
overall market confidence.
Contagion risk – high, stable outlook: In
sovereign bond markets, the median correlation
between Germany and other EU countries’ bond
yields decreased temporarily at the beginning of
4Q17 but remained generally high. Dispersion
levels gradually fell, with most countries now
registering positive correlation with German
bonds (R.19). In the medium to long term,
contagion risks may derive from swift repricing in
bond markets leading to high bond fund
redemptions and triggering fire sales of illiquid
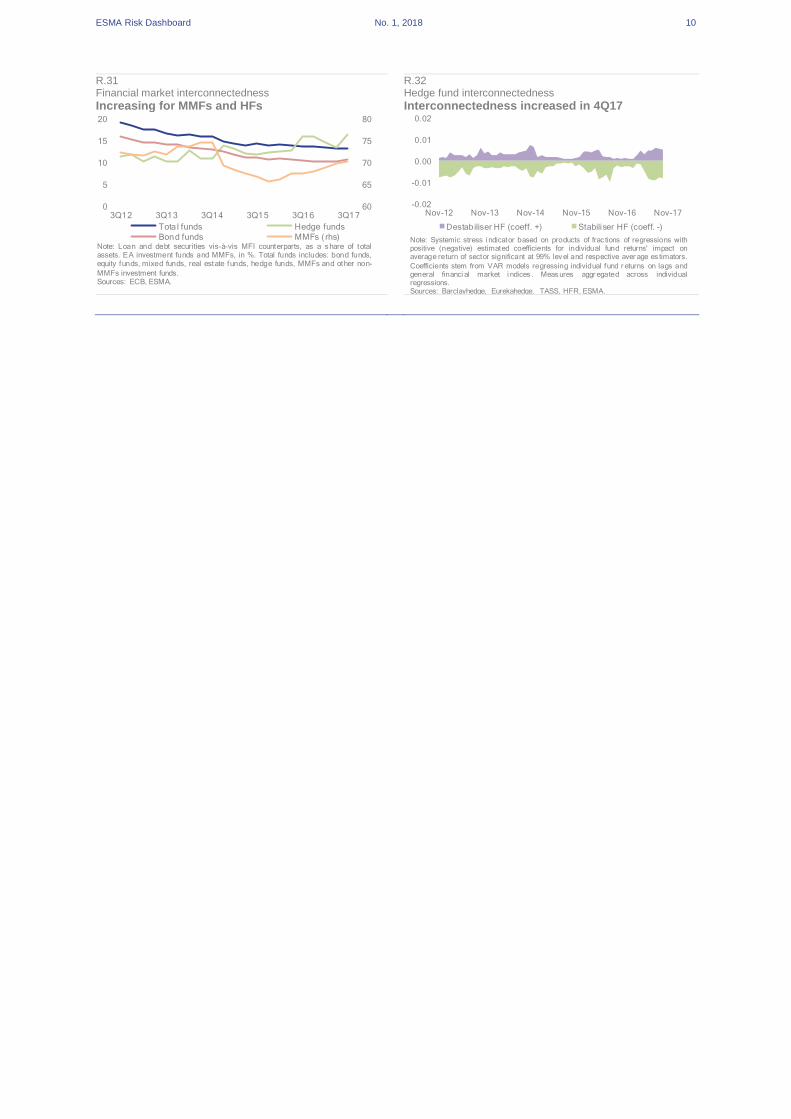
assets. Intra-sectoral fund interconnectedness
increased in 4Q17 for both hedge funds and
MMFs (R.29 and R.31). MMFs’ higher
interconnectedness potentially reflects the build-
up of risk buffers against the ongoing trend of
asset price inflation (R.32).
Credit risk – high, outlook stable: In 4Q17 non-
financial corporate bond spreads remained very
low across rating categories in the range of
68 bps for BBB-rated securities to 7 bps for the
AAA class (R.15). Covered bond spreads recorded
similar developments. The gradual introduction of
mandatory clearing for certain derivative asset
classes should also help reduce counterparty credit
risk. On the other hand, the credit quality of
corporate bonds continued to deteriorate, though at
a slower pace compared to 1H17 (R.17), and
substantial inflows for bond funds investing in
emerging markets revealed the persistence of
search for yield strategies (R.25). Overall, our credit
risk assessment improves from very high to high,
reflecting the increasingly robust macroeconomic
environment, improvements in EA sovereign and
corporate creditworthiness and low credit spreads.
A potential future revision of the monetary policy
stance may adversely impact our credit risk
assessment, given the high-level of indebtedness in
several EU countries.
Operational risk – elevated, outlook deteriorating:
Conduct and systems risks remained a key
concern both within and outside the EU. On
conduct risk, the number of complaints regarding
financial instruments reported directly to NCAs in
our sample saw an uptick in 3Q17 to around
1,500, following a steady downward trend from
2Q16 onwards. One driver of this trend was the
continuing reduction in complaints regarding
contracts for difference and options, futures and
swaps, following actions taken by NCAs in
relation to some firms providing these products.
Complaints relating to bonds and other debt
securities exhibited the greatest increase in
3Q17, although more than a quarter of the
complaints still related to equity instruments
(R.37). The dispersion of Euribor submission
quotes increased anew in late 4Q17 (R.45),
possibly reflecting year-end money market
volatility. As regards systems risk, in 4Q17 no
major trading disruptions were observed on EU
trading venues, with trading volumes at around a
third of the two-year peak observed following the
UK referendum (R.40). In post-trading activities,
corporate bond settlement fails rose from 2% to
3% in 4Q17 (R.42). Regarding cyber risks,
concerns are expected to intensify in the medium
to long term; as a result, the risk outlook for
operational risk is deteriorating. In 1H17 there
were 107 instances of data breaches in the
financial services sector, mostly related to identity
thefts (R.47).
ESMA Risk Dashboard No. 1, 2018 6
Securities markets R.3
Risk summary Risk drivers
Risk level – Asset re-valuation and risk re-assessment
– Low interest rate environment and excessive risk taking
– Geopolitical and event risks
– Potential scarcity of collateral
Risk change from 3Q17
Outlook for 1Q18
Note: Assessment of main risk categories for markets under ESMA remit since past quarter, and outlook for forthcoming quarter. Systemic risk assessment based on categorisation of the ESA Joint Committee. Colours indicate current risk intensity. Coding: green=potential risk, yellow=elevated risk, orange=high risk, red=very high risk. Upward arrows indicate a risk increase, downward arrows a risk decrease. ESMA risk assessment based on quantitative indicators and analyst judgement.
R.4 R.5 ESMA composite liquidity index Equity valuation
Lower equity liquidity in 4Q17 Increasing in EA and US
R.6 R.7 Equity prices Financial instrument volatilities
Stable on average in 4Q17 Low and stable
R.8 R.9 Exchange rate volatilities Sovereign risk premia
EUR-USD decreases slightly in 4Q17 Slight decline across countries
0.520.530.540.550.560.570.580.590.600.61
Dec-15 Apr-16 Aug-16 Dec-16 Apr-17 Aug-17 Dec-17
Illiquid ity index 2Y-MANote: Composite i ndicator of illiqui dity in the equity market for the currentEurostoxx 200 constituents, computed by applying the principal componentmethodology to six input liquidity measures (Amihud illiquidity coefficient, bi d-ask
spread, Hui-Heubel ratio, turnover value, i nverse turnover ratio, MEC). Theindicator range is between 0 (higher liquidity) and 1 (lower liquidity).Sources: Thomson Reuters Datastream, ESMA.
1
2
3
4
5
Dec-15 Apr-16 Aug-16 Dec-16 Apr-17 Aug-17 Dec-17Adjusted P/E EA Average EA
Adjusted P/E US Average USNote: Monthly earni ngs adjus ted for trends and cyclical factors via Kalman filtermethodology based on OECD leading indicators; units of standard deviation;averages computed from 8Y.
Sources: Thomson Reuters Datastream, ESMA.
60
70
80
90
100
110
120
Dec-15 Apr-16 Aug-16 Dec-16 Apr-17 Aug-17 Dec-17
Non-financia ls BanksInsurance Financial services
Note: STOXX Europe 600 equity total return indices. 01/12/2015=100.Sources: Thomson Reuters Datastream, ESMA.
0
25
50
Dec-15 Apr-16 Aug-16 Dec-16 Apr-17 Aug-17 Dec-17
VSTOXX 1M VSTOXX 3M
VSTOXX 12M VSTOXX 24MNote: T op panel: implied vol atilities on one-month Euro-Euribor, UK PoundSterling-GBP Li bor and US Dollar-USD Libor swaptions measured as priceindices, in %; bottom panel: Euro Stoxx 50 implied volatilities, measured as
price indices, in %.Sources: Thomson Reuters EIKON, Thomson Reuters Datastream, ESMA.
0
100
200
Dec-15 Apr-16 Aug-16 Dec-16 Apr-17 Aug-17 Dec-17
EUR 10Y GBP 10Y USD 10Y
0
5
10
15
20
Dec-15 Apr-16 Aug-16 Dec-16 Apr-17 Aug-17 Dec-17
EUR-USD EUR-GBP
GBP-USD 5Y-MA EURNote: Implied volatilities for 3M options on exchange rates . 5Y-MA EUR is thefive-year movi ng average of the implied volatility for 3M options on EUR-USDexchange rate.
Sources: Thomson Reuters EIKON, ESMA.
0
2
4
6
8
10
12
0
1
2
3
4
5
Dec-15 Apr-16 Aug-16 Dec-16 Apr-17 Aug-17 Dec-17
PT IE IT ES GR (rhs)Note: Selected 10Y EA sovereign bond risk premia (vs. DE Bunds), in %.Sources: Thomson Reuters Datastream, ESMA.
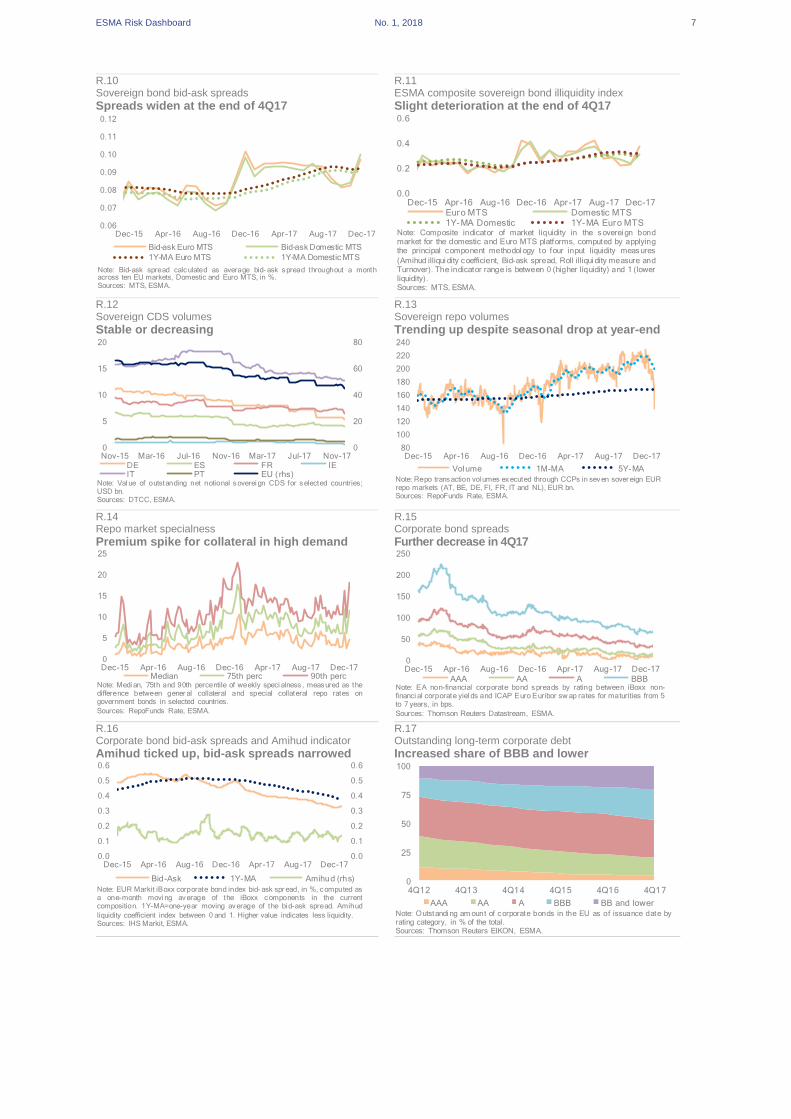
ESMA Risk Dashboard No. 1, 2018 7
R.10 R.11 Sovereign bond bid-ask spreads ESMA composite sovereign bond illiquidity index
Spreads widen at the end of 4Q17 Slight deterioration at the end of 4Q17
R.12 R.13 Sovereign CDS volumes
Sovereign repo volumes
Stable or decreasing Trending up despite seasonal drop at year-end
R.14 R.15 Repo market specialness Corporate bond spreads
Premium spike for collateral in high demand Further decrease in 4Q17
R.16 R.17 Corporate bond bid-ask spreads and Amihud indicator Outstanding long-term corporate debt
Amihud ticked up, bid-ask spreads narrowed Increased share of BBB and lower
0.06
0.07
0.08
0.09
0.10
0.11
0.12
Dec-15 Apr-16 Aug-16 Dec-16 Apr-17 Aug-17 Dec-17
Bid-ask Euro MTS Bid-ask Domestic MTS
1Y-MA Euro MTS 1Y-MA Domestic MTS
Note: Bid-ask spread calculated as average bid- ask spread throughout a monthacross ten EU markets, Domestic and Euro MTS, in %.Sources: MTS, ESMA.
0.0
0.2
0.4
0.6
Dec-15 Apr-16 Aug-16 Dec-16 Apr-17 Aug-17 Dec-17Euro MTS Domestic MTS1Y-MA Domestic 1Y-MA Euro MTS
Note: Composite indicator of market liquidity in the soverei gn bondmarket for the domestic and Euro MTS platforms, computed by applyingthe principal component methodol ogy to four input liquidity measures
(Amihud illiqui dity coefficient, Bid-ask spread, Roll illiqui dity measure andTurnover). The indicator range is between 0 (higher liquidity) and 1 (lowerliquidity).Sources: MTS, ESMA.
0
20
40
60
80
0
5
10
15
20
Nov-15 Mar-16 Jul-16 Nov-16 Mar-17 Jul-17 Nov-17DE ES FR IEIT PT EU ( rhs)
Note: Val ue of outstanding net notional soverei gn CDS for selected countries;USD bn.Sources: DTCC, ESMA.
80
100
120
140
160
180
200
220
240
Dec-15 Apr-16 Aug-16 Dec-16 Apr-17 Aug-17 Dec-17
Volume 1M-MA 5Y-MA
Note: Repo transaction vol umes executed through CCPs in seven sover eign EURrepo markets (AT, BE, DE, FI, FR, IT and NL), EUR bn.Sources: RepoFunds Rate, ESMA.
0
5
10
15
20
25
Dec-15 Apr-16 Aug-16 Dec-16 Apr-17 Aug-17 Dec-17Median 75th perc 90th perc
Note: Medi an, 75th and 90th percentile of weekly speci alness , measured as thedifference between gener al collateral and special collateral repo rates ongovernment bonds in selected countries.
Sources: RepoFunds Rate, ESMA.
0
50
100
150
200
250
Dec-15 Apr-16 Aug-16 Dec-16 Apr-17 Aug-17 Dec-17
AAA AA A BBBNote: EA non-financial corporate bond spreads by rating between iBoxx non-financi al corporate yiel ds and ICAP Euro Euribor sw ap rates for maturities from 5to 7 years, in bps.
Sources: Thomson Reuters Datastream, ESMA.
0.0
0.1
0.2
0.3
0.4
0.5
0.6
0.0
0.1
0.2
0.3
0.4
0.5
0.6
Dec-15 Apr-16 Aug-16 Dec-16 Apr-17 Aug-17 Dec-17
Bid-Ask 1Y-MA Amihud (rhs)
Note: EUR Markit iBoxx corporate bond index bid- ask spr ead, in %, computed asa one-month movi ng average of the iBoxx components in the currentcomposition. 1Y-MA=one-year moving average of the bi d-ask spread. Amihud
liquidity coefficient index between 0 and 1. Higher value indicates less liquidity.Sources: IHS Markit, ESMA.
0
25
50
75
100
4Q12 4Q13 4Q14 4Q15 4Q16 4Q17
AAA AA A BBB BB and lowerNote: Outstandi ng am ount of corporate bonds in the EU as of issuance date byrating category, in % of the total.Sources: Thomson Reuters EIKON, ESMA.
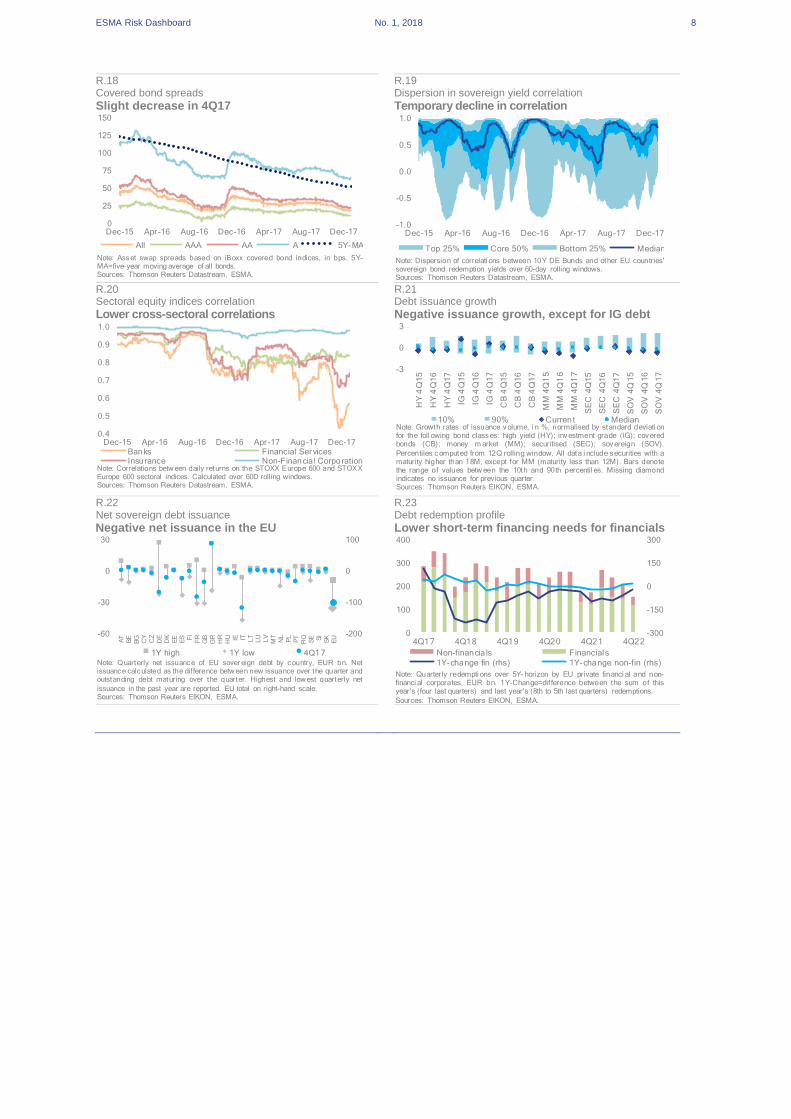
ESMA Risk Dashboard No. 1, 2018 8
R.18 R.19 Covered bond spreads
Dispersion in sovereign yield correlation
Slight decrease in 4Q17 Temporary decline in correlation
R.20 R.21 Sectoral equity indices correlation Debt issuance growth
Lower cross-sectoral correlations Negative issuance growth, except for IG debt
R.22 R.23 Net sovereign debt issuance Debt redemption profile
Negative net issuance in the EU Lower short-term financing needs for financials
0
25
50
75
100
125
150
Dec-15 Apr-16 Aug-16 Dec-16 Apr-17 Aug-17 Dec-17
All AAA AA A 5Y-MA
Note: Asset swap spreads based on iBoxx covered bond indices, in bps. 5Y-MA=five-year moving average of all bonds.Sources: Thomson Reuters Datastream, ESMA.
-1.0
-0.5
0.0
0.5
1.0
Dec-15 Apr-16 Aug-16 Dec-16 Apr-17 Aug-17 Dec-17
Top 25% Core 50% Bottom 25% Median
Note: Dispersion of correlati ons between 10Y DE Bunds and other EU countries'sovereign bond redemption yields over 60-day rolling windows.Sources: Thomson Reuters Datastream, ESMA.
0.4
0.5
0.6
0.7
0.8
0.9
1.0
Dec-15 Apr-16 Aug-16 Dec-16 Apr-17 Aug-17 Dec-17Banks Financial ServicesInsurance Non-Financia l Corporation
Note: Correlations betw een daily returns on the STOXX Europe 600 and STOXXEurope 600 sectoral indices. Calculated over 60D rolling windows.Sources: Thomson Reuters Datastream, ESMA.
-3
0
3
HY
4Q
15
HY
4Q
16
HY
4Q
17
IG 4
Q1
5
IG 4
Q1
6
IG 4
Q1
7
CB
4Q
15
CB
4Q
16
CB
4Q
17
MM
4Q
15
MM
4Q
16
MM
4Q
17
SE
C 4
Q1
5
SE
C 4
Q1
6
SE
C 4
Q1
7
SO
V 4
Q1
5
SO
V 4
Q1
6
SO
V 4
Q1
7
10% 90% Current MedianNote: Growth rates of issuance volume, i n %, normalised by standard deviati onfor the foll owing bond classes: high yield (HY); investment grade (IG); coveredbonds (CB); money m arket (MM); securitised (SEC); sovereign (SOV).
Percentiles computed from 12Q rolling window. All data i nclude securities with amaturity higher than 18M, except for MM (maturity less than 12M). Bars denotethe range of values betw een the 10th and 90th percentil es. Missing diamondindicates no issuance for previous quarter.Sources: Thomson Reuters EIKON, ESMA.
-200
-100
0
100
-60
-30
0
30
AT
BE
BG
CY
CZ
DE
DK
EE
ES FI
FR
GB
GR
HR
HU IE IT LT
LU
LV
MT
NL
PL
PT
RO
SE SI
SK
EU
1Y high 1Y low 4Q17Note: Quarterly net issuance of EU sover eign debt by country, EUR bn. Netissuance calculated as the dif ference betw een new issuance over the quarter andoutstanding debt maturing over the quarter. Highest and low est quarterly net
issuance in the past year are reported. EU total on right-hand scale.Sources: Thomson Reuters EIKON, ESMA.
-300
-150
0
150
300
0
100
200
300
400
4Q17 4Q18 4Q19 4Q20 4Q21 4Q22
Non-financia ls Financials
1Y-change fin (rhs) 1Y-change non-fin (rhs)
Note: Quarterly redempti ons over 5Y- horizon by EU private financi al and non-financi al corporates, EUR bn. 1Y-Change=dif ference between the sum of thisyear's (four last quarters) and last year's (8th to 5th last quarters) redemptions.
Sources: Thomson Reuters EIKON, ESMA.
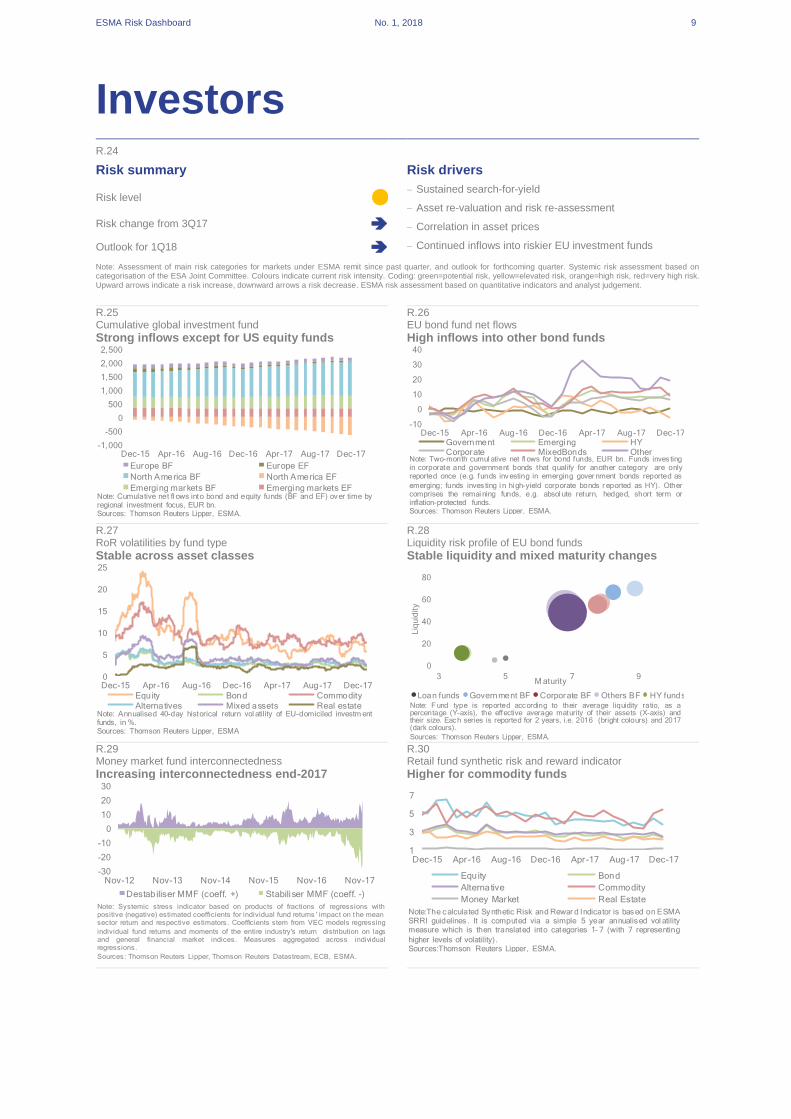
ESMA Risk Dashboard No. 1, 2018 9
Investors R.24
Risk summary Risk drivers
Risk level – Sustained search-for-yield
– Asset re-valuation and risk re-assessment
– Correlation in asset prices
– Continued inflows into riskier EU investment funds
Risk change from 3Q17
Outlook for 1Q18
Note: Assessment of main risk categories for markets under ESMA remit since past quarter, and outlook for forthcoming quarter. Systemic risk assessment based on categorisation of the ESA Joint Committee. Colours indicate current risk intensity. Coding: green=potential risk, yellow=elevated risk, orange=high risk, red=very high risk. Upward arrows indicate a risk increase, downward arrows a risk decrease. ESMA risk assessment based on quantitative indicators and analyst judgement.
R.25 R.26 Cumulative global investment fund EU bond fund net flows
Strong inflows except for US equity funds High inflows into other bond funds
R.27 R.28 RoR volatilities by fund type Liquidity risk profile of EU bond funds
Stable across asset classes Stable liquidity and mixed maturity changes
R.29 R.30 Money market fund interconnectedness Retail fund synthetic risk and reward indicator
Increasing interconnectedness end-2017 Higher for commodity funds
-1,000
-500
0
500
1,000
1,500
2,000
2,500
Dec-15 Apr-16 Aug-16 Dec-16 Apr-17 Aug-17 Dec-17
Europe BF Europe EF
North America BF North America EF
Emerging markets BF Emerging markets EFNote: Cumulative net fl ows into bond and equity funds (BF and EF) over time byregional investment focus, EUR bn.Sources: Thomson Reuters Lipper, ESMA.
-10
0
10
20
30
40
Dec-15 Apr-16 Aug-16 Dec-16 Apr-17 Aug-17 Dec-17Government Emerging HYCorporate MixedBonds Other
Note: Two-month cumul ative net fl ows for bond funds, EUR bn. Funds inves tingin corporate and government bonds that qualify for another category are onlyreported once (e.g. funds investing in emerging gover nment bonds reported as
emerging; funds inves ting i n hi gh-yield corporate bonds r eported as HY). Othercomprises the remai ning funds, e.g. absol ute return, hedged, short term orinflation-protected funds.Sources: Thomson Reuters Lipper, ESMA.
0
5
10
15
20
25
Dec-15 Apr-16 Aug-16 Dec-16 Apr-17 Aug-17 Dec-17
Equity Bond Commodity
Alternatives Mixed assets Real estateNote: Annualised 40-day historical return vol atility of EU-domiciled investm entfunds, in %.Sources: Thomson Reuters Lipper, ESMA
0
20
40
60
80
3 5 7 9
Liq
uid
ity
M aturity
Loan funds Government BF Corporate BF Others BF HY fundsNote: F und type is reported according to their average liquidity ratio, as apercentage (Y-axis), the effective average maturity of their assets (X-axis) andtheir size. Each series is reported for 2 years, i.e. 2016 (bright colours) and 2017(dark colours).
Sources: Thomson Reuters Lipper, ESMA.
-30
-20
-10
0
10
20
30
Nov-12 Nov-13 Nov-14 Nov-15 Nov-16 Nov-17
Destabiliser MMF (coeff. +) Stabiliser MMF (coeff. -)
Note: Systemic stress indicator based on products of fractions of regressions withpositive (negative) estimated coefficients for individual fund returns ' impact on t he meansector return and respective estimators. Coefficients stem from VEC models regressing
individual fund returns and moments of the entire industry's return distribution on lagsand general financial market indices. Measures aggregated across individualregressions.
Sources: Thomson Reuters Lipper, Thomson Reuters Datastream, ECB, ESMA.
1
3
5
7
Dec-15 Apr-16 Aug-16 Dec-16 Apr-17 Aug-17 Dec-17
Equity Bond
Alternative Commodity
Money Market Real Estate
Note:The calculated Synthetic Risk and Rewar d Indicator is based on ESMASRRI guidelines . It is computed via a simple 5 year annualised vol atilitymeasure which is then translated into categories 1- 7 (with 7 representing
higher levels of volatility).Sources:Thomson Reuters Lipper, ESMA.
ESMA Risk Dashboard No. 1, 2018 10
R.31 R.32 Financial market interconnectedness Hedge fund interconnectedness
Increasing for MMFs and HFs Interconnectedness increased in 4Q17
60
65
70
75
80
0
5
10
15
20
3Q12 3Q13 3Q14 3Q15 3Q16 3Q17
Tota l funds Hedge funds
Bond funds MMFs ( rhs)Note: Loan and debt securities vis-à-vis MFI counterparts, as a share of totalassets. EA investment funds and MMFs, in %. Total funds includes: bond funds,equity funds, mixed funds, real estate funds, hedge funds, MMFs and other non-
MMFs investment funds.Sources: ECB, ESMA.
-0.02
-0.01
0.00
0.01
0.02
Nov-12 Nov-13 Nov-14 Nov-15 Nov-16 Nov-17
Destabiliser HF (coeff. +) Stabiliser HF (coeff. -)
Note: Systemic stress i ndicator based on products of frac tions of regressions withpositive (negative) estimated coefficients for individual fund returns' impact onaverage return of sector significant at 99% level and respective aver age es timators.
Coefficients stem from VAR models regressing individual fund r eturns on lags andgeneral financi al market i ndices . Measures aggr egated across individualregressions.Sources: Barclayhedge, Eurekahedge, TASS, HFR, ESMA.
ESMA Risk Dashboard No. 1, 2018 11
Infrastructures and services R.33
Risk summary Risk drivers
Risk level – Operational risks, incl. cyber risks
– Conduct risk, incl. intentional or accidental behaviour by
individuals, market abuse
– Systemic relevance, interconnectedness between
infrastructures or financial activities, system substitutability
Risk change from 3Q17
Outlook for 1Q18
Note: Assessment of main risk categories for markets under ESMA remit since past quarter, and outlook for forthcoming quarter. Systemic risk assessment based on categorisation of the ESA Joint Committee. Colours indicate current risk intensity. Coding: green=potential risk, yellow=elevated risk, orange=high risk, red=very high risk. Upward arrows indicate a risk increase, downward arrows a risk decrease. ESMA risk assessment based on quantitative indicators and analyst judgement.
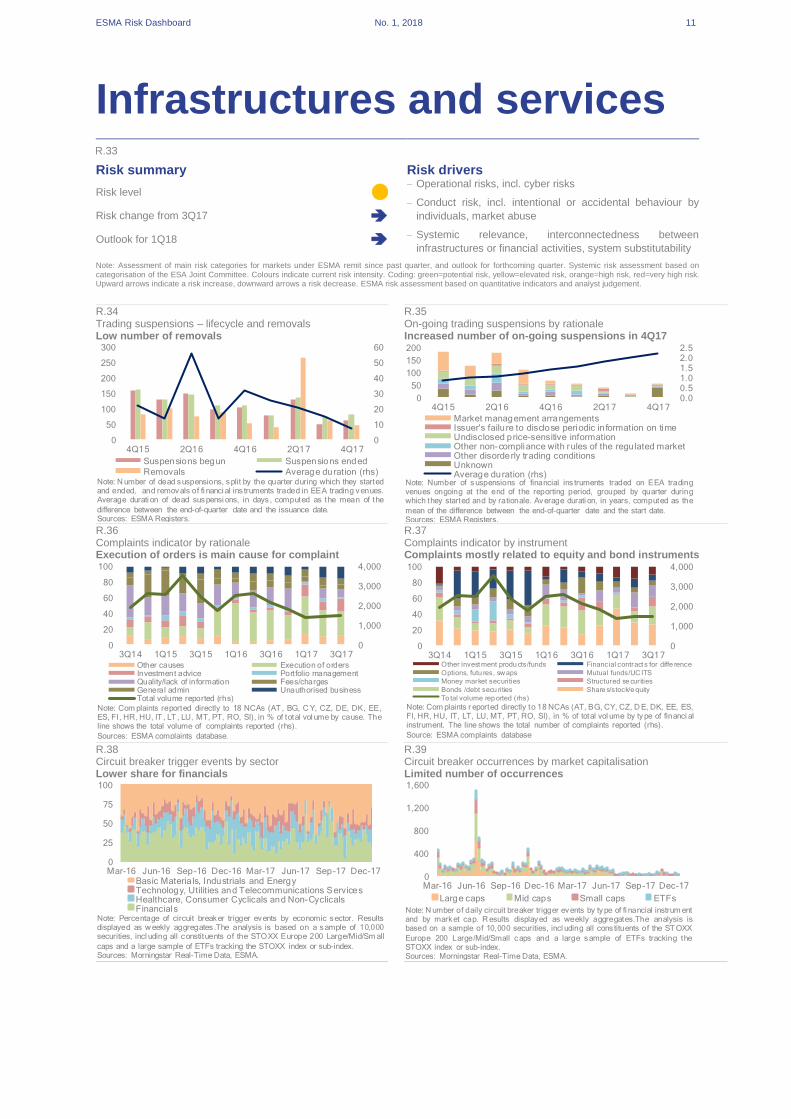
R.34 R.35 Trading suspensions – lifecycle and removals On-going trading suspensions by rationale Low number of removals Increased number of on-going suspensions in 4Q17
R.36 R.37 Complaints indicator by rationale Complaints indicator by instrument Execution of orders is main cause for complaint Complaints mostly related to equity and bond instruments
R.38 R.39 Circuit breaker trigger events by sector Circuit breaker occurrences by market capitalisation Lower share for financials Limited number of occurrences
0
10
20
30
40
50
60
0
50
100
150
200
250
300
4Q15 2Q16 4Q16 2Q17 4Q17
Suspensions begun Suspensions ended
Removals Average duration (rhs)Note: N umber of dead suspensions, split by the quarter during which they startedand ended, and removals of fi nanci al ins truments traded in EEA trading venues.Average durati on of dead suspensi ons, in days , computed as the mean of the
difference between the end-of-quarter date and the issuance date.Sources: ESMA Registers.
0.00.51.01.52.02.5
0
50
100
150
200
4Q15 2Q16 4Q16 2Q17 4Q17
Market management arrangementsIssuer's failure to disclose periodic in formation on timeUndisclosed price-sensitive informationOther non-compliance with rules of the regulated marketOther disorderly trading conditionsUnknownAverage duration (rhs)
Note: Number of suspensions of financial ins truments traded on EEA tradingvenues ongoing at the end of the reporting period, grouped by quarter duringwhich they started and by rationale. Average durati on, in years, computed as the
mean of the difference between the end-of-quarter date and the start date.Sources: ESMA Registers.
0
1,000
2,000
3,000
4,000
0
20
40
60
80
100
3Q14 1Q15 3Q15 1Q16 3Q16 1Q17 3Q17Other causes Execution of ordersInvestment advice Portfolio managementQuality/lack of information Fees/chargesGeneral admin Unauthorised businessTotal volume reported (rhs)
Note: Com plaints reported directly to 18 NCAs (AT , BG, C Y, CZ, DE, DK, EE,ES, FI, HR, HU, IT , LT , LU, MT, PT, RO, SI), in % of total vol ume by cause. Theline shows the total volume of complaints reported (rhs).
Sources: ESMA complaints database.
0
1,000
2,000
3,000
4,000
0
20
40
60
80
100
3Q14 1Q15 3Q15 1Q16 3Q16 1Q17 3Q17Other invest ment produ cts/funds Financial contract s for diffe rence
Options, futu res, sw aps Mutual funds/UCITS
Money market securities Structured se curities
Bonds /debt secu rities Share s/stock/e quity
To tal volume rep orted (rhs)
Note: Com plaints r eported directly to 18 NCAs (AT, BG, CY, CZ, D E, DK, EE, ES,FI, HR, HU, IT, LT, LU, MT, PT, RO, SI), in % of total vol ume by type of financi alinstrument. The line shows the total number of complaints reported (rhs).
Source: ESMA complaints database
0
25
50
75
100
Mar-16 Jun-16 Sep-16 Dec-16 Mar-17 Jun-17 Sep-17 Dec-17Basic Materia ls, Industrials and EnergyTechnology, Utilities and Telecommunications ServicesHealthcare, Consumer Cyclicals and Non-CyclicalsFinancials
Note: Percentage of circuit breaker trigger events by economic sector. Resultsdisplayed as w eekly aggregates.The analysis is based on a sample of 10,000securities, incl uding all constituents of the STOXX Europe 200 Large/Mid/Sm all
caps and a large sample of ETFs tracking the STOXX index or sub-index.Sources: Morningstar Real-Time Data, ESMA.
0
400
800
1,200
1,600
Mar-16 Jun-16 Sep-16 Dec-16 Mar-17 Jun-17 Sep-17 Dec-17
Large caps Mid caps Small caps ETFs
Note: N umber of daily circuit breaker trigger events by type of fi nancial instrum entand by market cap. R esults displayed as weekly aggregates.The analysis isbased on a sample of 10,000 securities, incl uding all cons tituents of the ST OXX
Europe 200 Large/Mid/Small caps and a large sample of ETFs tracking theSTOXX index or sub-index.Sources: Morningstar Real-Time Data, ESMA.
ESMA Risk Dashboard No. 1, 2018 12
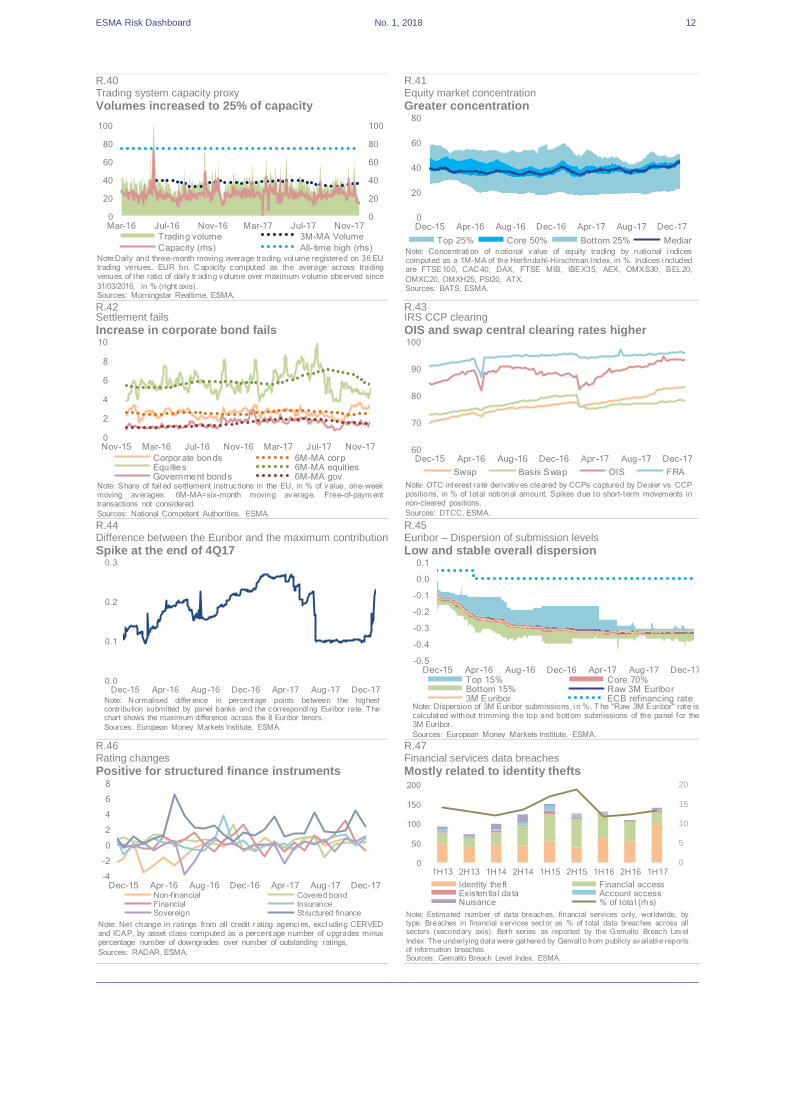
R.40 R.41 Trading system capacity proxy Equity market concentration
Volumes increased to 25% of capacity Greater concentration
R.42 R.43 Settlement fails IRS CCP clearing
Increase in corporate bond fails OIS and swap central clearing rates higher
R.44 R.45 Difference between the Euribor and the maximum contribution Euribor – Dispersion of submission levels
Spike at the end of 4Q17 Low and stable overall dispersion
R.46 R.47 Rating changes Financial services data breaches
Positive for structured finance instruments Mostly related to identity thefts
0
20
40
60
80
100
0
20
40
60
80
100
Mar-16 Jul-16 Nov-16 Mar-17 Jul-17 Nov-17
Trading volume 3M-MA Volume
Capacity (rhs) All- time high (rhs)Note:Daily and three-month moving average trading vol ume registered on 36 EUtrading venues, EUR bn. C apacity computed as the average across tradingvenues of the ratio of daily tr ading volume over maximum volume observed since
31/03/2016, in % (right axis).Sources: Morningstar Realtime, ESMA.
0
20
40
60
80
Dec-15 Apr-16 Aug-16 Dec-16 Apr-17 Aug-17 Dec-17
Top 25% Core 50% Bottom 25% MedianNote: Concentrati on of notional value of equity trading by national i ndicescomputed as a 1M-MA of the Herfindahl-Hirschman Index, in %. Indices i ncludedare FTSE100, CAC 40, DAX, FTSE MIB, IBEX35, AEX, OMXS30, BEL20,
OMXC20, OMXH25, PSI20, ATX.Sources: BATS, ESMA.
0
2
4
6
8
10
Nov-15 Mar-16 Jul-16 Nov-16 Mar-17 Jul-17 Nov-17
Corporate bonds 6M-MA corpEquities 6M-MA equitiesGovernment bonds 6M-MA gov
Note: Share of fail ed settlement instruc tions in the EU, in % of value, one-weekmoving averages. 6M-MA=six-month moving average. Free-of-paym enttransactions not considered.
Sources: National Competent Authorities, ESMA.
60
70
80
90
100
Dec-15 Apr-16 Aug-16 Dec-16 Apr-17 Aug-17 Dec-17
Swap Basis Swap OIS FRA
Note: OTC interest rate derivatives cleared by CCPs captured by Dealer vs. CCPpositions, in % of total noti onal amount. Spikes due to short-term movements innon-cleared positions.
Sources: DTCC, ESMA.
0.0
0.1
0.2
0.3
Dec-15 Apr-16 Aug-16 Dec-16 Apr-17 Aug-17 Dec-17
Note: N ormalised differ ence in percentage points between the highestcontribution submitted by panel banks and the correspondi ng Euribor rate. T hechart shows the maximum difference across the 8 Euribor tenors.
Sources: European Money Markets Institute, ESMA.
-0.5
-0.4
-0.3
-0.2
-0.1
0.0
0.1
Dec-15 Apr-16 Aug-16 Dec-16 Apr-17 Aug-17 Dec-17Top 15% Core 70%Bottom 15% Raw 3M Euribor3M Euribor ECB refinancing rate
Note: Dispersion of 3M Euribor submissions, i n %. T he "Raw 3M Euribor" rate iscalculated without trimming the top and bottom submissions of the panel for the3M Euribor.
Sources: European Money Markets Institute, ESMA.
-4
-2
0
2
4
6
8
Dec-15 Apr-16 Aug-16 Dec-16 Apr-17 Aug-17 Dec-17Non-f inancial Covered bondFinancial InsuranceSovereign Structured finance
Note: Net change in ratings from all credit r ating agenci es, excl uding CERVEDand ICAP, by asset class computed as a percentage number of upgrades minuspercentage number of downgrades over number of outstanding ratings.
Sources: RADAR, ESMA.
0
5
10
15
20
0
50
100
150
200
1H13 2H13 1H14 2H14 1H15 2H15 1H16 2H16 1H17
Identity theft Financial accessExistentia l data Account accessNuisance % of tota l (rhs)
Note: Estimated number of data breaches, financial services only, worldwide, bytype. Breaches in financial services sector as % of total data breaches across allsectors (secondary axis). Both series as reported by the Gemalto Breach Level
Index. The underlying data were gathered by Gemalto from publicly availabl e reportsof information breaches.Sources: Gemalto Breach Level Index, ESMA.

ESMA Risk Dashboard No. 4, 2017 13