Embed Size (px)
Citation preview
RISK DASHBOARD
DATA AS OF Q3 2019
2
Contents
1 Summary 3
2 Overview of the main risks and vulnerabilities in the EU banking sector 4
3 Heatmap 5
4 Risk Indicators (RIs)
4.1 Solvency Tier 1 capital ratio 6
Total capital ratio 7
CET1 ratio 8
CET1 ratio (fully loaded) 9
Leverage ratio 10
Leverage ratio (fully phased-in definition of Tier 1) 11
4.2 Credit Risk and Asset Quality Ratio of non-performing loans and advances (NPL ratio) 12
Coverage ratio for non-performing loans and advances 13
Forbearance ratio for loans and advances 14
Ratio of non-performing exposures (NPE ratio) 15
4.3 Profitability Return on equity 16
Return on assets 17
Cost to income ratio 18
Net interest income to total net operating income 19
Net fee and commission income to total net operating income 20
Net trading income to total net operating income 21
Net interest margin 22
Cost of Risk 23
4.4 Funding and Liquidity Loan-to-deposit ratio (for households and non-financial corporations)
24
Asset encumbrance ratio 25
Liquidity coverage ratio (%) 26
5 Annex 1: Statistical Annex Asset composition and volumes 28
IFRS9 specific data 29
Sovereign exposures 30
Liability composition and volumes 31
Risk-weighted asset composition and break-down of asset quality data
32
Exposures to Real Estate activities and Construction 33
Profitability analysis 34
6 Annex 2: Methodological note on the RIs heatmap 35
7 Annex 3: The RI and Annex database 36
3
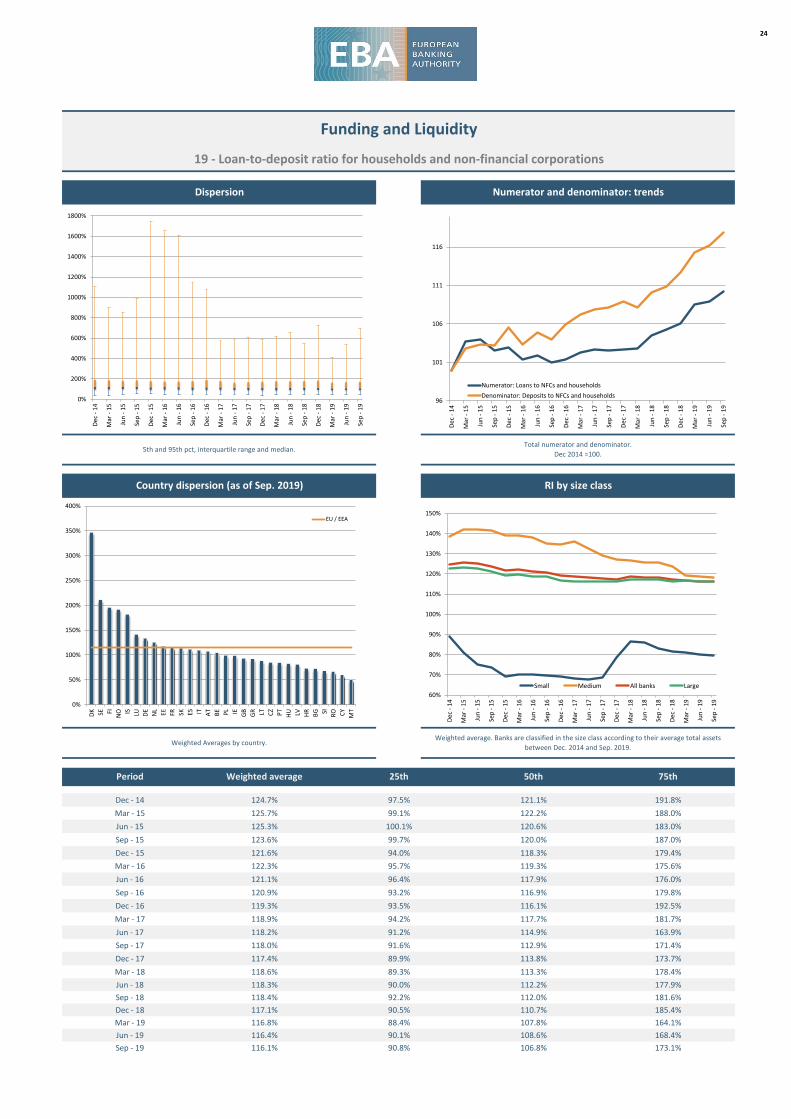
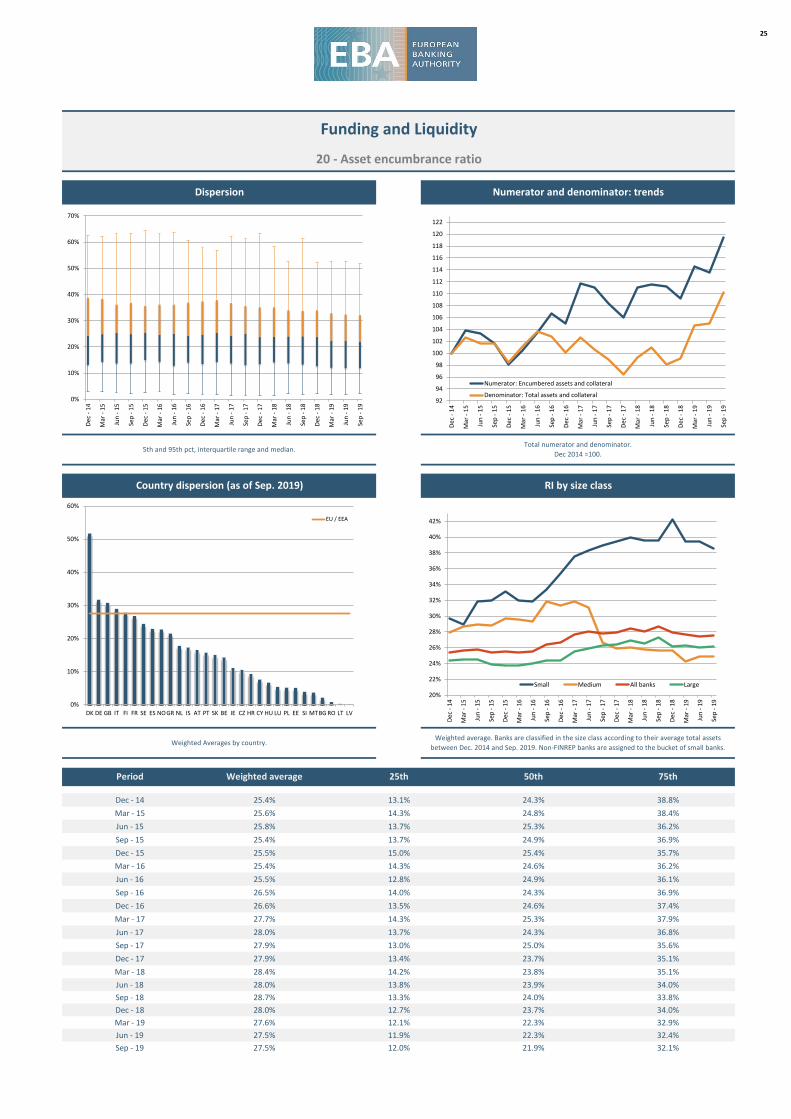
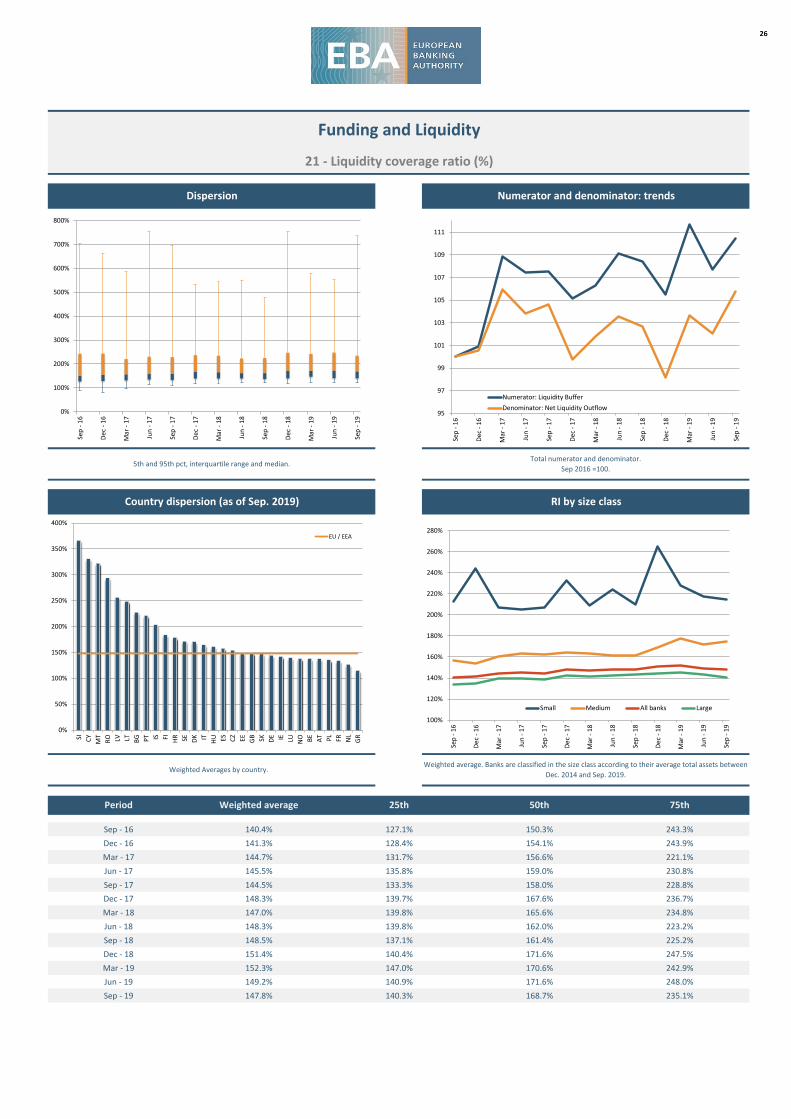
EU banks' loan to deposit ratio continued its long term contracting trend. The loan-to-deposit ratio forhouseholds and non-financial corporations decreased to 116.1% (down from 116.4% in the previousquarter). Whereas the asset encumbrance ratio remained unchanged at 27.5%, the liquidity coverage ratiofurther declined in Q3 from 149.2% to 147.8%.
*) This risk dashboard is based on a sample of Risk Indicators (RI) from 183 European banks (unconsolidated number of banks, including 36 subsidiaries; the list of the banks can be found under the link
https://www.eba.europa.eu/risk-analysis-and-data). The sample of banks is reviewed annually by competent authorities and adjusted accordingly (http://www.eba.europa.eu/documents/10180/16082/
EBA+DC+090+%28Decision+on+Reporting+by+Competent+Authorities+to+the+EBA%29.pdf/9beaf5be-2624-4e36-a75b-b77aa3164f3f). This can determine breaks in the time series. Ratios provided in the text are
weighted average if not otherwise stated. The data is based on the EBA’s implementing technical standards (ITS) on supervisory reporting (EU Regulation No 680/2014 and it subsequent amendments). In the chart on
Risk Indicators by size class, considering the distribution of the average total assets, the small banks are those below the first quartile, the large banks are those above the third quartile. Underlying data in this risk
dashboard has been compiled by the EBA since 2014 and it has served as basis for additional analyses included in EBA's Risk Assessment Report, last version published in November 2019.
Summary
EU banks’ capital ratios remained stable for the third quarter in a row. The CET1 ratio remained at 14.4%on a fully loaded basis with the increase in capital compensated by a parallel increase in risk exposureamounts (REA). Dispersion of capital ratios further narrowed in Q3. Similar to the capital ratios, the leverageratio remained stable at 5.2% on a fully loaded basis, and contracted slightly by 10bps to 5.3% on atransitional basis.
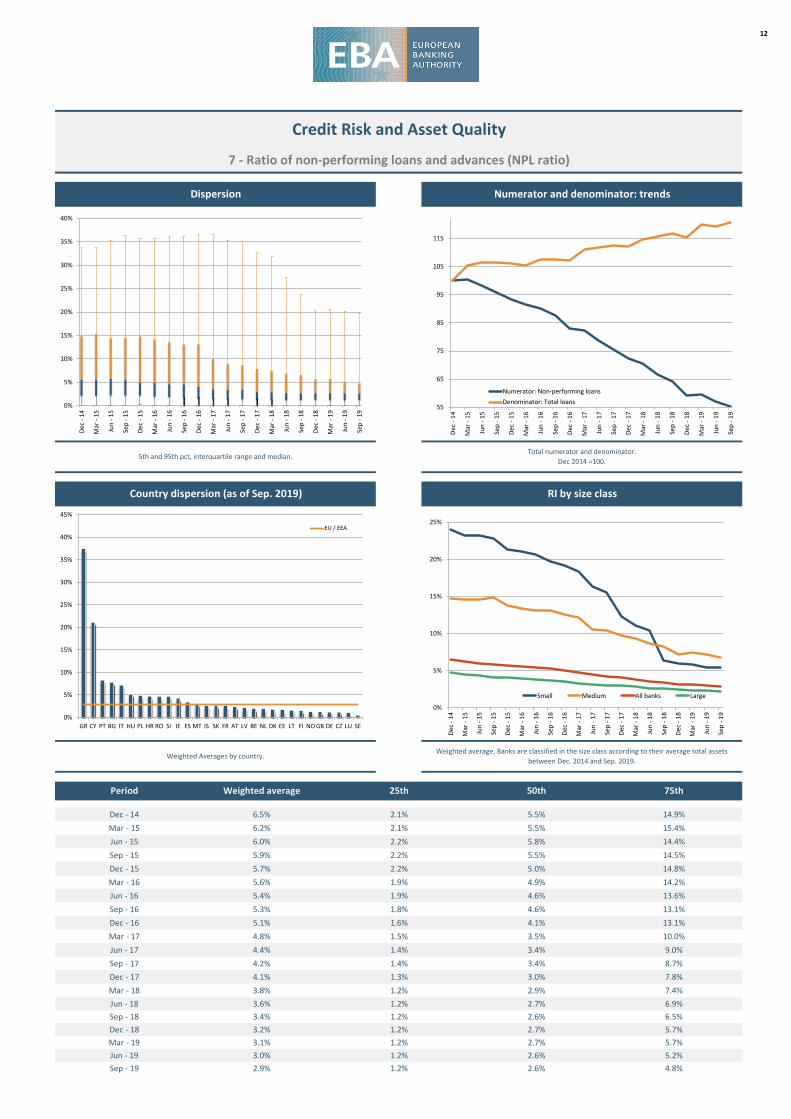
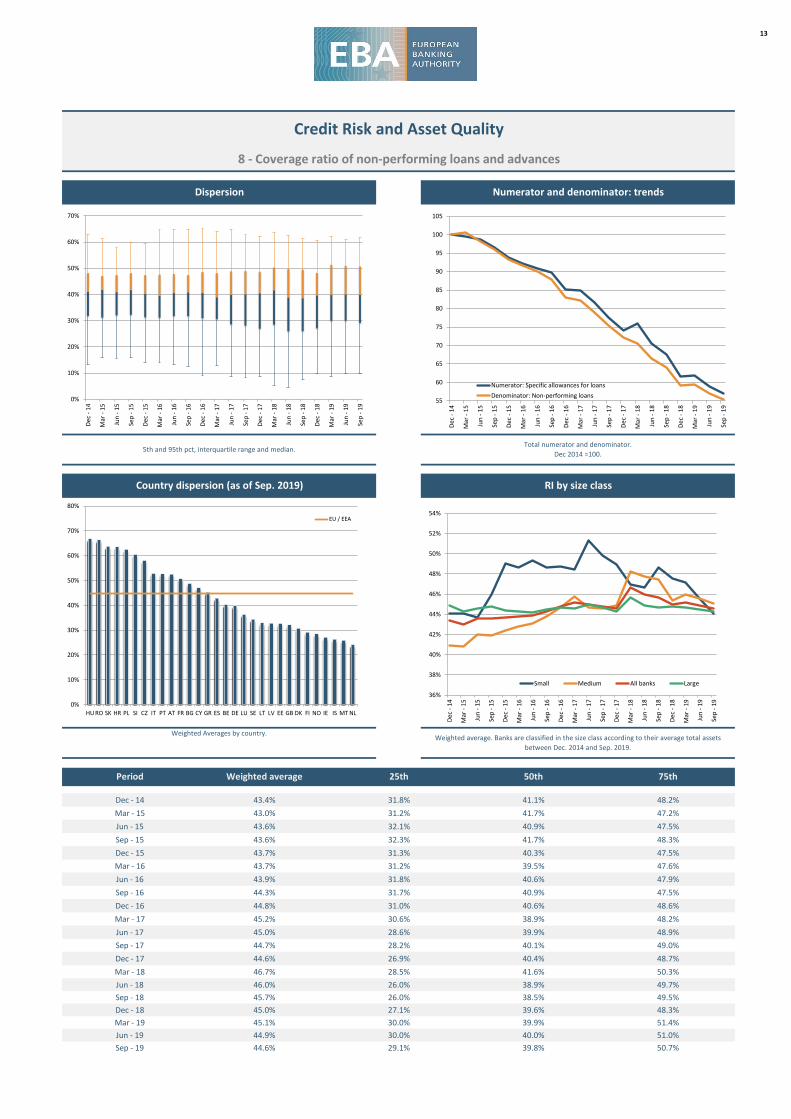
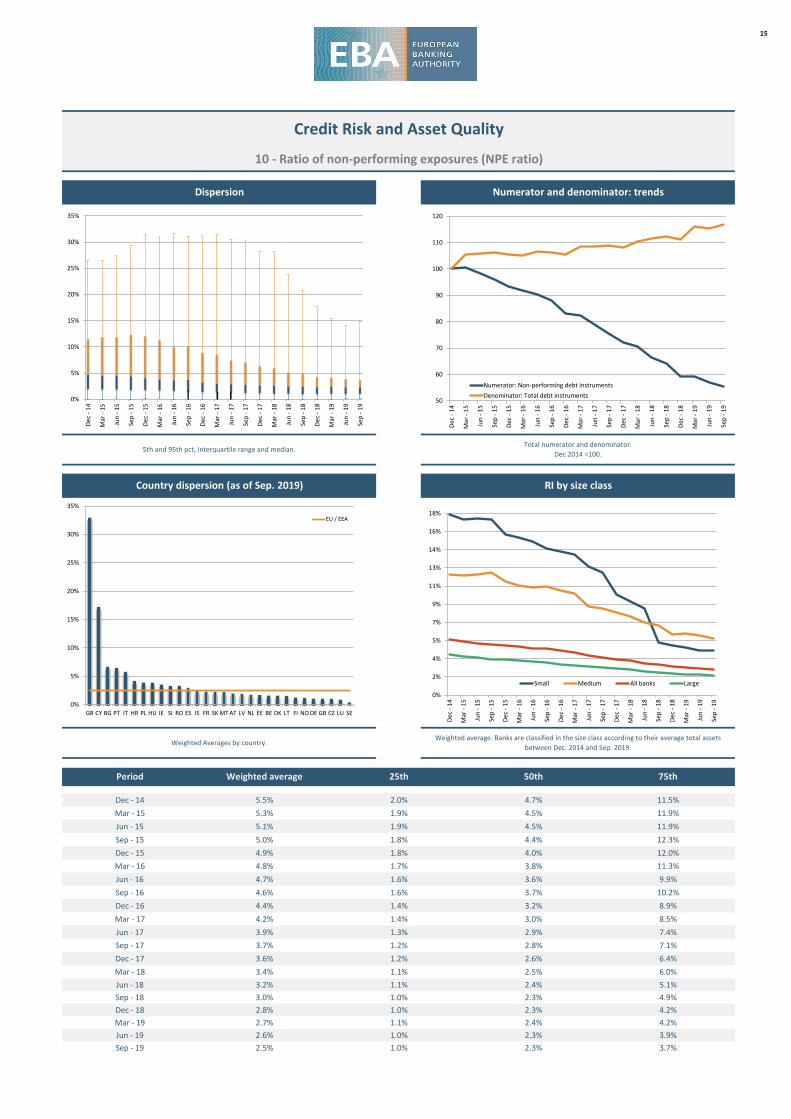
Asset quality kept on improving but at a slow pace. The ratio of non-performing loans (NPLs) furtherdeclined from 3.0% to 2.9%. In contrast to some of the previous quarters, the decrease was supported by acontraction in NPLs as well as a rise in total loans. The narrowing dispersion of the NPL ratio at the upperend of the distribution shows that high level NPL banks keep on successfully improving their asset quality.Similar to the NPL ratio, also the share of Stage 2 and Stage 3 contracted, both down by 10bps quarter-on-quarter (QoQ) to 6.9% and 3.3%, respectively. Banks' coverage ratio kept on declining, now standing at44.6%, from 44.9% the quarter before. In parallel to an increase in the share of derivatives in total assetsfrom 8.2% to 9.4% QoQ, also the share of level 2 and level 3 assets in total fair valued assets rose, from64.4% to 66.2% for the former, and from 3.2% to 3.6% for the latter. These developments might not least bedriven by valuation effects.
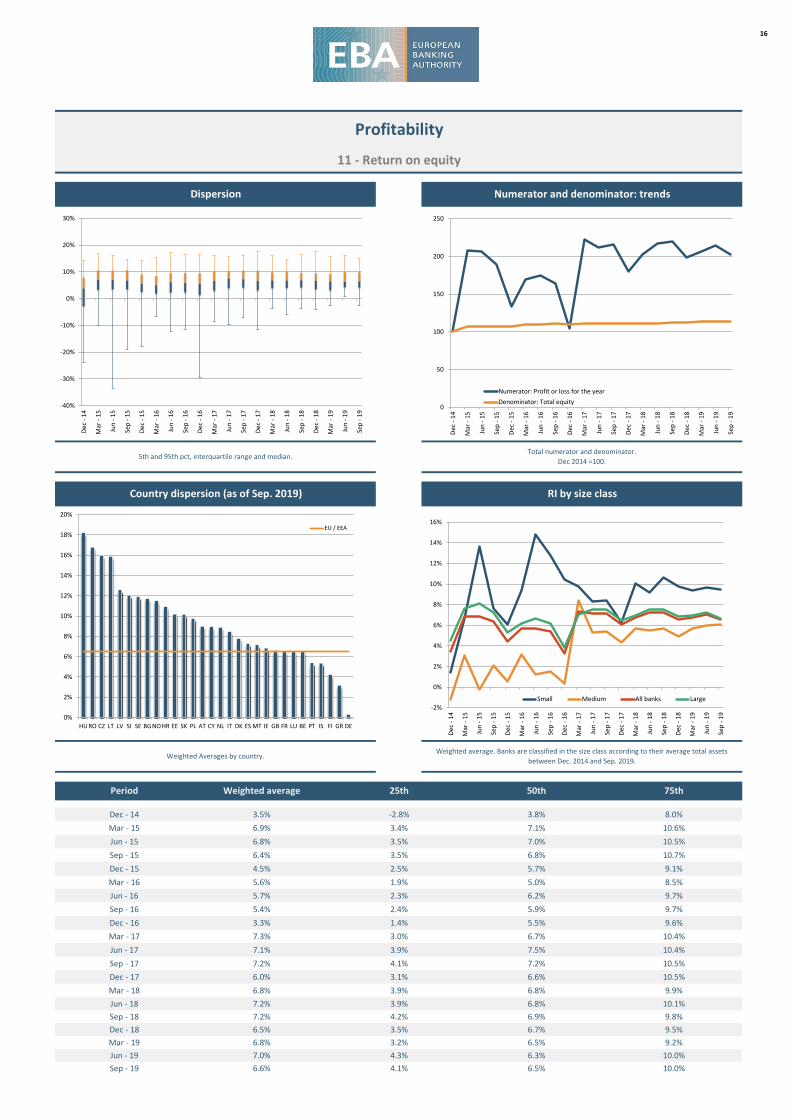
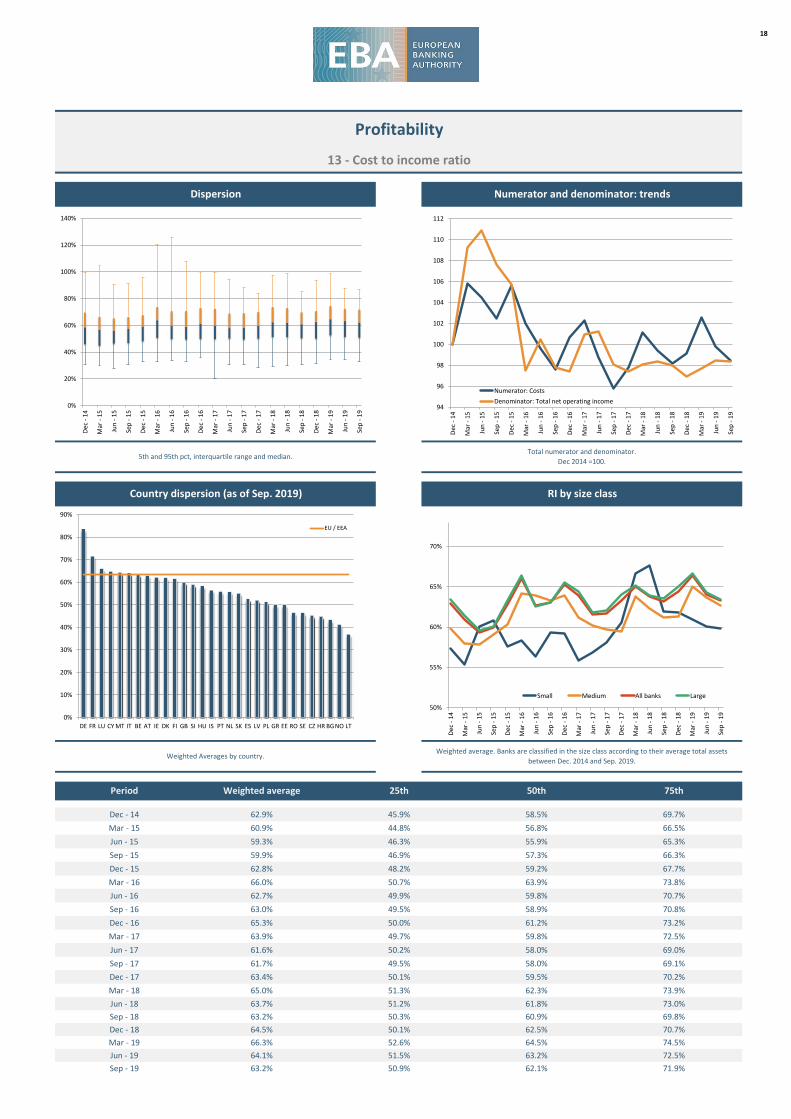
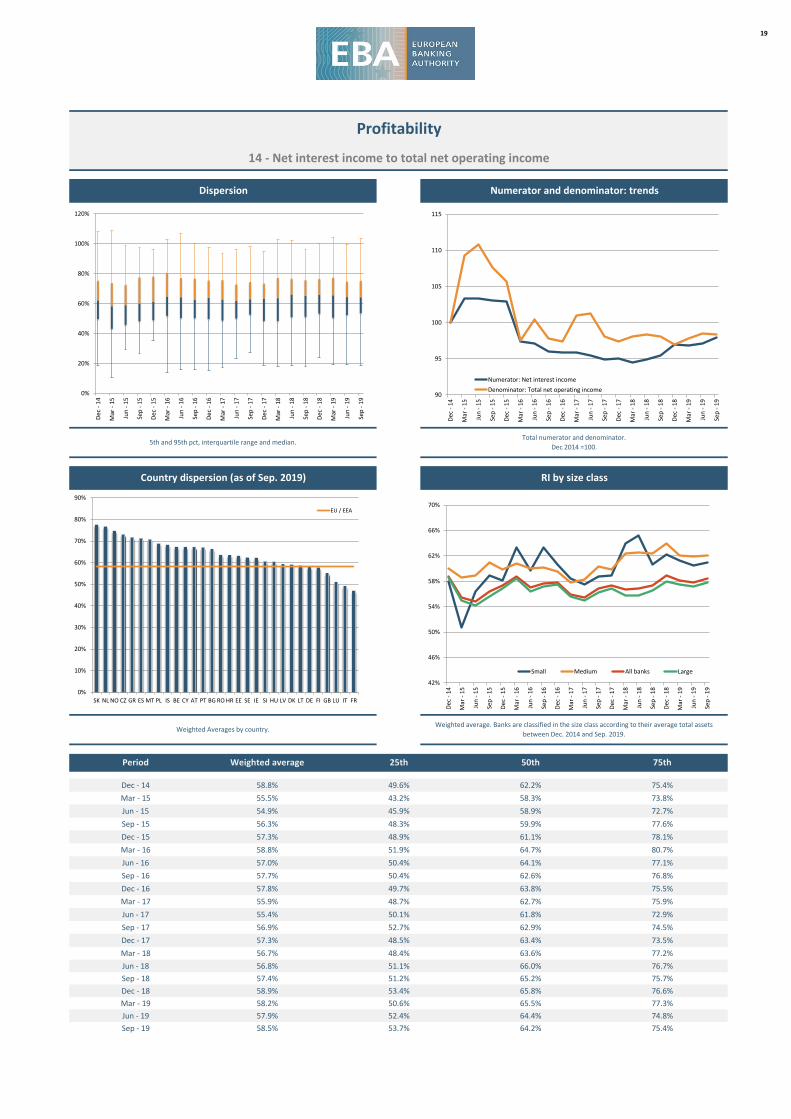
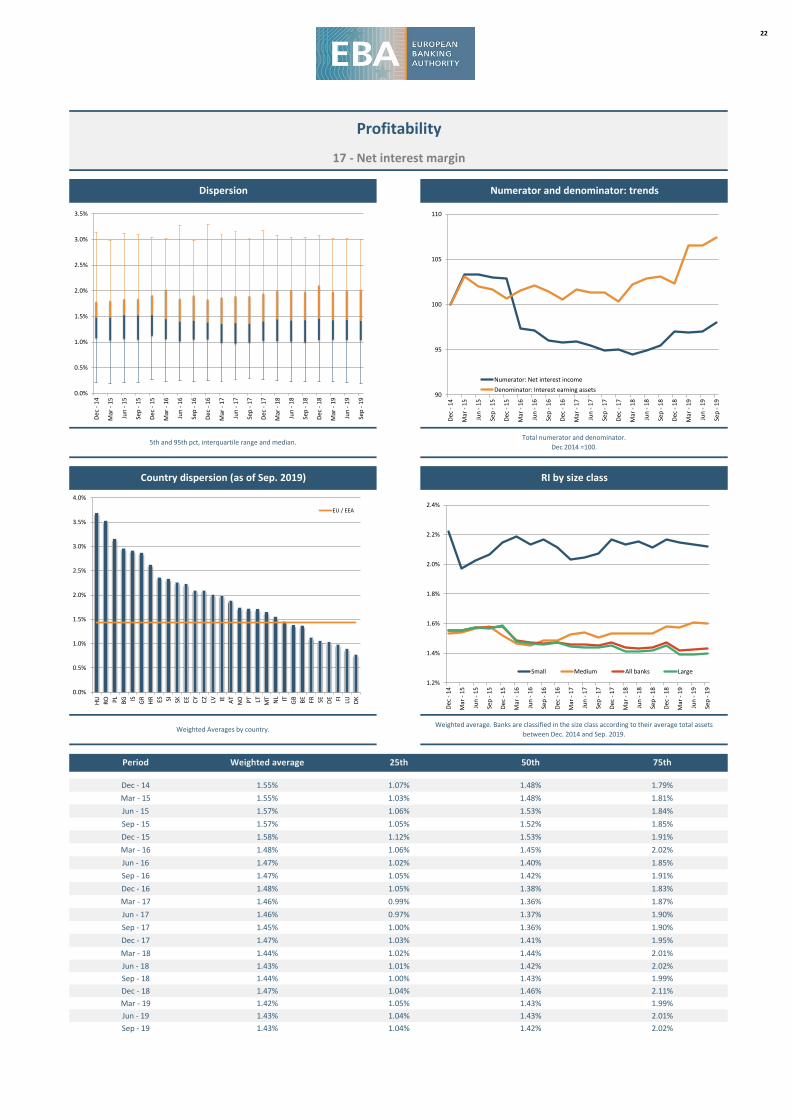
Return on equity (RoE) further contracted. Banks' RoE in Q3 was 6.6%, down by 40bps from the quarterbefore. Banks' cost to income ratio contracted by 90bps from Q2, continuing a trend from the previousquarter. Still, it remains high at 63.2%. Supported by an increasing volume of interest bearing assets, butdespite unchanged net interest margin (1.43%), the share of net interest income in total net operatingincome rose to 58.5%, which is 60bps higher than in the last quarter. Costs of risk remained broadly stableat 45bps.
4
Last risk dash-board
Current
0 0
- 1 0
0 0
- 1 - 1
0 0
- 1 0 1
High Medium Low
Increasing Stable Decreasing
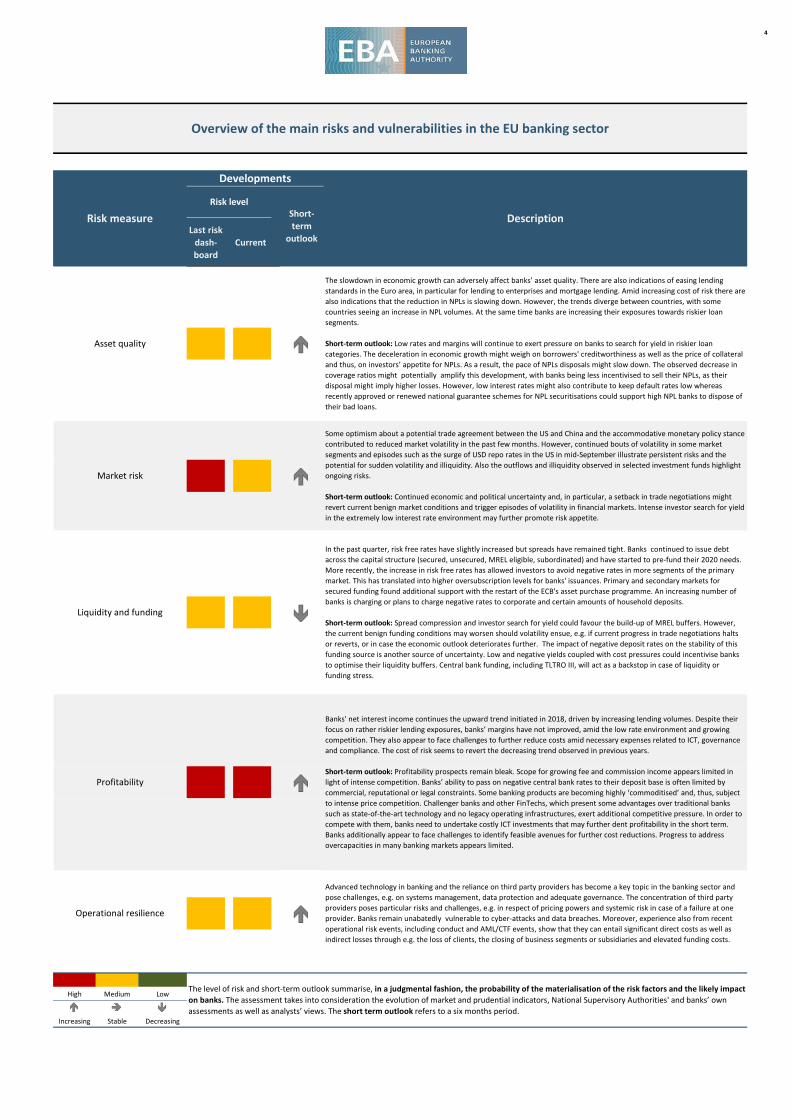
Overview of the main risks and vulnerabilities in the EU banking sector
Risk measure
Developments
DescriptionRisk level
Short-term
outlook
Asset quality
The slowdown in economic growth can adversely affect banks’ asset quality. There are also indications of easing lending standards in the Euro area, in particular for lending to enterprises and mortgage lending. Amid increasing cost of risk there are also indications that the reduction in NPLs is slowing down. However, the trends diverge between countries, with some countries seeing an increase in NPL volumes. At the same time banks are increasing their exposures towards riskier loan segments.
Short-term outlook: Low rates and margins will continue to exert pressure on banks to search for yield in riskier loan categories. The deceleration in economic growth might weigh on borrowers' creditworthiness as well as the price of collateral and thus, on investors’ appetite for NPLs. As a result, the pace of NPLs disposals might slow down. The observed decrease in coverage ratios might potentially amplify this development, with banks being less incentivised to sell their NPLs, as their disposal might imply higher losses. However, low interest rates might also contribute to keep default rates low whereas recently approved or renewed national guarantee schemes for NPL securitisations could support high NPL banks to dispose of their bad loans.
Market risk
Some optimism about a potential trade agreement between the US and China and the accommodative monetary policy stance contributed to reduced market volatility in the past few months. However, continued bouts of volatility in some market segments and episodes such as the surge of USD repo rates in the US in mid-September illustrate persistent risks and the potential for sudden volatility and illiquidity. Also the outflows and illiquidity observed in selected investment funds highlight ongoing risks.
Short-term outlook: Continued economic and political uncertainty and, in particular, a setback in trade negotiations might revert current benign market conditions and trigger episodes of volatility in financial markets. Intense investor search for yield in the extremely low interest rate environment may further promote risk appetite.
Liquidity and funding
In the past quarter, risk free rates have slightly increased but spreads have remained tight. Banks continued to issue debt across the capital structure (secured, unsecured, MREL eligible, subordinated) and have started to pre-fund their 2020 needs. More recently, the increase in risk free rates has allowed investors to avoid negative rates in more segments of the primary market. This has translated into higher oversubscription levels for banks' issuances. Primary and secondary markets for secured funding found additional support with the restart of the ECB's asset purchase programme. An increasing number of banks is charging or plans to charge negative rates to corporate and certain amounts of household deposits.
Short-term outlook: Spread compression and investor search for yield could favour the build-up of MREL buffers. However, the current benign funding conditions may worsen should volatility ensue, e.g. if current progress in trade negotiations halts or reverts, or in case the economic outlook deteriorates further. The impact of negative deposit rates on the stability of this funding source is another source of uncertainty. Low and negative yields coupled with cost pressures could incentivise banks to optimise their liquidity buffers. Central bank funding, including TLTRO III, will act as a backstop in case of liquidity or funding stress.
Profitability
Banks' net interest income continues the upward trend initiated in 2018, driven by increasing lending volumes. Despite their focus on rather riskier lending exposures, banks’ margins have not improved, amid the low rate environment and growing competition. They also appear to face challenges to further reduce costs amid necessary expenses related to ICT, governance and compliance. The cost of risk seems to revert the decreasing trend observed in previous years.
Short-term outlook: Profitability prospects remain bleak. Scope for growing fee and commission income appears limited in light of intense competition. Banks’ ability to pass on negative central bank rates to their deposit base is often limited by commercial, reputational or legal constraints. Some banking products are becoming highly ‘commoditised’ and, thus, subject to intense price competition. Challenger banks and other FinTechs, which present some advantages over traditional banks such as state-of-the-art technology and no legacy operating infrastructures, exert additional competitive pressure. In order to compete with them, banks need to undertake costly ICT investments that may further dent profitability in the short term. Banks additionally appear to face challenges to identify feasible avenues for further cost reductions. Progress to address overcapacities in many banking markets appears limited.
Operational resilience
Advanced technology in banking and the reliance on third party providers has become a key topic in the banking sector and pose challenges, e.g. on systems management, data protection and adequate governance. The concentration of third party providers poses particular risks and challenges, e.g. in respect of pricing powers and systemic risk in case of a failure at one provider. Banks remain unabatedly vulnerable to cyber-attacks and data breaches. Moreover, experience also from recent operational risk events, including conduct and AML/CTF events, show that they can entail significant direct costs as well as indirect losses through e.g. the loss of clients, the closing of business segments or subsidiaries and elevated funding costs.
The level of risk and short-term outlook summarise, in a judgmental fashion, the probability of the materialisation of the risk factors and the likely impact on banks. The assessment takes into consideration the evolution of market and prudential indicators, National Supervisory Authorities' and banks’ own assessments as well as analysts’ views. The short term outlook refers to a six months period.
5
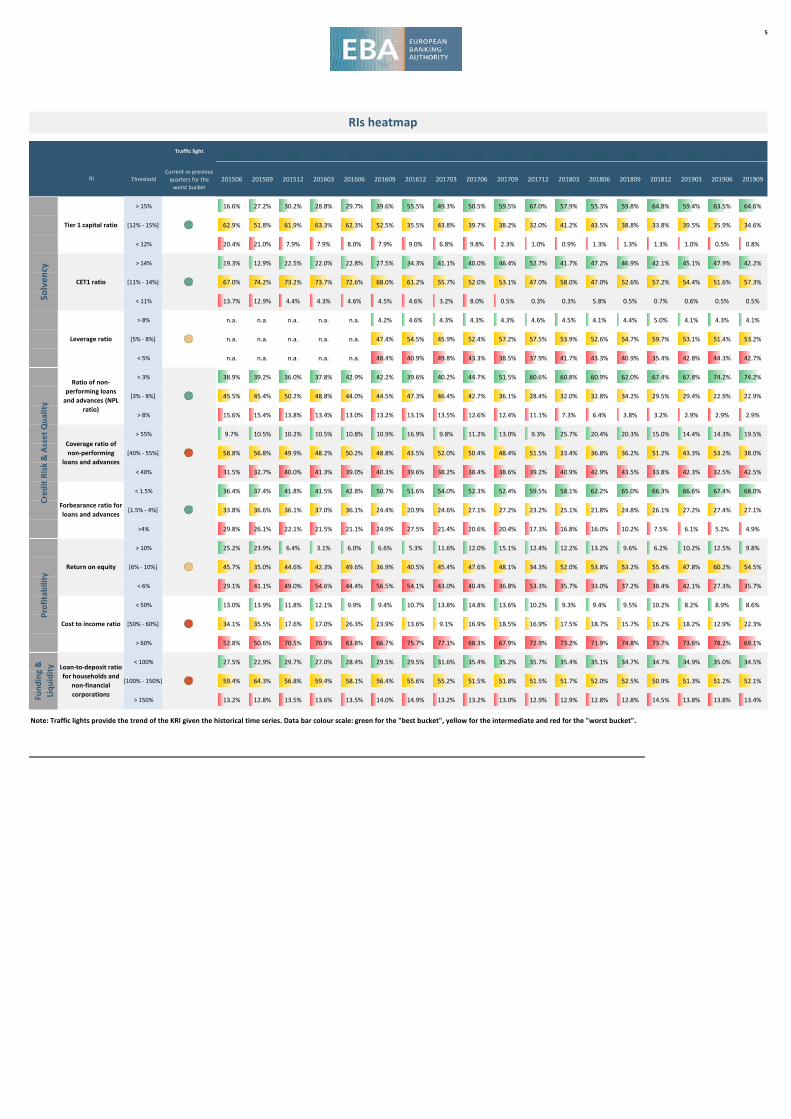
154 154 153 157 157 156 158 153 151 151 152 151 151 149 149 150 147 147
ThresholdCurrent vs previous
quarters for the worst bucket
201506 201509 201512 201603 201606 201609 201612 201703 201706 201709 201712 201803 201806 201809 201812 201903 201906 201909
> 15% 16.6% 27.2% 30.2% 28.8% 29.7% 39.6% 55.5% 49.3% 50.5% 59.5% 67.0% 57.9% 55.3% 59.8% 64.8% 59.4% 63.5% 64.6%
[12% - 15%] 62.9% 51.8% 61.9% 63.3% 62.3% 52.5% 35.5% 43.8% 39.7% 38.2% 32.0% 41.2% 43.5% 38.8% 33.8% 39.5% 35.9% 34.6%
< 12% 20.4% 21.0% 7.9% 7.9% 8.0% 7.9% 9.0% 6.8% 9.8% 2.3% 1.0% 0.9% 1.3% 1.3% 1.3% 1.0% 0.5% 0.8%
> 14% 19.3% 12.9% 22.5% 22.0% 22.8% 27.5% 34.3% 41.1% 40.0% 46.4% 52.7% 41.7% 47.2% 46.9% 42.1% 45.1% 47.9% 42.2%
[11% - 14%] 67.0% 74.2% 73.2% 73.7% 72.6% 68.0% 61.2% 55.7% 52.0% 53.1% 47.0% 58.0% 47.0% 52.6% 57.2% 54.4% 51.6% 57.3%
< 11% 13.7% 12.9% 4.4% 4.3% 4.6% 4.5% 4.6% 3.2% 8.0% 0.5% 0.3% 0.3% 5.8% 0.5% 0.7% 0.6% 0.5% 0.5%
> 8% n.a. n.a. n.a. n.a. n.a. 4.2% 4.6% 4.3% 4.3% 4.3% 4.6% 4.5% 4.1% 4.4% 5.0% 4.1% 4.3% 4.1%
[5% - 8%] n.a. n.a. n.a. n.a. n.a. 47.4% 54.5% 45.9% 52.4% 57.2% 57.5% 53.9% 52.6% 54.7% 59.7% 53.1% 51.4% 53.2%
< 5% n.a. n.a. n.a. n.a. n.a. 48.4% 40.9% 49.8% 43.3% 38.5% 37.9% 41.7% 43.3% 40.9% 35.4% 42.8% 44.3% 42.7%
< 3% 38.9% 39.2% 36.0% 37.8% 42.9% 42.2% 39.6% 40.2% 44.7% 51.5% 60.6% 60.8% 60.9% 62.0% 67.4% 67.8% 74.2% 74.2%
[3% - 8%] 45.5% 45.4% 50.2% 48.8% 44.0% 44.5% 47.3% 46.4% 42.7% 36.1% 28.4% 32.0% 32.8% 34.2% 29.5% 29.4% 22.9% 22.9%
> 8% 15.6% 15.4% 13.8% 13.4% 13.0% 13.2% 13.1% 13.5% 12.6% 12.4% 11.1% 7.3% 6.4% 3.8% 3.2% 2.9% 2.9% 2.9%
> 55% 9.7% 10.5% 10.2% 10.5% 10.8% 10.9% 16.9% 9.8% 11.2% 13.0% 9.3% 25.7% 20.4% 20.3% 15.0% 14.4% 14.3% 19.5%
[40% - 55%] 58.8% 56.8% 49.9% 48.2% 50.2% 48.8% 43.5% 52.0% 50.4% 48.4% 51.5% 33.4% 36.8% 36.2% 51.2% 43.3% 53.2% 38.0%
< 40% 31.5% 32.7% 40.0% 41.3% 39.0% 40.3% 39.6% 38.2% 38.4% 38.6% 39.2% 40.9% 42.9% 43.5% 33.8% 42.3% 32.5% 42.5%
< 1.5% 36.4% 37.4% 41.8% 41.5% 42.8% 50.7% 51.6% 54.0% 52.3% 52.4% 59.5% 58.1% 62.2% 65.0% 66.3% 66.6% 67.4% 68.0%
[1.5% - 4%] 33.8% 36.6% 36.1% 37.0% 36.1% 24.4% 20.9% 24.6% 27.1% 27.2% 23.2% 25.1% 21.8% 24.8% 26.1% 27.2% 27.4% 27.1%
>4% 29.8% 26.1% 22.1% 21.5% 21.1% 24.9% 27.5% 21.4% 20.6% 20.4% 17.3% 16.8% 16.0% 10.2% 7.5% 6.1% 5.2% 4.9%
> 10% 25.2% 23.9% 6.4% 3.1% 6.0% 6.6% 5.3% 11.6% 12.0% 15.1% 12.4% 12.2% 13.2% 9.6% 6.2% 10.2% 12.5% 9.8%
[6% - 10%] 45.7% 35.0% 44.6% 42.3% 49.6% 36.9% 40.5% 45.4% 47.6% 48.1% 34.3% 52.0% 53.8% 53.2% 55.4% 47.8% 60.2% 54.5%
< 6% 29.1% 41.1% 49.0% 54.6% 44.4% 56.5% 54.1% 43.0% 40.4% 36.8% 53.3% 35.7% 33.0% 37.2% 38.4% 42.1% 27.3% 35.7%
< 50% 13.0% 13.9% 11.8% 12.1% 9.9% 9.4% 10.7% 13.8% 14.8% 13.6% 10.2% 9.3% 9.4% 9.5% 10.2% 8.2% 8.9% 8.6%
[50% - 60%] 34.1% 35.5% 17.6% 17.0% 26.3% 23.9% 13.6% 9.1% 16.9% 18.5% 16.9% 17.5% 18.7% 15.7% 16.2% 18.2% 12.9% 22.3%
> 60% 52.8% 50.6% 70.5% 70.9% 63.8% 66.7% 75.7% 77.1% 68.3% 67.9% 72.9% 73.2% 71.9% 74.8% 73.7% 73.6% 78.2% 69.1%
< 100% 27.5% 22.9% 29.7% 27.0% 28.4% 29.5% 29.5% 31.6% 35.4% 35.2% 35.7% 35.4% 35.1% 34.7% 34.7% 34.9% 35.0% 34.5%
[100% - 150%] 59.4% 64.3% 56.8% 59.4% 58.1% 56.4% 55.6% 55.2% 51.5% 51.8% 51.5% 51.7% 52.0% 52.5% 50.9% 51.3% 51.2% 52.1%
> 150% 13.2% 12.8% 13.5% 13.6% 13.5% 14.0% 14.9% 13.2% 13.2% 13.0% 12.9% 12.9% 12.8% 12.8% 14.5% 13.8% 13.8% 13.4%Fund
ing
&
Liqu
idity
Solv
ency
Ratio of non-performing loans
and advances (NPL ratio)
RI
Tier 1 capital ratio
CET1 ratio
Leverage ratio
RIs heatmap
Return on equity
Forbearance ratio for loans and advances
Coverage ratio of non-performing
loans and advances
Traffic light
Cred
it Ri
sk &
Ass
et Q
ualit
y
Cost to income ratio
Loan-to-deposit ratio for households and
non-financial corporations
Prof
itabi
lity
Note: Traffic lights provide the trend of the KRI given the historical time series. Data bar colour scale: green for the "best bucket", yellow for the intermediate and red for the "worst bucket".
6
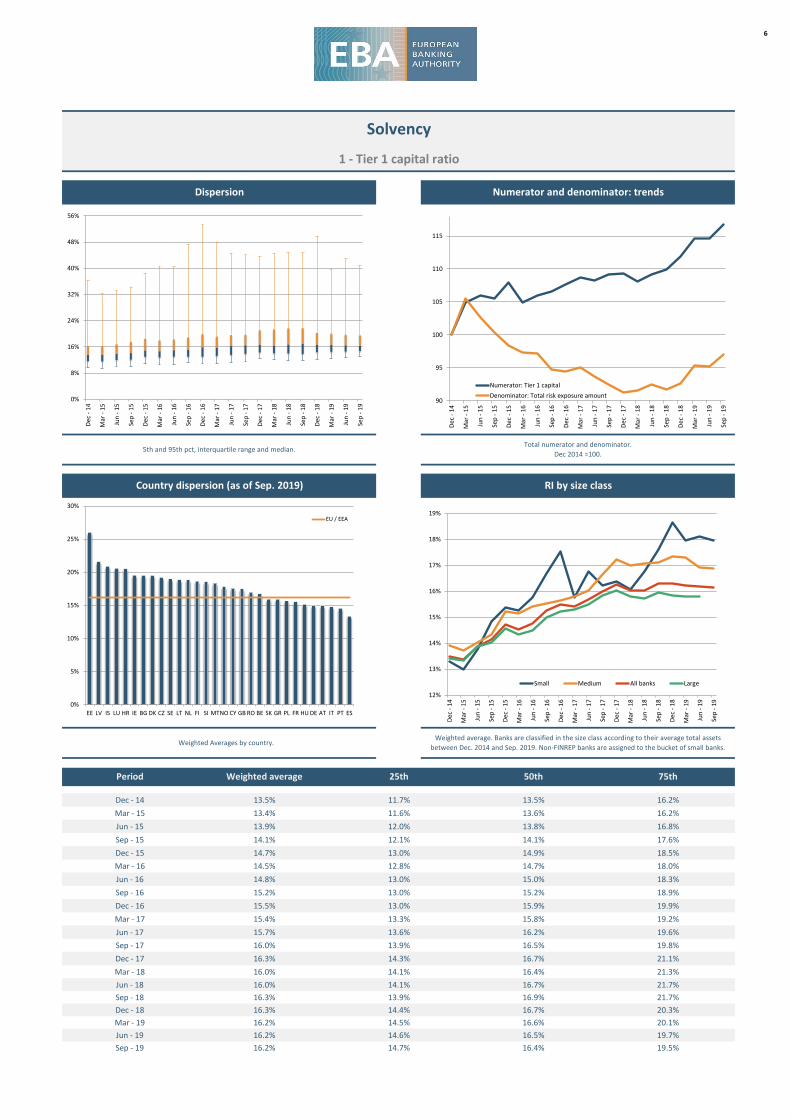
Dec - 14 13.5% 11.7% 13.5% 16.2%Mar - 15 13.4% 11.6% 13.6% 16.2%Jun - 15 13.9% 12.0% 13.8% 16.8%Sep - 15 14.1% 12.1% 14.1% 17.6%Dec - 15 14.7% 13.0% 14.9% 18.5%Mar - 16 14.5% 12.8% 14.7% 18.0%Jun - 16 14.8% 13.0% 15.0% 18.3%Sep - 16 15.2% 13.0% 15.2% 18.9%Dec - 16 15.5% 13.0% 15.9% 19.9%Mar - 17 15.4% 13.3% 15.8% 19.2%Jun - 17 15.7% 13.6% 16.2% 19.6%Sep - 17 16.0% 13.9% 16.5% 19.8%Dec - 17 16.3% 14.3% 16.7% 21.1%Mar - 18 16.0% 14.1% 16.4% 21.3%Jun - 18 16.0% 14.1% 16.7% 21.7%Sep - 18 16.3% 13.9% 16.9% 21.7%Dec - 18 16.3% 14.4% 16.7% 20.3%Mar - 19 16.2% 14.5% 16.6% 20.1%Jun - 19 16.2% 14.6% 16.5% 19.7%Sep - 19 16.2% 14.7% 16.4% 19.5%
Weighted Averages by country.Weighted average. Banks are classified in the size class according to their average total assets
between Dec. 2014 and Sep. 2019. Non-FINREP banks are assigned to the bucket of small banks.
Period Weighted average 25th 50th 75th
5th and 95th pct, interquartile range and median.Total numerator and denominator.
Dec 2014 =100.
Country dispersion (as of Sep. 2019) RI by size class
Solvency
1 - Tier 1 capital ratio
Dispersion Numerator and denominator: trends
90
95
100
105
110
115
Dec
- 14
Mar
- 15
Jun
- 15
Sep
- 15
Dec
- 15
Mar
- 16
Jun
- 16
Sep
- 16
Dec
- 16
Mar
- 17
Jun
- 17
Sep
- 17
Dec
- 17
Mar
- 18
Jun
- 18
Sep
- 18
Dec
- 18
Mar
- 19
Jun
- 19
Sep
- 19
Numerator: Tier 1 capitalDenominator: Total risk exposure amount
0%
5%
10%
15%
20%
25%
30%
EE LV IS LU HR IE BG DK CZ SE LT NL FI SI MTNO CY GB RO BE SK GR PL FR HU DE AT IT PT ES
EU / EEA
12%
13%
14%
15%
16%
17%
18%
19%
Dec
- 14
Mar
- 15
Jun
- 15
Sep
- 15
Dec
- 15
Mar
- 16
Jun
- 16
Sep
- 16
Dec
- 16
Mar
- 17
Jun
- 17
Sep
- 17
Dec
- 17
Mar
- 18
Jun
- 18
Sep
- 18
Dec
- 18
Mar
- 19
Jun
- 19
Sep
- 19
Small Medium All banks Large
0%
8%
16%
24%
32%
40%
48%
56%
Dec
- 14
Mar
- 15
Jun
- 15
Sep
- 15
Dec
- 15
Mar
- 16
Jun
- 16
Sep
- 16
Dec
- 16
Mar
- 17
Jun
- 17
Sep
- 17
Dec
- 17
Mar
- 18
Jun
- 18
Sep
- 18
Dec
- 18
Mar
- 19
Jun
- 19
Sep
- 19
7
Dec - 14 16.2% 13.8% 16.3% 19.4%Mar - 15 16.1% 13.7% 15.8% 19.5%Jun - 15 16.7% 14.2% 16.6% 20.3%Sep - 15 17.0% 14.4% 16.8% 21.7%Dec - 15 17.7% 14.8% 17.2% 22.8%Mar - 16 17.4% 14.9% 17.2% 22.3%Jun - 16 17.7% 15.0% 17.3% 22.6%Sep - 16 18.3% 15.1% 17.9% 22.5%Dec - 16 18.5% 15.2% 18.5% 23.5%Mar - 17 18.4% 15.3% 18.1% 22.7%Jun - 17 18.6% 16.0% 18.3% 23.9%Sep - 17 18.9% 15.9% 18.3% 23.2%Dec - 17 19.1% 16.3% 18.7% 23.9%Mar - 18 18.8% 16.0% 19.0% 23.6%Jun - 18 18.8% 16.3% 19.0% 23.2%Sep - 18 19.0% 16.2% 19.2% 23.1%Dec - 18 19.0% 16.2% 19.1% 22.4%Mar - 19 18.9% 16.2% 19.0% 21.9%Jun - 19 18.9% 16.4% 19.0% 21.8%Sep - 19 18.9% 16.4% 18.9% 21.6%
Weighted Averages by country.Weighted average. Banks are classified in the size class according to their average total assets
between Dec. 2014 and Sep. 2019. Non-FINREP banks are assigned to the bucket of small banks.
Period Weighted average 25th 50th 75th
5th and 95th pct, interquartile range and median.Total numerator and denominator.
Dec 2014 =100.
Country dispersion (as of Sep. 2019) RI by size class
Solvency
2 - Total capital ratio
Dispersion Numerator and denominator: trends
90
95
100
105
110
115
Dec
- 14
Mar
- 15
Jun
- 15
Sep
- 15
Dec
- 15
Mar
- 16
Jun
- 16
Sep
- 16
Dec
- 16
Mar
- 17
Jun
- 17
Sep
- 17
Dec
- 17
Mar
- 18
Jun
- 18
Sep
- 18
Dec
- 18
Mar
- 19
Jun
- 19
Sep
- 19
Numerator: Total capitalDenominator: Total risk exposure amount
0%
5%
10%
15%
20%
25%
30%
EE NL IS LV DK IE SE MT LU GB HR FI NOBG CZ LT SI BE RO CY FR AT SK DE HU PL IT GR PT ES
EU / EEA
14%
15%
16%
17%
18%
19%
20%
21%
22%
Dec
- 14
Mar
- 15
Jun
- 15
Sep
- 15
Dec
- 15
Mar
- 16
Jun
- 16
Sep
- 16
Dec
- 16
Mar
- 17
Jun
- 17
Sep
- 17
Dec
- 17
Mar
- 18
Jun
- 18
Sep
- 18
Dec
- 18
Mar
- 19
Jun
- 19
Sep
- 19
Small Medium All banks Large
0%
8%
16%
24%
32%
40%
48%
56%
Dec
- 14
Mar
- 15
Jun
- 15
Sep
- 15
Dec
- 15
Mar
- 16
Jun
- 16
Sep
- 16
Dec
- 16
Mar
- 17
Jun
- 17
Sep
- 17
Dec
- 17
Mar
- 18
Jun
- 18
Sep
- 18
Dec
- 18
Mar
- 19
Jun
- 19
Sep
- 19
8
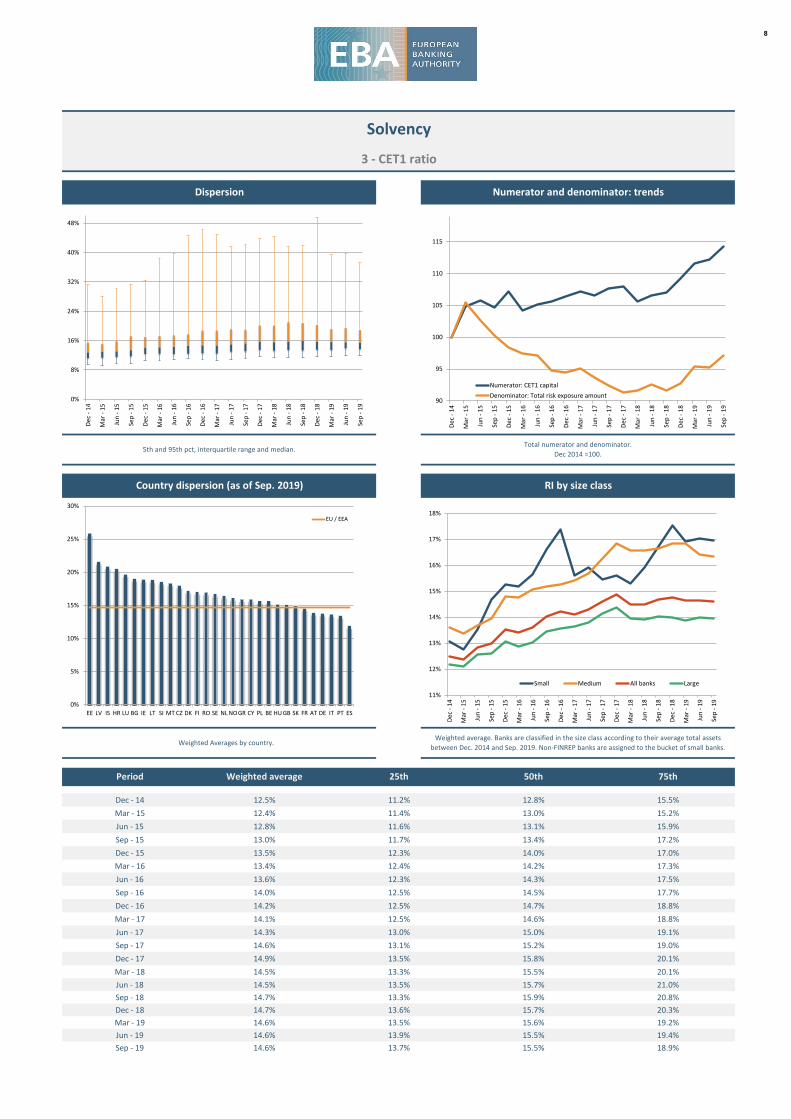
Dec - 14 12.5% 11.2% 12.8% 15.5%Mar - 15 12.4% 11.4% 13.0% 15.2%Jun - 15 12.8% 11.6% 13.1% 15.9%Sep - 15 13.0% 11.7% 13.4% 17.2%Dec - 15 13.5% 12.3% 14.0% 17.0%Mar - 16 13.4% 12.4% 14.2% 17.3%Jun - 16 13.6% 12.3% 14.3% 17.5%Sep - 16 14.0% 12.5% 14.5% 17.7%Dec - 16 14.2% 12.5% 14.7% 18.8%Mar - 17 14.1% 12.5% 14.6% 18.8%Jun - 17 14.3% 13.0% 15.0% 19.1%Sep - 17 14.6% 13.1% 15.2% 19.0%Dec - 17 14.9% 13.5% 15.8% 20.1%Mar - 18 14.5% 13.3% 15.5% 20.1%Jun - 18 14.5% 13.5% 15.7% 21.0%Sep - 18 14.7% 13.3% 15.9% 20.8%Dec - 18 14.7% 13.6% 15.7% 20.3%Mar - 19 14.6% 13.5% 15.6% 19.2%Jun - 19 14.6% 13.9% 15.5% 19.4%Sep - 19 14.6% 13.7% 15.5% 18.9%
Weighted Averages by country.Weighted average. Banks are classified in the size class according to their average total assets
between Dec. 2014 and Sep. 2019. Non-FINREP banks are assigned to the bucket of small banks.
Period Weighted average 25th 50th 75th
5th and 95th pct, interquartile range and median.Total numerator and denominator.
Dec 2014 =100.
Country dispersion (as of Sep. 2019) RI by size class
Solvency
3 - CET1 ratio
Dispersion Numerator and denominator: trends
90
95
100
105
110
115
Dec
- 14
Mar
- 15
Jun
- 15
Sep
- 15
Dec
- 15
Mar
- 16
Jun
- 16
Sep
- 16
Dec
- 16
Mar
- 17
Jun
- 17
Sep
- 17
Dec
- 17
Mar
- 18
Jun
- 18
Sep
- 18
Dec
- 18
Mar
- 19
Jun
- 19
Sep
- 19
Numerator: CET1 capitalDenominator: Total risk exposure amount
0%
5%
10%
15%
20%
25%
30%
EE LV IS HR LU BG IE LT SI MT CZ DK FI RO SE NL NOGR CY PL BE HU GB SK FR AT DE IT PT ES
EU / EEA
11%
12%
13%
14%
15%
16%
17%
18%
Dec
- 14
Mar
- 15
Jun
- 15
Sep
- 15
Dec
- 15
Mar
- 16
Jun
- 16
Sep
- 16
Dec
- 16
Mar
- 17
Jun
- 17
Sep
- 17
Dec
- 17
Mar
- 18
Jun
- 18
Sep
- 18
Dec
- 18
Mar
- 19
Jun
- 19
Sep
- 19
Small Medium All banks Large
0%
8%
16%
24%
32%
40%
48%
Dec
- 14
Mar
- 15
Jun
- 15
Sep
- 15
Dec
- 15
Mar
- 16
Jun
- 16
Sep
- 16
Dec
- 16
Mar
- 17
Jun
- 17
Sep
- 17
Dec
- 17
Mar
- 18
Jun
- 18
Sep
- 18
Dec
- 18
Mar
- 19
Jun
- 19
Sep
- 19
9
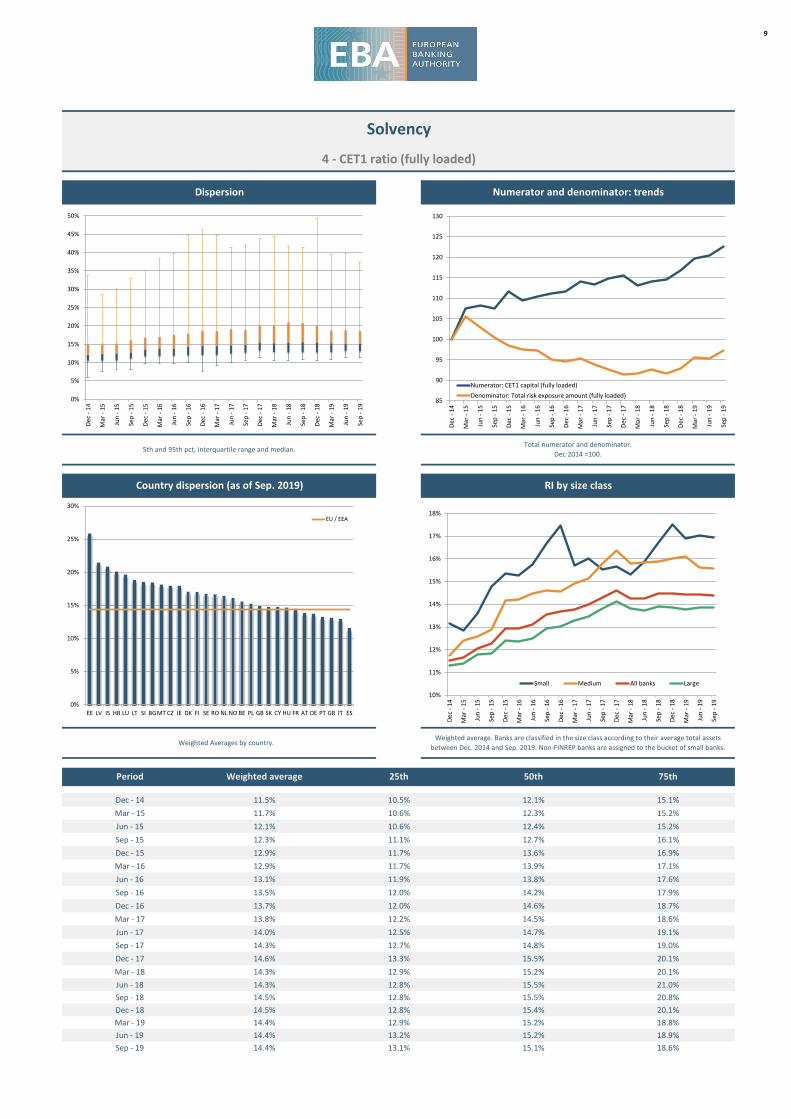
Dec - 14 11.5% 10.5% 12.1% 15.1%Mar - 15 11.7% 10.6% 12.3% 15.2%Jun - 15 12.1% 10.6% 12.4% 15.2%Sep - 15 12.3% 11.1% 12.7% 16.1%Dec - 15 12.9% 11.7% 13.6% 16.9%Mar - 16 12.9% 11.7% 13.9% 17.1%Jun - 16 13.1% 11.9% 13.8% 17.6%Sep - 16 13.5% 12.0% 14.2% 17.9%Dec - 16 13.7% 12.0% 14.6% 18.7%Mar - 17 13.8% 12.2% 14.5% 18.6%Jun - 17 14.0% 12.5% 14.7% 19.1%Sep - 17 14.3% 12.7% 14.8% 19.0%Dec - 17 14.6% 13.3% 15.5% 20.1%Mar - 18 14.3% 12.9% 15.2% 20.1%Jun - 18 14.3% 12.8% 15.5% 21.0%Sep - 18 14.5% 12.8% 15.5% 20.8%Dec - 18 14.5% 12.8% 15.4% 20.1%Mar - 19 14.4% 12.9% 15.2% 18.8%Jun - 19 14.4% 13.2% 15.2% 18.9%Sep - 19 14.4% 13.1% 15.1% 18.6%
Weighted Averages by country.Weighted average. Banks are classified in the size class according to their average total assets
between Dec. 2014 and Sep. 2019. Non-FINREP banks are assigned to the bucket of small banks.
Period Weighted average 25th 50th 75th
5th and 95th pct, interquartile range and median.Total numerator and denominator.
Dec 2014 =100.
Country dispersion (as of Sep. 2019) RI by size class
Solvency
4 - CET1 ratio (fully loaded)
Dispersion Numerator and denominator: trends
85
90
95
100
105
110
115
120
125
130
Dec
- 14
Mar
- 15
Jun
- 15
Sep
- 15
Dec
- 15
Mar
- 16
Jun
- 16
Sep
- 16
Dec
- 16
Mar
- 17
Jun
- 17
Sep
- 17
Dec
- 17
Mar
- 18
Jun
- 18
Sep
- 18
Dec
- 18
Mar
- 19
Jun
- 19
Sep
- 19
Numerator: CET1 capital (fully loaded)Denominator: Total risk exposure amount (fully loaded)
0%
5%
10%
15%
20%
25%
30%
EE LV IS HR LU LT SI BGMT CZ IE DK FI SE RO NL NO BE PL GB SK CY HU FR AT DE PT GR IT ES
EU / EEA
10%
11%
12%
13%
14%
15%
16%
17%
18%
Dec
- 14
Mar
- 15
Jun
- 15
Sep
- 15
Dec
- 15
Mar
- 16
Jun
- 16
Sep
- 16
Dec
- 16
Mar
- 17
Jun
- 17
Sep
- 17
Dec
- 17
Mar
- 18
Jun
- 18
Sep
- 18
Dec
- 18
Mar
- 19
Jun
- 19
Sep
- 19
Small Medium All banks Large
0%
5%
10%
15%
20%
25%
30%
35%
40%
45%
50%
Dec
- 14
Mar
- 15
Jun
- 15
Sep
- 15
Dec
- 15
Mar
- 16
Jun
- 16
Sep
- 16
Dec
- 16
Mar
- 17
Jun
- 17
Sep
- 17
Dec
- 17
Mar
- 18
Jun
- 18
Sep
- 18
Dec
- 18
Mar
- 19
Jun
- 19
Sep
- 19

10
Sep - 16 5.3% 4.4% 5.8% 7.2%Dec - 16 5.5% 4.6% 5.7% 7.5%Mar - 17 5.3% 4.4% 5.5% 7.3%Jun - 17 5.3% 4.4% 5.7% 7.6%Sep - 17 5.4% 4.5% 5.6% 7.7%Dec - 17 5.6% 4.8% 5.9% 8.1%Mar - 18 5.3% 4.6% 5.8% 8.1%Jun - 18 5.3% 4.7% 6.0% 7.8%Sep - 18 5.3% 4.7% 5.8% 7.8%Dec - 18 5.5% 4.9% 6.0% 8.4%Mar - 19 5.4% 4.7% 6.0% 8.2%Jun - 19 5.4% 4.6% 6.0% 8.4%Sep - 19 5.3% 4.6% 6.0% 8.2%
Weighted Averages by country.Weighted average. Banks are classified in the size class according to their average total assets between
Dec. 2014 and Sep. 2019.
Period Weighted average 25th 50th 75th
5th and 95th pct, interquartile range and median.Total numerator and denominator.
Sep 2016 =100.
Country dispersion (as of Sep. 2019) RI by size class
Solvency
5 - Leverage ratio
Dispersion Numerator and denominator: trends
92
94
96
98
100
102
Sep
- 16
Dec
- 16
Mar
- 17
Jun
- 17
Sep
- 17
Dec
- 17
Mar
- 18
Jun
- 18
Sep
- 18
Dec
- 18
Mar
- 19
Jun
- 19
Sep
- 19
Numerator: Tier 1 capital - transitional definition
Denominator: Total Leverage Ratio exposure - using a transitionaldefinition of Tier 1 capital
0%
2%
4%
6%
8%
10%
12%
14%
16%
IS EE HR GR BG SI PL IE LV HU RO CY MT PT LT SK NO AT LU IT BE ES FI CZ GB FR NL DK DE SE
EU / EEA
4.0%
4.5%
5.0%
5.5%
6.0%
6.5%
7.0%
7.5%
8.0%
Sep
- 16
Dec
- 16
Mar
- 17
Jun
- 17
Sep
- 17
Dec
- 17
Mar
- 18
Jun
- 18
Sep
- 18
Dec
- 18
Mar
- 19
Jun
- 19
Sep
- 19
Small Medium All banks Large
0%
2%
4%
6%
8%
10%
12%
14%
16%
Sep
- 16
Dec
- 16
Mar
- 17
Jun
- 17
Sep
- 17
Dec
- 17
Mar
- 18
Jun
- 18
Sep
- 18
Dec
- 18
Mar
- 19
Jun
- 19
Sep
- 19
11
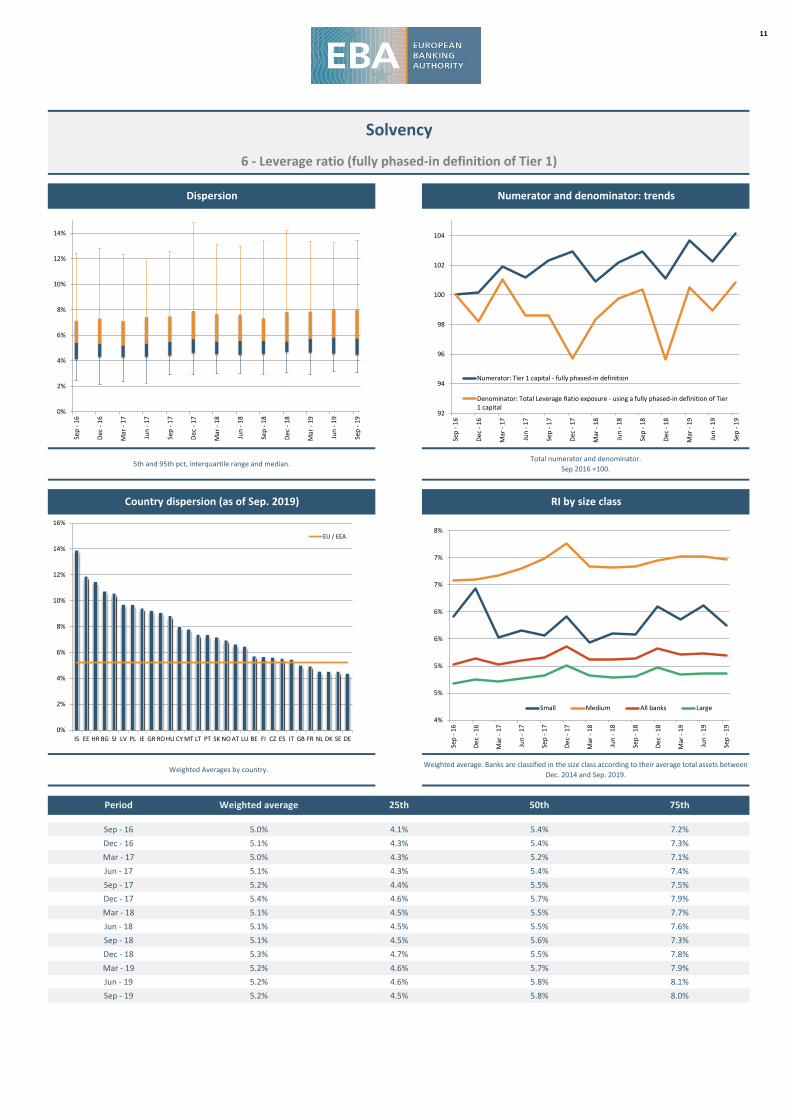
Sep - 16 5.0% 4.1% 5.4% 7.2%Dec - 16 5.1% 4.3% 5.4% 7.3%Mar - 17 5.0% 4.3% 5.2% 7.1%Jun - 17 5.1% 4.3% 5.4% 7.4%Sep - 17 5.2% 4.4% 5.5% 7.5%Dec - 17 5.4% 4.6% 5.7% 7.9%Mar - 18 5.1% 4.5% 5.5% 7.7%Jun - 18 5.1% 4.5% 5.5% 7.6%Sep - 18 5.1% 4.5% 5.6% 7.3%Dec - 18 5.3% 4.7% 5.5% 7.8%Mar - 19 5.2% 4.6% 5.7% 7.9%Jun - 19 5.2% 4.6% 5.8% 8.1%Sep - 19 5.2% 4.5% 5.8% 8.0%
Weighted Averages by country.Weighted average. Banks are classified in the size class according to their average total assets between
Dec. 2014 and Sep. 2019.
Period Weighted average 25th 50th 75th
5th and 95th pct, interquartile range and median.Total numerator and denominator.
Sep 2016 =100.
Country dispersion (as of Sep. 2019) RI by size class
Solvency
6 - Leverage ratio (fully phased-in definition of Tier 1)
Dispersion Numerator and denominator: trends
92
94
96
98
100
102
104
Sep
- 16
Dec
- 16
Mar
- 17
Jun
- 17
Sep
- 17
Dec
- 17
Mar
- 18
Jun
- 18
Sep
- 18
Dec
- 18
Mar
- 19
Jun
- 19
Sep
- 19
Numerator: Tier 1 capital - fully phased-in definition
Denominator: Total Leverage Ratio exposure - using a fully phased-in definition of Tier1 capital
0%
2%
4%
6%
8%
10%
12%
14%
16%
IS EE HR BG SI LV PL IE GR RO HU CY MT LT PT SK NO AT LU BE FI CZ ES IT GB FR NL DK SE DE
EU / EEA
4%
5%
5%
6%
6%
7%
7%
8%
Sep
- 16
Dec
- 16
Mar
- 17
Jun
- 17
Sep
- 17
Dec
- 17
Mar
- 18
Jun
- 18
Sep
- 18
Dec
- 18
Mar
- 19
Jun
- 19
Sep
- 19
Small Medium All banks Large
0%
2%
4%
6%
8%
10%
12%
14%
Sep
- 16
Dec
- 16
Mar
- 17
Jun
- 17
Sep
- 17
Dec
- 17
Mar
- 18
Jun
- 18
Sep
- 18
Dec
- 18
Mar
- 19
Jun
- 19
Sep
- 19
12
Dec - 14 6.5% 2.1% 5.5% 14.9%Mar - 15 6.2% 2.1% 5.5% 15.4%Jun - 15 6.0% 2.2% 5.8% 14.4%Sep - 15 5.9% 2.2% 5.5% 14.5%Dec - 15 5.7% 2.2% 5.0% 14.8%Mar - 16 5.6% 1.9% 4.9% 14.2%Jun - 16 5.4% 1.9% 4.6% 13.6%Sep - 16 5.3% 1.8% 4.6% 13.1%Dec - 16 5.1% 1.6% 4.1% 13.1%Mar - 17 4.8% 1.5% 3.5% 10.0%Jun - 17 4.4% 1.4% 3.4% 9.0%Sep - 17 4.2% 1.4% 3.4% 8.7%Dec - 17 4.1% 1.3% 3.0% 7.8%Mar - 18 3.8% 1.2% 2.9% 7.4%Jun - 18 3.6% 1.2% 2.7% 6.9%Sep - 18 3.4% 1.2% 2.6% 6.5%Dec - 18 3.2% 1.2% 2.7% 5.7%Mar - 19 3.1% 1.2% 2.7% 5.7%Jun - 19 3.0% 1.2% 2.6% 5.2%Sep - 19 2.9% 1.2% 2.6% 4.8%
Weighted Averages by country. Weighted average. Banks are classified in the size class according to their average total assets
between Dec. 2014 and Sep. 2019.
Period Weighted average 25th 50th 75th
5th and 95th pct, interquartile range and median.Total numerator and denominator.
Dec 2014 =100.
Country dispersion (as of Sep. 2019) RI by size class
Credit Risk and Asset Quality
7 - Ratio of non-performing loans and advances (NPL ratio)
Dispersion Numerator and denominator: trends
55
65
75
85
95
105
115
Dec
- 14
Mar
- 15
Jun
- 15
Sep
- 15
Dec
- 15
Mar
- 16
Jun
- 16
Sep
- 16
Dec
- 16
Mar
- 17
Jun
- 17
Sep
- 17
Dec
- 17
Mar
- 18
Jun
- 18
Sep
- 18
Dec
- 18
Mar
- 19
Jun
- 19
Sep
- 19
Numerator: Non-performing loansDenominator: Total loans
0%
5%
10%
15%
20%
25%
30%
35%
40%
45%
GR CY PT BG IT HU PL HR RO SI IE ES MT IS SK FR AT LV BE NL DK EE LT FI NO GB DE CZ LU SE
EU / EEA
0%
5%
10%
15%
20%
25%
Dec
- 14
Mar
- 15
Jun
- 15
Sep
- 15
Dec
- 15
Mar
- 16
Jun
- 16
Sep
- 16
Dec
- 16
Mar
- 17
Jun
- 17
Sep
- 17
Dec
- 17
Mar
- 18
Jun
- 18
Sep
- 18
Dec
- 18
Mar
- 19
Jun
- 19
Sep
- 19
Small Medium All banks Large
0%
5%
10%
15%
20%
25%
30%
35%
40%
Dec
- 14
Mar
- 15
Jun
- 15
Sep
- 15
Dec
- 15
Mar
- 16
Jun
- 16
Sep
- 16
Dec
- 16
Mar
- 17
Jun
- 17
Sep
- 17
Dec
- 17
Mar
- 18
Jun
- 18
Sep
- 18
Dec
- 18
Mar
- 19
Jun
- 19
Sep
- 19
13
Dec - 14 43.4% 31.8% 41.1% 48.2%Mar - 15 43.0% 31.2% 41.7% 47.2%Jun - 15 43.6% 32.1% 40.9% 47.5%Sep - 15 43.6% 32.3% 41.7% 48.3%Dec - 15 43.7% 31.3% 40.3% 47.5%Mar - 16 43.7% 31.2% 39.5% 47.6%Jun - 16 43.9% 31.8% 40.6% 47.9%Sep - 16 44.3% 31.7% 40.9% 47.5%Dec - 16 44.8% 31.0% 40.6% 48.6%Mar - 17 45.2% 30.6% 38.9% 48.2%Jun - 17 45.0% 28.6% 39.9% 48.9%Sep - 17 44.7% 28.2% 40.1% 49.0%Dec - 17 44.6% 26.9% 40.4% 48.7%Mar - 18 46.7% 28.5% 41.6% 50.3%Jun - 18 46.0% 26.0% 38.9% 49.7%Sep - 18 45.7% 26.0% 38.5% 49.5%Dec - 18 45.0% 27.1% 39.6% 48.3%Mar - 19 45.1% 30.0% 39.9% 51.4%Jun - 19 44.9% 30.0% 40.0% 51.0%Sep - 19 44.6% 29.1% 39.8% 50.7%
Weighted Averages by country. Weighted average. Banks are classified in the size class according to their average total assets between Dec. 2014 and Sep. 2019.
Period Weighted average 25th 50th 75th
5th and 95th pct, interquartile range and median.Total numerator and denominator.
Dec 2014 =100.
Country dispersion (as of Sep. 2019) RI by size class
Credit Risk and Asset Quality
8 - Coverage ratio of non-performing loans and advances
Dispersion Numerator and denominator: trends
55
60
65
70
75
80
85
90
95
100
105
Dec
- 14
Mar
- 15
Jun
- 15
Sep
- 15
Dec
- 15
Mar
- 16
Jun
- 16
Sep
- 16
Dec
- 16
Mar
- 17
Jun
- 17
Sep
- 17
Dec
- 17
Mar
- 18
Jun
- 18
Sep
- 18
Dec
- 18
Mar
- 19
Jun
- 19
Sep
- 19
Numerator: Specific allowances for loansDenominator: Non-performing loans
0%
10%
20%
30%
40%
50%
60%
70%
80%
HU RO SK HR PL SI CZ IT PT AT FR BG CY GR ES BE DE LU SE LT LV EE GB DK FI NO IE IS MT NL
EU / EEA
36%
38%
40%
42%
44%
46%
48%
50%
52%
54%
Dec
- 14
Mar
- 15
Jun
- 15
Sep
- 15
Dec
- 15
Mar
- 16
Jun
- 16
Sep
- 16
Dec
- 16
Mar
- 17
Jun
- 17
Sep
- 17
Dec
- 17
Mar
- 18
Jun
- 18
Sep
- 18
Dec
- 18
Mar
- 19
Jun
- 19
Sep
- 19
Small Medium All banks Large
0%
10%
20%
30%
40%
50%
60%
70%
Dec
- 14
Mar
- 15
Jun
- 15
Sep
- 15
Dec
- 15
Mar
- 16
Jun
- 16
Sep
- 16
Dec
- 16
Mar
- 17
Jun
- 17
Sep
- 17
Dec
- 17
Mar
- 18
Jun
- 18
Sep
- 18
Dec
- 18
Mar
- 19
Jun
- 19
Sep
- 19
14
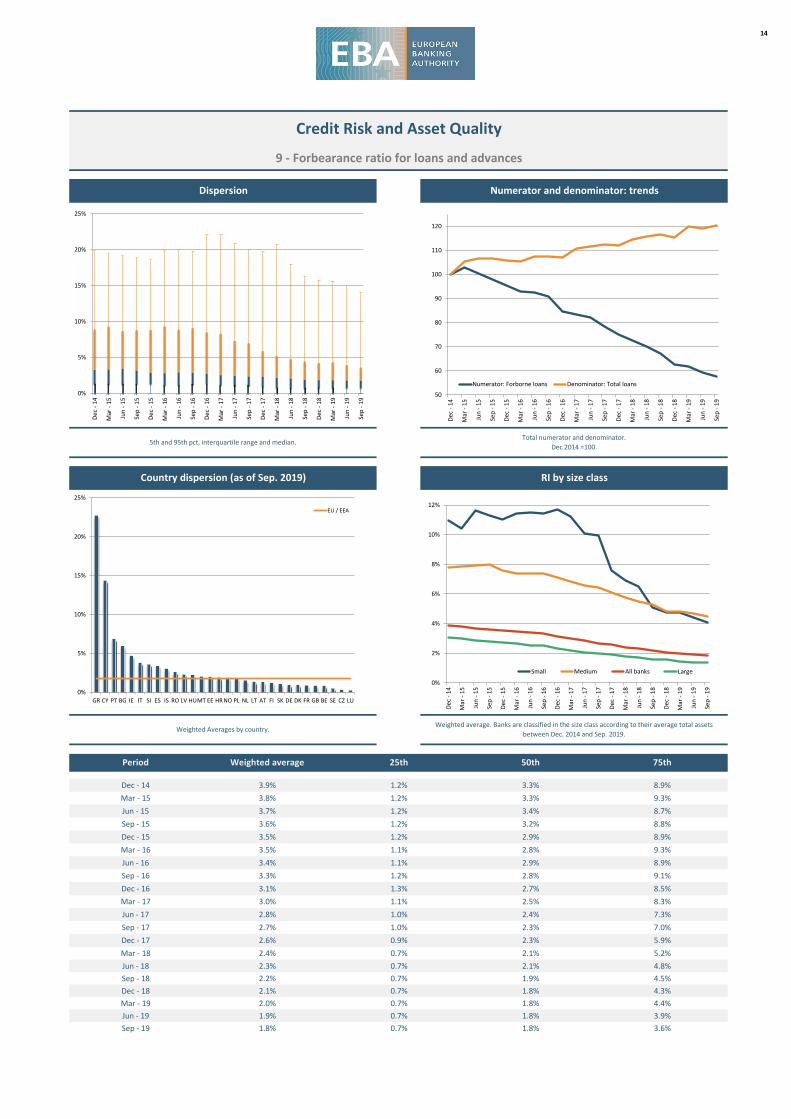
Dec - 14 3.9% 1.2% 3.3% 8.9%Mar - 15 3.8% 1.2% 3.3% 9.3%Jun - 15 3.7% 1.2% 3.4% 8.7%Sep - 15 3.6% 1.2% 3.2% 8.8%Dec - 15 3.5% 1.2% 2.9% 8.9%Mar - 16 3.5% 1.1% 2.8% 9.3%Jun - 16 3.4% 1.1% 2.9% 8.9%Sep - 16 3.3% 1.2% 2.8% 9.1%Dec - 16 3.1% 1.3% 2.7% 8.5%Mar - 17 3.0% 1.1% 2.5% 8.3%Jun - 17 2.8% 1.0% 2.4% 7.3%Sep - 17 2.7% 1.0% 2.3% 7.0%Dec - 17 2.6% 0.9% 2.3% 5.9%Mar - 18 2.4% 0.7% 2.1% 5.2%Jun - 18 2.3% 0.7% 2.1% 4.8%Sep - 18 2.2% 0.7% 1.9% 4.5%Dec - 18 2.1% 0.7% 1.8% 4.3%Mar - 19 2.0% 0.7% 1.8% 4.4%Jun - 19 1.9% 0.7% 1.8% 3.9%Sep - 19 1.8% 0.7% 1.8% 3.6%
Weighted Averages by country. Weighted average. Banks are classified in the size class according to their average total assets
between Dec. 2014 and Sep. 2019.
Period Weighted average 25th 50th 75th
5th and 95th pct, interquartile range and median.Total numerator and denominator.
Dec 2014 =100.
Country dispersion (as of Sep. 2019) RI by size class
Credit Risk and Asset Quality
9 - Forbearance ratio for loans and advances
Dispersion Numerator and denominator: trends
50
60
70
80
90
100
110
120
Dec
- 14
Mar
- 15
Jun
- 15
Sep
- 15
Dec
- 15
Mar
- 16
Jun
- 16
Sep
- 16
Dec
- 16
Mar
- 17
Jun
- 17
Sep
- 17
Dec
- 17
Mar
- 18
Jun
- 18
Sep
- 18
Dec
- 18
Mar
- 19
Jun
- 19
Sep
- 19
Numerator: Forborne loans Denominator: Total loans
0%
5%
10%
15%
20%
25%
GR CY PT BG IE IT SI ES IS RO LV HUMT EE HR NO PL NL LT AT FI SK DE DK FR GB BE SE CZ LU
EU / EEA
0%
2%
4%
6%
8%
10%
12%
Dec
- 14
Mar
- 15
Jun
- 15
Sep
- 15
Dec
- 15
Mar
- 16
Jun
- 16
Sep
- 16
Dec
- 16
Mar
- 17
Jun
- 17
Sep
- 17
Dec
- 17
Mar
- 18
Jun
- 18
Sep
- 18
Dec
- 18
Mar
- 19
Jun
- 19
Sep
- 19
Small Medium All banks Large
0%
5%
10%
15%
20%
25%
Dec
- 14
Mar
- 15
Jun
- 15
Sep
- 15
Dec
- 15
Mar
- 16
Jun
- 16
Sep
- 16
Dec
- 16
Mar
- 17
Jun
- 17
Sep
- 17
Dec
- 17
Mar
- 18
Jun
- 18
Sep
- 18
Dec
- 18
Mar
- 19
Jun
- 19
Sep
- 19
15
Dec - 14 5.5% 2.0% 4.7% 11.5%Mar - 15 5.3% 1.9% 4.5% 11.9%Jun - 15 5.1% 1.9% 4.5% 11.9%Sep - 15 5.0% 1.8% 4.4% 12.3%Dec - 15 4.9% 1.8% 4.0% 12.0%Mar - 16 4.8% 1.7% 3.8% 11.3%Jun - 16 4.7% 1.6% 3.6% 9.9%Sep - 16 4.6% 1.6% 3.7% 10.2%Dec - 16 4.4% 1.4% 3.2% 8.9%Mar - 17 4.2% 1.4% 3.0% 8.5%Jun - 17 3.9% 1.3% 2.9% 7.4%Sep - 17 3.7% 1.2% 2.8% 7.1%Dec - 17 3.6% 1.2% 2.6% 6.4%Mar - 18 3.4% 1.1% 2.5% 6.0%Jun - 18 3.2% 1.1% 2.4% 5.1%Sep - 18 3.0% 1.0% 2.3% 4.9%Dec - 18 2.8% 1.0% 2.3% 4.2%Mar - 19 2.7% 1.1% 2.4% 4.2%Jun - 19 2.6% 1.0% 2.3% 3.9%Sep - 19 2.5% 1.0% 2.3% 3.7%
Weighted Averages by country. Weighted average. Banks are classified in the size class according to their average total assets
between Dec. 2014 and Sep. 2019.
Period Weighted average 25th 50th 75th
5th and 95th pct, interquartile range and median.Total numerator and denominator.
Dec 2014 =100.
Country dispersion (as of Sep. 2019) RI by size class
Credit Risk and Asset Quality
10 - Ratio of non-performing exposures (NPE ratio)
Dispersion Numerator and denominator: trends
50
60
70
80
90
100
110
120
Dec
- 14
Mar
- 15
Jun
- 15
Sep
- 15
Dec
- 15
Mar
- 16
Jun
- 16
Sep
- 16
Dec
- 16
Mar
- 17
Jun
- 17
Sep
- 17
Dec
- 17
Mar
- 18
Jun
- 18
Sep
- 18
Dec
- 18
Mar
- 19
Jun
- 19
Sep
- 19
Numerator: Non-performing debt instrumentsDenominator: Total debt instruments
0%
5%
10%
15%
20%
25%
30%
35%
GR CY BG PT IT HR PL HU IE SI RO ES IS FR SK MT AT LV NL EE BE DK LT FI NO DE GB CZ LU SE
EU / EEA
0%
2%
4%
5%
7%
9%
11%
13%
14%
16%
18%
Dec
- 14
Mar
- 15
Jun
- 15
Sep
- 15
Dec
- 15
Mar
- 16
Jun
- 16
Sep
- 16
Dec
- 16
Mar
- 17
Jun
- 17
Sep
- 17
Dec
- 17
Mar
- 18
Jun
- 18
Sep
- 18
Dec
- 18
Mar
- 19
Jun
- 19
Sep
- 19
Small Medium All banks Large
0%
5%
10%
15%
20%
25%
30%
35%
Dec
- 14
Mar
- 15
Jun
- 15
Sep
- 15
Dec
- 15
Mar
- 16
Jun
- 16
Sep
- 16
Dec
- 16
Mar
- 17
Jun
- 17
Sep
- 17
Dec
- 17
Mar
- 18
Jun
- 18
Sep
- 18
Dec
- 18
Mar
- 19
Jun
- 19
Sep
- 19
16
Dec - 14 3.5% -2.8% 3.8% 8.0%Mar - 15 6.9% 3.4% 7.1% 10.6%Jun - 15 6.8% 3.5% 7.0% 10.5%Sep - 15 6.4% 3.5% 6.8% 10.7%Dec - 15 4.5% 2.5% 5.7% 9.1%Mar - 16 5.6% 1.9% 5.0% 8.5%Jun - 16 5.7% 2.3% 6.2% 9.7%Sep - 16 5.4% 2.4% 5.9% 9.7%Dec - 16 3.3% 1.4% 5.5% 9.6%Mar - 17 7.3% 3.0% 6.7% 10.4%Jun - 17 7.1% 3.9% 7.5% 10.4%Sep - 17 7.2% 4.1% 7.2% 10.5%Dec - 17 6.0% 3.1% 6.6% 10.5%Mar - 18 6.8% 3.9% 6.8% 9.9%Jun - 18 7.2% 3.9% 6.8% 10.1%Sep - 18 7.2% 4.2% 6.9% 9.8%Dec - 18 6.5% 3.5% 6.7% 9.5%Mar - 19 6.8% 3.2% 6.5% 9.2%Jun - 19 7.0% 4.3% 6.3% 10.0%Sep - 19 6.6% 4.1% 6.5% 10.0%
Weighted Averages by country. Weighted average. Banks are classified in the size class according to their average total assets
between Dec. 2014 and Sep. 2019.
Period Weighted average 25th 50th 75th
5th and 95th pct, interquartile range and median.Total numerator and denominator.
Dec 2014 =100.
Country dispersion (as of Sep. 2019) RI by size class
Profitability
11 - Return on equity
Dispersion Numerator and denominator: trends
0
50
100
150
200
250
Dec
- 14
Mar
- 15
Jun
- 15
Sep
- 15
Dec
- 15
Mar
- 16
Jun
- 16
Sep
- 16
Dec
- 16
Mar
- 17
Jun
- 17
Sep
- 17
Dec
- 17
Mar
- 18
Jun
- 18
Sep
- 18
Dec
- 18
Mar
- 19
Jun
- 19
Sep
- 19
Numerator: Profit or loss for the yearDenominator: Total equity
0%
2%
4%
6%
8%
10%
12%
14%
16%
18%
20%
HU RO CZ LT LV SI SE BG NO HR EE SK PL AT CY NL IT DK ES MT IE GB FR LU BE PT IS FI GR DE
EU / EEA
-2%
0%
2%
4%
6%
8%
10%
12%
14%
16%
Dec
- 14
Mar
- 15
Jun
- 15
Sep
- 15
Dec
- 15
Mar
- 16
Jun
- 16
Sep
- 16
Dec
- 16
Mar
- 17
Jun
- 17
Sep
- 17
Dec
- 17
Mar
- 18
Jun
- 18
Sep
- 18
Dec
- 18
Mar
- 19
Jun
- 19
Sep
- 19
Small Medium All banks Large
-40%
-30%
-20%
-10%
0%
10%
20%
30%
Dec
- 14
Mar
- 15
Jun
- 15
Sep
- 15
Dec
- 15
Mar
- 16
Jun
- 16
Sep
- 16
Dec
- 16
Mar
- 17
Jun
- 17
Sep
- 17
Dec
- 17
Mar
- 18
Jun
- 18
Sep
- 18
Dec
- 18
Mar
- 19
Jun
- 19
Sep
- 19
17
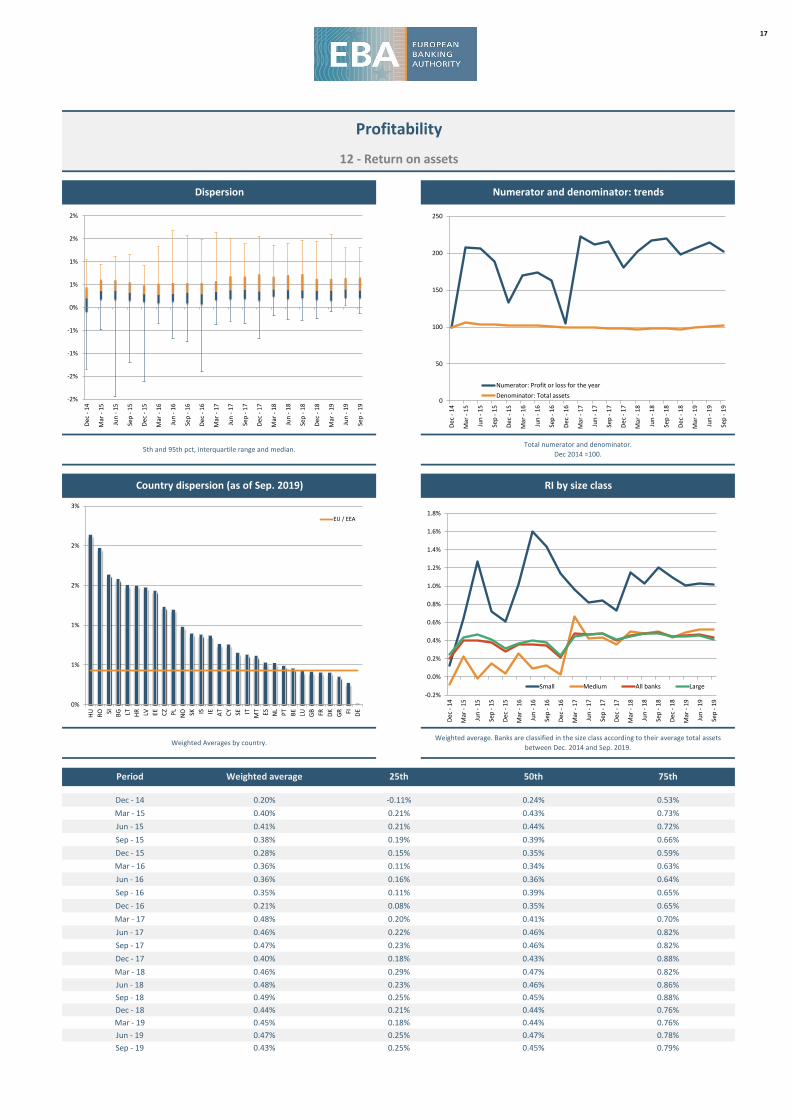
Dec - 14 0.20% -0.11% 0.24% 0.53%Mar - 15 0.40% 0.21% 0.43% 0.73%Jun - 15 0.41% 0.21% 0.44% 0.72%Sep - 15 0.38% 0.19% 0.39% 0.66%Dec - 15 0.28% 0.15% 0.35% 0.59%Mar - 16 0.36% 0.11% 0.34% 0.63%Jun - 16 0.36% 0.16% 0.36% 0.64%Sep - 16 0.35% 0.11% 0.39% 0.65%Dec - 16 0.21% 0.08% 0.35% 0.65%Mar - 17 0.48% 0.20% 0.41% 0.70%Jun - 17 0.46% 0.22% 0.46% 0.82%Sep - 17 0.47% 0.23% 0.46% 0.82%Dec - 17 0.40% 0.18% 0.43% 0.88%Mar - 18 0.46% 0.29% 0.47% 0.82%Jun - 18 0.48% 0.23% 0.46% 0.86%Sep - 18 0.49% 0.25% 0.45% 0.88%Dec - 18 0.44% 0.21% 0.44% 0.76%Mar - 19 0.45% 0.18% 0.44% 0.76%Jun - 19 0.47% 0.25% 0.47% 0.78%Sep - 19 0.43% 0.25% 0.45% 0.79%
Weighted Averages by country.Weighted average. Banks are classified in the size class according to their average total assets
between Dec. 2014 and Sep. 2019.
Period Weighted average 25th 50th 75th
5th and 95th pct, interquartile range and median.Total numerator and denominator.
Dec 2014 =100.
Country dispersion (as of Sep. 2019) RI by size class
Profitability
12 - Return on assets
Dispersion Numerator and denominator: trends
0
50
100
150
200
250
Dec
- 14
Mar
- 15
Jun
- 15
Sep
- 15
Dec
- 15
Mar
- 16
Jun
- 16
Sep
- 16
Dec
- 16
Mar
- 17
Jun
- 17
Sep
- 17
Dec
- 17
Mar
- 18
Jun
- 18
Sep
- 18
Dec
- 18
Mar
- 19
Jun
- 19
Sep
- 19
Numerator: Profit or loss for the yearDenominator: Total assets
0%
1%
1%
2%
2%
3%
HU RO SI BG LT HR LV EE CZ PL NO SK IS IE AT CY SE IT MT ES NL PT BE LU GB FR DK GR FI DE
EU / EEA
-0.2%
0.0%
0.2%
0.4%
0.6%
0.8%
1.0%
1.2%
1.4%
1.6%
1.8%
Dec
- 14
Mar
- 15
Jun
- 15
Sep
- 15
Dec
- 15
Mar
- 16
Jun
- 16
Sep
- 16
Dec
- 16
Mar
- 17
Jun
- 17
Sep
- 17
Dec
- 17
Mar
- 18
Jun
- 18
Sep
- 18
Dec
- 18
Mar
- 19
Jun
- 19
Sep
- 19
Small Medium All banks Large
-2%
-2%
-1%
-1%
0%
1%
1%
2%
2%
Dec
- 14
Mar
- 15
Jun
- 15
Sep
- 15
Dec
- 15
Mar
- 16
Jun
- 16
Sep
- 16
Dec
- 16
Mar
- 17
Jun
- 17
Sep
- 17
Dec
- 17
Mar
- 18
Jun
- 18
Sep
- 18
Dec
- 18
Mar
- 19
Jun
- 19
Sep
- 19
18
Dec - 14 62.9% 45.9% 58.5% 69.7%Mar - 15 60.9% 44.8% 56.8% 66.5%Jun - 15 59.3% 46.3% 55.9% 65.3%Sep - 15 59.9% 46.9% 57.3% 66.3%Dec - 15 62.8% 48.2% 59.2% 67.7%Mar - 16 66.0% 50.7% 63.9% 73.8%Jun - 16 62.7% 49.9% 59.8% 70.7%Sep - 16 63.0% 49.5% 58.9% 70.8%Dec - 16 65.3% 50.0% 61.2% 73.2%Mar - 17 63.9% 49.7% 59.8% 72.5%Jun - 17 61.6% 50.2% 58.0% 69.0%Sep - 17 61.7% 49.5% 58.0% 69.1%Dec - 17 63.4% 50.1% 59.5% 70.2%Mar - 18 65.0% 51.3% 62.3% 73.9%Jun - 18 63.7% 51.2% 61.8% 73.0%Sep - 18 63.2% 50.3% 60.9% 69.8%Dec - 18 64.5% 50.1% 62.5% 70.7%Mar - 19 66.3% 52.6% 64.5% 74.5%Jun - 19 64.1% 51.5% 63.2% 72.5%Sep - 19 63.2% 50.9% 62.1% 71.9%
Weighted Averages by country.Weighted average. Banks are classified in the size class according to their average total assets
between Dec. 2014 and Sep. 2019.
Period Weighted average 25th 50th 75th
5th and 95th pct, interquartile range and median.Total numerator and denominator.
Dec 2014 =100.
Country dispersion (as of Sep. 2019) RI by size class
Profitability
13 - Cost to income ratio
Dispersion Numerator and denominator: trends
94
96
98
100
102
104
106
108
110
112
Dec
- 14
Mar
- 15
Jun
- 15
Sep
- 15
Dec
- 15
Mar
- 16
Jun
- 16
Sep
- 16
Dec
- 16
Mar
- 17
Jun
- 17
Sep
- 17
Dec
- 17
Mar
- 18
Jun
- 18
Sep
- 18
Dec
- 18
Mar
- 19
Jun
- 19
Sep
- 19
Numerator: CostsDenominator: Total net operating income
0%
10%
20%
30%
40%
50%
60%
70%
80%
90%
DE FR LU CY MT IT BE AT IE DK FI GB SI HU IS PT NL SK ES LV PL GR EE RO SE CZ HR BG NO LT
EU / EEA
50%
55%
60%
65%
70%
Dec
- 14
Mar
- 15
Jun
- 15
Sep
- 15
Dec
- 15
Mar
- 16
Jun
- 16
Sep
- 16
Dec
- 16
Mar
- 17
Jun
- 17
Sep
- 17
Dec
- 17
Mar
- 18
Jun
- 18
Sep
- 18
Dec
- 18
Mar
- 19
Jun
- 19
Sep
- 19
Small Medium All banks Large
0%
20%
40%
60%
80%
100%
120%
140%
Dec
- 14
Mar
- 15
Jun
- 15
Sep
- 15
Dec
- 15
Mar
- 16
Jun
- 16
Sep
- 16
Dec
- 16
Mar
- 17
Jun
- 17
Sep
- 17
Dec
- 17
Mar
- 18
Jun
- 18
Sep
- 18
Dec
- 18
Mar
- 19
Jun
- 19
Sep
- 19
19
Dec - 14 58.8% 49.6% 62.2% 75.4%Mar - 15 55.5% 43.2% 58.3% 73.8%Jun - 15 54.9% 45.9% 58.9% 72.7%Sep - 15 56.3% 48.3% 59.9% 77.6%Dec - 15 57.3% 48.9% 61.1% 78.1%Mar - 16 58.8% 51.9% 64.7% 80.7%Jun - 16 57.0% 50.4% 64.1% 77.1%Sep - 16 57.7% 50.4% 62.6% 76.8%Dec - 16 57.8% 49.7% 63.8% 75.5%Mar - 17 55.9% 48.7% 62.7% 75.9%Jun - 17 55.4% 50.1% 61.8% 72.9%Sep - 17 56.9% 52.7% 62.9% 74.5%Dec - 17 57.3% 48.5% 63.4% 73.5%Mar - 18 56.7% 48.4% 63.6% 77.2%Jun - 18 56.8% 51.1% 66.0% 76.7%Sep - 18 57.4% 51.2% 65.2% 75.7%Dec - 18 58.9% 53.4% 65.8% 76.6%Mar - 19 58.2% 50.6% 65.5% 77.3%Jun - 19 57.9% 52.4% 64.4% 74.8%Sep - 19 58.5% 53.7% 64.2% 75.4%
Weighted Averages by country. Weighted average. Banks are classified in the size class according to their average total assets
between Dec. 2014 and Sep. 2019.
Period Weighted average 25th 50th 75th
5th and 95th pct, interquartile range and median.Total numerator and denominator.
Dec 2014 =100.
Country dispersion (as of Sep. 2019) RI by size class
Profitability
14 - Net interest income to total net operating income
Dispersion Numerator and denominator: trends
90
95
100
105
110
115
Dec
- 14
Mar
- 15
Jun
- 15
Sep
- 15
Dec
- 15
Mar
- 16
Jun
- 16
Sep
- 16
Dec
- 16
Mar
- 17
Jun
- 17
Sep
- 17
Dec
- 17
Mar
- 18
Jun
- 18
Sep
- 18
Dec
- 18
Mar
- 19
Jun
- 19
Sep
- 19
Numerator: Net interest incomeDenominator: Total net operating income
0%
10%
20%
30%
40%
50%
60%
70%
80%
90%
SK NL NO CZ GR ES MT PL IS BE CY AT PT BG RO HR EE SE IE SI HU LV DK LT DE FI GB LU IT FR
EU / EEA
42%
46%
50%
54%
58%
62%
66%
70%
Dec
- 14
Mar
- 15
Jun
- 15
Sep
- 15
Dec
- 15
Mar
- 16
Jun
- 16
Sep
- 16
Dec
- 16
Mar
- 17
Jun
- 17
Sep
- 17
Dec
- 17
Mar
- 18
Jun
- 18
Sep
- 18
Dec
- 18
Mar
- 19
Jun
- 19
Sep
- 19
Small Medium All banks Large
0%
20%
40%
60%
80%
100%
120%
Dec
- 14
Mar
- 15
Jun
- 15
Sep
- 15
Dec
- 15
Mar
- 16
Jun
- 16
Sep
- 16
Dec
- 16
Mar
- 17
Jun
- 17
Sep
- 17
Dec
- 17
Mar
- 18
Jun
- 18
Sep
- 18
Dec
- 18
Mar
- 19
Jun
- 19
Sep
- 19

20
Dec - 14 27.2% 13.7% 22.9% 30.3%Mar - 15 26.6% 13.6% 22.6% 31.4%Jun - 15 26.2% 13.5% 21.7% 30.4%Sep - 15 26.4% 13.3% 21.6% 30.9%Dec - 15 26.8% 12.2% 22.1% 29.9%Mar - 16 27.1% 13.6% 23.3% 32.9%Jun - 16 26.6% 11.8% 22.5% 32.3%Sep - 16 27.1% 12.3% 23.2% 32.6%Dec - 16 27.2% 12.6% 23.1% 32.5%Mar - 17 27.5% 12.6% 23.1% 32.3%Jun - 17 27.4% 13.0% 22.1% 33.1%Sep - 17 27.8% 13.1% 22.2% 33.1%Dec - 17 28.1% 13.7% 23.6% 32.7%Mar - 18 28.5% 13.5% 25.6% 33.2%Jun - 18 28.6% 14.1% 25.7% 34.2%Sep - 18 28.3% 14.6% 25.3% 33.5%Dec - 18 28.7% 15.5% 25.5% 34.1%Mar - 19 28.2% 15.2% 25.6% 32.9%Jun - 19 28.1% 15.3% 24.7% 32.9%Sep - 19 28.3% 16.3% 25.6% 33.1%
Weighted Averages by country.Weighted average. Banks are classified in the size class according to their average total assets
between Dec. 2014 and Sep. 2019.
Period Weighted average 25th 50th 75th
5th and 95th pct, interquartile range and median.Total numerator and denominator.
Dec 2014 =100.
Country dispersion (as of Sep. 2019) RI by size class
Profitability
15 - Net fee and commission income to total net operating income
Dispersion Numerator and denominator: trends
92
94
96
98
100
102
104
106
108
110
112
Dec
- 14
Mar
- 15
Jun
- 15
Sep
- 15
Dec
- 15
Mar
- 16
Jun
- 16
Sep
- 16
Dec
- 16
Mar
- 17
Jun
- 17
Sep
- 17
Dec
- 17
Mar
- 18
Jun
- 18
Sep
- 18
Dec
- 18
Mar
- 19
Jun
- 19
Sep
- 19
Numerator: Net fee and commission incomeDenominator: Total net operating income
0%
5%
10%
15%
20%
25%
30%
35%
40%
IT FR LU DE LT LV HU PT FI AT SI HR SK BG ES SE IE PL EE BE DK MTGB CY RO CZ IS NL GR NO
EU / EEA
20%
22%
24%
26%
28%
30%
32%
Dec
- 14
Mar
- 15
Jun
- 15
Sep
- 15
Dec
- 15
Mar
- 16
Jun
- 16
Sep
- 16
Dec
- 16
Mar
- 17
Jun
- 17
Sep
- 17
Dec
- 17
Mar
- 18
Jun
- 18
Sep
- 18
Dec
- 18
Mar
- 19
Jun
- 19
Sep
- 19
Small Medium All banks Large
-10%
0%
10%
20%
30%
40%
50%
60%
Dec
- 14
Mar
- 15
Jun
- 15
Sep
- 15
Dec
- 15
Mar
- 16
Jun
- 16
Sep
- 16
Dec
- 16
Mar
- 17
Jun
- 17
Sep
- 17
Dec
- 17
Mar
- 18
Jun
- 18
Sep
- 18
Dec
- 18
Mar
- 19
Jun
- 19
Sep
- 19
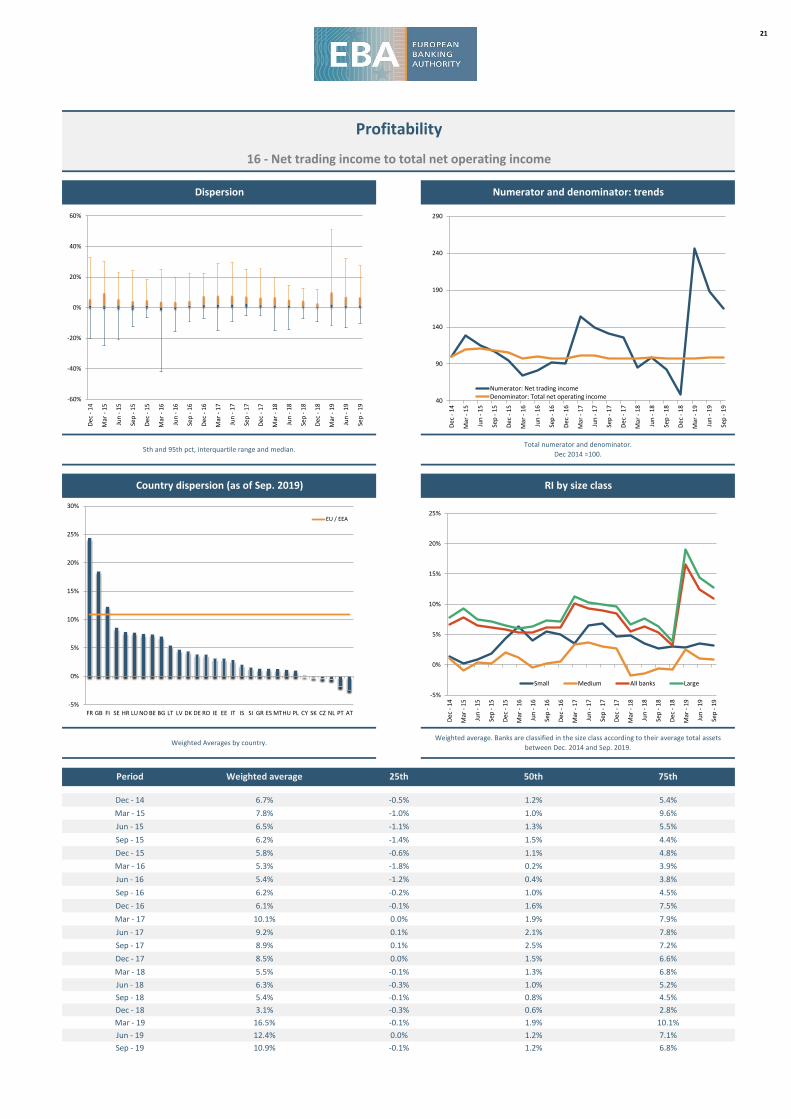
21
Dec - 14 6.7% -0.5% 1.2% 5.4%Mar - 15 7.8% -1.0% 1.0% 9.6%Jun - 15 6.5% -1.1% 1.3% 5.5%Sep - 15 6.2% -1.4% 1.5% 4.4%Dec - 15 5.8% -0.6% 1.1% 4.8%Mar - 16 5.3% -1.8% 0.2% 3.9%Jun - 16 5.4% -1.2% 0.4% 3.8%Sep - 16 6.2% -0.2% 1.0% 4.5%Dec - 16 6.1% -0.1% 1.6% 7.5%Mar - 17 10.1% 0.0% 1.9% 7.9%Jun - 17 9.2% 0.1% 2.1% 7.8%Sep - 17 8.9% 0.1% 2.5% 7.2%Dec - 17 8.5% 0.0% 1.5% 6.6%Mar - 18 5.5% -0.1% 1.3% 6.8%Jun - 18 6.3% -0.3% 1.0% 5.2%Sep - 18 5.4% -0.1% 0.8% 4.5%Dec - 18 3.1% -0.3% 0.6% 2.8%Mar - 19 16.5% -0.1% 1.9% 10.1%Jun - 19 12.4% 0.0% 1.2% 7.1%Sep - 19 10.9% -0.1% 1.2% 6.8%
Weighted Averages by country.Weighted average. Banks are classified in the size class according to their average total assets
between Dec. 2014 and Sep. 2019.
Period Weighted average 25th 50th 75th
5th and 95th pct, interquartile range and median.Total numerator and denominator.
Dec 2014 =100.
Country dispersion (as of Sep. 2019) RI by size class
Profitability
16 - Net trading income to total net operating income
Dispersion Numerator and denominator: trends
40
90
140
190
240
290
Dec
- 14
Mar
- 15
Jun
- 15
Sep
- 15
Dec
- 15
Mar
- 16
Jun
- 16
Sep
- 16
Dec
- 16
Mar
- 17
Jun
- 17
Sep
- 17
Dec
- 17
Mar
- 18
Jun
- 18
Sep
- 18
Dec
- 18
Mar
- 19
Jun
- 19
Sep
- 19
Numerator: Net trading incomeDenominator: Total net operating income
-5%
0%
5%
10%
15%
20%
25%
30%
FR GB FI SE HR LU NO BE BG LT LV DK DE RO IE EE IT IS SI GR ES MTHU PL CY SK CZ NL PT AT
EU / EEA
-5%
0%
5%
10%
15%
20%
25%
Dec
- 14
Mar
- 15
Jun
- 15
Sep
- 15
Dec
- 15
Mar
- 16
Jun
- 16
Sep
- 16
Dec
- 16
Mar
- 17
Jun
- 17
Sep
- 17
Dec
- 17
Mar
- 18
Jun
- 18
Sep
- 18
Dec
- 18
Mar
- 19
Jun
- 19
Sep
- 19
Small Medium All banks Large
-60%
-40%
-20%
0%
20%
40%
60%
Dec
- 14
Mar
- 15
Jun
- 15
Sep
- 15
Dec
- 15
Mar
- 16
Jun
- 16
Sep
- 16
Dec
- 16
Mar
- 17
Jun
- 17
Sep
- 17
Dec
- 17
Mar
- 18
Jun
- 18
Sep
- 18
Dec
- 18
Mar
- 19
Jun
- 19
Sep
- 19
22
Dec - 14 1.55% 1.07% 1.48% 1.79%Mar - 15 1.55% 1.03% 1.48% 1.81%Jun - 15 1.57% 1.06% 1.53% 1.84%Sep - 15 1.57% 1.05% 1.52% 1.85%Dec - 15 1.58% 1.12% 1.53% 1.91%Mar - 16 1.48% 1.06% 1.45% 2.02%Jun - 16 1.47% 1.02% 1.40% 1.85%Sep - 16 1.47% 1.05% 1.42% 1.91%Dec - 16 1.48% 1.05% 1.38% 1.83%Mar - 17 1.46% 0.99% 1.36% 1.87%Jun - 17 1.46% 0.97% 1.37% 1.90%Sep - 17 1.45% 1.00% 1.36% 1.90%Dec - 17 1.47% 1.03% 1.41% 1.95%Mar - 18 1.44% 1.02% 1.44% 2.01%Jun - 18 1.43% 1.01% 1.42% 2.02%Sep - 18 1.44% 1.00% 1.43% 1.99%Dec - 18 1.47% 1.04% 1.46% 2.11%Mar - 19 1.42% 1.05% 1.43% 1.99%Jun - 19 1.43% 1.04% 1.43% 2.01%Sep - 19 1.43% 1.04% 1.42% 2.02%
Weighted Averages by country. Weighted average. Banks are classified in the size class according to their average total assets
between Dec. 2014 and Sep. 2019.
Period Weighted average 25th 50th 75th
5th and 95th pct, interquartile range and median.Total numerator and denominator.
Dec 2014 =100.
Country dispersion (as of Sep. 2019) RI by size class
Profitability
17 - Net interest margin
Dispersion Numerator and denominator: trends
90
95
100
105
110
Dec
- 14
Mar
- 15
Jun
- 15
Sep
- 15
Dec
- 15
Mar
- 16
Jun
- 16
Sep
- 16
Dec
- 16
Mar
- 17
Jun
- 17
Sep
- 17
Dec
- 17
Mar
- 18
Jun
- 18
Sep
- 18
Dec
- 18
Mar
- 19
Jun
- 19
Sep
- 19
Numerator: Net interest incomeDenominator: Interest earning assets
0.0%
0.5%
1.0%
1.5%
2.0%
2.5%
3.0%
3.5%
4.0%
HU RO PL BG IS GR HR ES SI SK EE CY CZ LV IE AT NO PT LT MT NL IT GB BE FR SE DE FI LU DK
EU / EEA
1.2%
1.4%
1.6%
1.8%
2.0%
2.2%
2.4%
Dec
- 14
Mar
- 15
Jun
- 15
Sep
- 15
Dec
- 15
Mar
- 16
Jun
- 16
Sep
- 16
Dec
- 16
Mar
- 17
Jun
- 17
Sep
- 17
Dec
- 17
Mar
- 18
Jun
- 18
Sep
- 18
Dec
- 18
Mar
- 19
Jun
- 19
Sep
- 19
Small Medium All banks Large
0.0%
0.5%
1.0%
1.5%
2.0%
2.5%
3.0%
3.5%
Dec
- 14
Mar
- 15
Jun
- 15
Sep
- 15
Dec
- 15
Mar
- 16
Jun
- 16
Sep
- 16
Dec
- 16
Mar
- 17
Jun
- 17
Sep
- 17
Dec
- 17
Mar
- 18
Jun
- 18
Sep
- 18
Dec
- 18
Mar
- 19
Jun
- 19
Sep
- 19
23
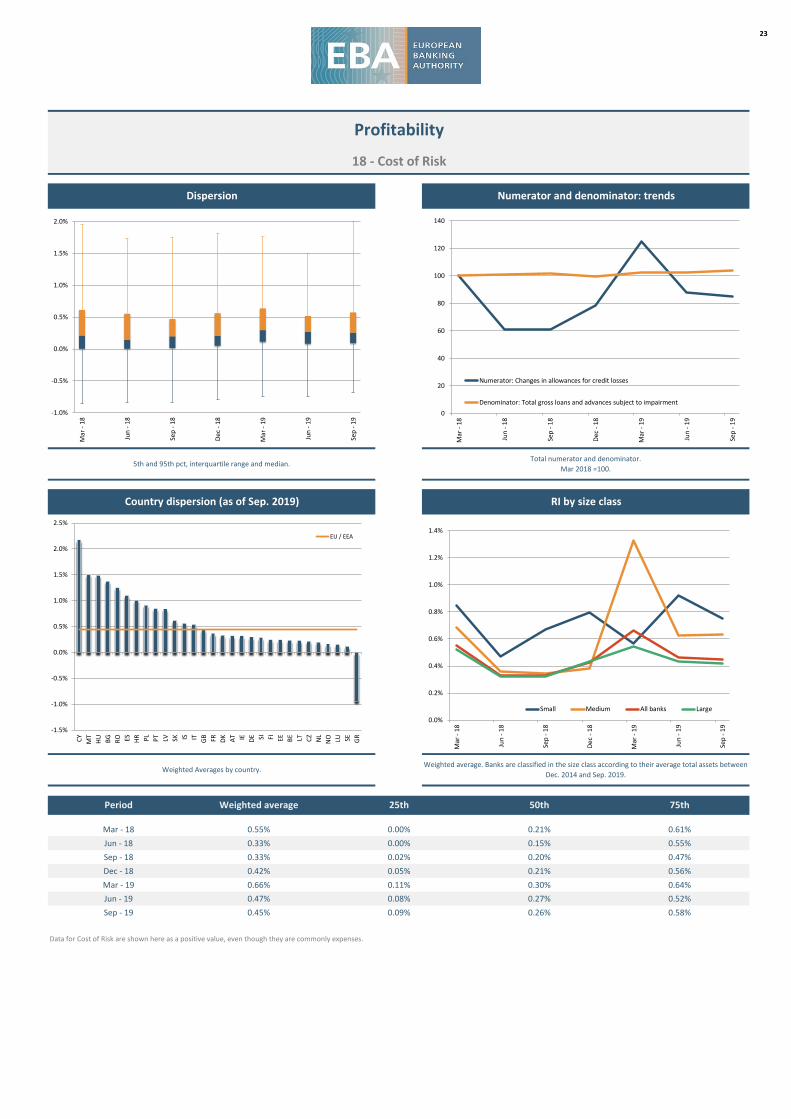
Mar - 18 0.55% 0.00% 0.21% 0.61%Jun - 18 0.33% 0.00% 0.15% 0.55%Sep - 18 0.33% 0.02% 0.20% 0.47%Dec - 18 0.42% 0.05% 0.21% 0.56%Mar - 19 0.66% 0.11% 0.30% 0.64%Jun - 19 0.47% 0.08% 0.27% 0.52%Sep - 19 0.45% 0.09% 0.26% 0.58%
Data for Cost of Risk are shown here as a positive value, even though they are commonly expenses.
Weighted Averages by country. Weighted average. Banks are classified in the size class according to their average total assets between
Dec. 2014 and Sep. 2019.
Period Weighted average 25th 50th 75th
5th and 95th pct, interquartile range and median.Total numerator and denominator.
Mar 2018 =100.
Country dispersion (as of Sep. 2019) RI by size class
Profitability
18 - Cost of Risk
Dispersion Numerator and denominator: trends
0
20
40
60
80
100
120
140
Mar
- 18
Jun
- 18
Sep
- 18
Dec
- 18
Mar
- 19
Jun
- 19
Sep
- 19
Numerator: Changes in allowances for credit losses
Denominator: Total gross loans and advances subject to impairment
-1.5%
-1.0%
-0.5%
0.0%
0.5%
1.0%
1.5%
2.0%
2.5%
CY MT
HU BG RO ES HR PL PT LV SK IS IT GB FR DK AT IE DE SI FI EE BE LT CZ NL
NO LU SE GR
EU / EEA
0.0%
0.2%
0.4%
0.6%
0.8%
1.0%
1.2%
1.4%
Mar
- 18
Jun
- 18
Sep
- 18
Dec
- 18
Mar
- 19
Jun
- 19
Sep
- 19
Small Medium All banks Large
-1.0%
-0.5%
0.0%
0.5%
1.0%
1.5%
2.0%
Mar
- 18
Jun
- 18
Sep
- 18
Dec
- 18
Mar
- 19
Jun
- 19
Sep
- 19
24
Dec - 14 124.7% 97.5% 121.1% 191.8%Mar - 15 125.7% 99.1% 122.2% 188.0%Jun - 15 125.3% 100.1% 120.6% 183.0%Sep - 15 123.6% 99.7% 120.0% 187.0%Dec - 15 121.6% 94.0% 118.3% 179.4%Mar - 16 122.3% 95.7% 119.3% 175.6%Jun - 16 121.1% 96.4% 117.9% 176.0%Sep - 16 120.9% 93.2% 116.9% 179.8%Dec - 16 119.3% 93.5% 116.1% 192.5%Mar - 17 118.9% 94.2% 117.7% 181.7%Jun - 17 118.2% 91.2% 114.9% 163.9%Sep - 17 118.0% 91.6% 112.9% 171.4%Dec - 17 117.4% 89.9% 113.8% 173.7%Mar - 18 118.6% 89.3% 113.3% 178.4%Jun - 18 118.3% 90.0% 112.2% 177.9%Sep - 18 118.4% 92.2% 112.0% 181.6%Dec - 18 117.1% 90.5% 110.7% 185.4%Mar - 19 116.8% 88.4% 107.8% 164.1%Jun - 19 116.4% 90.1% 108.6% 168.4%Sep - 19 116.1% 90.8% 106.8% 173.1%
Weighted Averages by country. Weighted average. Banks are classified in the size class according to their average total assets
between Dec. 2014 and Sep. 2019.
Period Weighted average 25th 50th 75th
5th and 95th pct, interquartile range and median.Total numerator and denominator.
Dec 2014 =100.
Country dispersion (as of Sep. 2019) RI by size class
Funding and Liquidity
19 - Loan-to-deposit ratio for households and non-financial corporations
Dispersion Numerator and denominator: trends
96
101
106
111
116
Dec
- 14
Mar
- 15
Jun
- 15
Sep
- 15
Dec
- 15
Mar
- 16
Jun
- 16
Sep
- 16
Dec
- 16
Mar
- 17
Jun
- 17
Sep
- 17
Dec
- 17
Mar
- 18
Jun
- 18
Sep
- 18
Dec
- 18
Mar
- 19
Jun
- 19
Sep
- 19
Numerator: Loans to NFCs and householdsDenominator: Deposits to NFCs and households
0%
50%
100%
150%
200%
250%
300%
350%
400%
DK SE FI NO IS LU DE NL EE FR SK ES IT AT BE PL IE GB GR LT CZ PT HU LV HR BG SI RO CY MT
EU / EEA
60%
70%
80%
90%
100%
110%
120%
130%
140%
150%
Dec
- 14
Mar
- 15
Jun
- 15
Sep
- 15
Dec
- 15
Mar
- 16
Jun
- 16
Sep
- 16
Dec
- 16
Mar
- 17
Jun
- 17
Sep
- 17
Dec
- 17
Mar
- 18
Jun
- 18
Sep
- 18
Dec
- 18
Mar
- 19
Jun
- 19
Sep
- 19
Small Medium All banks Large
0%
200%
400%
600%
800%
1000%
1200%
1400%
1600%
1800%
Dec
- 14
Mar
- 15
Jun
- 15
Sep
- 15
Dec
- 15
Mar
- 16
Jun
- 16
Sep
- 16
Dec
- 16
Mar
- 17
Jun
- 17
Sep
- 17
Dec
- 17
Mar
- 18
Jun
- 18
Sep
- 18
Dec
- 18
Mar
- 19
Jun
- 19
Sep
- 19
25
Dec - 14 25.4% 13.1% 24.3% 38.8%Mar - 15 25.6% 14.3% 24.8% 38.4%Jun - 15 25.8% 13.7% 25.3% 36.2%Sep - 15 25.4% 13.7% 24.9% 36.9%Dec - 15 25.5% 15.0% 25.4% 35.7%Mar - 16 25.4% 14.3% 24.6% 36.2%Jun - 16 25.5% 12.8% 24.9% 36.1%Sep - 16 26.5% 14.0% 24.3% 36.9%Dec - 16 26.6% 13.5% 24.6% 37.4%Mar - 17 27.7% 14.3% 25.3% 37.9%Jun - 17 28.0% 13.7% 24.3% 36.8%Sep - 17 27.9% 13.0% 25.0% 35.6%Dec - 17 27.9% 13.4% 23.7% 35.1%Mar - 18 28.4% 14.2% 23.8% 35.1%Jun - 18 28.0% 13.8% 23.9% 34.0%Sep - 18 28.7% 13.3% 24.0% 33.8%Dec - 18 28.0% 12.7% 23.7% 34.0%Mar - 19 27.6% 12.1% 22.3% 32.9%Jun - 19 27.5% 11.9% 22.3% 32.4%Sep - 19 27.5% 12.0% 21.9% 32.1%
Weighted Averages by country. Weighted average. Banks are classified in the size class according to their average total assets
between Dec. 2014 and Sep. 2019. Non-FINREP banks are assigned to the bucket of small banks.
Period Weighted average 25th 50th 75th
5th and 95th pct, interquartile range and median.Total numerator and denominator.
Dec 2014 =100.
Country dispersion (as of Sep. 2019) RI by size class
Funding and Liquidity
20 - Asset encumbrance ratio
Dispersion Numerator and denominator: trends
92
94
96
98
100
102
104
106
108
110
112
114
116
118
120
122
Dec
- 14
Mar
- 15
Jun
- 15
Sep
- 15
Dec
- 15
Mar
- 16
Jun
- 16
Sep
- 16
Dec
- 16
Mar
- 17
Jun
- 17
Sep
- 17
Dec
- 17
Mar
- 18
Jun
- 18
Sep
- 18
Dec
- 18
Mar
- 19
Jun
- 19
Sep
- 19
Numerator: Encumbered assets and collateral
Denominator: Total assets and collateral
0%
10%
20%
30%
40%
50%
60%
DK DE GB IT FI FR SE ES NOGR NL IS AT PT SK BE IE CZ HR CY HU LU PL EE SI MTBG RO LT LV
EU / EEA
20%
22%
24%
26%
28%
30%
32%
34%
36%
38%
40%
42%
Dec
- 14
Mar
- 15
Jun
- 15
Sep
- 15
Dec
- 15
Mar
- 16
Jun
- 16
Sep
- 16
Dec
- 16
Mar
- 17
Jun
- 17
Sep
- 17
Dec
- 17
Mar
- 18
Jun
- 18
Sep
- 18
Dec
- 18
Mar
- 19
Jun
- 19
Sep
- 19
Small Medium All banks Large
0%
10%
20%
30%
40%
50%
60%
70%
Dec
- 14
Mar
- 15
Jun
- 15
Sep
- 15
Dec
- 15
Mar
- 16
Jun
- 16
Sep
- 16
Dec
- 16
Mar
- 17
Jun
- 17
Sep
- 17
Dec
- 17
Mar
- 18
Jun
- 18
Sep
- 18
Dec
- 18
Mar
- 19
Jun
- 19
Sep
- 19
26
Sep - 16 140.4% 127.1% 150.3% 243.3%Dec - 16 141.3% 128.4% 154.1% 243.9%Mar - 17 144.7% 131.7% 156.6% 221.1%Jun - 17 145.5% 135.8% 159.0% 230.8%Sep - 17 144.5% 133.3% 158.0% 228.8%Dec - 17 148.3% 139.7% 167.6% 236.7%Mar - 18 147.0% 139.8% 165.6% 234.8%Jun - 18 148.3% 139.8% 162.0% 223.2%Sep - 18 148.5% 137.1% 161.4% 225.2%Dec - 18 151.4% 140.4% 171.6% 247.5%Mar - 19 152.3% 147.0% 170.6% 242.9%Jun - 19 149.2% 140.9% 171.6% 248.0%Sep - 19 147.8% 140.3% 168.7% 235.1%
Weighted Averages by country.Weighted average. Banks are classified in the size class according to their average total assets between
Dec. 2014 and Sep. 2019.
Period Weighted average 25th 50th 75th
5th and 95th pct, interquartile range and median.Total numerator and denominator.
Sep 2016 =100.
Country dispersion (as of Sep. 2019) RI by size class
Funding and Liquidity
21 - Liquidity coverage ratio (%)
Dispersion Numerator and denominator: trends
95
97
99
101
103
105
107
109
111
Sep
- 16
Dec
- 16
Mar
- 17
Jun
- 17
Sep
- 17
Dec
- 17
Mar
- 18
Jun
- 18
Sep
- 18
Dec
- 18
Mar
- 19
Jun
- 19
Sep
- 19
Numerator: Liquidity BufferDenominator: Net Liquidity Outflow
0%
50%
100%
150%
200%
250%
300%
350%
400%
SI CY MT
RO LV LT BG PT IS FI HR SE DK IT HU ES CZ EE GB SK DE IE LU NO BE AT PL FR NL
GR
EU / EEA
100%
120%
140%
160%
180%
200%
220%
240%
260%
280%
Sep
- 16
Dec
- 16
Mar
- 17
Jun
- 17
Sep
- 17
Dec
- 17
Mar
- 18
Jun
- 18
Sep
- 18
Dec
- 18
Mar
- 19
Jun
- 19
Sep
- 19
Small Medium All banks Large
0%
100%
200%
300%
400%
500%
600%
700%
800%
Sep
- 16
Dec
- 16
Mar
- 17
Jun
- 17
Sep
- 17
Dec
- 17
Mar
- 18
Jun
- 18
Sep
- 18
Dec
- 18
Mar
- 19
Jun
- 19
Sep
- 19
STATISTICAL ANNEX
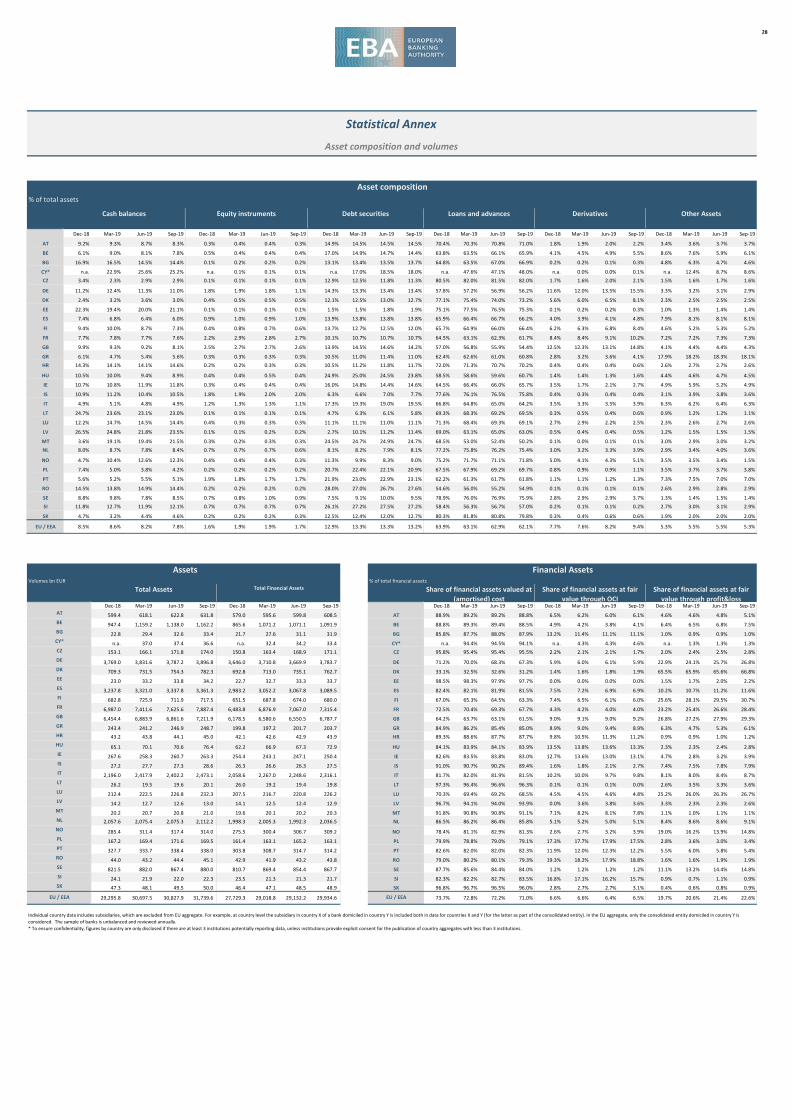
28
% of total assets
Dec-18 Mar-19 Jun-19 Sep-19 Dec-18 Mar-19 Jun-19 Sep-19 Dec-18 Mar-19 Jun-19 Sep-19 Dec-18 Mar-19 Jun-19 Sep-19 Dec-18 Mar-19 Jun-19 Sep-19 Dec-18 Mar-19 Jun-19 Sep-19
AT 9.2% 9.3% 8.7% 8.3% 0.3% 0.4% 0.4% 0.3% 14.9% 14.5% 14.5% 14.5% 70.4% 70.3% 70.8% 71.0% 1.8% 1.9% 2.0% 2.2% 3.4% 3.6% 3.7% 3.7%
BE 6.1% 9.0% 8.1% 7.8% 0.5% 0.4% 0.4% 0.4% 17.0% 14.9% 14.7% 14.4% 63.8% 63.5% 66.1% 65.9% 4.1% 4.5% 4.9% 5.5% 8.6% 7.6% 5.9% 6.1%
BG 16.9% 16.5% 14.5% 14.4% 0.1% 0.2% 0.2% 0.2% 13.1% 13.4% 13.5% 13.7% 64.8% 63.5% 67.0% 66.9% 0.2% 0.2% 0.1% 0.3% 4.8% 6.3% 4.7% 4.6%
CY* n.a. 22.9% 25.6% 25.2% n.a. 0.1% 0.1% 0.1% n.a. 17.0% 18.5% 18.0% n.a. 47.6% 47.1% 48.0% n.a. 0.0% 0.0% 0.1% n.a. 12.4% 8.7% 8.6%CZ 3.4% 2.3% 2.9% 2.9% 0.1% 0.1% 0.1% 0.1% 12.9% 12.5% 11.8% 11.3% 80.5% 82.0% 81.5% 82.0% 1.7% 1.6% 2.0% 2.1% 1.5% 1.6% 1.7% 1.6%
DE 11.2% 12.4% 11.3% 11.0% 1.8% 1.9% 1.8% 1.1% 14.3% 13.3% 13.4% 13.4% 57.8% 57.2% 56.9% 56.2% 11.6% 12.0% 13.5% 15.5% 3.3% 3.2% 3.1% 2.9%
DK 2.4% 3.2% 3.6% 3.0% 0.4% 0.5% 0.5% 0.5% 12.1% 12.5% 13.0% 12.7% 77.1% 75.4% 74.0% 73.2% 5.6% 6.0% 6.5% 8.1% 2.3% 2.5% 2.5% 2.5%
EE 22.3% 19.4% 20.0% 21.1% 0.1% 0.1% 0.1% 0.1% 1.5% 1.5% 1.8% 1.9% 75.1% 77.5% 76.5% 75.3% 0.1% 0.2% 0.2% 0.3% 1.0% 1.3% 1.4% 1.4%
ES 7.4% 6.8% 6.4% 6.0% 0.9% 1.0% 0.9% 1.0% 13.9% 13.8% 13.8% 13.8% 65.9% 66.4% 66.7% 66.2% 4.0% 3.9% 4.1% 4.8% 7.9% 8.1% 8.1% 8.1%
FI 9.4% 10.0% 8.7% 7.3% 0.4% 0.8% 0.7% 0.6% 13.7% 12.7% 12.5% 12.0% 65.7% 64.9% 66.0% 66.4% 6.2% 6.3% 6.8% 8.4% 4.6% 5.2% 5.3% 5.2%
FR 7.7% 7.8% 7.7% 7.6% 2.2% 2.9% 2.8% 2.7% 10.1% 10.7% 10.7% 10.7% 64.5% 63.1% 62.3% 61.7% 8.4% 8.4% 9.1% 10.2% 7.2% 7.2% 7.3% 7.3%
GB 9.9% 9.3% 9.2% 8.1% 2.5% 2.7% 2.7% 2.6% 13.9% 14.5% 14.6% 14.2% 57.0% 56.8% 55.9% 54.4% 12.5% 12.3% 13.1% 14.8% 4.1% 4.4% 4.4% 4.3%
GR 6.1% 4.7% 5.4% 5.6% 0.3% 0.3% 0.3% 0.3% 10.5% 11.0% 11.4% 11.0% 62.4% 62.6% 61.0% 60.8% 2.8% 3.2% 3.6% 4.1% 17.9% 18.2% 18.3% 18.1%HR 14.3% 14.1% 14.1% 14.6% 0.2% 0.2% 0.3% 0.3% 10.5% 11.2% 11.8% 11.7% 72.0% 71.3% 70.7% 70.2% 0.4% 0.4% 0.4% 0.6% 2.6% 2.7% 2.7% 2.6%
HU 10.5% 10.0% 9.4% 8.9% 0.4% 0.4% 0.5% 0.4% 24.9% 25.0% 24.5% 23.8% 58.5% 58.6% 59.6% 60.7% 1.4% 1.4% 1.3% 1.6% 4.4% 4.6% 4.7% 4.5%
IE 10.7% 10.8% 11.9% 11.8% 0.3% 0.4% 0.4% 0.4% 16.0% 14.8% 14.4% 14.6% 64.5% 66.4% 66.0% 65.7% 3.5% 1.7% 2.1% 2.7% 4.9% 5.9% 5.2% 4.9%
IS 10.9% 11.2% 10.4% 10.5% 1.8% 1.9% 2.0% 2.0% 6.3% 6.6% 7.0% 7.7% 77.6% 76.1% 76.5% 75.8% 0.4% 0.3% 0.4% 0.4% 3.1% 3.9% 3.8% 3.6%
IT 4.9% 5.1% 4.8% 4.9% 1.2% 1.3% 1.3% 1.1% 17.3% 19.3% 19.0% 19.5% 66.8% 64.8% 65.0% 64.2% 3.5% 3.3% 3.5% 3.9% 6.3% 6.2% 6.4% 6.3%
LT 24.7% 23.6% 23.1% 23.0% 0.1% 0.1% 0.1% 0.1% 4.7% 6.3% 6.1% 5.8% 69.3% 68.3% 69.2% 69.5% 0.3% 0.5% 0.4% 0.6% 0.9% 1.2% 1.2% 1.1%
LU 12.2% 14.7% 14.5% 14.4% 0.4% 0.3% 0.3% 0.3% 11.1% 11.1% 11.0% 11.1% 71.3% 68.4% 69.3% 69.1% 2.7% 2.9% 2.2% 2.5% 2.3% 2.6% 2.7% 2.6%
LV 26.5% 24.8% 21.8% 23.5% 0.1% 0.1% 0.2% 0.2% 2.7% 10.1% 11.2% 11.4% 69.0% 63.1% 65.0% 63.0% 0.5% 0.4% 0.4% 0.5% 1.2% 1.5% 1.5% 1.5%
MT 3.6% 19.1% 19.4% 21.5% 0.3% 0.2% 0.3% 0.3% 24.5% 24.7% 24.9% 24.7% 68.5% 53.0% 52.4% 50.2% 0.1% 0.0% 0.1% 0.1% 3.0% 2.9% 3.0% 3.2%NL 8.0% 8.7% 7.8% 8.4% 0.7% 0.7% 0.7% 0.6% 8.1% 8.2% 7.9% 8.1% 77.2% 75.8% 76.2% 75.4% 3.0% 3.2% 3.3% 3.9% 2.9% 3.4% 4.0% 3.6%
NO 4.7% 10.4% 12.6% 12.3% 0.4% 0.4% 0.4% 0.3% 11.3% 9.9% 8.3% 9.0% 75.2% 71.7% 71.1% 71.8% 5.0% 4.1% 4.3% 5.1% 3.5% 3.5% 3.4% 1.5%
PL 7.4% 5.0% 3.8% 4.2% 0.2% 0.2% 0.2% 0.2% 20.7% 22.4% 22.1% 20.9% 67.5% 67.9% 69.2% 69.7% 0.8% 0.9% 0.9% 1.1% 3.5% 3.7% 3.7% 3.8%
PT 5.6% 5.2% 5.5% 5.1% 1.9% 1.8% 1.7% 1.7% 21.9% 23.0% 22.9% 23.1% 62.2% 61.3% 61.7% 61.8% 1.1% 1.1% 1.2% 1.3% 7.3% 7.5% 7.0% 7.0%
RO 14.5% 13.8% 14.9% 14.4% 0.2% 0.2% 0.2% 0.2% 28.0% 27.0% 26.7% 27.6% 54.6% 56.0% 55.2% 54.9% 0.1% 0.1% 0.1% 0.1% 2.6% 2.9% 2.8% 2.9%
SE 8.8% 9.8% 7.8% 8.5% 0.7% 0.8% 1.0% 0.9% 7.5% 9.1% 10.0% 9.5% 78.9% 76.0% 76.9% 75.9% 2.8% 2.9% 2.9% 3.7% 1.3% 1.4% 1.5% 1.4%SI 11.8% 12.7% 11.9% 12.1% 0.7% 0.7% 0.7% 0.7% 26.1% 27.2% 27.5% 27.2% 58.4% 56.3% 56.7% 57.0% 0.2% 0.1% 0.1% 0.2% 2.7% 3.0% 3.1% 2.9%
SK 4.7% 3.2% 4.4% 4.6% 0.2% 0.2% 0.2% 0.3% 12.5% 12.4% 12.0% 12.7% 80.3% 81.8% 80.8% 79.8% 0.3% 0.4% 0.6% 0.6% 1.9% 2.0% 2.0% 2.0%
EU / EEA 8.5% 8.6% 8.2% 7.8% 1.6% 1.9% 1.9% 1.7% 12.9% 13.3% 13.3% 13.2% 63.9% 63.1% 62.9% 62.1% 7.7% 7.6% 8.2% 9.4% 5.3% 5.5% 5.5% 5.3%
T02_1 T02_1 T02_1 T02_1 T02_2 T02_2 T02_2 T02_2 T03_1 T03_1 T03_1 T03_1 T03_1 T03_2 T03_2 T03_2 T03_2 T03_3 T03_3 T03_3 T03_3
201812 201903 201906 201909 201812 201903 201906 201909 201812 201903 201906 201909 201812 201903 201906 201909 201812 201903 201906 201909
Volumes bn EUR % of total financial assets
Dec-18 Mar-19 Jun-19 Sep-19 Dec-18 Mar-19 Jun-19 Sep-19 Dec-18 Mar-19 Jun-19 Sep-19 Dec-18 Mar-19 Jun-19 Sep-19 Dec-18 Mar-19 Jun-19 Sep-19
599.4 618.1 622.8 631.8 579.0 595.6 599.8 608.5 0.96316404 88.9% 89.2% 89.2% 88.8% 6.5% 6.2% 6.0% 6.1% 4.6% 4.6% 4.8% 5.1%
947.4 1,159.2 1,138.0 1,162.2 865.6 1,071.2 1,071.1 1,091.9 0.93945016 88.8% 89.3% 89.4% 88.5% 4.9% 4.2% 3.8% 4.1% 6.4% 6.5% 6.8% 7.5%
22.8 29.4 32.6 33.4 21.7 27.6 31.1 31.9 0.95402118 85.8% 87.7% 88.0% 87.9% 13.2% 11.4% 11.1% 11.1% 1.0% 0.9% 0.9% 1.0%
n.a. 37.0 37.4 36.6 n.a. 32.4 34.2 33.4 0.91381027 n.a. 94.4% 94.5% 94.1% n.a. 4.3% 4.3% 4.6% n.a. 1.3% 1.3% 1.3%153.1 166.1 171.8 174.0 150.8 163.4 168.9 171.1 0.98352143 95.8% 95.4% 95.4% 95.5% 2.2% 2.1% 2.1% 1.7% 2.0% 2.4% 2.5% 2.8%
3,769.0 3,831.6 3,787.2 3,896.8 3,646.0 3,710.8 3,669.9 3,783.7 0.9709761 71.2% 70.0% 68.3% 67.3% 5.9% 6.0% 6.1% 5.9% 22.9% 24.1% 25.7% 26.8%
709.3 731.5 754.3 782.3 692.8 713.0 735.1 762.7 0.97484878 33.1% 32.5% 32.6% 31.2% 1.4% 1.6% 1.8% 1.9% 65.5% 65.9% 65.6% 66.8%
23.0 33.2 33.8 34.2 22.7 32.7 33.3 33.7 0.98595634 98.5% 98.3% 97.9% 97.7% 0.0% 0.0% 0.0% 0.0% 1.5% 1.7% 2.0% 2.2%
3,237.8 3,321.0 3,337.8 3,361.3 2,983.2 3,052.2 3,067.8 3,089.5 0.9191359 82.4% 82.1% 81.9% 81.5% 7.5% 7.2% 6.9% 6.9% 10.2% 10.7% 11.2% 11.6%
682.8 725.9 711.9 717.5 651.5 687.8 674.0 680.0 0.94776799 67.0% 65.3% 64.5% 63.3% 7.4% 6.5% 6.1% 6.0% 25.6% 28.1% 29.5% 30.7%
6,987.0 7,411.6 7,625.6 7,887.4 6,483.8 6,876.9 7,067.0 7,315.4 0.92747364 72.5% 70.4% 69.3% 67.7% 4.3% 4.2% 4.0% 4.0% 23.2% 25.4% 26.6% 28.4%
6,454.4 6,883.9 6,861.6 7,211.9 6,178.5 6,580.6 6,550.5 6,787.7 0.94117631 64.2% 63.7% 63.1% 61.5% 9.0% 9.1% 9.0% 9.2% 26.8% 27.2% 27.9% 29.3%
243.4 241.2 246.9 248.7 199.8 197.2 201.7 203.7 0.81886784 84.9% 86.2% 85.4% 85.0% 8.9% 9.0% 9.4% 8.9% 6.3% 4.7% 5.3% 6.1%43.2 43.8 44.1 45.0 42.1 42.6 42.9 43.9 0.97411009 89.3% 88.6% 87.7% 87.7% 9.8% 10.5% 11.3% 11.2% 0.9% 0.9% 1.0% 1.2%
65.1 70.1 70.6 76.4 62.2 66.9 67.3 72.9 0.95493163 84.1% 83.9% 84.1% 83.9% 13.5% 13.8% 13.6% 13.3% 2.3% 2.3% 2.4% 2.8%
267.6 258.3 260.7 263.3 254.4 243.1 247.1 250.4 0.9510149 82.6% 83.5% 83.8% 83.0% 12.7% 13.6% 13.0% 13.1% 4.7% 2.8% 3.2% 3.9%
27.2 27.7 27.3 28.6 26.3 26.6 26.3 27.5 0.96377852 91.0% 90.7% 90.2% 89.4% 1.6% 1.8% 2.1% 2.7% 7.4% 7.5% 7.8% 7.9%
2,196.0 2,417.9 2,402.2 2,473.1 2,058.6 2,267.0 2,248.6 2,316.1 0.93653162 81.7% 82.0% 81.9% 81.5% 10.2% 10.0% 9.7% 9.8% 8.1% 8.0% 8.4% 8.7%
26.2 19.5 19.6 20.1 26.0 19.2 19.4 19.8 0.98909529 97.3% 96.4% 96.6% 96.3% 0.1% 0.1% 0.1% 0.0% 2.6% 3.5% 3.3% 3.6%
212.4 222.5 226.8 232.3 207.5 216.7 220.8 226.2 0.97377245 70.3% 69.4% 69.2% 68.5% 4.5% 4.5% 4.6% 4.8% 25.2% 26.0% 26.3% 26.7%
14.2 12.7 12.6 13.0 14.1 12.5 12.4 12.9 0.98547971 96.7% 94.1% 94.0% 93.9% 0.0% 3.6% 3.8% 3.6% 3.3% 2.3% 2.3% 2.6%
20.2 20.7 20.8 21.0 19.6 20.1 20.2 20.3 0.96803436 91.8% 90.8% 90.8% 91.1% 7.1% 8.2% 8.1% 7.8% 1.1% 1.0% 1.1% 1.1%2,057.6 2,075.4 2,075.3 2,112.2 1,998.3 2,005.3 1,992.3 2,036.5 0.96413295 86.5% 86.2% 86.4% 85.8% 5.1% 5.2% 5.0% 5.1% 8.4% 8.6% 8.6% 9.1%
285.4 311.4 317.4 314.0 275.5 300.4 306.7 309.2 0.98489622 78.4% 81.1% 82.9% 81.3% 2.6% 2.7% 3.2% 3.9% 19.0% 16.2% 13.9% 14.8%
167.2 169.4 171.6 169.5 161.4 163.1 165.2 163.1 0.96223318 79.9% 78.8% 79.0% 79.1% 17.3% 17.7% 17.9% 17.5% 2.8% 3.6% 3.0% 3.4%
327.7 333.7 338.4 338.0 303.8 308.7 314.7 314.2 0.92968607 82.6% 82.0% 82.0% 82.3% 11.9% 12.0% 12.3% 12.2% 5.5% 6.0% 5.8% 5.4%
44.0 43.2 44.4 45.1 42.9 41.9 43.2 43.8 0.9714677 79.0% 80.2% 80.1% 79.3% 19.3% 18.2% 17.9% 18.8% 1.6% 1.6% 1.9% 1.9%
821.5 882.0 867.4 880.0 810.7 869.4 854.4 867.7 0.98600026 87.7% 85.6% 84.4% 84.0% 1.2% 1.2% 1.2% 1.2% 11.1% 13.2% 14.4% 14.8%
24.1 21.9 22.0 22.3 23.5 21.3 21.3 21.7 0.9710067 82.3% 82.2% 82.7% 83.5% 16.8% 17.1% 16.2% 15.7% 0.9% 0.7% 1.1% 0.9%
47.3 48.1 49.5 50.0 46.4 47.1 48.5 48.9 0.97966485 96.8% 96.7% 96.5% 96.0% 2.8% 2.7% 2.7% 3.1% 0.4% 0.6% 0.8% 0.9%
29,295.8 30,697.5 30,827.9 31,739.6 27,729.3 29,018.8 29,132.2 29,934.6 0.94313093 73.7% 72.8% 72.2% 71.0% 6.6% 6.6% 6.4% 6.5% 19.7% 20.6% 21.4% 22.6%
94.3%
* To ensure confidentiality, figures by country are only disclosed if there are at least 3 institutions potentially reporting data, unless institutions provide explicit consent for the publication of country aggregates with less than 3 institutions.
SI SI
LU
LV
MT
NL
PT
RO
SE
SK
HR
HU
IE
Individual country data includes subsidiaries, which are excluded from EU aggregate. For example, at country level the subsidiary in country X of a bank domiciled in country Y is included both in data for countries X and Y (for the latter as part of the consolidated entity). In the EU aggregate, only the consolidated entity domiciled in country Y is considered. The sample of banks is unbalanced and reviewed annually.
EU / EEAEU / EEA
Total Assets Total Financial Assets
BEAT
BE
AT
GR
IS
NO
PL
IE
IS
IT
LT
IT
LT
GB
BG
CY*
CZ
DE
DK
Statistical Annex
Asset composition and volumes
Asset composition
Cash balances Equity instruments Debt securities Loans and advances Derivatives Other Assets
SK
SE
RO
PT
CY*
DK
DE
CZ
LU
LV
MTNL
NO
PL
HR
HU
Assets Financial Assets
GR
GB
FR
FI
ES
EE
BG
Share of financial assets valued at (amortised) cost
Share of financial assets at fair value through OCI
Share of financial assets at fair value through profit&loss
EE
ES
FI
FR
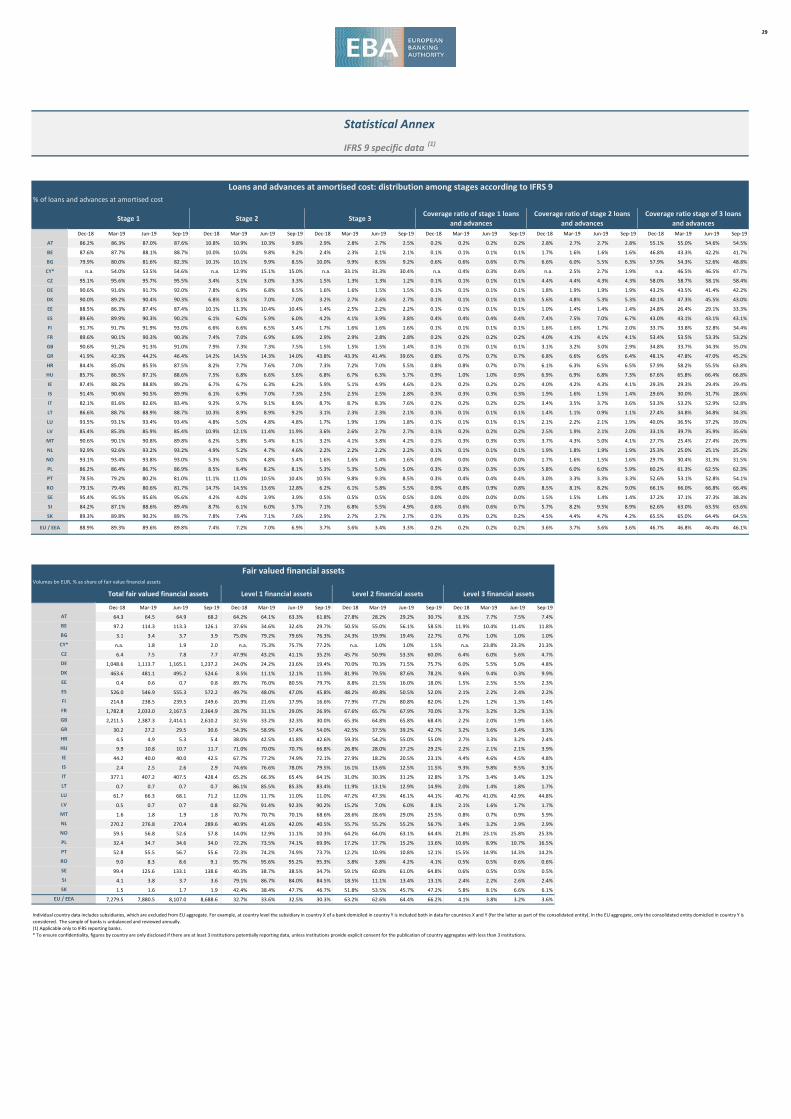
29
% of loans and advances at amortised cost
Dec-18 Mar-19 Jun-19 Sep-19 Dec-18 Mar-19 Jun-19 Sep-19 Dec-18 Mar-19 Jun-19 Sep-19 Dec-18 Mar-19 Jun-19 Sep-19 Dec-18 Mar-19 Jun-19 Sep-19 Dec-18 Mar-19 Jun-19 Sep-19
AT 86.2% 86.3% 87.0% 87.6% 10.8% 10.9% 10.3% 9.8% 2.9% 2.8% 2.7% 2.5% 0.2% 0.2% 0.2% 0.2% 2.8% 2.7% 2.7% 2.8% 55.1% 55.0% 54.6% 54.5%
BE 87.6% 87.7% 88.1% 88.7% 10.0% 10.0% 9.8% 9.2% 2.4% 2.3% 2.1% 2.1% 0.1% 0.1% 0.1% 0.1% 1.7% 1.6% 1.6% 1.6% 46.8% 43.3% 42.2% 41.7%
BG 79.9% 80.0% 81.6% 82.3% 10.1% 10.1% 9.9% 8.5% 10.0% 9.9% 8.5% 9.2% 0.6% 0.6% 0.6% 0.7% 6.6% 6.0% 5.5% 6.3% 57.9% 54.3% 52.6% 48.8%
CY* n.a. 54.0% 53.5% 54.6% n.a. 12.9% 15.1% 15.0% n.a. 33.1% 31.3% 30.4% n.a. 0.4% 0.3% 0.4% n.a. 2.5% 2.7% 1.9% n.a. 46.5% 46.5% 47.7%
CZ 95.1% 95.6% 95.7% 95.5% 3.4% 3.1% 3.0% 3.3% 1.5% 1.3% 1.3% 1.2% 0.1% 0.1% 0.1% 0.1% 4.4% 4.4% 4.3% 4.3% 58.0% 58.7% 58.1% 58.4%
DE 90.6% 91.6% 91.7% 92.0% 7.8% 6.9% 6.8% 6.5% 1.6% 1.6% 1.5% 1.5% 0.1% 0.1% 0.1% 0.1% 1.8% 1.9% 1.9% 1.9% 43.2% 43.5% 41.4% 42.2%
DK 90.0% 89.2% 90.4% 90.3% 6.8% 8.1% 7.0% 7.0% 3.2% 2.7% 2.6% 2.7% 0.1% 0.1% 0.1% 0.1% 5.6% 4.8% 5.3% 5.3% 40.1% 47.3% 45.5% 43.0%
EE 88.5% 86.3% 87.4% 87.4% 10.1% 11.3% 10.4% 10.4% 1.4% 2.5% 2.2% 2.2% 0.1% 0.1% 0.1% 0.1% 1.0% 1.4% 1.4% 1.4% 24.8% 26.4% 29.1% 33.3%
ES 89.6% 89.9% 90.3% 90.2% 6.1% 6.0% 5.9% 6.0% 4.2% 4.1% 3.9% 3.8% 0.4% 0.4% 0.4% 0.4% 7.4% 7.5% 7.0% 6.7% 43.0% 43.1% 43.1% 43.1%
FI 91.7% 91.7% 91.9% 93.0% 6.6% 6.6% 6.5% 5.4% 1.7% 1.6% 1.6% 1.6% 0.1% 0.1% 0.1% 0.1% 1.6% 1.6% 1.7% 2.0% 33.7% 33.8% 32.8% 34.4%
FR 89.6% 90.1% 90.3% 90.3% 7.4% 7.0% 6.9% 6.9% 2.9% 2.9% 2.8% 2.8% 0.2% 0.2% 0.2% 0.2% 4.0% 4.1% 4.1% 4.1% 53.4% 53.5% 53.3% 53.2%
GB 90.6% 91.2% 91.3% 91.0% 7.9% 7.3% 7.3% 7.5% 1.5% 1.5% 1.5% 1.4% 0.1% 0.1% 0.1% 0.1% 3.1% 3.2% 3.0% 2.9% 34.8% 33.7% 34.3% 35.0%
GR 41.9% 42.3% 44.2% 46.4% 14.2% 14.5% 14.3% 14.0% 43.8% 43.3% 41.4% 39.6% 0.8% 0.7% 0.7% 0.7% 6.8% 6.6% 6.6% 6.4% 48.1% 47.8% 47.0% 45.2%
HR 84.4% 85.0% 85.5% 87.5% 8.2% 7.7% 7.6% 7.0% 7.3% 7.2% 7.0% 5.5% 0.8% 0.8% 0.7% 0.7% 6.1% 6.3% 6.5% 6.5% 57.9% 58.2% 55.5% 63.8%
HU 85.7% 86.5% 87.1% 88.6% 7.5% 6.8% 6.6% 5.6% 6.8% 6.7% 6.3% 5.7% 0.9% 1.0% 1.0% 0.9% 6.9% 6.9% 6.8% 7.3% 67.6% 65.8% 66.4% 66.8%
IE 87.4% 88.2% 88.8% 89.2% 6.7% 6.7% 6.3% 6.2% 5.9% 5.1% 4.9% 4.6% 0.2% 0.2% 0.2% 0.2% 4.0% 4.2% 4.3% 4.1% 29.3% 29.3% 29.4% 29.4%
IS 91.4% 90.6% 90.5% 89.9% 6.1% 6.9% 7.0% 7.3% 2.5% 2.5% 2.5% 2.8% 0.3% 0.3% 0.3% 0.3% 1.9% 1.6% 1.5% 1.4% 29.6% 30.0% 31.7% 28.6%
IT 82.1% 81.6% 82.6% 83.4% 9.2% 9.7% 9.1% 8.9% 8.7% 8.7% 8.3% 7.6% 0.2% 0.2% 0.2% 0.2% 3.4% 3.5% 3.7% 3.6% 53.3% 53.2% 52.9% 52.8%
LT 86.6% 88.7% 88.9% 88.7% 10.3% 8.9% 8.9% 9.2% 3.1% 2.3% 2.3% 2.1% 0.1% 0.1% 0.1% 0.1% 1.4% 1.1% 0.9% 1.1% 27.4% 34.8% 34.8% 34.3%
LU 93.5% 93.1% 93.4% 93.4% 4.8% 5.0% 4.8% 4.8% 1.7% 1.9% 1.9% 1.8% 0.1% 0.1% 0.1% 0.1% 2.1% 2.2% 2.1% 1.9% 40.0% 36.5% 37.2% 39.0%
LV 85.4% 85.3% 85.9% 85.4% 10.9% 12.1% 11.4% 11.9% 3.6% 2.6% 2.7% 2.7% 0.1% 0.2% 0.2% 0.2% 2.5% 1.9% 2.1% 2.0% 33.1% 39.7% 35.9% 35.6%
MT 90.6% 90.1% 90.8% 89.8% 6.2% 5.8% 5.4% 6.1% 3.2% 4.1% 3.8% 4.2% 0.2% 0.3% 0.3% 0.3% 3.7% 4.3% 5.0% 4.1% 27.7% 25.4% 27.4% 26.9%
NL 92.9% 92.6% 93.2% 93.2% 4.9% 5.2% 4.7% 4.6% 2.2% 2.2% 2.2% 2.2% 0.1% 0.1% 0.1% 0.1% 1.9% 1.8% 1.9% 1.9% 25.3% 25.0% 25.1% 25.2%
NO 93.1% 93.4% 93.8% 93.0% 5.3% 5.0% 4.8% 5.4% 1.6% 1.6% 1.4% 1.6% 0.0% 0.0% 0.0% 0.0% 1.7% 1.6% 1.5% 1.6% 29.7% 30.4% 31.3% 31.5%
PL 86.2% 86.4% 86.7% 86.9% 8.5% 8.4% 8.2% 8.1% 5.3% 5.3% 5.0% 5.0% 0.3% 0.3% 0.3% 0.3% 5.8% 6.0% 6.0% 5.9% 60.2% 61.3% 62.5% 62.3%
PT 78.5% 79.2% 80.2% 81.0% 11.1% 11.0% 10.5% 10.4% 10.5% 9.8% 9.3% 8.5% 0.3% 0.4% 0.4% 0.4% 3.0% 3.3% 3.3% 3.3% 52.6% 53.1% 52.8% 54.1%
RO 79.1% 79.4% 80.6% 81.7% 14.7% 14.5% 13.6% 12.8% 6.2% 6.1% 5.8% 5.5% 0.9% 0.8% 0.9% 0.8% 8.5% 8.1% 8.2% 9.0% 66.1% 66.0% 66.8% 66.4%
SE 95.4% 95.5% 95.6% 95.6% 4.2% 4.0% 3.9% 3.9% 0.5% 0.5% 0.5% 0.5% 0.0% 0.0% 0.0% 0.0% 1.5% 1.5% 1.4% 1.4% 37.2% 37.1% 37.3% 38.3%
SI 84.2% 87.1% 88.6% 89.4% 8.7% 6.1% 6.0% 5.7% 7.1% 6.8% 5.5% 4.9% 0.6% 0.6% 0.6% 0.7% 5.7% 8.2% 9.5% 8.9% 62.6% 63.0% 63.5% 63.6%
SK 89.3% 89.8% 90.2% 89.7% 7.8% 7.4% 7.1% 7.6% 2.9% 2.7% 2.7% 2.7% 0.3% 0.3% 0.2% 0.2% 4.5% 4.4% 4.7% 4.2% 65.5% 65.0% 64.4% 64.5%
EU / EEA 88.9% 89.3% 89.6% 89.8% 7.4% 7.2% 7.0% 6.9% 3.7% 3.6% 3.4% 3.3% 0.2% 0.2% 0.2% 0.2% 3.6% 3.7% 3.6% 3.6% 46.7% 46.8% 46.4% 46.1%
T14_0 T14_0 T14_0 T14_0 T14_1 T14_1 T14_1 T14_1 T14_2 T14_2 T14_2 T14_2 T14_3 T14_3 T14_3 T14_3
201812 201903 201906 201909 201812 201903 201906 201909 201812 201903 201906 201909 201812 201903 201906 201909
Volumes bn EUR, % as share of fair value financial assets
Dec-18 Mar-19 Jun-19 Sep-19 Dec-18 Mar-19 Jun-19 Sep-19 Dec-18 Mar-19 Jun-19 Sep-19 Dec-18 Mar-19 Jun-19 Sep-19
64.3 64.5 64.9 68.2 64.2% 64.1% 63.3% 61.8% 27.8% 28.2% 29.2% 30.7% 8.1% 7.7% 7.5% 7.4%
97.2 114.3 113.3 126.1 37.6% 34.6% 32.4% 29.7% 50.5% 55.0% 56.1% 58.5% 11.9% 10.4% 11.4% 11.8%
3.1 3.4 3.7 3.9 75.0% 79.2% 79.6% 76.3% 24.3% 19.9% 19.4% 22.7% 0.7% 1.0% 1.0% 1.0%
n.a. 1.8 1.9 2.0 n.a. 75.3% 75.7% 77.2% n.a. 1.0% 1.0% 1.5% n.a. 23.8% 23.3% 21.3%
6.4 7.5 7.8 7.7 47.9% 43.2% 41.1% 35.2% 45.7% 50.9% 53.3% 60.0% 6.4% 6.0% 5.6% 4.7%
1,048.6 1,113.7 1,165.1 1,237.2 24.0% 24.2% 23.6% 19.4% 70.0% 70.3% 71.5% 75.7% 6.0% 5.5% 5.0% 4.8%
463.6 481.1 495.2 524.6 8.5% 11.1% 12.1% 11.9% 81.9% 79.5% 87.6% 78.2% 9.6% 9.4% 0.3% 9.9%
0.4 0.6 0.7 0.8 89.7% 76.0% 80.5% 79.7% 8.8% 21.5% 16.0% 18.0% 1.5% 2.5% 3.5% 2.3%
526.0 546.9 555.3 572.2 49.7% 48.0% 47.0% 45.8% 48.2% 49.8% 50.5% 52.0% 2.1% 2.2% 2.4% 2.2%
214.8 238.5 239.5 249.6 20.9% 21.6% 17.9% 16.6% 77.9% 77.2% 80.8% 82.0% 1.2% 1.2% 1.3% 1.4%
1,782.8 2,033.0 2,167.5 2,364.9 28.7% 31.1% 29.0% 26.9% 67.6% 65.7% 67.9% 70.0% 3.7% 3.2% 3.2% 3.1%
2,211.5 2,387.3 2,414.1 2,610.2 32.5% 33.2% 32.3% 30.0% 65.3% 64.8% 65.8% 68.4% 2.2% 2.0% 1.9% 1.6%
30.2 27.2 29.5 30.6 54.3% 58.9% 57.4% 54.0% 42.5% 37.5% 39.2% 42.7% 3.2% 3.6% 3.4% 3.3%
4.5 4.9 5.3 5.4 38.0% 42.5% 41.8% 42.6% 59.3% 54.2% 55.0% 55.0% 2.7% 3.3% 3.2% 2.4%
9.9 10.8 10.7 11.7 71.0% 70.0% 70.7% 66.8% 26.8% 28.0% 27.2% 29.2% 2.2% 2.1% 2.1% 3.9%
44.2 40.0 40.0 42.5 67.7% 77.2% 74.9% 72.1% 27.9% 18.2% 20.5% 23.1% 4.4% 4.6% 4.5% 4.8%
2.4 2.5 2.6 2.9 74.6% 76.6% 78.0% 79.5% 16.1% 13.6% 12.5% 11.5% 9.3% 9.8% 9.5% 9.1%
377.1 407.2 407.5 428.4 65.2% 66.3% 65.4% 64.1% 31.0% 30.3% 31.2% 32.8% 3.7% 3.4% 3.4% 3.2%
0.7 0.7 0.7 0.7 86.1% 85.5% 85.3% 83.4% 11.9% 13.1% 12.9% 14.9% 2.0% 1.4% 1.8% 1.7%
61.7 66.3 68.1 71.2 12.0% 11.7% 11.0% 11.0% 47.2% 47.3% 46.1% 44.1% 40.7% 41.0% 42.9% 44.8%
0.5 0.7 0.7 0.8 82.7% 91.4% 92.3% 90.2% 15.2% 7.0% 6.0% 8.1% 2.1% 1.6% 1.7% 1.7%
1.6 1.8 1.9 1.8 70.7% 70.7% 70.1% 68.6% 28.6% 28.6% 29.0% 25.5% 0.8% 0.7% 0.9% 5.9%
270.2 276.8 270.4 289.6 40.9% 41.6% 42.0% 40.5% 55.7% 55.2% 55.2% 56.7% 3.4% 3.2% 2.9% 2.9%
59.5 56.8 52.6 57.8 14.0% 12.9% 11.1% 10.3% 64.2% 64.0% 63.1% 64.4% 21.8% 23.1% 25.8% 25.3%
32.4 34.7 34.6 34.0 72.2% 73.5% 74.1% 69.9% 17.2% 17.7% 15.2% 13.6% 10.6% 8.9% 10.7% 16.5%
52.8 55.5 56.7 55.6 72.3% 74.2% 74.9% 73.7% 12.2% 10.9% 10.8% 12.1% 15.5% 14.9% 14.3% 14.2%
9.0 8.3 8.6 9.1 95.7% 95.6% 95.2% 95.3% 3.8% 3.8% 4.2% 4.1% 0.5% 0.5% 0.6% 0.6%
99.4 125.6 133.1 138.6 40.3% 38.7% 38.5% 34.7% 59.1% 60.8% 61.0% 64.8% 0.6% 0.5% 0.5% 0.5%
4.1 3.8 3.7 3.6 79.1% 86.7% 84.0% 84.5% 18.5% 11.1% 13.4% 13.1% 2.4% 2.2% 2.6% 2.4%
1.5 1.6 1.7 1.9 42.4% 38.4% 47.7% 46.7% 51.8% 53.5% 45.7% 47.2% 5.8% 8.1% 6.6% 6.1%
7,279.5 7,880.5 8,107.0 8,688.6 32.7% 33.6% 32.5% 30.3% 63.2% 62.6% 64.4% 66.2% 4.1% 3.8% 3.2% 3.6%
(1) Applicable only to IFRS reporting banks.* To ensure confidentiality, figures by country are only disclosed if there are at least 3 institutions potentially reporting data, unless institutions provide explicit consent for the publication of country aggregates with less than 3 institutions.
EU / EEA
Individual country data includes subsidiaries, which are excluded from EU aggregate. For example, at country level the subsidiary in country X of a bank domiciled in country Y is included both in data for countries X and Y (for the latter as part of the consolidated entity). In the EU aggregate, only the consolidated entity domiciled in country Y is considered. The sample of banks is unbalanced and reviewed annually.
SE
SI
SK
PL
PT
RO
MT
NL
NO
LT
LU
LV
IE
IS
IT
GR
HR
HU
FI
FR
GB
DK
EE
ES
CY*
CZ
DE
AT
BE
BG
Total fair valued financial assets Level 2 financial assets Level 3 financial assets
Fair valued financial assets
Level 1 financial assets
Statistical Annex
IFRS 9 specific data (1)
Loans and advances at amortised cost: distribution among stages according to IFRS 9
Stage 1 Stage 2 Stage 3Coverage ratio of stage 1 loans
and advancesCoverage ratio of stage 2 loans
and advancesCoverage ratio stage of 3 loans
and advances
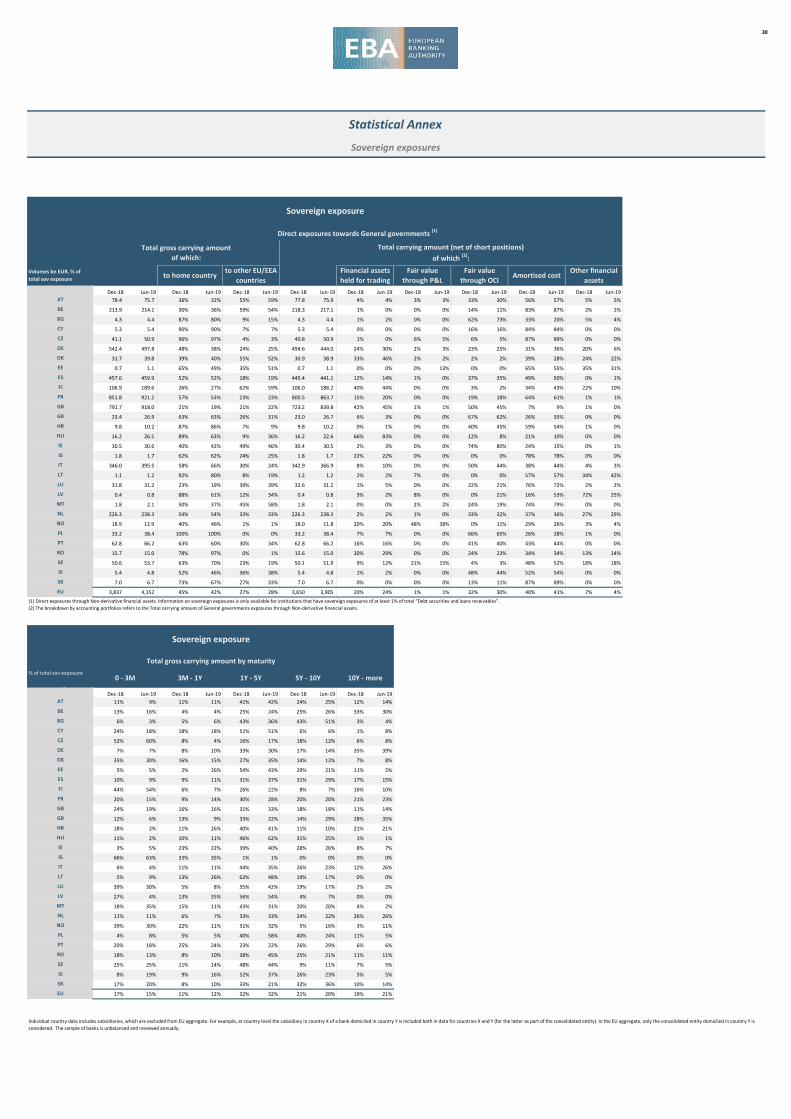
30
T15_1 T15_1 T15_2 T15_2 T15_3 T15_3 T15_4 T15_4 T15_5 T15_5 T15_6 T15_6 T15_7 T15_7 T15_8 T15_8 T15_9 T15_9201812 201906 201812 201906 201812 201906 201812 201906 201812 201906 201812 201906 201812 201906 201812 201906 201812 201906
Dec-18 Jun-19 Dec-18 Jun-19 Dec-18 Jun-19 Dec-18 Jun-19 Dec-18 Jun-19 Dec-18 Jun-19 Dec-18 Jun-19 Dec-18 Jun-19 Dec-18 Jun-1978.4 75.7 36% 32% 55% 59% 77.8 75.9 4% 4% 3% 3% 33% 30% 56% 57% 5% 5%
213.9 214.1 30% 36% 59% 54% 218.3 217.1 1% 0% 0% 0% 14% 11% 83% 87% 2% 2%
4.3 4.4 87% 80% 9% 15% 4.3 4.4 1% 2% 0% 0% 62% 73% 33% 20% 5% 4%
5.3 5.4 90% 90% 7% 7% 5.3 5.4 0% 0% 0% 0% 16% 16% 84% 84% 0% 0%
41.1 50.9 96% 97% 4% 3% 40.8 50.9 1% 0% 6% 5% 6% 5% 87% 89% 0% 0%
542.4 497.8 48% 38% 24% 25% 494.6 444.0 24% 30% 2% 3% 23% 25% 31% 36% 20% 6%
31.7 39.8 39% 40% 55% 52% 30.9 38.9 33% 46% 2% 2% 2% 2% 39% 28% 24% 22%
0.7 1.1 65% 49% 35% 51% 0.7 1.1 0% 0% 0% 13% 0% 0% 65% 55% 35% 31%
457.6 459.9 52% 52% 18% 19% 445.4 441.1 12% 14% 1% 0% 37% 35% 49% 50% 0% 1%
106.9 189.6 26% 27% 62% 59% 106.0 188.2 40% 44% 0% 0% 3% 2% 34% 43% 22% 10%
851.8 921.2 57% 53% 23% 23% 800.5 863.7 15% 20% 0% 0% 19% 18% 64% 61% 1% 1%
791.7 918.0 21% 19% 21% 22% 723.2 839.8 42% 45% 1% 1% 50% 45% 7% 9% 1% 0%
23.4 26.9 63% 63% 26% 31% 23.0 26.7 6% 3% 0% 0% 67% 62% 26% 35% 0% 0%
9.8 10.2 87% 86% 7% 9% 9.8 10.2 0% 1% 0% 0% 40% 45% 59% 54% 1% 0%
16.2 26.5 89% 63% 9% 36% 16.2 22.6 66% 83% 0% 0% 12% 8% 21% 10% 0% 0%
30.5 30.6 40% 42% 49% 46% 30.4 30.5 2% 3% 0% 0% 74% 80% 24% 15% 0% 1%
1.8 1.7 62% 62% 24% 25% 1.8 1.7 22% 22% 0% 0% 0% 0% 78% 78% 0% 0%
346.0 395.5 58% 66% 30% 24% 342.9 366.9 8% 10% 0% 0% 50% 44% 38% 44% 4% 3%
1.1 1.2 92% 80% 8% 19% 1.2 1.2 2% 2% 7% 0% 0% 0% 57% 57% 34% 42%
31.8 31.2 23% 19% 39% 39% 32.6 31.2 1% 5% 0% 0% 22% 21% 76% 72% 2% 2%
0.4 0.8 88% 61% 12% 34% 0.4 0.8 3% 2% 8% 0% 0% 21% 16% 53% 72% 25%
1.8 2.1 50% 37% 45% 58% 1.8 2.1 0% 0% 2% 2% 24% 19% 74% 79% 0% 0%
226.3 238.3 54% 54% 33% 33% 226.3 238.3 2% 2% 1% 0% 33% 32% 37% 36% 27% 29%
18.9 12.9 40% 46% 1% 1% 18.0 11.8 20% 20% 48% 38% 0% 11% 29% 26% 3% 4%
33.2 38.4 100% 100% 0% 0% 33.2 38.4 7% 7% 0% 0% 66% 65% 26% 28% 1% 0%
62.8 66.2 63% 60% 30% 34% 62.8 66.2 16% 16% 0% 0% 41% 40% 43% 44% 0% 0%
15.7 15.0 78% 97% 0% 1% 15.6 15.0 30% 29% 0% 0% 24% 23% 34% 34% 13% 14%
50.6 53.7 63% 70% 23% 19% 50.1 51.9 9% 12% 21% 15% 4% 3% 48% 52% 18% 18%
5.4 4.8 52% 46% 36% 38% 5.4 4.8 1% 2% 0% 0% 48% 44% 52% 54% 0% 0%
7.0 6.7 73% 67% 27% 33% 7.0 6.7 0% 0% 0% 0% 13% 11% 87% 89% 0% 0%
3,837 4,152 45% 42% 27% 28% 3,650 3,905 20% 24% 1% 1% 32% 30% 40% 41% 7% 4%(1) Direct exposures through Non-derivative financial assets. Information on sovereign exposures is only available for institutions that have sovereign exposures of at least 1% of total “Debt securities and loans receivables”.(2) The breakdown by accounting portfolios refers to the Total carrying amount of General governments exposures through Non-derivative financial assets.
T16_1 T16_1 T16_2 T16_2 T16_3 T16_3 T16_4 T16_4 T16_5 T16_5201812 201906 201812 201906 201812 201906 201812 201906 201812 201906
Dec-18 Jun-19 Dec-18 Jun-19 Dec-18 Jun-19 Dec-18 Jun-19 Dec-18 Jun-1911% 9% 11% 11% 41% 42% 24% 25% 12% 14%
13% 16% 4% 4% 25% 24% 25% 26% 33% 30%
6% 3% 5% 6% 43% 36% 43% 51% 3% 4%
24% 18% 18% 18% 51% 51% 6% 6% 1% 8%
52% 60% 8% 4% 16% 17% 18% 12% 6% 8%
7% 7% 8% 10% 33% 30% 17% 14% 35% 39%
35% 30% 16% 15% 27% 35% 14% 12% 7% 8%
5% 5% 2% 26% 54% 43% 29% 21% 11% 5%
10% 9% 9% 11% 31% 37% 31% 29% 17% 15%
44% 54% 6% 7% 26% 22% 8% 7% 16% 10%
20% 15% 9% 14% 30% 28% 20% 20% 21% 23%
24% 19% 16% 16% 31% 33% 18% 18% 11% 14%
12% 6% 13% 9% 33% 22% 14% 29% 28% 35%
18% 2% 11% 26% 40% 41% 11% 10% 21% 21%
11% 2% 10% 11% 46% 62% 31% 25% 1% 1%
3% 5% 23% 22% 39% 40% 28% 26% 8% 7%
66% 63% 33% 35% 1% 1% 0% 0% 0% 0%
6% 4% 11% 11% 44% 35% 26% 23% 12% 26%
5% 9% 13% 26% 63% 48% 19% 17% 0% 0%
39% 30% 5% 8% 35% 42% 19% 17% 2% 2%
27% 4% 13% 35% 56% 54% 4% 7% 0% 0%
18% 35% 15% 11% 43% 31% 20% 20% 4% 2%
11% 11% 6% 7% 33% 33% 24% 22% 26% 26%
39% 30% 22% 11% 31% 32% 5% 16% 3% 11%
4% 8% 5% 5% 40% 58% 40% 24% 11% 5%
20% 18% 25% 24% 23% 22% 26% 29% 6% 6%
18% 13% 8% 10% 38% 45% 25% 21% 11% 11%
25% 25% 11% 14% 48% 44% 9% 11% 7% 5%
8% 19% 9% 16% 52% 37% 26% 23% 5% 5%
17% 20% 8% 10% 33% 21% 32% 36% 10% 14%
17% 15% 11% 12% 32% 32% 21% 20% 19% 21%
ES
IE
IS
NL
Sovereign exposure
Direct exposures towards General governments (1)
Total carrying amount (net of short positions)of which (2):
Other financial assets
Financial assets held for trading
Fair value through P&L
Fair value through OCI
Amortised costVolumes bn EUR, % of total sov exposure to home country
to other EU/EEA countries
NO
IT
GR
HR
HU
LT
LU
LV
MT
Individual country data includes subsidiaries, which are excluded from EU aggregate. For example, at country level the subsidiary in country X of a bank domiciled in country Y is included both in data for countries X and Y (for the latter as part of the consolidated entity). In the EU aggregate, only the consolidated entity domiciled in country Y is considered. The sample of banks is unbalanced and reviewed annually.
Statistical Annex
Sovereign exposures
CY
CZ
DE
AT
BE
BG
FI
FR
GB
DK
EE
Total gross carrying amountof which:
CZ
DE
DK
EE
PT
FR
GB
GR
HR
RO
SE
EU
ES
SI
SK
LT
EU
SE
PL
PT
RO
SI
SK
FI
HU
IE
IS
IT
Sovereign exposure
Total gross carrying amount by maturity% of total sov exposure
NO
PL
LU
LV
MT
NL
10Y - more3M - 1Y0 - 3M
AT
CY
BE
BG
1Y - 5Y 5Y - 10Y
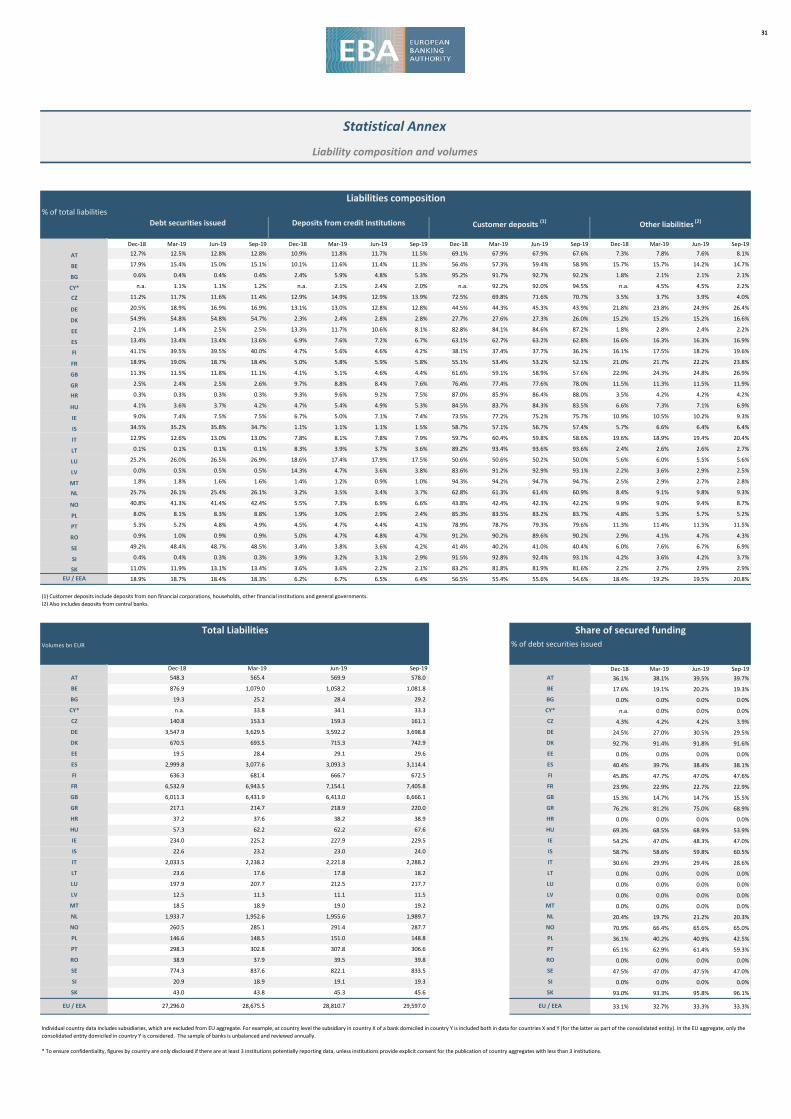
31
% of total liabilities
Dec-18 Mar-19 Jun-19 Sep-19 Dec-18 Mar-19 Jun-19 Sep-19 Dec-18 Mar-19 Jun-19 Sep-19 Dec-18 Mar-19 Jun-19 Sep-1912.7% 12.5% 12.8% 12.8% 10.9% 11.8% 11.7% 11.5% 69.1% 67.9% 67.9% 67.6% 7.3% 7.8% 7.6% 8.1%
17.9% 15.4% 15.0% 15.1% 10.1% 11.6% 11.4% 11.3% 56.4% 57.3% 59.4% 58.9% 15.7% 15.7% 14.2% 14.7%
0.6% 0.4% 0.4% 0.4% 2.4% 5.9% 4.8% 5.3% 95.2% 91.7% 92.7% 92.2% 1.8% 2.1% 2.1% 2.1%
n.a. 1.1% 1.1% 1.2% n.a. 2.1% 2.4% 2.0% n.a. 92.2% 92.0% 94.5% n.a. 4.5% 4.5% 2.2%
11.2% 11.7% 11.6% 11.4% 12.9% 14.9% 12.9% 13.9% 72.5% 69.8% 71.6% 70.7% 3.5% 3.7% 3.9% 4.0%
20.5% 18.9% 16.9% 16.9% 13.1% 13.0% 12.8% 12.8% 44.5% 44.3% 45.3% 43.9% 21.8% 23.8% 24.9% 26.4%
54.9% 54.8% 54.8% 54.7% 2.3% 2.4% 2.8% 2.8% 27.7% 27.6% 27.3% 26.0% 15.2% 15.2% 15.2% 16.6%
2.1% 1.4% 2.5% 2.5% 13.3% 11.7% 10.6% 8.1% 82.8% 84.1% 84.6% 87.2% 1.8% 2.8% 2.4% 2.2%
13.4% 13.4% 13.4% 13.6% 6.9% 7.6% 7.2% 6.7% 63.1% 62.7% 63.2% 62.8% 16.6% 16.3% 16.3% 16.9%
41.1% 39.5% 39.5% 40.0% 4.7% 5.6% 4.6% 4.2% 38.1% 37.4% 37.7% 36.2% 16.1% 17.5% 18.2% 19.6%
18.9% 19.0% 18.7% 18.4% 5.0% 5.8% 5.9% 5.8% 55.1% 53.4% 53.2% 52.1% 21.0% 21.7% 22.2% 23.8%
11.3% 11.5% 11.8% 11.1% 4.1% 5.1% 4.6% 4.4% 61.6% 59.1% 58.9% 57.6% 22.9% 24.3% 24.8% 26.9%
2.5% 2.4% 2.5% 2.6% 9.7% 8.8% 8.4% 7.6% 76.4% 77.4% 77.6% 78.0% 11.5% 11.3% 11.5% 11.9%
0.3% 0.3% 0.3% 0.3% 9.3% 9.6% 9.2% 7.5% 87.0% 85.9% 86.4% 88.0% 3.5% 4.2% 4.2% 4.2%
4.1% 3.6% 3.7% 4.2% 4.7% 5.4% 4.9% 5.3% 84.5% 83.7% 84.3% 83.5% 6.6% 7.3% 7.1% 6.9%
9.0% 7.4% 7.5% 7.5% 6.7% 5.0% 7.1% 7.4% 73.5% 77.2% 75.2% 75.7% 10.9% 10.5% 10.2% 9.3%
34.5% 35.2% 35.8% 34.7% 1.1% 1.1% 1.1% 1.5% 58.7% 57.1% 56.7% 57.4% 5.7% 6.6% 6.4% 6.4%
12.9% 12.6% 13.0% 13.0% 7.8% 8.1% 7.8% 7.9% 59.7% 60.4% 59.8% 58.6% 19.6% 18.9% 19.4% 20.4%
0.1% 0.1% 0.1% 0.1% 8.3% 3.9% 3.7% 3.6% 89.2% 93.4% 93.6% 93.6% 2.4% 2.6% 2.6% 2.7%
25.2% 26.0% 26.5% 26.9% 18.6% 17.4% 17.9% 17.5% 50.6% 50.6% 50.2% 50.0% 5.6% 6.0% 5.5% 5.6%
0.0% 0.5% 0.5% 0.5% 14.3% 4.7% 3.6% 3.8% 83.6% 91.2% 92.9% 93.1% 2.2% 3.6% 2.9% 2.5%
1.8% 1.8% 1.6% 1.6% 1.4% 1.2% 0.9% 1.0% 94.3% 94.2% 94.7% 94.7% 2.5% 2.9% 2.7% 2.8%
25.7% 26.1% 25.4% 26.1% 3.2% 3.5% 3.4% 3.7% 62.8% 61.3% 61.4% 60.9% 8.4% 9.1% 9.8% 9.3%
40.8% 41.3% 41.4% 42.4% 5.5% 7.3% 6.9% 6.6% 43.8% 42.4% 42.3% 42.2% 9.9% 9.0% 9.4% 8.7%
8.0% 8.1% 8.3% 8.8% 1.9% 3.0% 2.9% 2.4% 85.3% 83.5% 83.2% 83.7% 4.8% 5.3% 5.7% 5.2%
5.3% 5.2% 4.8% 4.9% 4.5% 4.7% 4.4% 4.1% 78.9% 78.7% 79.3% 79.6% 11.3% 11.4% 11.5% 11.5%
0.9% 1.0% 0.9% 0.9% 5.0% 4.7% 4.8% 4.7% 91.2% 90.2% 89.6% 90.2% 2.9% 4.1% 4.7% 4.3%
49.2% 48.4% 48.7% 48.5% 3.4% 3.8% 3.6% 4.2% 41.4% 40.2% 41.0% 40.4% 6.0% 7.6% 6.7% 6.9%
0.4% 0.4% 0.3% 0.3% 3.9% 3.2% 3.1% 2.9% 91.5% 92.8% 92.4% 93.1% 4.2% 3.6% 4.2% 3.7%
11.0% 11.9% 13.1% 13.4% 3.6% 3.6% 2.2% 2.1% 83.2% 81.8% 81.9% 81.6% 2.2% 2.7% 2.9% 2.9%
18.9% 18.7% 18.4% 18.3% 6.2% 6.7% 6.5% 6.4% 56.5% 55.4% 55.6% 54.6% 18.4% 19.2% 19.5% 20.8%
(1) Customer deposits include deposits from non financial corporations, households, other financial institutions and general governments.(2) Also includes deposits from central banks.
T05_1 T05_1 T05_1 T05_1 T05_1 T05_1 T05_1 T05_1 T04_2 T04_2 T04_2 T04_2201812 201903 201906 201909 201812 201903 201906 201909
Volumes bn EUR % of debt securities issued
Dec-18 Mar-19 Jun-19 Sep-1936.1% 38.1% 39.5% 39.7%
17.6% 19.1% 20.2% 19.3%
0.0% 0.0% 0.0% 0.0%
n.a. 0.0% 0.0% 0.0%
4.3% 4.2% 4.2% 3.9%
24.5% 27.0% 30.5% 29.5%
92.7% 91.4% 91.8% 91.6%
0.0% 0.0% 0.0% 0.0%
40.4% 39.7% 38.4% 38.1%
45.8% 47.7% 47.0% 47.6%
23.9% 22.9% 22.7% 22.9%
15.3% 14.7% 14.7% 15.5%
76.2% 81.2% 75.0% 68.9%
0.0% 0.0% 0.0% 0.0%
69.3% 68.5% 68.9% 53.9%
54.2% 47.0% 48.3% 47.0%
58.7% 58.6% 59.8% 60.5%
30.6% 29.9% 29.4% 28.6%
0.0% 0.0% 0.0% 0.0%
0.0% 0.0% 0.0% 0.0%
0.0% 0.0% 0.0% 0.0%
0.0% 0.0% 0.0% 0.0%
20.4% 19.7% 21.2% 20.3%
70.9% 66.4% 65.6% 65.0%
36.1% 40.2% 40.9% 42.5%
65.1% 62.9% 61.4% 59.3%
0.0% 0.0% 0.0% 0.0%
47.5% 47.0% 47.5% 47.0%
0.0% 0.0% 0.0% 0.0%
93.0% 93.3% 95.8% 96.1%
33.1% 32.7% 33.3% 33.3%
* To ensure confidentiality, figures by country are only disclosed if there are at least 3 institutions potentially reporting data, unless institutions provide explicit consent for the publication of country aggregates with less than 3 institutions.
SI
SI 20.9 18.9 19.1 19.3 SI
Liabilities composition
Share of secured funding
PT
RO
SE
SKEU / EEA
AT
BE
BG
CY*CZ
DE
DK
EE
ES
FI
FR
GB
GRHR
HU
IE
IS
IT
LT
LU
LV
MTNL
NO
PL
NL
LT 23.6 17.6 17.8 18.2
LU 197.9 207.7 212.5 217.7
IS 22.6 23.2 23.0 24.0
AT
Total Liabilities
NL 1,933.7 1,952.6 1,955.6 1,989.7
PLPL 146.6 148.5 151.0 148.8
LV 12.5 11.3 11.1 11.5
MT 18.5 18.9 19.0 19.2
PT
RO
SE
SK
EU / EEA
HR
HU
IE
IS
IT
LT
LU
LV
MT
NO
28,810.7 29,597.0
RO 38.9 37.9 39.5 39.8
SE 774.3 837.6 822.1 833.5
SK 43.0 43.8 45.3 45.6
EU / EEA 27,296.0 28,675.5
PT 298.3 302.8 307.8 306.6
NO 260.5 285.1 291.4 287.7
37.2 37.6 38.2 38.9
IT 2,033.5 2,238.2 2,221.8 2,288.2
HU 57.3 62.2 62.2 67.6
IE 234.0 225.2 227.9 229.5
HR
GB 6,011.3 6,431.9 6,413.0 6,666.1
GR 217.1 214.7 218.9 220.0
FI 636.3 681.4 666.7 672.5
FR 6,532.9 6,943.5 7,154.1 7,405.8
EE 19.5 28.4 29.1 29.6
ES 2,999.8 3,077.6 3,093.3 3,114.4
161.1
DE 3,547.9 3,629.5 3,592.2 3,698.8
DK 670.5 693.5 715.3 742.9
159.3
FI
FR
GB
GR
Individual country data includes subsidiaries, which are excluded from EU aggregate. For example, at country level the subsidiary in country X of a bank domiciled in country Y is included both in data for countries X and Y (for the latter as part of the consolidated entity). In the EU aggregate, only the consolidated entity domiciled in country Y is considered. The sample of banks is unbalanced and reviewed annually.
Deposits from credit institutions
Dec-18 Mar-19 Jun-19 Sep-19
BE
BG
CY*
CZ
DE
AT 548.3 565.4 569.9 578.0
BE 876.9 1,079.0 1,058.2
Statistical Annex
Liability composition and volumes
Customer deposits (1)Debt securities issued Other liabilities (2)
DK
EE
ES
1,081.8
BG 19.3 25.2 28.4 29.2
CY* n.a. 33.8 34.1 33.3
CZ 140.8 153.3
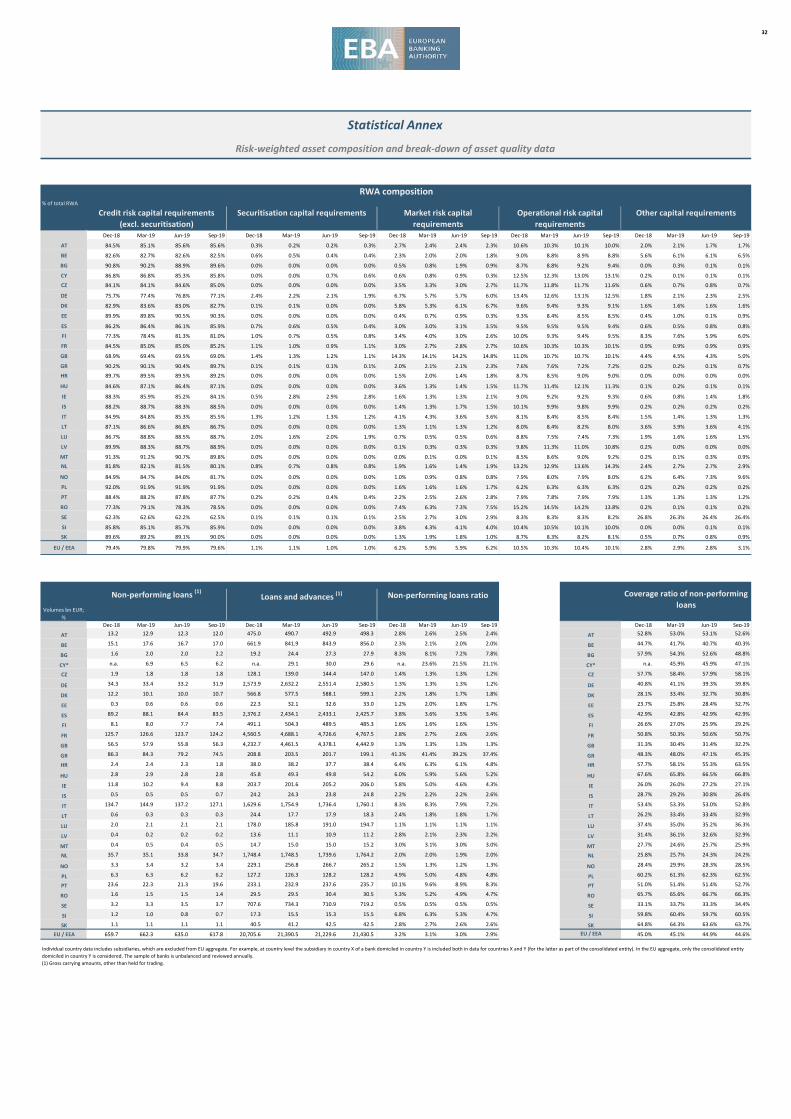
32
% of total RWA
Dec-18 Mar-19 Jun-19 Sep-19 Dec-18 Mar-19 Jun-19 Sep-19 Dec-18 Mar-19 Jun-19 Sep-19 Dec-18 Mar-19 Jun-19 Sep-19 Dec-18 Mar-19 Jun-19 Sep-19
AT 84.5% 85.1% 85.6% 85.6% 0.3% 0.2% 0.2% 0.3% 2.7% 2.4% 2.4% 2.3% 10.6% 10.3% 10.1% 10.0% 2.0% 2.1% 1.7% 1.7%
BE 82.6% 82.7% 82.6% 82.5% 0.6% 0.5% 0.4% 0.4% 2.3% 2.0% 2.0% 1.8% 9.0% 8.8% 8.9% 8.8% 5.6% 6.1% 6.1% 6.5%
BG 90.8% 90.2% 88.9% 89.6% 0.0% 0.0% 0.0% 0.0% 0.5% 0.8% 1.9% 0.9% 8.7% 8.8% 9.2% 9.4% 0.0% 0.3% 0.1% 0.1%
CY 86.8% 86.8% 85.3% 85.8% 0.0% 0.0% 0.7% 0.6% 0.6% 0.8% 0.9% 0.3% 12.5% 12.3% 13.0% 13.1% 0.2% 0.1% 0.1% 0.1%
CZ 84.1% 84.1% 84.6% 85.0% 0.0% 0.0% 0.0% 0.0% 3.5% 3.3% 3.0% 2.7% 11.7% 11.8% 11.7% 11.6% 0.6% 0.7% 0.8% 0.7%
DE 75.7% 77.4% 76.8% 77.1% 2.4% 2.2% 2.1% 1.9% 6.7% 5.7% 5.7% 6.0% 13.4% 12.6% 13.1% 12.5% 1.8% 2.1% 2.3% 2.5%
DK 82.9% 83.6% 83.0% 82.7% 0.1% 0.1% 0.0% 0.0% 5.8% 5.3% 6.1% 6.7% 9.6% 9.4% 9.3% 9.1% 1.6% 1.6% 1.6% 1.6%
EE 89.9% 89.8% 90.5% 90.3% 0.0% 0.0% 0.0% 0.0% 0.4% 0.7% 0.9% 0.3% 9.3% 8.4% 8.5% 8.5% 0.4% 1.0% 0.1% 0.9%
ES 86.2% 86.4% 86.1% 85.9% 0.7% 0.6% 0.5% 0.4% 3.0% 3.0% 3.1% 3.5% 9.5% 9.5% 9.5% 9.4% 0.6% 0.5% 0.8% 0.8%
FI 77.3% 78.4% 81.3% 81.0% 1.0% 0.7% 0.5% 0.8% 3.4% 4.0% 3.0% 2.6% 10.0% 9.3% 9.4% 9.5% 8.3% 7.6% 5.9% 6.0%
FR 84.5% 85.0% 85.0% 85.2% 1.1% 1.0% 0.9% 1.1% 3.0% 2.7% 2.8% 2.7% 10.6% 10.3% 10.3% 10.1% 0.9% 0.9% 0.9% 0.9%
GB 68.9% 69.4% 69.5% 69.0% 1.4% 1.3% 1.2% 1.1% 14.3% 14.1% 14.2% 14.8% 11.0% 10.7% 10.7% 10.1% 4.4% 4.5% 4.3% 5.0%
GR 90.2% 90.1% 90.4% 89.7% 0.1% 0.1% 0.1% 0.1% 2.0% 2.1% 2.1% 2.3% 7.6% 7.6% 7.2% 7.2% 0.2% 0.2% 0.1% 0.7%
HR 89.7% 89.5% 89.5% 89.2% 0.0% 0.0% 0.0% 0.0% 1.5% 2.0% 1.4% 1.8% 8.7% 8.5% 9.0% 9.0% 0.0% 0.0% 0.0% 0.0%
HU 84.6% 87.1% 86.4% 87.1% 0.0% 0.0% 0.0% 0.0% 3.6% 1.3% 1.4% 1.5% 11.7% 11.4% 12.1% 11.3% 0.1% 0.2% 0.1% 0.1%
IE 88.3% 85.9% 85.2% 84.1% 0.5% 2.8% 2.9% 2.8% 1.6% 1.3% 1.3% 2.1% 9.0% 9.2% 9.2% 9.3% 0.6% 0.8% 1.4% 1.8%
IS 88.2% 88.7% 88.3% 88.5% 0.0% 0.0% 0.0% 0.0% 1.4% 1.3% 1.7% 1.5% 10.1% 9.9% 9.8% 9.9% 0.2% 0.2% 0.2% 0.2%
IT 84.9% 84.8% 85.3% 85.5% 1.3% 1.2% 1.3% 1.2% 4.1% 4.3% 3.6% 3.6% 8.1% 8.4% 8.5% 8.4% 1.5% 1.4% 1.3% 1.3%
LT 87.1% 86.6% 86.8% 86.7% 0.0% 0.0% 0.0% 0.0% 1.3% 1.1% 1.3% 1.2% 8.0% 8.4% 8.2% 8.0% 3.6% 3.9% 3.6% 4.1%
LU 86.7% 88.8% 88.5% 88.7% 2.0% 1.6% 2.0% 1.9% 0.7% 0.5% 0.5% 0.6% 8.8% 7.5% 7.4% 7.3% 1.9% 1.6% 1.6% 1.5%
LV 89.9% 88.3% 88.7% 88.9% 0.0% 0.0% 0.0% 0.0% 0.1% 0.3% 0.3% 0.3% 9.8% 11.3% 11.0% 10.8% 0.2% 0.0% 0.0% 0.0%
MT 91.3% 91.2% 90.7% 89.8% 0.0% 0.0% 0.0% 0.0% 0.0% 0.1% 0.0% 0.1% 8.5% 8.6% 9.0% 9.2% 0.2% 0.1% 0.3% 0.9%NL 81.8% 82.1% 81.5% 80.1% 0.8% 0.7% 0.8% 0.8% 1.9% 1.6% 1.4% 1.9% 13.2% 12.9% 13.6% 14.3% 2.4% 2.7% 2.7% 2.9%
NO 84.9% 84.7% 84.0% 81.7% 0.0% 0.0% 0.0% 0.0% 1.0% 0.9% 0.8% 0.8% 7.9% 8.0% 7.9% 8.0% 6.2% 6.4% 7.3% 9.6%
PL 92.0% 91.9% 91.9% 91.9% 0.0% 0.0% 0.0% 0.0% 1.6% 1.6% 1.6% 1.7% 6.2% 6.3% 6.3% 6.3% 0.2% 0.2% 0.2% 0.2%
PT 88.4% 88.2% 87.8% 87.7% 0.2% 0.2% 0.4% 0.4% 2.2% 2.5% 2.6% 2.8% 7.9% 7.8% 7.9% 7.9% 1.3% 1.3% 1.3% 1.2%
RO 77.3% 79.1% 78.3% 78.5% 0.0% 0.0% 0.0% 0.0% 7.4% 6.3% 7.3% 7.5% 15.2% 14.5% 14.2% 13.8% 0.2% 0.1% 0.1% 0.2%
SE 62.3% 62.6% 62.2% 62.5% 0.1% 0.1% 0.1% 0.1% 2.5% 2.7% 3.0% 2.9% 8.3% 8.3% 8.3% 8.2% 26.8% 26.3% 26.4% 26.4%
SI 85.8% 85.1% 85.7% 85.9% 0.0% 0.0% 0.0% 0.0% 3.8% 4.3% 4.1% 4.0% 10.4% 10.5% 10.1% 10.0% 0.0% 0.0% 0.1% 0.1%
SK 89.6% 89.2% 89.1% 90.0% 0.0% 0.0% 0.0% 0.0% 1.3% 1.9% 1.8% 1.0% 8.7% 8.3% 8.2% 8.1% 0.5% 0.7% 0.8% 0.9%
EU / EEA 79.4% 79.8% 79.9% 79.6% 1.1% 1.1% 1.0% 1.0% 6.2% 5.9% 5.9% 6.2% 10.5% 10.3% 10.4% 10.1% 2.8% 2.9% 2.8% 3.1%
T08_1 T08_1 T08_1 T08_1 T08_2 T08_2 T08_2 T08_2 T08_3 T08_3 T08_3 T08_3 T09_1 T09_1 T09_1 T09_1201812 201903 201906 201909 201812 201903 201906 201909 201812 201903 201906 201909 201812 201903 201906 201909
Dec-18 Mar-19 Jun-19 Sep-19 Dec-18 Mar-19 Jun-19 Sep-19 Dec-18 Mar-19 Jun-19 Sep-19 Dec-18 Mar-19 Jun-19 Sep-19
AT 13.2 12.9 12.3 12.0 475.0 490.7 492.9 498.3 2.8% 2.6% 2.5% 2.4% 52.8% 53.0% 53.1% 52.6%
BE 15.1 17.6 16.7 17.0 661.9 841.9 843.9 856.0 2.3% 2.1% 2.0% 2.0% 44.7% 41.7% 40.7% 40.3%
BG 1.6 2.0 2.0 2.2 19.2 24.4 27.3 27.9 8.3% 8.1% 7.2% 7.8% 57.9% 54.3% 52.6% 48.8%
CY* n.a. 6.9 6.5 6.2 n.a. 29.1 30.0 29.6 n.a. 23.6% 21.5% 21.1% n.a. 45.9% 45.9% 47.1%
CZ 1.9 1.8 1.8 1.8 128.1 139.0 144.4 147.0 1.4% 1.3% 1.3% 1.2% 57.7% 58.4% 57.9% 58.1%
DE 34.3 33.4 33.2 31.9 2,573.9 2,632.2 2,551.4 2,580.5 1.3% 1.3% 1.3% 1.2% 40.8% 41.1% 39.3% 39.8%
DK 12.2 10.1 10.0 10.7 566.8 577.5 588.1 599.1 2.2% 1.8% 1.7% 1.8% 28.1% 33.4% 32.7% 30.8%
EE 0.3 0.6 0.6 0.6 22.3 32.1 32.6 33.0 1.2% 2.0% 1.8% 1.7% 23.7% 25.8% 28.4% 32.7%
ES 89.2 88.1 84.4 83.5 2,376.2 2,434.1 2,433.1 2,425.7 3.8% 3.6% 3.5% 3.4% 42.9% 42.8% 42.9% 42.9%
FI 8.1 8.0 7.7 7.4 491.1 504.3 489.5 485.3 1.6% 1.6% 1.6% 1.5% 26.6% 27.0% 25.9% 29.2%
FR 125.7 126.6 123.7 124.2 4,560.5 4,688.1 4,726.6 4,767.5 2.8% 2.7% 2.6% 2.6% 50.8% 50.3% 50.6% 50.7%
GB 56.5 57.9 55.8 56.3 4,232.7 4,461.5 4,378.1 4,442.9 1.3% 1.3% 1.3% 1.3% 31.3% 30.4% 31.4% 32.2%
GR 86.3 84.3 79.2 74.5 208.8 203.5 201.7 199.1 41.3% 41.4% 39.2% 37.4% 48.3% 48.0% 47.1% 45.3%
HR 2.4 2.4 2.3 1.8 38.0 38.2 37.7 38.4 6.4% 6.3% 6.1% 4.8% 57.7% 58.1% 55.3% 63.5%
HU 2.8 2.9 2.8 2.8 45.8 49.3 49.8 54.2 6.0% 5.9% 5.6% 5.2% 67.6% 65.8% 66.5% 66.8%
IE 11.8 10.2 9.4 8.8 203.7 201.6 205.2 206.0 5.8% 5.0% 4.6% 4.3% 26.0% 26.0% 27.2% 27.1%
IS 0.5 0.5 0.5 0.7 24.2 24.3 23.8 24.8 2.2% 2.2% 2.2% 2.6% 28.7% 29.2% 30.8% 26.4%
IT 134.7 144.9 137.2 127.1 1,629.6 1,754.9 1,736.4 1,760.1 8.3% 8.3% 7.9% 7.2% 53.4% 53.3% 53.0% 52.8%
LT 0.6 0.3 0.3 0.3 24.4 17.7 17.9 18.3 2.4% 1.8% 1.8% 1.7% 26.2% 33.4% 33.4% 32.9%
LU 2.0 2.1 2.1 2.1 178.0 185.8 191.0 194.7 1.1% 1.1% 1.1% 1.1% 37.4% 35.0% 35.2% 36.3%
LV 0.4 0.2 0.2 0.2 13.6 11.1 10.9 11.2 2.8% 2.1% 2.3% 2.2% 31.4% 36.1% 32.6% 32.9%
MT 0.4 0.5 0.4 0.5 14.7 15.0 15.0 15.2 3.0% 3.1% 3.0% 3.0% 27.7% 24.6% 25.7% 25.9%
NL 35.7 35.1 33.8 34.7 1,748.4 1,748.5 1,739.6 1,764.2 2.0% 2.0% 1.9% 2.0% 25.8% 25.7% 24.3% 24.2%
NO 3.3 3.4 3.2 3.4 229.1 256.8 266.7 265.2 1.5% 1.3% 1.2% 1.3% 28.4% 29.9% 28.3% 28.5%
PL 6.3 6.3 6.2 6.2 127.2 126.3 128.2 128.2 4.9% 5.0% 4.8% 4.8% 60.2% 61.3% 62.3% 62.5%
PT 23.6 22.3 21.3 19.6 233.1 232.9 237.6 235.7 10.1% 9.6% 8.9% 8.3% 51.0% 51.4% 51.4% 52.7%
RO 1.6 1.5 1.5 1.4 29.5 29.5 30.4 30.5 5.3% 5.2% 4.9% 4.7% 65.7% 65.6% 66.7% 66.3%
SE 3.2 3.3 3.5 3.7 707.6 734.3 710.9 719.2 0.5% 0.5% 0.5% 0.5% 33.1% 33.7% 33.3% 34.4%
SI 1.2 1.0 0.8 0.7 17.3 15.5 15.3 15.5 6.8% 6.3% 5.3% 4.7% 59.8% 60.4% 59.7% 60.5%
SK 1.1 1.1 1.1 1.1 40.5 41.2 42.5 42.5 2.8% 2.7% 2.6% 2.6% 64.8% 64.3% 63.6% 63.7%
EU / EEA 659.7 662.3 635.0 617.8 20,705.6 21,390.5 21,229.6 21,430.5 3.2% 3.1% 3.0% 2.9% 45.0% 45.1% 44.9% 44.6%
(1) Gross carrying amounts, other than held for trading.
Individual country data includes subsidiaries, which are excluded from EU aggregate. For example, at country level the subsidiary in country X of a bank domiciled in country Y is included both in data for countries X and Y (for the latter as part of the consolidated entity). In the EU aggregate, only the consolidated entity domiciled in country Y is considered. The sample of banks is unbalanced and reviewed annually.
PLPT
RO
SE
SKEU / EEA
SI
NO
GRHR
HU
IE
IS
IT
LT
LU
LV
MTNL
GB
AT
BE
BG
CY*CZ
DE
DK
EE
ES
FI
FR
Statistical Annex
Risk-weighted asset composition and break-down of asset quality data
RWA composition
Credit risk capital requirements (excl. securitisation)
Securitisation capital requirements Market risk capital requirements
Operational risk capital requirements
Other capital requirements
Loans and advances (1) Non-performing loans ratio Coverage ratio of non-performing loans
Volumes bn EUR; %
Non-performing loans (1)
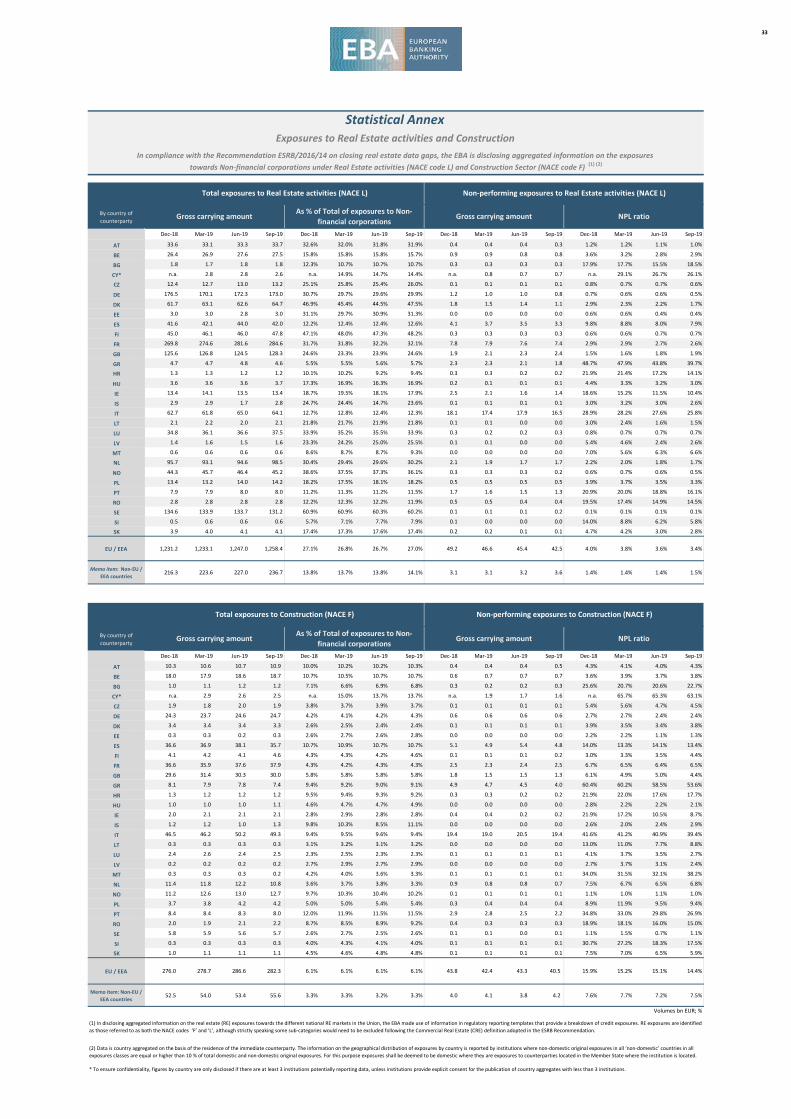
33
By country of counterparty
Dec-18 Mar-19 Jun-19 Sep-19 Dec-18 Mar-19 Jun-19 Sep-19 Dec-18 Mar-19 Jun-19 Sep-19 Dec-18 Mar-19 Jun-19 Sep-19
AT 33.6 33.1 33.3 33.7 32.6% 32.0% 31.8% 31.9% 0.4 0.4 0.4 0.3 1.2% 1.2% 1.1% 1.0%
BE 26.4 26.9 27.6 27.5 15.8% 15.8% 15.8% 15.7% 0.9 0.9 0.8 0.8 3.6% 3.2% 2.8% 2.9%
BG 1.8 1.7 1.8 1.8 12.3% 10.7% 10.7% 10.7% 0.3 0.3 0.3 0.3 17.9% 17.7% 15.5% 18.5%
CY* n.a. 2.8 2.8 2.6 n.a. 14.9% 14.7% 14.4% n.a. 0.8 0.7 0.7 n.a. 29.1% 26.7% 26.1%
CZ 12.4 12.7 13.0 13.2 25.1% 25.8% 25.4% 26.0% 0.1 0.1 0.1 0.1 0.8% 0.7% 0.7% 0.6%
DE 176.5 170.1 172.3 173.0 30.7% 29.7% 29.6% 29.9% 1.2 1.0 1.0 0.8 0.7% 0.6% 0.6% 0.5%
DK 61.7 63.1 62.6 64.7 46.9% 45.4% 44.5% 47.5% 1.8 1.5 1.4 1.1 2.9% 2.3% 2.2% 1.7%
EE 3.0 3.0 2.8 3.0 31.1% 29.7% 30.9% 31.3% 0.0 0.0 0.0 0.0 0.6% 0.6% 0.4% 0.4%
ES 41.6 42.1 44.0 42.0 12.2% 12.4% 12.4% 12.6% 4.1 3.7 3.5 3.3 9.8% 8.8% 8.0% 7.9%
FI 45.0 46.1 46.0 47.8 47.1% 48.0% 47.3% 48.2% 0.3 0.3 0.3 0.3 0.6% 0.6% 0.7% 0.7%
FR 269.8 274.6 281.6 284.6 31.7% 31.8% 32.2% 32.1% 7.8 7.9 7.6 7.4 2.9% 2.9% 2.7% 2.6%
GB 125.6 126.8 124.5 128.3 24.6% 23.3% 23.9% 24.6% 1.9 2.1 2.3 2.4 1.5% 1.6% 1.8% 1.9%
GR 4.7 4.7 4.8 4.6 5.5% 5.5% 5.6% 5.7% 2.3 2.3 2.1 1.8 48.7% 47.9% 43.8% 39.7%
HR 1.3 1.3 1.2 1.2 10.1% 10.2% 9.2% 9.4% 0.3 0.3 0.2 0.2 21.9% 21.4% 17.2% 14.1%
HU 3.6 3.6 3.6 3.7 17.3% 16.9% 16.3% 16.9% 0.2 0.1 0.1 0.1 4.4% 3.3% 3.2% 3.0%
IE 13.4 14.1 13.5 13.4 18.7% 19.5% 18.1% 17.9% 2.5 2.1 1.6 1.4 18.6% 15.2% 11.5% 10.4%
IS 2.9 2.9 1.7 2.8 24.7% 24.4% 14.7% 23.6% 0.1 0.1 0.1 0.1 3.0% 3.2% 3.0% 2.6%
IT 62.7 61.8 65.0 64.1 12.7% 12.8% 12.4% 12.3% 18.1 17.4 17.9 16.5 28.9% 28.2% 27.6% 25.8%
LT 2.1 2.2 2.0 2.1 21.8% 21.7% 21.9% 21.8% 0.1 0.1 0.0 0.0 3.0% 2.4% 1.6% 1.5%
LU 34.8 36.1 36.6 37.5 33.9% 35.2% 35.5% 33.9% 0.3 0.2 0.2 0.3 0.8% 0.7% 0.7% 0.7%
LV 1.4 1.6 1.5 1.6 23.3% 24.2% 25.0% 25.5% 0.1 0.1 0.0 0.0 5.4% 4.6% 2.4% 2.6%
MT 0.6 0.6 0.6 0.6 8.6% 8.7% 8.7% 9.3% 0.0 0.0 0.0 0.0 7.0% 5.6% 6.3% 6.6%
NL 95.7 93.1 94.6 98.5 30.4% 29.4% 29.6% 30.2% 2.1 1.9 1.7 1.7 2.2% 2.0% 1.8% 1.7%
NO 44.3 45.7 46.4 45.2 38.6% 37.5% 37.3% 36.1% 0.3 0.3 0.3 0.2 0.6% 0.7% 0.6% 0.5%
PL 13.4 13.2 14.0 14.2 18.2% 17.5% 18.1% 18.2% 0.5 0.5 0.5 0.5 3.9% 3.7% 3.5% 3.3%
PT 7.9 7.9 8.0 8.0 11.2% 11.3% 11.2% 11.5% 1.7 1.6 1.5 1.3 20.9% 20.0% 18.8% 16.1%
RO 2.8 2.8 2.8 2.8 12.2% 12.3% 12.2% 11.9% 0.5 0.5 0.4 0.4 19.5% 17.4% 14.9% 14.5%
SE 134.6 133.9 133.7 131.2 60.9% 60.9% 60.3% 60.2% 0.1 0.1 0.1 0.2 0.1% 0.1% 0.1% 0.1%
SI 0.5 0.6 0.6 0.6 5.7% 7.1% 7.7% 7.9% 0.1 0.0 0.0 0.0 14.0% 8.8% 6.2% 5.8%
SK 3.9 4.0 4.1 4.1 17.4% 17.3% 17.6% 17.4% 0.2 0.2 0.1 0.1 4.7% 4.2% 3.0% 2.8%
EU / EEA 1,231.2 1,233.1 1,247.0 1,258.4 27.1% 26.8% 26.7% 27.0% 49.2 46.6 45.4 42.5 4.0% 3.8% 3.6% 3.4%
Memo item: Non-EU / EEA countries
216.3 223.6 227.0 236.7 13.8% 13.7% 13.8% 14.1% 3.1 3.1 3.2 3.6 1.4% 1.4% 1.4% 1.5%
Volumes bn EUR; %T12_1 T12_1 T12_1 T12_1 T12_2 T12_2 T12_2 T12_2 T12_3 T12_3 T12_3 T12_3 T12_4 T12_4 T12_4 T12_4201812 201903 201906 201909 201812 201903 201906 201909 201812 201903 201906 201909 201812 201903 201906 201909
By country of counterparty
Dec-18 Mar-19 Jun-19 Sep-19 Dec-18 Mar-19 Jun-19 Sep-19 Dec-18 Mar-19 Jun-19 Sep-19 Dec-18 Mar-19 Jun-19 Sep-19
AT 10.3 10.6 10.7 10.9 10.0% 10.2% 10.2% 10.3% 0.4 0.4 0.4 0.5 4.3% 4.1% 4.0% 4.3%
BE 18.0 17.9 18.6 18.7 10.7% 10.5% 10.7% 10.7% 0.6 0.7 0.7 0.7 3.6% 3.9% 3.7% 3.8%
BG 1.0 1.1 1.2 1.2 7.1% 6.6% 6.9% 6.8% 0.3 0.2 0.2 0.3 25.6% 20.7% 20.6% 22.7%
CY* n.a. 2.9 2.6 2.5 n.a. 15.0% 13.7% 13.7% n.a. 1.9 1.7 1.6 n.a. 65.7% 65.3% 63.1%
CZ 1.9 1.8 2.0 1.9 3.8% 3.7% 3.9% 3.7% 0.1 0.1 0.1 0.1 5.4% 5.6% 4.7% 4.5%
DE 24.3 23.7 24.6 24.7 4.2% 4.1% 4.2% 4.3% 0.6 0.6 0.6 0.6 2.7% 2.7% 2.4% 2.4%
DK 3.4 3.4 3.4 3.3 2.6% 2.5% 2.4% 2.4% 0.1 0.1 0.1 0.1 3.9% 3.5% 3.4% 3.8%
EE 0.3 0.3 0.2 0.3 2.6% 2.7% 2.6% 2.8% 0.0 0.0 0.0 0.0 2.2% 2.2% 1.1% 1.3%
ES 36.6 36.9 38.1 35.7 10.7% 10.9% 10.7% 10.7% 5.1 4.9 5.4 4.8 14.0% 13.3% 14.1% 13.4%
FI 4.1 4.2 4.1 4.6 4.3% 4.3% 4.2% 4.6% 0.1 0.1 0.1 0.2 3.0% 3.3% 3.5% 4.4%
FR 36.6 35.9 37.6 37.9 4.3% 4.2% 4.3% 4.3% 2.5 2.3 2.4 2.5 6.7% 6.5% 6.4% 6.5%
GB 29.6 31.4 30.3 30.0 5.8% 5.8% 5.8% 5.8% 1.8 1.5 1.5 1.3 6.1% 4.9% 5.0% 4.4%
GR 8.1 7.9 7.8 7.4 9.4% 9.2% 9.0% 9.1% 4.9 4.7 4.5 4.0 60.4% 60.2% 58.5% 53.6%
HR 1.3 1.2 1.2 1.2 9.5% 9.4% 9.3% 9.2% 0.3 0.3 0.2 0.2 21.9% 22.0% 17.6% 17.7%
HU 1.0 1.0 1.0 1.1 4.6% 4.7% 4.7% 4.9% 0.0 0.0 0.0 0.0 2.8% 2.2% 2.2% 2.1%
IE 2.0 2.1 2.1 2.1 2.8% 2.9% 2.8% 2.8% 0.4 0.4 0.2 0.2 21.9% 17.2% 10.5% 8.7%
IS 1.2 1.2 1.0 1.3 9.8% 10.3% 8.5% 11.1% 0.0 0.0 0.0 0.0 2.6% 2.0% 2.4% 2.9%
IT 46.5 46.2 50.2 49.3 9.4% 9.5% 9.6% 9.4% 19.4 19.0 20.5 19.4 41.6% 41.2% 40.9% 39.4%
LT 0.3 0.3 0.3 0.3 3.1% 3.2% 3.1% 3.2% 0.0 0.0 0.0 0.0 13.0% 11.0% 7.7% 8.8%
LU 2.4 2.6 2.4 2.5 2.3% 2.5% 2.3% 2.3% 0.1 0.1 0.1 0.1 4.1% 3.7% 3.5% 2.7%
LV 0.2 0.2 0.2 0.2 2.7% 2.9% 2.7% 2.9% 0.0 0.0 0.0 0.0 2.7% 3.7% 3.1% 2.4%
MT 0.3 0.3 0.3 0.2 4.2% 4.0% 3.6% 3.3% 0.1 0.1 0.1 0.1 34.0% 31.5% 32.1% 38.2%
NL 11.4 11.8 12.2 10.8 3.6% 3.7% 3.8% 3.3% 0.9 0.8 0.8 0.7 7.5% 6.7% 6.5% 6.8%
NO 11.2 12.6 13.0 12.7 9.7% 10.3% 10.4% 10.2% 0.1 0.1 0.1 0.1 1.1% 1.0% 1.1% 1.0%
PL 3.7 3.8 4.2 4.2 5.0% 5.0% 5.4% 5.4% 0.3 0.4 0.4 0.4 8.9% 11.9% 9.5% 9.4%
PT 8.4 8.4 8.3 8.0 12.0% 11.9% 11.5% 11.5% 2.9 2.8 2.5 2.2 34.8% 33.0% 29.8% 26.9%
RO 2.0 1.9 2.1 2.2 8.7% 8.5% 8.9% 9.2% 0.4 0.3 0.3 0.3 18.9% 18.1% 16.0% 15.0%
SE 5.8 5.9 5.6 5.7 2.6% 2.7% 2.5% 2.6% 0.1 0.1 0.0 0.1 1.1% 1.5% 0.7% 1.1%
SI 0.3 0.3 0.3 0.3 4.0% 4.3% 4.1% 4.0% 0.1 0.1 0.1 0.1 30.7% 27.2% 18.3% 17.5%
SK 1.0 1.1 1.1 1.1 4.5% 4.6% 4.8% 4.8% 0.1 0.1 0.1 0.1 7.5% 7.0% 6.5% 5.9%
EU / EEA 276.0 278.7 286.6 282.3 6.1% 6.1% 6.1% 6.1% 43.8 42.4 43.3 40.5 15.9% 15.2% 15.1% 14.4%
Memo item: Non-EU / EEA countries
52.5 54.0 53.4 55.6 3.3% 3.3% 3.2% 3.3% 4.0 4.1 3.8 4.2 7.6% 7.7% 7.2% 7.5%
Volumes bn EUR; %
Total exposures to Construction (NACE F) Non-performing exposures to Construction (NACE F)
Statistical AnnexExposures to Real Estate activities and Construction
In compliance with the Recommendation ESRB/2016/14 on closing real estate data gaps, the EBA is disclosing aggregated information on the exposures towards Non-financial corporations under Real Estate activities (NACE code L) and Construction Sector (NACE code F) (1) (2)
Total exposures to Real Estate activities (NACE L) Non-performing exposures to Real Estate activities (NACE L)
Gross carrying amount As % of Total of exposures to Non-financial corporations
Gross carrying amount NPL ratio
* To ensure confidentiality, figures by country are only disclosed if there are at least 3 institutions potentially reporting data, unless institutions provide explicit consent for the publication of country aggregates with less than 3 institutions.
Gross carrying amount As % of Total of exposures to Non-financial corporations
Gross carrying amount NPL ratio
(1) In disclosing aggregated information on the real estate (RE) exposures towards the different national RE markets in the Union, the EBA made use of information in regulatory reporting templates that provide a breakdown of credit exposures. RE exposures are identified as those referred to as both the NACE codes ‘F’ and ‘L’, although strictly speaking some sub-categories would need to be excluded following the Commercial Real Estate (CRE) definition adopted in the ESRB Recommendation.
(2) Data is country aggregated on the basis of the residence of the immediate counterparty. The information on the geographical distribution of exposures by country is reported by institutions where non-domestic original exposures in all ‘non-domestic’ countries in all exposures classes are equal or higher than 10 % of total domestic and non-domestic original exposures. For this purpose exposures shall be deemed to be domestic where they are exposures to counterparties located in the Member State where the institution is located.
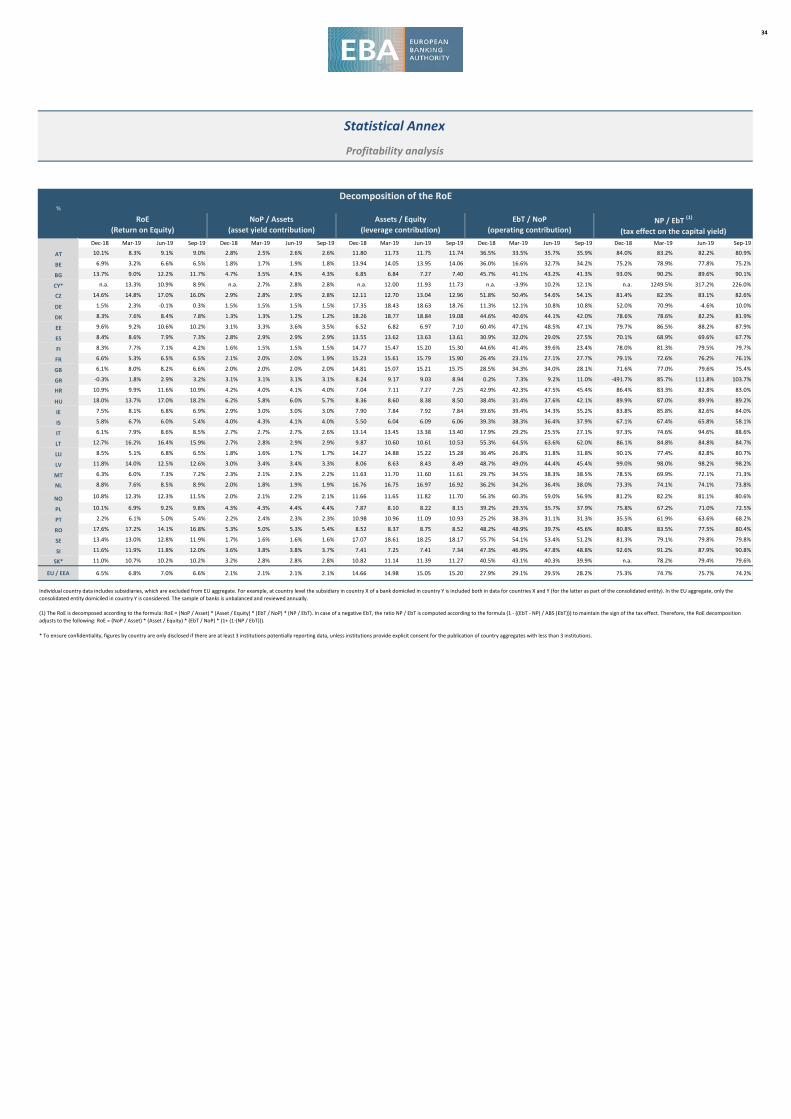
34
%
Dec-18 Mar-19 Jun-19 Sep-19 Dec-18 Mar-19 Jun-19 Sep-19 Dec-18 Mar-19 Jun-19 Sep-19 Dec-18 Mar-19 Jun-19 Sep-19 Dec-18 Mar-19 Jun-19 Sep-19
AT 10.1% 8.3% 9.1% 9.0% 2.8% 2.5% 2.6% 2.6% 11.80 11.73 11.75 11.74 36.5% 33.5% 35.7% 35.9% 84.0% 83.2% 82.2% 80.9%
BE 6.9% 3.2% 6.6% 6.5% 1.8% 1.7% 1.9% 1.8% 13.94 14.05 13.95 14.06 36.0% 16.6% 32.7% 34.2% 75.2% 78.9% 77.8% 75.2%
BG 13.7% 9.0% 12.2% 11.7% 4.7% 3.5% 4.3% 4.3% 6.85 6.84 7.27 7.40 45.7% 41.1% 43.2% 41.3% 93.0% 90.2% 89.6% 90.1%
CY* n.a. 13.3% 10.9% 8.9% n.a. 2.7% 2.8% 2.8% n.a. 12.00 11.93 11.73 n.a. -3.9% 10.2% 12.1% n.a. 1249.5% 317.2% 226.0%
CZ 14.6% 14.8% 17.0% 16.0% 2.9% 2.8% 2.9% 2.8% 12.11 12.70 13.04 12.96 51.8% 50.4% 54.6% 54.1% 81.4% 82.3% 83.1% 82.6%
DE 1.5% 2.3% -0.1% 0.3% 1.5% 1.5% 1.5% 1.5% 17.35 18.43 18.63 18.76 11.3% 12.1% 10.8% 10.8% 52.0% 70.9% -4.6% 10.0%
DK 8.3% 7.6% 8.4% 7.8% 1.3% 1.3% 1.2% 1.2% 18.26 18.77 18.84 19.08 44.6% 40.6% 44.1% 42.0% 78.6% 78.6% 82.2% 81.9%
EE 9.6% 9.2% 10.6% 10.2% 3.1% 3.3% 3.6% 3.5% 6.52 6.82 6.97 7.10 60.4% 47.1% 48.5% 47.1% 79.7% 86.5% 88.2% 87.9%
ES 8.4% 8.6% 7.9% 7.3% 2.8% 2.9% 2.9% 2.9% 13.55 13.62 13.63 13.61 30.9% 32.0% 29.0% 27.5% 70.1% 68.9% 69.6% 67.7%
FI 8.3% 7.7% 7.1% 4.2% 1.6% 1.5% 1.5% 1.5% 14.77 15.47 15.20 15.30 44.6% 41.4% 39.6% 23.4% 78.0% 81.3% 79.5% 79.7%
FR 6.6% 5.3% 6.5% 6.5% 2.1% 2.0% 2.0% 1.9% 15.23 15.61 15.79 15.90 26.4% 23.1% 27.1% 27.7% 79.1% 72.6% 76.2% 76.1%
GB 6.1% 8.0% 8.2% 6.6% 2.0% 2.0% 2.0% 2.0% 14.81 15.07 15.21 15.75 28.5% 34.3% 34.0% 28.1% 71.6% 77.0% 79.6% 75.4%
GR -0.3% 1.8% 2.9% 3.2% 3.1% 3.1% 3.1% 3.1% 8.24 9.17 9.03 8.94 0.2% 7.3% 9.2% 11.0% -491.7% 85.7% 111.8% 103.7%
HR 10.9% 9.9% 11.6% 10.9% 4.2% 4.0% 4.1% 4.0% 7.04 7.11 7.27 7.25 42.9% 42.3% 47.5% 45.4% 86.4% 83.3% 82.8% 83.0%
HU 18.0% 13.7% 17.0% 18.2% 6.2% 5.8% 6.0% 5.7% 8.36 8.60 8.38 8.50 38.4% 31.4% 37.6% 42.1% 89.9% 87.0% 89.9% 89.2%
IE 7.5% 8.1% 6.8% 6.9% 2.9% 3.0% 3.0% 3.0% 7.90 7.84 7.92 7.84 39.6% 39.4% 34.3% 35.2% 83.8% 85.8% 82.6% 84.0%
IS 5.8% 6.7% 6.0% 5.4% 4.0% 4.3% 4.1% 4.0% 5.50 6.04 6.09 6.06 39.3% 38.3% 36.4% 37.9% 67.1% 67.4% 65.8% 58.1%
IT 6.1% 7.9% 8.6% 8.5% 2.7% 2.7% 2.7% 2.6% 13.14 13.45 13.38 13.40 17.9% 29.2% 25.5% 27.1% 97.3% 74.6% 94.6% 88.6%
LT 12.7% 16.2% 16.4% 15.9% 2.7% 2.8% 2.9% 2.9% 9.87 10.60 10.61 10.53 55.3% 64.5% 63.6% 62.0% 86.1% 84.8% 84.8% 84.7%
LU 8.5% 5.1% 6.8% 6.5% 1.8% 1.6% 1.7% 1.7% 14.27 14.88 15.22 15.28 36.4% 26.8% 31.8% 31.8% 90.1% 77.4% 82.8% 80.7%
LV 11.8% 14.0% 12.5% 12.6% 3.0% 3.4% 3.4% 3.3% 8.06 8.63 8.43 8.49 48.7% 49.0% 44.4% 45.4% 99.0% 98.0% 98.2% 98.2%
MT 6.3% 6.0% 7.3% 7.2% 2.3% 2.1% 2.3% 2.2% 11.63 11.70 11.60 11.61 29.7% 34.5% 38.3% 38.5% 78.5% 69.9% 72.1% 71.3%
NL 8.8% 7.6% 8.5% 8.9% 2.0% 1.8% 1.9% 1.9% 16.76 16.75 16.97 16.92 36.2% 34.2% 36.4% 38.0% 73.3% 74.1% 74.1% 73.8%
NO 10.8% 12.3% 12.3% 11.5% 2.0% 2.1% 2.2% 2.1% 11.66 11.65 11.82 11.70 56.3% 60.3% 59.0% 56.9% 81.2% 82.2% 81.1% 80.6%
PL 10.1% 6.9% 9.2% 9.8% 4.3% 4.3% 4.4% 4.4% 7.87 8.10 8.22 8.15 39.2% 29.5% 35.7% 37.9% 75.8% 67.2% 71.0% 72.5%
PT 2.2% 6.1% 5.0% 5.4% 2.2% 2.4% 2.3% 2.3% 10.98 10.96 11.09 10.93 25.2% 38.3% 31.1% 31.3% 35.5% 61.9% 63.6% 68.2%
RO 17.6% 17.2% 14.1% 16.8% 5.3% 5.0% 5.3% 5.4% 8.52 8.37 8.75 8.52 48.2% 48.9% 39.7% 45.6% 80.8% 83.5% 77.5% 80.4%
SE 13.4% 13.0% 12.8% 11.9% 1.7% 1.6% 1.6% 1.6% 17.07 18.61 18.25 18.17 55.7% 54.1% 53.4% 51.2% 81.3% 79.1% 79.8% 79.8%
SI 11.6% 11.9% 11.8% 12.0% 3.6% 3.8% 3.8% 3.7% 7.41 7.25 7.41 7.34 47.3% 46.9% 47.8% 48.8% 92.6% 91.2% 87.9% 90.8%
SK* 11.0% 10.7% 10.2% 10.2% 3.2% 2.8% 2.8% 2.8% 10.82 11.14 11.39 11.27 40.5% 43.1% 40.3% 39.9% n.a. 78.2% 79.4% 79.6%
EU / EEA 6.5% 6.8% 7.0% 6.6% 2.1% 2.1% 2.1% 2.1% 14.66 14.98 15.05 15.20 27.9% 29.1% 29.5% 28.2% 75.3% 74.7% 75.7% 74.2%
* To ensure confidentiality, figures by country are only disclosed if there are at least 3 institutions potentially reporting data, unless institutions provide explicit consent for the publication of country aggregates with less than 3 institutions.
Individual country data includes subsidiaries, which are excluded from EU aggregate. For example, at country level the subsidiary in country X of a bank domiciled in country Y is included both in data for countries X and Y (for the latter as part of the consolidated entity). In the EU aggregate, only the consolidated entity domiciled in country Y is considered. The sample of banks is unbalanced and reviewed annually.
(1) The RoE is decomposed according to the formula: RoE = (NoP / Asset) * (Asset / Equity) * (EbT / NoP) * (NP / EbT). In case of a negative EbT, the ratio NP / EbT is computed according to the formula (1 - ((EbT - NP) / ABS (EbT))) to maintain the sign of the tax effect. Therefore, the RoE decomposition adjusts to the following: RoE = (NoP / Asset) * (Asset / Equity) * (EbT / NoP) * (1+ (1-(NP / EbT))).
Statistical Annex
Profitability analysis
Decomposition of the RoE
RoE(Return on Equity)
NoP / Assets (asset yield contribution)
Assets / Equity(leverage contribution)
EbT / NoP(operating contribution)
NP / EbT (1)
(tax effect on the capital yield)
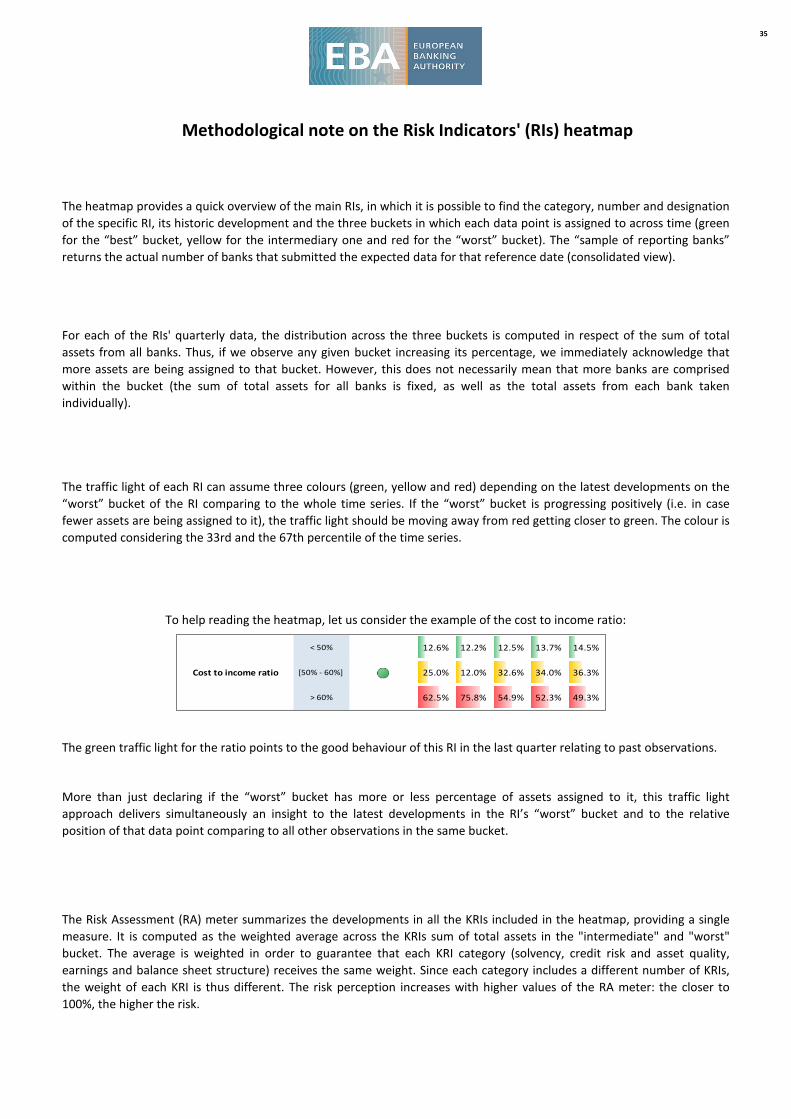
35
Methodological note on the Risk Indicators' (RIs) heatmap
The heatmap provides a quick overview of the main RIs, in which it is possible to find the category, number and designationof the specific RI, its historic development and the three buckets in which each data point is assigned to across time (greenfor the “best” bucket, yellow for the intermediary one and red for the “worst” bucket). The “sample of reporting banks”returns the actual number of banks that submitted the expected data for that reference date (consolidated view).
For each of the RIs' quarterly data, the distribution across the three buckets is computed in respect of the sum of totalassets from all banks. Thus, if we observe any given bucket increasing its percentage, we immediately acknowledge thatmore assets are being assigned to that bucket. However, this does not necessarily mean that more banks are comprisedwithin the bucket (the sum of total assets for all banks is fixed, as well as the total assets from each bank takenindividually).
The traffic light of each RI can assume three colours (green, yellow and red) depending on the latest developments on the“worst” bucket of the RI comparing to the whole time series. If the “worst” bucket is progressing positively (i.e. in casefewer assets are being assigned to it), the traffic light should be moving away from red getting closer to green. The colour iscomputed considering the 33rd and the 67th percentile of the time series.
To help reading the heatmap, let us consider the example of the cost to income ratio:
The green traffic light for the ratio points to the good behaviour of this RI in the last quarter relating to past observations.
More than just declaring if the “worst” bucket has more or less percentage of assets assigned to it, this traffic lightapproach delivers simultaneously an insight to the latest developments in the RI’s “worst” bucket and to the relativeposition of that data point comparing to all other observations in the same bucket.
The Risk Assessment (RA) meter summarizes the developments in all the KRIs included in the heatmap, providing a singlemeasure. It is computed as the weighted average across the KRIs sum of total assets in the "intermediate" and "worst"bucket. The average is weighted in order to guarantee that each KRI category (solvency, credit risk and asset quality,earnings and balance sheet structure) receives the same weight. Since each category includes a different number of KRIs,the weight of each KRI is thus different. The risk perception increases with higher values of the RA meter: the closer to100%, the higher the risk.
< 50% 12.6% 12.2% 12.5% 13.7% 14.5%
[50% - 60%] 25.0% 12.0% 32.6% 34.0% 36.3%
> 60% 62.5% 75.8% 54.9% 52.3% 49.3%
Cost to income ratio
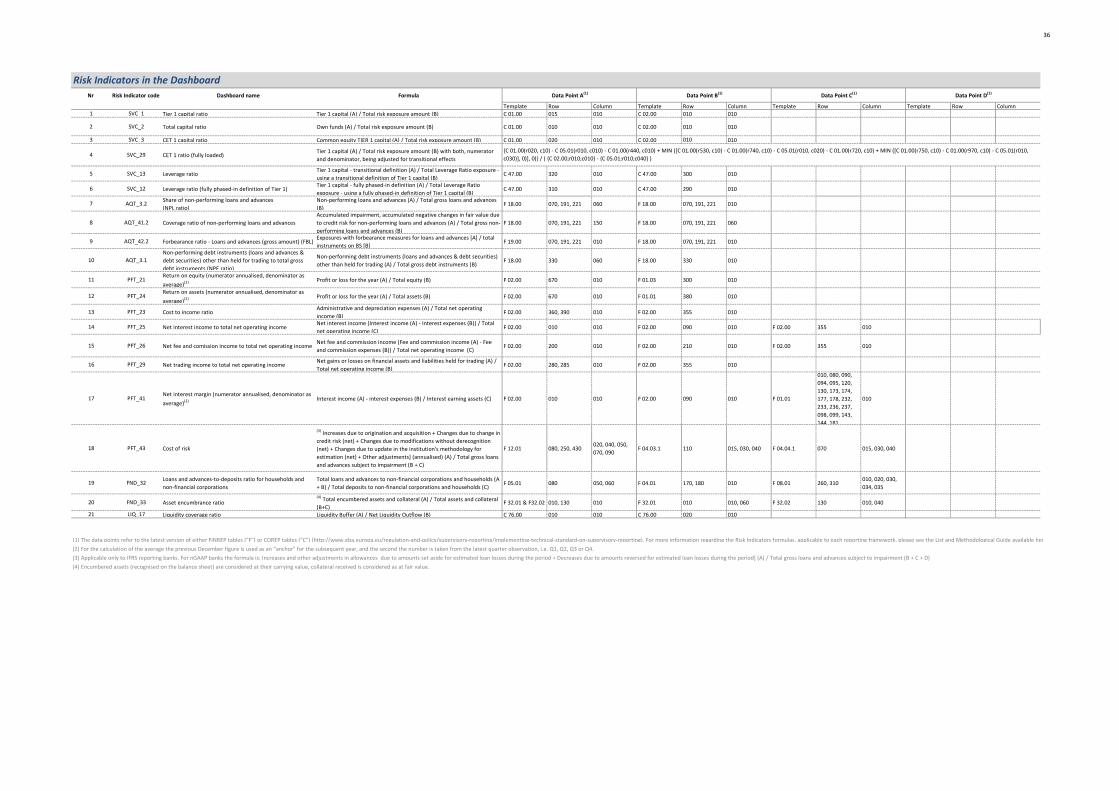
36
aRisk Indicators in the DashboardNr Risk Indicator code Dashboard name Formula
Template Row Column Template Row Column Template Row Column Template Row Column1 SVC_1 Tier 1 capital ratio Tier 1 capital (A) / Total risk exposure amount (B) C 01.00 015 010 C 02.00 010 010
2 SVC_2 Total capital ratio Own funds (A) / Total risk exposure amount (B) C 01.00 010 010 C 02.00 010 010
3 SVC_3 CET 1 capital ratio Common equity TIER 1 capital (A) / Total risk exposure amount (B) C 01.00 020 010 C 02.00 010 010
4 SVC_29 CET 1 ratio (fully loaded)Tier 1 capital (A) / Total risk exposure amount (B) with both, numerator and denominator, being adjusted for transitional effects
5 SVC_13 Leverage ratioTier 1 capital - transitional definition (A) / Total Leverage Ratio exposure - using a transitional definition of Tier 1 capital (B)
C 47.00 320 010 C 47.00 300 010
6 SVC_12 Leverage ratio (fully phased-in definition of Tier 1)Tier 1 capital - fully phased-in definition (A) / Total Leverage Ratio exposure - using a fully phased-in definition of Tier 1 capital (B)
C 47.00 310 010 C 47.00 290 010
7 AQT_3.2 Share of non-performing loans and advances(NPL ratio)
Non-performing loans and advances (A) / Total gross loans and advances (B)
F 18.00 070, 191, 221 060 F 18.00 070, 191, 221 010
8 AQT_41.2 Coverage ratio of non-performing loans and advancesAccumulated impairment, accumulated negative changes in fair value due to credit risk for non-performing loans and advances (A) / Total gross non-performing loans and advances (B)
F 18.00 070, 191, 221 150 F 18.00 070, 191, 221 060
9 AQT_42.2 Forbearance ratio - Loans and advances (gross amount) (FBL)Exposures with forbearance measures for loans and advances [A] / total instruments on BS [B]
F 19.00 070, 191, 221 010 F 18.00 070, 191, 221 010
10 AQT_3.1Non-performing debt instruments (loans and advances & debt securities) other than held for trading to total gross debt instruments (NPE ratio)
Non-performing debt instruments (loans and advances & debt securities) other than held for trading (A) / Total gross debt instruments (B)
F 18.00 330 060 F 18.00 330 010
11 PFT_21Return on equity (numerator annualised, denominator as average)(2) Profit or loss for the year (A) / Total equity (B) F 02.00 670 010 F 01.03 300 010
12 PFT_24Return on assets (numerator annualised, denominator as average)(2) Profit or loss for the year (A) / Total assets (B) F 02.00 670 010 F 01.01 380 010
13 PFT_23 Cost to income ratioAdministrative and depreciation expenses (A) / Total net operating income (B)
F 02.00 360, 390 010 F 02.00 355 010
14 PFT_25 Net interest income to total net operating incomeNet interest income (Interest income (A) - Interest expenses (B)) / Total net operating income (C)
F 02.00 010 010 F 02.00 090 010 F 02.00 355 010
15 PFT_26 Net fee and comission income to total net operating incomeNet fee and commission income (Fee and commission income (A) - Fee and commission expenses (B)) / Total net operating income (C)
F 02.00 200 010 F 02.00 210 010 F 02.00 355 010
16 PFT_29 Net trading income to total net operating incomeNet gains or losses on financial assets and liabilities held for trading (A) / Total net operating income (B)
F 02.00 280, 285 010 F 02.00 355 010
17 PFT_41Net interest margin (numerator annualised, denominator as average)(2) Interest income (A) - interest expenses (B) / Interest earning assets (C) F 02.00 010 010 F 02.00 090 010 F 01.01
010, 080, 090, 094, 095, 120, 130, 173, 174, 177, 178, 232, 233, 236, 237, 098, 099, 143, 144, 181
010
18 PFT_43 Cost of risk
(3) Increases due to origination and acquisition + Changes due to change in credit risk (net) + Changes due to modifications without derecognition (net) + Changes due to update in the institution's methodology for estimation (net) + Other adjustments] (annualised) (A) / Total gross loans and advances subject to impairment (B + C)
F 12.01 080, 250, 430020, 040, 050, 070, 090
F 04.03.1 110 015, 030, 040 F 04.04.1 070 015, 030, 040
19 FND_32 Loans and advances-to-deposits ratio for households and non-financial corporations
Total loans and advances to non-financial corporations and households (A + B) / Total deposits to non-financial corporations and households (C)
F 05.01 080 050, 060 F 04.01 170, 180 010 F 08.01 260, 310010, 020, 030, 034, 035
20 FND_33 Asset encumbrance ratio(4) Total encumbered assets and collateral (A) / Total assets and collateral (B+C)
F 32.01 & F32.02 010, 130 010 F 32.01 010 010, 060 F 32.02 130 010, 040
21 LIQ_17 Liquidity coverage ratio Liquidity Buffer (A) / Net Liquidity Outflow (B) C 76.00 010 010 C 76.00 020 010
(1) The data points refer to the latest version of either FINREP tables ("F") or COREP tables ("C") (http://www.eba.europa.eu/regulation-and-policy/supervisory-reporting/implementing-technical-standard-on-supervisory-reporting). For more information regarding the Risk Indicators formulas, applicable to each reporting framework, please see the List and Methodological Guide available her (2) For the calculation of the average the previous December figure is used as an “anchor” for the subsequent year, and the second the number is taken from the latest quarter observation, i.e. Q1, Q2, Q3 or Q4.(3) Applicable only to IFRS reporting banks. For nGAAP banks the formula is: Increases and other adjustments in allowances due to amounts set aside for estimated loan losses during the period + Decreases due to amounts reversed for estimated loan losses during the period] (A) / Total gross loans and advances subject to impairment (B + C + D)(4) Encumbered assets (recognised on the balance sheet) are considered at their carrying value, collateral received is considered as at fair value.
Data Point A(1) Data Point B(1) Data Point D(1)
{C 01.00(r020, c10) - C 05.01(r010, c010) - C 01.00(r440, c010) + MIN ([C 01.00(r530, c10) - C 01.00(r740, c10) - C 05.01(r010, c020) - C 01.00(r720, c10) + MIN ([C 01.00(r750, c10) - C 01.00(r970, c10) - C 05.01(r010, c030)], 0)], 0)} / ( {C 02.00;r010;c010} - {C 05.01;r010;c040} )
Data Point C(1)
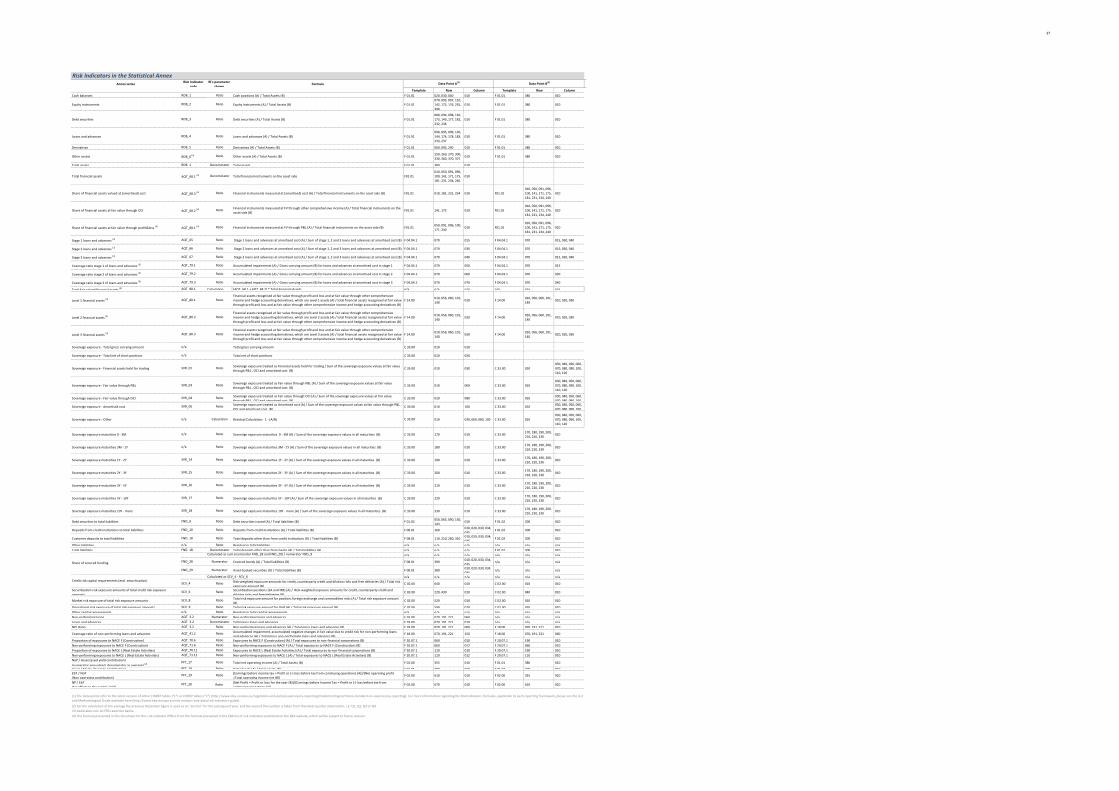
37
Risk Indicators in the Statistical AnnexAnnex series Risk Indicator
codeRI's parameter
shownFormula
Template Row Column Template Row ColumnCash balances RDB_1 Ratio Cash positions (A) / Total Assets (B) F 01.01 020, 030, 040 010 F 01.01 380 010
Equity instruments RDB_2 Ratio Equity instruments (A) / Total Assets (B) F 01.01070, 093, 097, 110, 142, 172, 176, 235, 390
010 F 01.01 380 010
Debt securities RDB_3 Ratio Debt securities (A) / Total Assets (B) F 01.01080, 094, 098, 120, 173, 143 ,177, 182, 232, 236
010 F 01.01 380 010
Loans and advances RDB_4 Ratio Loans and advances (A) / Total Assets (B) F 01.01090, 095, 099, 130, 144, 174, 178, 183, 233, 237
010 F 01.01 380 010
Derivatives RDB_5 Ratio Derivatives (A) / Total Assets (B) F 01.01 060, 092, 240 010 F 01.01 380 010
Other assets RDB_6 (4) Ratio Other assets (A) / Total Assets (B) F 01.01250, 260, 270, 300, 330, 360, 370, 375
010 F 01.01 380 010
Total assets RDB_1 Denominator Total assets F 01.01 380 010
Total financial assets AQT_68.1 (4) Denominator Total financial instruments on the asset side F01.01010, 050, 091, 096, 100, 141, 171, 175, 181, 231, 234, 240
010
Share of financial assets valued at (amortised) cost AQT_68.3 (4) Ratio Financial instruments measured at (amortised) cost (A) / Total financial instruments on the asset side (B) F01.01 010, 181, 231, 234 010 F01.01010, 050, 091, 096, 100, 141, 171, 175, 181, 231, 234, 240
010
Share of financial assets at fair value through OCI AQT_68.2 (4) Ratio Financial instruments measured at FV through other comprehensive income (A) / Total financial instruments on the asset side (B)
F01.01 141, 175 010 F01.01010, 050, 091, 096, 100, 141, 171, 175, 181, 231, 234, 240
010
Share of financial assets at fair value through profit&loss (3) AQT_68.1 (4) Ratio Financial instruments measured at FV through P&L (A) / Total financial instruments on the asset side (B) F01.01050, 091, 096, 100, 171, 240
010 F01.01010, 050, 091, 096, 100, 141, 171, 175, 181, 231, 234, 240
010
Stage 1 loans and advances (3) AQT_65 Ratio Stage 1 loans and advances at amortised cost (A) / Sum of stage 1, 2 and 3 loans and advances at amortised cost (B) F 04.04.1 070 015 F 04.04.1 070 015, 030, 040
Stage 2 loans and advances (3) AQT_66 Ratio Stage 2 loans and advances at amortised cost (A) / Sum of stage 1, 2 and 3 loans and advances at amortised cost (B) F 04.04.1 070 030 F 04.04.1 070 015, 030, 040
Stage 3 loans and advances (3) AQT_67 Ratio Stage 3 loans and advances at amortised cost (A) / Sum of stage 1, 2 and 3 loans and advances at amortised cost (B) F 04.04.1 070 040 F 04.04.1 070 015, 030, 040
Coverage ratio stage 1 of loans and advances (3) AQT_79.1 Ratio Accumulated impairments (A) / Gross carrying amount (B) for loans and advances at amortised cost in stage 1 F 04.04.1 070 050 F 04.04.1 070 015
Coverage ratio stage 2 of loans and advances (3) AQT_79.2 Ratio Accumulated impairments (A) / Gross carrying amount (B) for loans and advances at amortised cost in stage 2 F 04.04.1 070 060 F 04.04.1 070 030
Coverage ratio stage 3 of loans and advances (3) AQT_79.3 Ratio Accumulated impairments (A) / Gross carrying amount (B) for loans and advances at amortised cost in stage 3 F 04.04.1 070 070 F 04.04.1 070 040
Total fair valued financial assets (3) AQT_80.1 Calculation (AQT_68.1 + AQT_68.2) * Total Financial Assets n/a n/a n/a n/a n/a n/a
Level 1 financial assets (3) AQT_80.1 RatioFinancial assets recognised at fair value through profit and loss and at fair value through other comprehensive income and hedge accounting derivatives, which are Level 1 assets (A) / total financial assets recognised at fair value through profit and loss and at fair value through other comprehensive income and hedge accounting derivatives (B)
F 14.00010, 056, 060, 101, 140
010 F 14.00010, 056, 060, 101, 140
010, 020, 030
Level 2 financial assets (3) AQT_80.2 RatioFinancial assets recognised at fair value through profit and loss and at fair value through other comprehensive income and hedge accounting derivatives, which are Level 2 assets (A) / total financial assets recognised at fair value through profit and loss and at fair value through other comprehensive income and hedge accounting derivatives (B)
F 14.00010, 056, 060, 101, 140
020 F 14.00010, 056, 060, 101, 140
010, 020, 030
Level 3 financial assets (3) AQT_80.3 RatioFinancial assets recognised at fair value through profit and loss and at fair value through other comprehensive income and hedge accounting derivatives, which are Level 3 assets (A) / total financial assets recognised at fair value through profit and loss and at fair value through other comprehensive income and hedge accounting derivatives (B)
F 14.00010, 056, 060, 101, 140
030 F 14.00010, 056, 060, 101, 140
010, 020, 030
Sovereign exposure - Total gross carrying amount n/a Total gross carrying amount C 33.00 010 010
Sovereign exposure - Total net of short positions n/a Total net of short positions C 33.00 010 020
Sovereign exposure - Financial assets held for trading SVR_01 Ratio Sovereign exposure treated as Financial assets held for trading / Sum of the sovereign exposure values at fair value through P&L , OCI and amortised cost (B)
C 33.00 010 030 C 33.00 010030, 040, 050, 060, 070, 080, 090, 100, 110, 120
Sovereign exposure - Fair value through P&L SVR_03 Ratio Sovereign exposure treated as Fair value through P&L (A) / Sum of the sovereign exposure values at fair value through P&L , OCI and amortised cost (B)
C 33.00 010 060 C 33.00 010030, 040, 050, 060, 070, 080, 090, 100, 110, 120
Sovereign exposure - Fair value through OCI SVR_04 Ratio Sovereign exposure treated as Fair value through OCI (A) / Sum of the sovereign exposure values at fair value through P&L , OCI and amortised cost (B)
C 33.00 010 080 C 33.00 010 030, 040, 050, 060, 070, 080, 090, 100,
Sovereign exposure - Amortised cost SVR_05 Ratio Sovereign exposure treated as Amortised cost (A) / Sum of the sovereign exposure values at fair value through P&L , OCI and amortised cost (B)
C 33.00 010 100 C 33.00 010 030, 040, 050, 060, 070, 080, 090, 100,
Sovereign exposure - Other n/a Calculation Residual Calculation: 1 - (A/B) C 33.00 010 030, 060, 080, 100 C 33.00 010030, 040, 050, 060, 070, 080, 090, 100, 110, 120
Sovereign exposure maturities 0 - 3M n/a Ratio Sovereign exposure maturities 0 - 3M (A) / Sum of the sovereign exposure values in all maturities (B) C 33.00 170 010 C 33.00170, 180, 190, 200, 210, 220, 230
010
Sovereign exposure maturities 3M - 1Y n/a Ratio Sovereign exposure maturities 3M - 1Y (A) / Sum of the sovereign exposure values in all maturities (B) C 33.00 180 010 C 33.00170, 180, 190, 200, 210, 220, 230
010
Sovereign exposure maturities 1Y - 2Y SVR_14 Ratio Sovereign exposure maturities 1Y - 2Y (A) / Sum of the sovereign exposure values in all maturities (B) C 33.00 190 010 C 33.00170, 180, 190, 200, 210, 220, 230
010
Sovereign exposure maturities 2Y - 3Y SVR_15 Ratio Sovereign exposure maturities 2Y - 3Y (A) / Sum of the sovereign exposure values in all maturities (B) C 33.00 200 010 C 33.00170, 180, 190, 200, 210, 220, 230
010
Sovereign exposure maturities 3Y - 5Y SVR_16 Ratio Sovereign exposure maturities 3Y - 5Y (A) / Sum of the sovereign exposure values in all maturities (B) C 33.00 210 010 C 33.00170, 180, 190, 200, 210, 220, 230
010
Sovereign exposure maturities 5Y - 10Y SVR_17 Ratio Sovereign exposure maturities 5Y - 10Y (A) / Sum of the sovereign exposure values in all maturities (B) C 33.00 220 010 C 33.00170, 180, 190, 200, 210, 220, 230
010
Sovereign exposure maturities 10Y - more SVR_18 Ratio Sovereign exposure maturities 10Y - more (A) / Sum of the sovereign exposure values in all maturities (B) C 33.00 230 010 C 33.00170, 180, 190, 200, 210, 220, 230
010
Debt securities to total liabilities FND_9 Ratio Debt securities issued (A) / Total liabilities (B) F 01.02 050, 065, 090, 130, 143
010 F 01.02 300 010
Deposits from credit institutions to total liabilities FND_10 Ratio Deposits from credit institutions (A) / Total liabilities (B) F 08.01 160 010, 020, 030, 034, 035
F 01.02 300 010
Customer deposits to total liabilities FND_18 Ratio Total deposits other than from credit institutions (A) / Total liabilities (B) F 08.01 110, 210, 260, 310 010, 020, 030, 034, 035
F 01.02 300 010
Other liabilities n/a Ratio Residual in total liabilities n/a n/a n/a n/a n/a n/aTotal liabilities FND_18 Denominator Total deposits other than from banks (A) / Total liabilities (B) n/a n/a n/a F 01.02 300 010
n/a n/a n/a n/a n/a n/a
FND_28 Numerator Covered bonds (A) / Total liabilities (B) F 08.01 390 010, 020, 030, 034, 035
n/a n/a n/a
FND_29 Numerator Asset-backed securities (A) / Total liabilities (B) F 08.01 380 010, 020, 030, 034, 035
n/a n/a n/a
Calculated as SCV_4 - SCV_6 n/a n/a n/a n/a n/a n/a
SCV_4 Ratio Risk-weighted exposure amounts for credit, counterparty credit and dilution risks and free deliveries (A) / Total risk exposure amount (B)
C 02.00 040 010 C 02.00 010 010
Securitisation risk exposure amounts of total credit risk exposure amounts
SCV_6 Ratio Securitisation positions (SA and IRB) (A) / Risk-weighted exposure amounts for credit, counterparty credit and dilution risks and free deliveries (B)
C 02.00 220, 430 010 C 02.00 040 010
Market risk exposure of total risk exposure amounts SCV_8 Ratio Total risk exposure amount for position, foreign exchange and commodities risks (A) / Total risk exposure amount (B)
C 02.00 520 010 C 02.00 010 010
Operational risk exposure of total risk exposure amounts SCV_9 Ratio Total risk exposure amount for OpR (A) / Total risk exposure amount (B) C 02.00 590 010 C 02.00 010 010Other capital requirements n/a Ratio Residual in total capital requirements n/a n/a n/a n/a n/a n/aNon-performing loans AQT_3.2 Numerator Non-performing loans and advances F 18.00 070, 191, 221 060 n/a n/a n/aLoans and advances AQT_3.2 Denominator Total gross loans and advances F 18.00 070, 191, 221 010 n/a n/a n/aNPL Ratio AQT_3.2 Ratio Non-performing loans and advances (A) / Total gross loans and advances (B) F 18.00 070, 191, 221 060 F 18.00 070, 191, 221 010
Coverage ratio of non-performing loans and advances AQT_41.2 Ratio Accumulated impairment, accumulated negative changes in fair value due to credit risk for non-performing loans and advances (A) / Total gross non-performing loans and advances (B)
F 18.00 070, 191, 221 150 F 18.00 070, 191, 221 060
Proportion of exposures to NACE F (Construction) AQT_70.6 Ratio Exposures to NACE F (Construction) (A) / Total exposures to non-financial corporations (B) F 20.07.1 060 010 F 20.07.1 190 010Non-performing exposures to NACE F (Construction) AQT_71.6 Ratio Non-performing exposures to NACE F (A) / Total exposures to NACE F (Construction) (B) F 20.07.1 060 012 F 20.07.1 060 010Proportion of exposures to NACE L (Real Estate Activities) AQT_70.11 Ratio Exposures to NACE L (Real Estate Activities) (A) / Total exposures to non-financial corporations (B) F 20.07.1 110 010 F 20.07.1 190 010Non-performing exposures to NACE L (Real Estate Activities) AQT_71.11 Ratio Non-performing exposures to NACE L (A) / Total exposures to NACE L (Real Estate Activities) (B) F 20.07.1 110 012 F 20.07.1 110 010NoP / Asset (asset yield contribution)(numerator annualised, denominator as average) (2) PFT_17 Ratio Total net operating income (A) / Total Assets (B) F 02.00 355 010 F 01.01 380 010
Asset / Equity (leverage contribution) PFT 18 Ratio Total Assets (A) / Total equity (B) F 01 01 380 010 F 01 03 300 010EbT / NoP(Non operating contribution)
PFT_19 Ratio [Earnings before income tax = Profit or (-) loss before tax from continuing operations (A)]/[Net operating profit =Total operating income net (B)]
F 02.00 610 010 F 02.00 355 010
NP / EbT(tax effect on the capital yield)
PFT_20 Ratio [Net Profit = Profit or loss for the year (B)]/[Earnings before Income Tax = Profit or (-) loss before tax from continuing operations (A)]
F 02.00 670 010 F 02.00 610 010
(2) For the calculation of the average the previous December figure is used as an “anchor” for the subsequent year, and the second the number is taken from the latest quarter observation, i.e. Q1, Q2, Q3 or Q4.(3) Applicable only to IFRS reporting banks.(4) The formula presented in this document for this risk indicator differs from the formula presented in the EBA list of risk indicators published on the EBA website, which will be subject to future revision.
(1) The data points refer to the latest version of either FINREP tables ("F") or COREP tables ("C") (http://www.eba.europa.eu/regulation-and-policy/supervisory-reporting/implementing-technical-standard-on-supervisory-reporting). For more information regarding the Risk Indicators formulas, applicable to each reporting framework, please see the List and Methodological Guide available here (http://www.eba.europa.eu/risk-analysis-and-data/risk-indicators-guide).
Credit risk capital requirements (excl. securitisation)
Data Point A(1) Data Point B(1)
Share of secured funding
Calculated as sum (numerator FND_28 and FND_29) / numerator FND_9

38
1
Department Economic Analysis and Statistics (EAS)
European Banking Authority
Floor 27, Tour Europlaza 20, Avenue André-Prothin 92927 Paris La Défense France