Embed Size (px)
Citation preview
Erratum
Integrating dynamic energy budget (DEB) theory with traditional bioenergetic models
R. M. Nisbet, M. Jusup, T. Klanjscek and L. Pecquerie10.1242/jeb.071845
There was an error published in the online (Full Text and PDF) version of J. Exp. Biol. 215, 892-902.
In Table 3 (p. 896), a typographical error was introduced into Eqns A3 and A4 during the production process. The correct version is givenbelow.
We apologise to all authors and readers for any inconvenience caused.
This error does not occur in the print version of this article.
© 2012. Published by The Company of Biologists Ltd
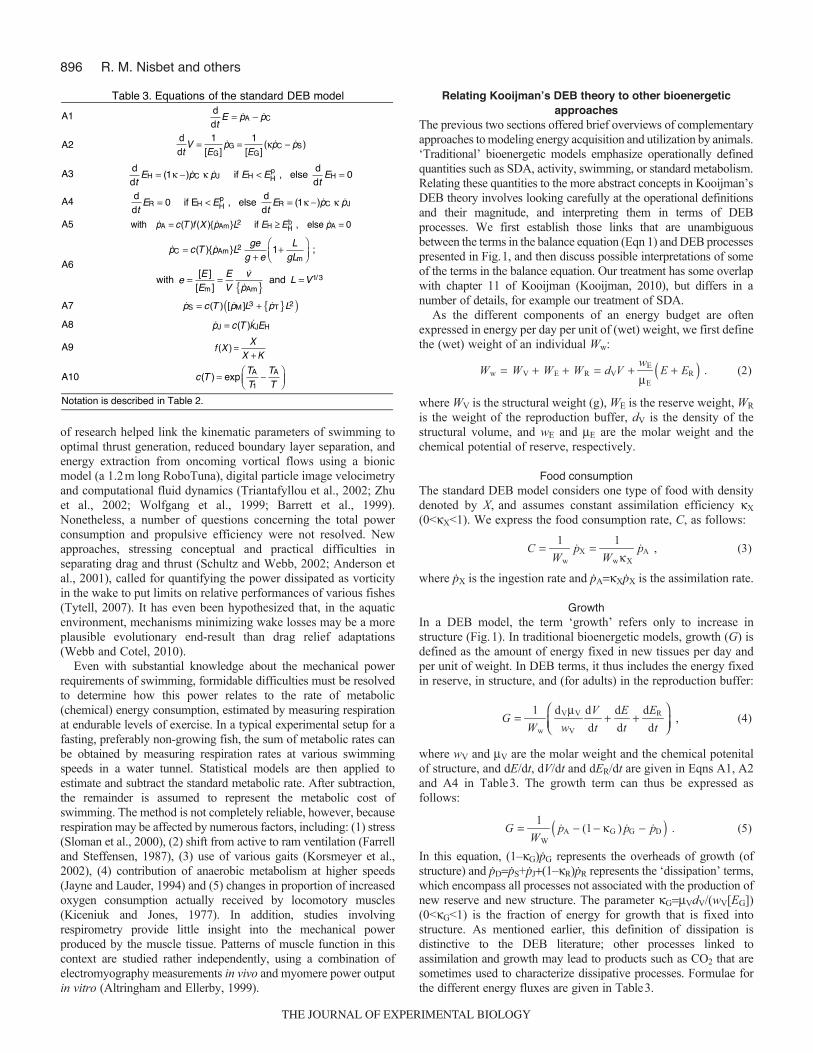
Table 3. Equations of the standard DEB model
A1
ddtE = pA pC
A2
ddtV =
1[EG]
pG =1
[EG]( pC pS)
A3
ddtEH = (1 )pC pJ if EH <EH
p , else ddtEH = 0
A4
ddtER = 0 if EH <EH
p , else ddtER = (1 )pC pJ
A5 with pA = c(T )f (X ){pAm}L2 if EH EH
b , else pA = 0
A6 pC = c(T ){pAm}L2 ge
g + e1+
LgLm
;
with e =
[E ][Em]
=EV
vpAm{ } and L =V1/3
A7 pS = c(T ) [pM]L3 + pT{ }L2( )
A8 pJ = c(T )kJEH
A9 f (X ) =X
X +K
A10 c(T ) = expTA
T1
TA
T
Notation is described in Table 2.
892
IntroductionEmpiricism alone does not offer a practical way to understand howenvironmental change impacts the physiology and viability oforganisms. This is for three distinct reasons. First, there is anoverwhelming number of different organism–environmentcombinations to consider, including many for which experimentationis impractical, prohibitively expensive, or unethical. Second,experimental studies yield information that is restricted to specificaspects of some system, with extrapolation to new contexts, andpossibly entirely novel conditions, requiring verbal, statistical ormechanistic theory. Third, we know that climate change is likely toalter the frequency of extremes, and thus the time history of events;as a consequence, measurements that characterize average conditionsand/or currently observed levels of variability have limited predictivevalue. This paper focuses on dynamic, mechanistic theory based ongeneral biological principles that can help integrate bioenergeticinformation from experiments and field studies involving differentcombinations of organism and environment, and thereby helpcontribute to predictions for new situations.
There is a long tradition of simple bioenergetic models inecology. Ecologists use bioenergetic models to address questionsat single levels of biological organization – physiological andbehavioral properties of individual organisms, population andcommunity dynamics, or ecosystem processes – but models withbioenergetic components can also relate processes at differentlevels of organization (Brown et al., 2004; Nisbet et al., 2000). Forinstance, recent work has shown that energetic constraints may inpart determine how a species’ niche responds to environmental
change (Buckley et al., 2008; Buckley et al., 2010; Kearney et al.,2010; Kearney et al., 2012).
‘Traditional’ bioenergetic models of individual animals describeenergy acquisition from feeding, and its partitioning amongprocesses such as growth, reproduction, respiration, excretion andactivity. These processes are commonly defined operationally; forexample, growth and reproduction may be measured directly andconverted to energy units, activity may be defined through changesin respiration rate, and other terms may relate to data on heatbalance or mechanical work done. Consequently, the traditionalbioenergetics models are powerful data synthesis tools with astrong empirical foundation. Yet they are typically parameter-rich(Ney, 1993), with further assumptions required to relate parametersfor different species (Chipps and Wahl, 2008; Ney, 1993).
By contrast, a much more theoretical approach known asdynamic energy budget (DEB) theory considers many of the sameprocesses as the empirical models, but from a different perspective.The most sophisticated approach to DEB theory (Kooijman, 1993;Kooijman, 2010; Nisbet et al., 2000) starts from a set of well-defined assumptions and provides a characterization of thecomplete life cycle (embryo, juvenile and adult) of an animalthrough a ‘standard’ model with 12 parameters. It predicts bothinterspecific and intraspecific variation in the many energy andmass fluxes in any biologically relevant environment. The pricepaid for this enhanced generality is greater abstraction: the statevariables of the model itself are not directly measurable, andobservable fluxes such as respiration rate or heat loss are commonlylinear combinations of individually unobservable fluxes.
The Journal of Experimental Biology 215, 892-902© 2012. Published by The Company of Biologists Ltddoi:10.1242/jeb.059675
REVIEW
Integrating dynamic energy budget (DEB) theory with traditional bioenergetic models
Roger M. Nisbet1,*, Marko Jusup2,3, Tin Klanjscek1,2 and Laure Pecquerie1
1Department of Ecology, Evolution and Marine Biology, University of California, Santa Barbara, CA 93106-9610, USA, 2Rudjer Boskovic Institute, Department for Marine and Environmental Research, Bijenicka cesta 54, POB 180, HR-10002 Zagreb,
Croatia and 3Faculty of Environment and Information Sciences, Yokohama National University, 79-7, Tokiwadai, Hodogaya-ku,Yokohama, Kanagawa 240-8501, Japan
*Author for correspondence ([email protected])
Accepted 5 October 2011
SummaryDynamic energy budget (DEB) theory offers a systematic, though abstract, way to describe how an organism acquires and usesenergy and essential elements for physiological processes, in addition to how physiological performance is influenced byenvironmental variables such as food density and temperature. A ʻstandardʼ DEB model describes the performance (growth,development, reproduction, respiration, etc.) of all life stages of an animal (embryo to adult), and predicts both intraspecific andinterspecific variation in physiological rates. This approach contrasts with a long tradition of more phenomenological andparameter-rich bioenergetic models that are used to make predictions from species-specific rate measurements. These lessabstract models are widely used in fisheries studies; they are more readily interpretable than DEB models, but lack the generalityof DEB models. We review the interconnections between the two approaches and present formulae relating the state variables andfluxes in the standard DEB model to measured bioenergetic rate processes. We illustrate this synthesis for two large fishes:Pacific bluefin tuna (Thunnus orientalis) and Pacific salmon (Oncorhynchus spp.). For each, we have a parameter-sparse, full-life-cycle DEB model that requires adding only a few species-specific features to the standard model. Both models allow powerfulintegration of knowledge derived from data restricted to certain life stages, processes and environments.
Key words: bioenergetic models, dynamic energy budget, salmon, tuna.
THE JOURNAL OF EXPERIMENTAL BIOLOGY
893Dynamic energy budget theory
The two contrasting approaches, outlined in the following twosections of this paper, can be characterized as data driven(Overview of traditional bioenergetic models) and theory driven(Kooijman’s DEB theory). They have sufficient conceptual overlapthat they should inform each other, but it is currently a challengeto figure out how to relate the powerful formalism of DEB theoryto the bioenergetic data that are available in many applications.Making the connection requires precise recipes that relateindividual measurements to DEB concepts. In the fourth section(Relating Kooijman’s DEB theory to other bioenergeticapproaches) we provide the explicit formulae for quantities wherethe connection is straightforward and we outline a systematicmethod for handling subtler situations. The connections are furtherillustrated in the fifth and sixth sections, where we review andsynthesize data on two fish species with large adults, Pacific bluefintuna (Thunnus orientalis) and Pacific salmon (Oncorhynchus spp.).For each, there is a full-life-cycle DEB model, constructed toconnect knowledge deriving from data restricted to certain lifestages, processes and environments. The paper ends with adiscussion of some challenges in further integrating traditionalapproaches with DEB theory and simplifying DEB theory to makethe connections more transparent.
Kooijmanʼs DEB theoryDEB theory is a powerful theoretical framework for relatingsuborganismal (biochemical, genetic and physiological) processesto organismal performance and, thereby, to populations,ecosystems and their temporal evolution at many time scales. DEBtheory focuses on the individual organism, with differentialequations describing the rates at which the organism assimilatesand utilizes energy and elemental matter from food for itsmaintenance, growth, reproduction and development (Kooijman,1986; Kooijman, 2000; Kooijman, 2001; Kooijman, 2010; Nisbetet al., 2004; Nisbet et al., 2010; Nisbet et al., 2000).
There are a number of different approaches to DEB modelformulation, but the ‘standard’ DEB model (Kooijman, 2010;Sousa et al., 2010) is the only model known to the authors thatdescribes the interconnections among the processes of assimilation,maintenance, development, growth and reproduction of anorganism throughout all stages of its life cycle, and in a dynamicenvironment. In this section, we describe the standard model for aheterotrophic ectotherm, and refer the reader to Kooijman’s(Kooijman, 2010) book for discussion of other types of organism.
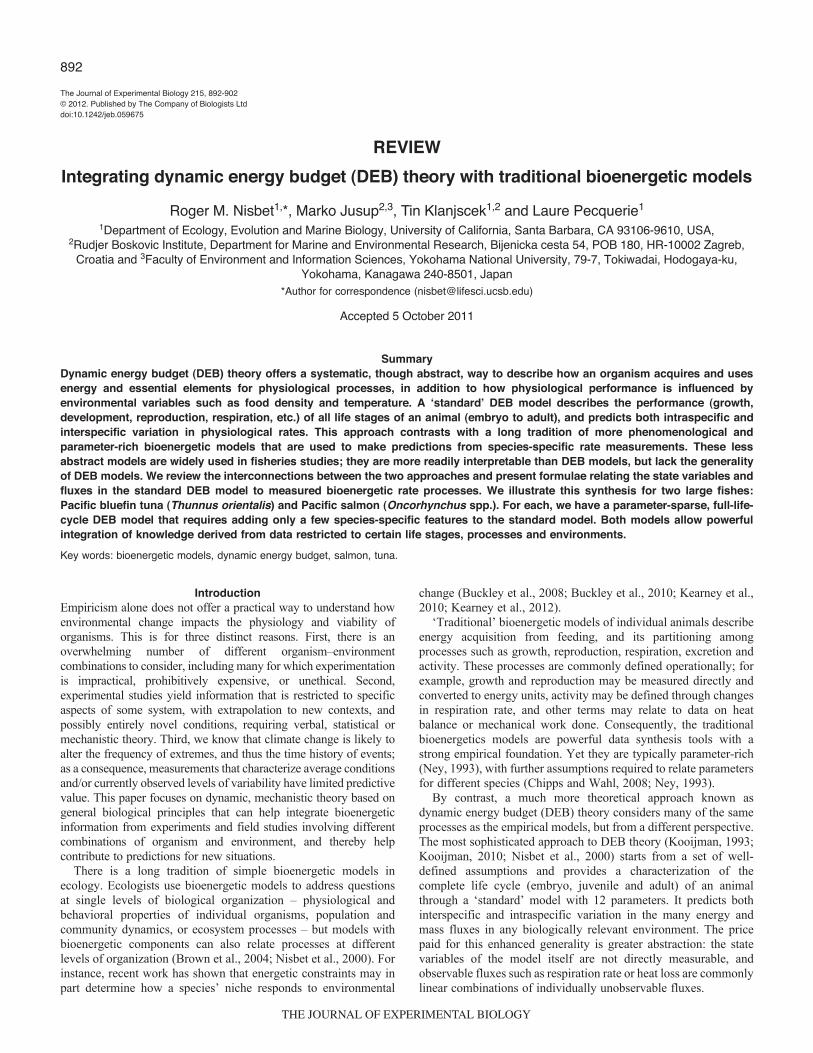
The state variables and energy flows are illustrated in Fig.1. Theanimal’s biomass is the sum of contributions from threecompartments: structure, reserve and (for adults) reproductivereserve. Structure is defined as biomass that requires energyexpenditure for maintenance; reserve is defined as biomass thatdoes not require maintenance. (Note that some terms, notablystructure and reserve, are very precisely defined in Kooijman’sDEB theory. This is done in order to achieve maximum generality,but has the consequence that their interpretation in particularcontexts may differ from common usage in biology. We retainKooijman’s terminology here for consistency with cited literature.)An immediate implication of these definitions is that individualcompartments cannot be directly identified with specific organs orwith chemical compounds such as proteins or lipids. However, inmost applications it is safe to associate the term structure with somemeasure of an organism’s physical length. The composition of thebiomass in each compartment is constant but the composition ofreserve and structure differ. Although each compartment containsa mixture of many compounds, it is represented as a ‘generalized
compound’ with fixed stoichiometry, e.g. a molecule of structureV has a formula CHnHVOnOVNnNV. It is conventional to specify thecomposition of the generalized compounds with a single carbonatom. Thus, for example, nNV represents the molar N:C ratio. Withthis convention, the natural unit for measuring mass is Cmol(Kooijman, 2010), and chemical potentials have dimension energyper Cmol. Each generalized compound has a specified chemicalpotential (Gibbs energy per Cmol). The relative masses of eachcomponent may vary over time; for example, during a period of
A
B
C
Fig.1. Schematic representation of the three life stages of the ʻstandardʼDEB model (Kooijman, 2010). (A) An embryo uses reserve to grow anddevelop. (B) At ʻbirthʼ, a juvenile starts feeding, and (C) at ʻpubertyʼ, anadult starts allocating energy to reproduction.
THE JOURNAL OF EXPERIMENTAL BIOLOGY
894
starvation, the ratio of reserve to structure will decrease, possiblyleading to a change in the overall composition of biomass.
The life cycle in the standard DEB model is described by three lifestages: embryo, juvenile and adult. An embryo mobilizes maternalreserve for development, growth and maintenance processes. Oncethe individual has achieved a particular threshold of energy intoinvested in development, the individual is complex enough to startfeeding, which marks ‘birth’, the transition between the embryo andthe juvenile stage. Further investment in development leads to asecond transition, awkwardly termed ‘puberty’ in the DEB literature,but not restricted to sexually reproducing organisms. After puberty,the organism starts to commit energy to reproduction.
Four state variables characterize the organism: the stored Gibbsenergy in the three compartments and a variable called ‘maturity’that characterizes increase in complexity through embryonic andjuvenile development. The principal metabolic processes shown inFig.1 are of four types: (1) assimilation (food r reserve); (2)‘dissipation’, defined as metabolic work that does not lead to theproduction of new biological material, i.e. somatic and maturitymaintenance along with the overheads of growth and reproduction(reserve r mineral products); (3) growth (reserve r structure); and(4) reproduction (reserve r reproductive reserve). [Dissipation isanother term with a precise definition for the standard DEB modelthat does not always match its use in other subdisciplines. Wepresent a formula in the fourth section (Relating Kooijman’s DEBtheory to other bioenergetic approaches).] The chemical equationscharacterizing these transformations are presented in Table1, andthe model dynamics are summarized in Tables2 and 3. Thestoichiometry of the chemical equations leads to a formula forcalculating respiration rate, defined as rate of oxygen consumptionor CO2 production. Respiration thus defined can be expressed as aweighted sum of contributions from assimilation, growth,dissipation and (for adults) reproduction.
The ‘standard’ version of the DEB model has 12 parameters(listed in Table2). Estimating these parameters ab initio requiresextensive data (Kooijman et al., 2008), but it is possible to make afirst cut at estimation by taking advantage of theoretical predictionsof interspecific body-size scaling relationships or co-variation ofparameters [chapter 8 of Kooijman (Kooijman, 2010); see alsoNisbet et al. (Nisbet et al., 2000) for an ecologically orientedoverview of the underlying concepts]. In brief, the parameters inDEB theory may be classified as ‘intensive’ or ‘extensive’, withthe values of the former roughly invariant among related speciesand the latter varying in a predictable way with size. Extensiveparameters scale directly with a ‘zoom factor’ z, which is defined
R. M. Nisbet and others
as the ratio of the maximum length of the species of interest to themaximum length of the reference species zLm/Lm,ref. Whereapplicable, the size dependence is indicated in Table2. Parametersfor the model of Pacific salmon were, for instance, estimated withthe help of these relationships (Pecquerie et al., 2011).
Relating Kooijman’s DEB model to bioenergetic data is greatlyfacilitated by the work of Sousa et al. (Sousa et al., 2006). Theseauthors placed Kooijman’s DEB model in a rigorousthermodynamic framework. They assume that energy expenditureon mechanical work is commonly small and that the associatedexpenditure of chemical energy can be regarded as part ofmaintenance. They propose that entropy changes within an aerobicorganism are likewise small, implying that the chemicaltransformations of an aerobe in the DEB model simply involveconversion of Gibbs energy to heat. They also highlight subtleties[see table 2 of Sousa et al. (Sousa et al., 2006)], not included in thecurrent brief summary, that arise when considering anaerobicprocesses. Each of these considerations may be relevant whenintegrating information from bioenergetic data into DEB models.
Overview of traditional bioenergetic modelsTraditional bioenergetic models similarly start from an equationdescribing energy or mass balance requirements, and describe thefate of chemical energy stored in food. We follow conventions frombioenergetic models of fish growth, for which the equations arefrequently expressed in terms of energy per day per units of (wetor dry) weight.
The traditional models are in fact a particularly simple special caseof a DEB model with a single state variable. The ‘input’ is the feedingrate (C); the ‘outputs’ include egestion (F) and excretion rates (U),growth rate (G) and total metabolic rate. Each term may in turn bedecomposed into component terms. Thus, depending on the focus ofthe study, it may be useful to distinguish the contributions to growthrate from somatic growth, gonad production and storage of fats andlipids. Total metabolic rate can be decomposed into specific dynamicaction (SDA; represented in equations by S) and maintenance, withthe latter commonly described as the product of standard (or basal)maintenance (M) and a dimensionless factor called ‘activity’ (A).Note that maintenance here has a different meaning from its use inDEB theory. Ignoring the different components of growth, the energybalance equation then takes the form:
C G + MA + S + F + U. (1)
Notwithstanding the similarity of the underlying principles, thedefinition of rate processes in traditional bioenergetic models rests
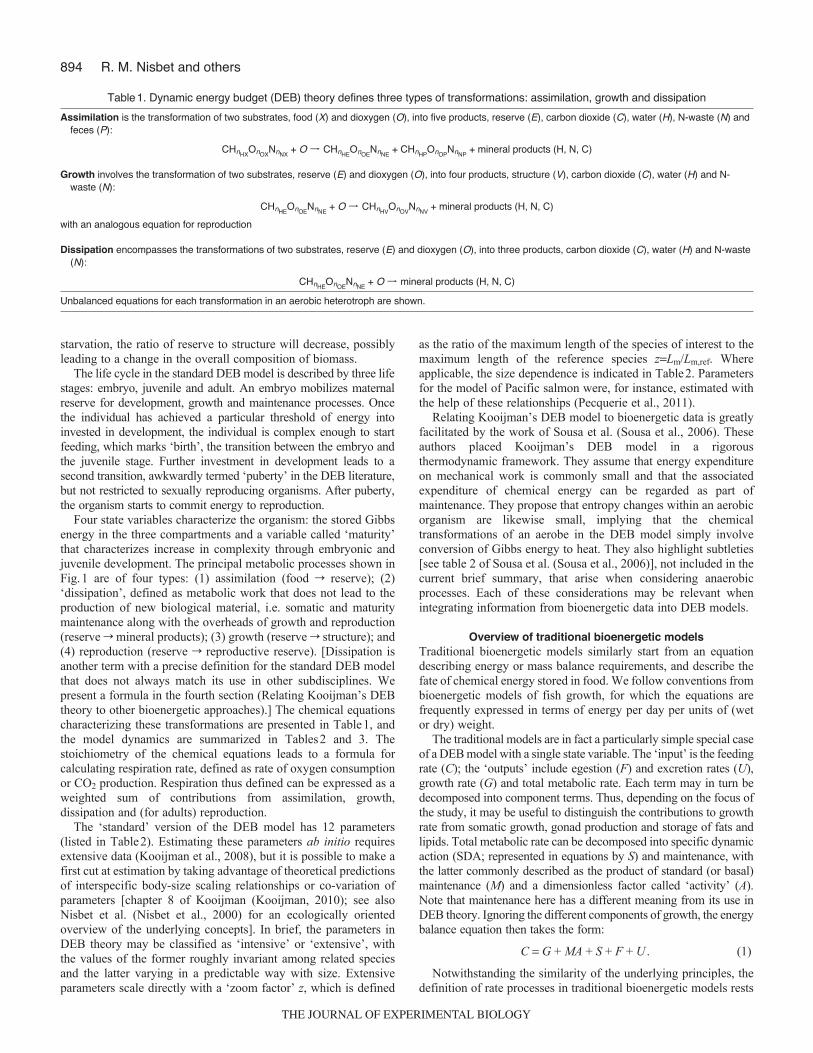
Table1. Dynamic energy budget (DEB) theory defines three types of transformations: assimilation, growth and dissipation
Assimilation is the transformation of two substrates, food (X) and dioxygen (O), into five products, reserve (E), carbon dioxide (C), water (H), N-waste (N) andfeces (P):
CHnHXOnOX
NnNX+ O j CHnHE
OnOENnNE
+ CHnHPOnOP
NnNP+ mineral products (H, N, C)
Growth involves the transformation of two substrates, reserve (E) and dioxygen (O), into four products, structure (V), carbon dioxide (C), water (H) and N-waste (N):
CHnHEOnOE
NnNE+ O j CHnHV
OnOVNnNV
+ mineral products (H, N, C)
with an analogous equation for reproduction
Dissipation encompasses the transformations of two substrates, reserve (E) and dioxygen (O), into three products, carbon dioxide (C), water (H) and N-waste(N):
CHnHEOnOE
NnNE+ O j mineral products (H, N, C)
Unbalanced equations for each transformation in an aerobic heterotroph are shown.
THE JOURNAL OF EXPERIMENTAL BIOLOGY
895Dynamic energy budget theory
on strikingly different principles from those invoked in Kooijman’sDEB theory. The state variables in Kooijman’s models are definedin an abstract way, with relationships among measurable quantitiesdefined implicitly via these variables. In contrast, some terms inEqn 1 are typically defined operationally through measured (ormeasurable) changes in metabolic rates, most commonly throughchanges in measured respiration rate under different experimentalconditions.
The price paid for this practical approach to defining fluxes is asubtle difference in meaning for each term in different applications.For example, although SDA is widely defined as the increase inrespiration due to the costs of processing and utilizing food,individual investigators operationalize this definition in differentways. A recent extensive review (Secor, 2009) defines SDA interms of the integrated energy expenditure (relative to basalmetabolic rate) over the complete transient response of respirationrate in an animal, following a meal. In contrast, a few studies focuson the steady state respiration rate of animals feeding at differentrates, e.g. a study by Bohrer and Lampert (Bohrer and Lampert,1988) of respiration in Daphnia.
Activity is defined as the proportional increase in respiration ratein ‘active’ versus ‘resting’ animals, and is widely used tocharacterize the metabolic energy costs of mechanical work. Forfish, activity thus defined may be estimated by nonlinear
regressions of oxygen consumption against sustained swimmingspeed (Padapopoulos, 2008), but the resulting fits must be usedwith care, as other physiological processes, notably feeding rate,may covary with swimming speed.
For fish, activity can alternatively be estimated from themechanical power requirements (e.g. Brett, 1963; Petrell and Jones,2000; Schultz and Webb, 2002). Estimating activity in this mannerrequires answering two questions: (1) what is the mechanical powerneeded to generate the thrust that propels the fish to a given speed;and (2) how does the produced mechanical power relate to the rateof metabolic (chemical) energy consumption by the muscle?
In 1971, Paul Webb was among the first to attempt to answerthese questions for rainbow trout in an integrative study, combiningmechanical and physiological data (Webb, 1971a; Webb, 1971b;Ellerby, 2010). Following Webb’s pioneering work, the researchon mechanics and physiology of fish swimming was, for the mostpart, conducted separately (for reviews, see Blake, 2004; Schultzand Webb, 2002).
Significant advances in understanding the mechanical aspects ofswimming were achieved through visualization of flow close toliving and robotic fish (Peng and Dabiri, 2008; Brucker andBleckmann, 2007; Anderson et al., 2001), as well as developmentof complex hydrodynamic models (Borazjani and Sotiropoulos,2010; Zhu et al., 2002; Wolfgang et al., 1999). One particular line
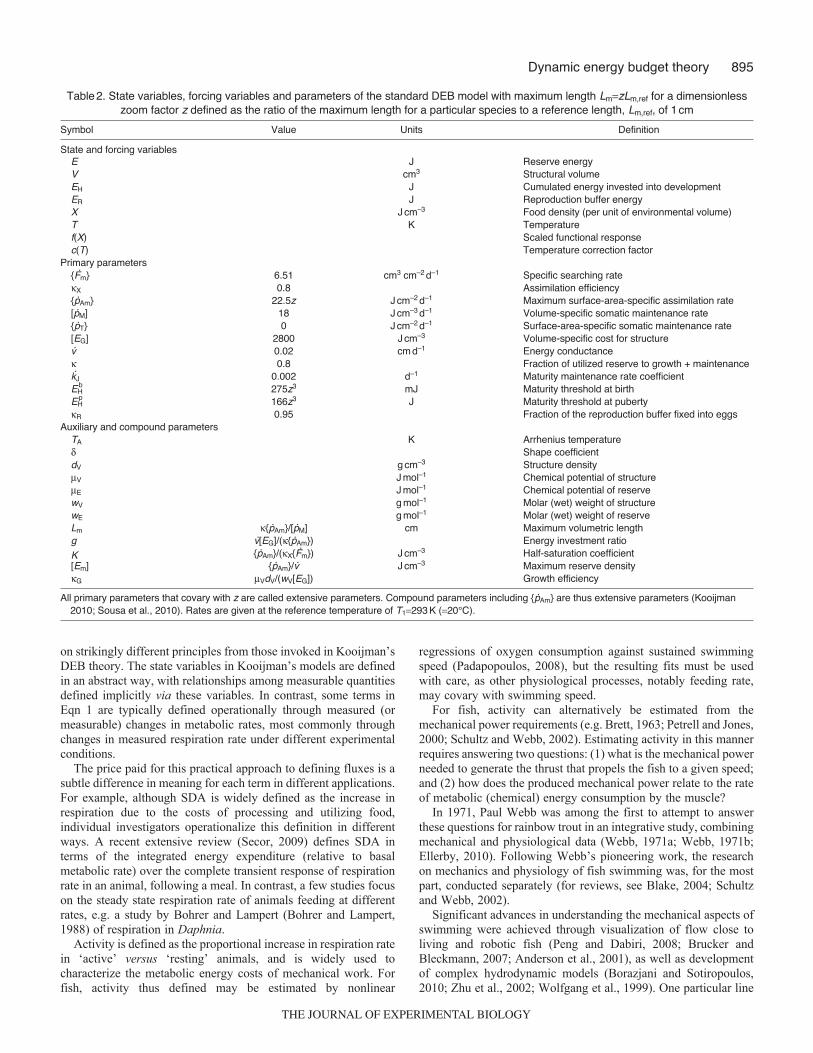
Table2. State variables, forcing variables and parameters of the standard DEB model with maximum length LmzLm,ref for a dimensionlesszoom factor z defined as the ratio of the maximum length for a particular species to a reference length, Lm,ref, of 1cm
Symbol Value Units Definition
State and forcing variablesE J Reserve energyV cm3 Structural volumeEH J Cumulated energy invested into developmentER J Reproduction buffer energyX Jcm–3 Food density (per unit of environmental volume)T K Temperaturef(X) Scaled functional responsec(T) Temperature correction factor
Primary parameters{Fm} 6.51 cm3 cm–2d–1 Specific searching rateX 0.8 Assimilation efficiency{pAm} 22.5z Jcm–2d–1 Maximum surface-area-specific assimilation rate[pM] 18 Jcm–3d–1 Volume-specific somatic maintenance rate{pT} 0 Jcm–2d–1 Surface-area-specific somatic maintenance rate[EG] 2800 Jcm–3 Volume-specific cost for structurev 0.02 cmd–1 Energy conductance 0.8 Fraction of utilized reserve to growth + maintenancekJ 0.002 d–1 Maturity maintenance rate coefficientEH
b 275z3 mJ Maturity threshold at birthEH
p 166z3 J Maturity threshold at pubertyR 0.95 Fraction of the reproduction buffer fixed into eggs
Auxiliary and compound parametersTA K Arrhenius temperature Shape coefficientdV gcm–3 Structure densityV Jmol–1 Chemical potential of structureE Jmol–1 Chemical potential of reservewV gmol–1 Molar (wet) weight of structurewE gmol–1 Molar (wet) weight of reserveLm {pAm}/[pM] cm Maximum volumetric lengthg v[EG]/({pAm}) Energy investment ratio
K {pAm}/(X{Fm}) Jcm–3 Half-saturation coefficient[Em] {pAm}/v Jcm–3 Maximum reserve densityG VdV/(wV[EG]) Growth efficiency
All primary parameters that covary with z are called extensive parameters. Compound parameters including {pAm} are thus extensive parameters (Kooijman2010; Sousa et al., 2010). Rates are given at the reference temperature of T1293K (20°C).
THE JOURNAL OF EXPERIMENTAL BIOLOGY
896 R. M. Nisbet and others
of research helped link the kinematic parameters of swimming tooptimal thrust generation, reduced boundary layer separation, andenergy extraction from oncoming vortical flows using a bionicmodel (a 1.2m long RoboTuna), digital particle image velocimetryand computational fluid dynamics (Triantafyllou et al., 2002; Zhuet al., 2002; Wolfgang et al., 1999; Barrett et al., 1999).Nonetheless, a number of questions concerning the total powerconsumption and propulsive efficiency were not resolved. Newapproaches, stressing conceptual and practical difficulties inseparating drag and thrust (Schultz and Webb, 2002; Anderson etal., 2001), called for quantifying the power dissipated as vorticityin the wake to put limits on relative performances of various fishes(Tytell, 2007). It has even been hypothesized that, in the aquaticenvironment, mechanisms minimizing wake losses may be a moreplausible evolutionary end-result than drag relief adaptations(Webb and Cotel, 2010).
Even with substantial knowledge about the mechanical powerrequirements of swimming, formidable difficulties must be resolvedto determine how this power relates to the rate of metabolic(chemical) energy consumption, estimated by measuring respirationat endurable levels of exercise. In a typical experimental setup for afasting, preferably non-growing fish, the sum of metabolic rates canbe obtained by measuring respiration rates at various swimmingspeeds in a water tunnel. Statistical models are then applied toestimate and subtract the standard metabolic rate. After subtraction,the remainder is assumed to represent the metabolic cost ofswimming. The method is not completely reliable, however, becauserespiration may be affected by numerous factors, including: (1) stress(Sloman et al., 2000), (2) shift from active to ram ventilation (Farrelland Steffensen, 1987), (3) use of various gaits (Korsmeyer et al.,2002), (4) contribution of anaerobic metabolism at higher speeds(Jayne and Lauder, 1994) and (5) changes in proportion of increasedoxygen consumption actually received by locomotory muscles(Kiceniuk and Jones, 1977). In addition, studies involvingrespirometry provide little insight into the mechanical powerproduced by the muscle tissue. Patterns of muscle function in thiscontext are studied rather independently, using a combination ofelectromyography measurements in vivo and myomere power outputin vitro (Altringham and Ellerby, 1999).
Relating Kooijmanʼs DEB theory to other bioenergeticapproaches
The previous two sections offered brief overviews of complementaryapproaches to modeling energy acquisition and utilization by animals.‘Traditional’ bioenergetic models emphasize operationally definedquantities such as SDA, activity, swimming, or standard metabolism.Relating these quantities to the more abstract concepts in Kooijman’sDEB theory involves looking carefully at the operational definitionsand their magnitude, and interpreting them in terms of DEBprocesses. We first establish those links that are unambiguousbetween the terms in the balance equation (Eqn 1) and DEB processespresented in Fig.1, and then discuss possible interpretations of someof the terms in the balance equation. Our treatment has some overlapwith chapter 11 of Kooijman (Kooijman, 2010), but differs in anumber of details, for example our treatment of SDA.
As the different components of an energy budget are oftenexpressed in energy per day per unit of (wet) weight, we first definethe (wet) weight of an individual Ww:
where WV is the structural weight (g), WE is the reserve weight, WR
is the weight of the reproduction buffer, dV is the density of thestructural volume, and wE and E are the molar weight and thechemical potential of reserve, respectively.
Food consumptionThe standard DEB model considers one type of food with densitydenoted by X, and assumes constant assimilation efficiency X
(0<X<1). We express the food consumption rate, C, as follows:
where pX is the ingestion rate and pAXpX is the assimilation rate.
GrowthIn a DEB model, the term ‘growth’ refers only to increase instructure (Fig.1). In traditional bioenergetic models, growth (G) isdefined as the amount of energy fixed in new tissues per day andper unit of weight. In DEB terms, it thus includes the energy fixedin reserve, in structure, and (for adults) in the reproduction buffer:
where wV and V are the molar weight and the chemical potenitalof structure, and dE/dt, dV/dt and dER/dt are given in Eqns A1, A2and A4 in Table3. The growth term can thus be expressed asfollows:
In this equation, (1–G)pG represents the overheads of growth (ofstructure) and pDpS+pJ+(1–R)pR represents the ‘dissipation’ terms,which encompass all processes not associated with the production ofnew reserve and new structure. The parameter GVdV/(wV[EG])(0<G<1) is the fraction of energy for growth that is fixed intostructure. As mentioned earlier, this definition of dissipation isdistinctive to the DEB literature; other processes linked toassimilation and growth may lead to products such as CO2 that aresometimes used to characterize dissipative processes. Formulae forthe different energy fluxes are given in Table3.
Ww = WV + WE + WR = dVV +wE
μE
E + ER( ) (2) .
C =1
Ww
&pX =1
WwκX
&pA , (3)
G =1
Ww
dVμV
wV
dV
dt+
dE
dt+
dER
dt
⎛⎝⎜
⎞⎠⎟
, (4)
G =1
WW
&pA − (1− κG ) &pG − &pD( ) . (5)
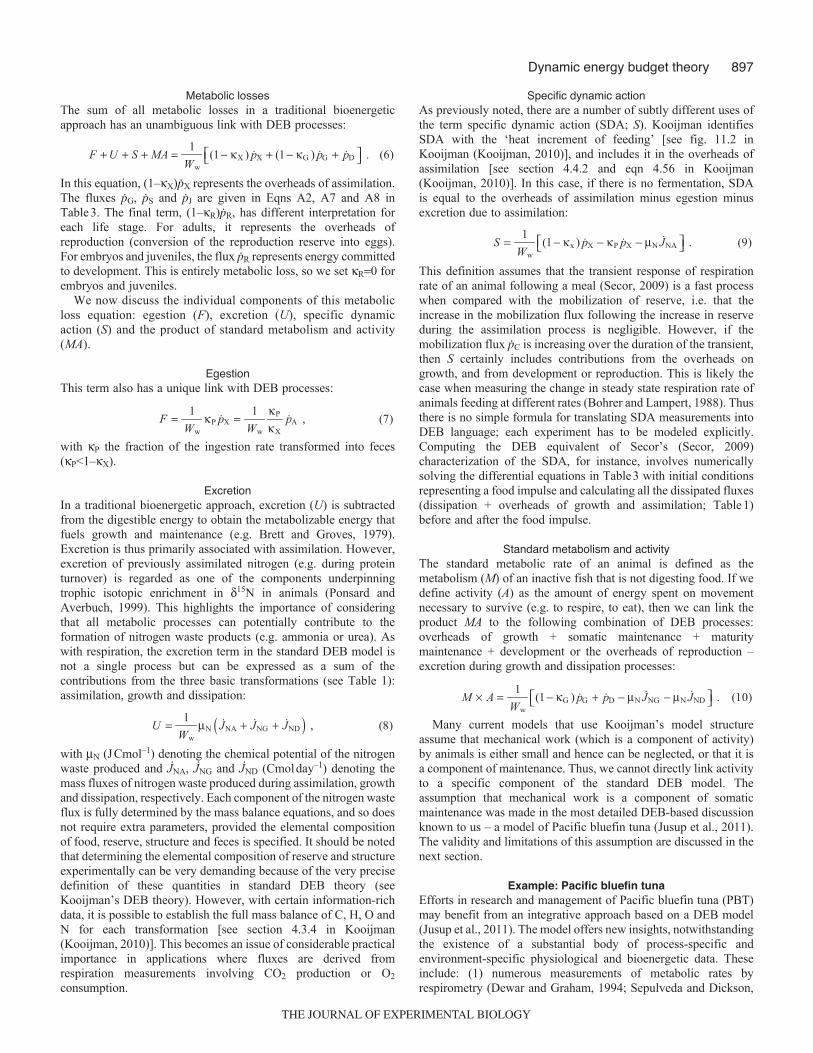
Table 3. Equations of the standard DEB model
A1
ddtE = pA pC
A2
ddtV =
1[EG]
pG =1
[EG]( pC pS)
A3
ddtEH = (1 )pC pJ if EH <EH
p , else ddtEH = 0
A4
ddtER = 0 if EH <EH
p , else ddtER = (1 )pC pJ
A5 with pA = c(T )f (X ){pAm}L2 if EH EH
b , else pA = 0
A6
pC = c(T ){pAm}L2geg + e
1+LgLm
;
with
e =[E ][Em]
=EV
vpAm{ }
and L =V1/3
A7
pS = c(T ) [pM]L3 + pT{ }L2( )
A8 pJ = c(T )kJEH
A9 f (X ) =X
X +K
A10 c(T ) = expTAT1
TAT
Notation is described in Table 2.
THE JOURNAL OF EXPERIMENTAL BIOLOGY
897Dynamic energy budget theory
Metabolic lossesThe sum of all metabolic losses in a traditional bioenergeticapproach has an unambiguous link with DEB processes:
In this equation, (1–X)pX represents the overheads of assimilation.The fluxes pG, pS and pJ are given in Eqns A2, A7 and A8 inTable3. The final term, (1–R)pR, has different interpretation foreach life stage. For adults, it represents the overheads ofreproduction (conversion of the reproduction reserve into eggs).For embryos and juveniles, the flux pR represents energy committedto development. This is entirely metabolic loss, so we set R0 forembryos and juveniles.
We now discuss the individual components of this metabolicloss equation: egestion (F), excretion (U), specific dynamicaction (S) and the product of standard metabolism and activity(MA).
EgestionThis term also has a unique link with DEB processes:
with P the fraction of the ingestion rate transformed into feces(P<1–X).
ExcretionIn a traditional bioenergetic approach, excretion (U) is subtractedfrom the digestible energy to obtain the metabolizable energy thatfuels growth and maintenance (e.g. Brett and Groves, 1979).Excretion is thus primarily associated with assimilation. However,excretion of previously assimilated nitrogen (e.g. during proteinturnover) is regarded as one of the components underpinningtrophic isotopic enrichment in 15N in animals (Ponsard andAverbuch, 1999). This highlights the importance of consideringthat all metabolic processes can potentially contribute to theformation of nitrogen waste products (e.g. ammonia or urea). Aswith respiration, the excretion term in the standard DEB model isnot a single process but can be expressed as a sum of thecontributions from the three basic transformations (see Table 1):assimilation, growth and dissipation:
with N (JCmol–1) denoting the chemical potential of the nitrogenwaste produced and J̇NA, J̇NG and J̇ND (Cmolday–1) denoting themass fluxes of nitrogen waste produced during assimilation, growthand dissipation, respectively. Each component of the nitrogen wasteflux is fully determined by the mass balance equations, and so doesnot require extra parameters, provided the elemental compositionof food, reserve, structure and feces is specified. It should be notedthat determining the elemental composition of reserve and structureexperimentally can be very demanding because of the very precisedefinition of these quantities in standard DEB theory (seeKooijman’s DEB theory). However, with certain information-richdata, it is possible to establish the full mass balance of C, H, O andN for each transformation [see section 4.3.4 in Kooijman(Kooijman, 2010)]. This becomes an issue of considerable practicalimportance in applications where fluxes are derived fromrespiration measurements involving CO2 production or O2
consumption.
F +U + S +MA =1
Ww
(1− κX ) &pX + (1− κG ) &pG + &pD⎡⎣ ⎤⎦ . (6)
F =1
Ww
κP &pX =1
Ww
κP
κX
&pA , (7)
U =1
Ww
μN&JNA + &JNG + &JND( ) , (8)
Specific dynamic actionAs previously noted, there are a number of subtly different uses ofthe term specific dynamic action (SDA; S). Kooijman identifiesSDA with the ‘heat increment of feeding’ [see fig. 11.2 inKooijman (Kooijman, 2010)], and includes it in the overheads ofassimilation [see section 4.4.2 and eqn 4.56 in Kooijman(Kooijman, 2010)]. In this case, if there is no fermentation, SDAis equal to the overheads of assimilation minus egestion minusexcretion due to assimilation:
This definition assumes that the transient response of respirationrate of an animal following a meal (Secor, 2009) is a fast processwhen compared with the mobilization of reserve, i.e. that theincrease in the mobilization flux following the increase in reserveduring the assimilation process is negligible. However, if themobilization flux pC is increasing over the duration of the transient,then S certainly includes contributions from the overheads ongrowth, and from development or reproduction. This is likely thecase when measuring the change in steady state respiration rate ofanimals feeding at different rates (Bohrer and Lampert, 1988). Thusthere is no simple formula for translating SDA measurements intoDEB language; each experiment has to be modeled explicitly.Computing the DEB equivalent of Secor’s (Secor, 2009)characterization of the SDA, for instance, involves numericallysolving the differential equations in Table3 with initial conditionsrepresenting a food impulse and calculating all the dissipated fluxes(dissipation + overheads of growth and assimilation; Table1)before and after the food impulse.
Standard metabolism and activityThe standard metabolic rate of an animal is defined as themetabolism (M) of an inactive fish that is not digesting food. If wedefine activity (A) as the amount of energy spent on movementnecessary to survive (e.g. to respire, to eat), then we can link theproduct MA to the following combination of DEB processes:overheads of growth + somatic maintenance + maturitymaintenance + development or the overheads of reproduction –excretion during growth and dissipation processes:
Many current models that use Kooijman’s model structureassume that mechanical work (which is a component of activity)by animals is either small and hence can be neglected, or that it isa component of maintenance. Thus, we cannot directly link activityto a specific component of the standard DEB model. Theassumption that mechanical work is a component of somaticmaintenance was made in the most detailed DEB-based discussionknown to us – a model of Pacific bluefin tuna (Jusup et al., 2011).The validity and limitations of this assumption are discussed in thenext section.
Example: Pacific bluefin tunaEfforts in research and management of Pacific bluefin tuna (PBT)may benefit from an integrative approach based on a DEB model(Jusup et al., 2011). The model offers new insights, notwithstandingthe existence of a substantial body of process-specific andenvironment-specific physiological and bioenergetic data. Theseinclude: (1) numerous measurements of metabolic rates byrespirometry (Dewar and Graham, 1994; Sepulveda and Dickson,
S =1
Ww
(1− κx ) &pX − κP &pX − μN&JNA⎡⎣ ⎤⎦ . (9)
M × A =1
Ww
(1− κG ) &pG + &pD − μN&JNG − μN
&JND⎡⎣ ⎤⎦ . (10)
THE JOURNAL OF EXPERIMENTAL BIOLOGY
898
2000; Blank et al., 2007) and energy losses of starved fish (Boggsand Kitchell, 1991); (2) comprehensive measurements related toembryonic development, including temperature dependence of timerequired from spawning to hatching (Miyashita et al., 2000); (3)extensive morphological and physiological descriptions of thelarval stage, including measurements of body size as a function oftime (Miyashita et al., 2001; Sawada et al., 2005); (4) variousmeasurements of growth and feeding rates, feed conversion ratios,and reproductive output of fish in captivity (Aguado-Gimenez andGarcia-Garcia, 2005; Masuma, 2009); (5) detailed studies ofcardiovascular function and SDA in response to feeding bouts(Fitzgibbon et al., 2007; Clark et al., 2008); and (6) thoroughinvestigations of PBT heat budget by means of lumped systemthermal analysis (Kitagawa et al., 2006; Kitagawa et al., 2007;Kubo et al., 2008).
The DEB modeling framework reveals connections betweenthese data sets, taking into account differences in attributes of thefish (e.g. length, weight) as well as the environmental conditions(e.g. temperature, food density) in which data were gathered.Recognizing this, Jusup et al. (Jusup et al., 2011) formulated acomplete life cycle DEB model for PBT – from an egg to an adultfemale and its eggs. The ‘standard’ DEB model (Sousa et al., 2010)was supplemented with a limited number of assumptions on PBTmorphology and thermogenesis. The model was calibrated toemulate physiological characteristics of PBT and used toinvestigate knowledge gaps such as: (1) reasons for differentgrowth rates between cultivated and wild PBT; (2) origins ofsimilarities in the weight–length relationship of cultivated and wildPBT; (3) estimates of average number of batches produced perspawning season; (4) estimates of food abundance experienced bywild PBT; (5) reasons behind acceleration of growth rate in thelarval stage; and (6) causes of deceleration of growth rate in theearly juvenile phase.
The DEB model of Jusup et al. (Jusup et al., 2011) predictsenergy fluxes (Fig.1) that can be compared with previousbioenergetic measurements. For an individual growing from 30 to40kg, in conditions representative of the wild fish (mean scaledfunctional response f0.905, mean body temperature 19°C) themodel predicts an average assimilation flux of 35.5W. Theutilization flux (totaling 35.1W) is split between somaticmaintenance (64.2%), growth (13.8%), maturity maintenance(21.4%), and maturation (0.6%).
The high expenditure on maintenance relates to a well-recognized problem in tuna aquaculture, the exceptionally highratio of dry feed weight to wet fish weight gain, traditionally calledthe feed conversion ratio (FCR). FCR for large bluefin tuna inMediterranean aquaculture (average initial and final weights of 219and 255kg, respectively) is as high as 7.4. Even though a somewhatlower FCR of 4.6 has been reported (Aguado-Gimenez and Garcia-Garcia, 2005) for smaller fish (average initial and final weights of32 and 63kg, respectively), it is still high in comparison to an FCRof 1 to 2 characteristic of other fishes. From the bioenergetic pointof view, high FCR is an indication that a large fraction of inputenergy from feed is lost in the form of heat and metabolic productsthat most likely originate from continuous swimming. The DEBmodel, which includes cost of swimming in the somaticmaintenance flux, captures this dynamics very well.
Further connecting the DEB model predictions to traditionalmeasurements requires data on respiration rates (see Overview oftraditional bioenergetic models). The most complete relevant bodyof data known to us based on the standard interpretation ofrespirometry measurement is for (smaller) yellowfin tuna, Thunnus
R. M. Nisbet and others
albacares (Dewar and Graham, 1994; Korsmeyer et al., 1996;Korsmeyer and Dewar, 2001). These indicate: standard metabolicrate (11%), average contribution from aerobic swimming (27%),oxygen debt recovery (38%), SDA (18%) and growth (6%). Whencomparing with the DEB model, oxygen debt recovery (aerobicenergy expenditure to cover costs of processing metabolites fromanaerobic activity, replenishing fuel stores, etc.) should beinterpreted as a part of locomotory costs, and included in somaticmaintenance. The recovery period can last from a minute to severaldays, but is typically short except for the largest fish. Thus as thestandard DEB model ‘averages’ fast processes, the mostappropriate comparison regards the total expenditure associatedwith anaerobic processes (direct + recovery) as part of somaticmaintenance. In yellowfin tuna, this combined cost of movementand oxygen debt recovery accounts for 65% of total respiration, andtotal dissipation (standard metabolism added) represents 76% oftotal respiration.
As noted earlier, in DEB theory, respiration is a weighted sum ofassimilation, dissipation and growth fluxes; but without explicitassumptions on the stoichiometry of reserves and structure, theweights cannot be calculated a priori. However, data on SDA suggestthat assimilation should be assigned a lower weight than the otherfluxes. The DEB model suggests that assimilation accounts for9–34% of respiration in PBT, and growth accounts for 12–9% ofrespiration (depending on the contribution from assimilation).Dissipation, defined previously, is the major component, accountingfor 57–79% of respiration depending on the assumed weight of theassimilation. These results are qualitatively consistent with theinterpretation of aerobic metabolism for yellowfin tuna in thepreceding paragraph, where SDA accounts for 18%, growth for 6%,and dissipative processes for the remaining 76% of total respiration.
These analyses, suggesting that movement costs represent a highproportion of somatic maintenance, can be compared withinformation on the mechanical requirements for swimming.Theoretical studies involving fluid dynamics and experiments on arobotic fish indicate that the power required to overcome drag atnormal swimming speeds is low: a RoboTuna (see Overview oftraditional bioenergetic models) of approximately 120cm forklength achieved a speed of 0.7ms–1 (0.58s–1 � fork length) with apower input of only 0.5283W. Accompanying numerical modeling,showing a good agreement with experiments in terms of meanpower, estimated the propulsive efficiency at over 90% and meanmechanical power, depending on the value of kinematicparameters, between 1.15 and 3.05W at constant speed (0.66s–1 �fork length). At higher sustained speeds, respiration studies suggestthat the costs rise by a factor of approximately 10 at three times thetypical cruising speed. Assuming a 20–30% conversion efficiencyof chemical energy to mechanical work (Syme and Shadwick,2002; Smith et al., 2005; Ellerby, 2010), these data suggest thatenergetic requirements for swimming are much lower than actualexpenditure related to swimming as described above.
Further insight is obtained by comparing the mechanical energyrequirements for swimming with in vitro measurements of powerdelivery by red muscle. A living tuna similar in size to RoboTuna(120cm fork length; 35kg body weight) would have between 4 and13% red muscle mass as percentage of body weight (Bernal et al.,2001), indicating that the mechanical power required to overcomedrag relative to red muscle mass is of the order of1.0Wkg–1redmuscle at typical cruising speeds, with the highestplausible estimates yielding 2.2Wkg–1 redmuscle. However, invitro peak mechanical power production in red muscle of yellowfintuna has been shown to exceed 60Wkg–1 redmuscle, with power
THE JOURNAL OF EXPERIMENTAL BIOLOGY
899Dynamic energy budget theory
production exceeding 20Wkg–1 redmuscle over a wide range of tailbeat frequencies (Shadwick and Syme, 2008). Even higher values(44–75Wkg–1 redmuscle) were observed for skipjack tuna,Katsuwonus pelamis (Syme and Shadwick, 2002). Comparison ofthese values with the mechanical requirements for sustainedswimming (preceding paragraph) demonstrates that a tuna’s powercapacity much exceeds the requirements for sustained swimming.
In summary, the characterization of the energy fluxes in tunaobtained from a parameter-sparse DEB model describing a tuna’sfull life cycle is consistent with short-term measurements ofchanges in respiration rates associated with different processes (e.g.feeding and swimming). A high proportion of the somaticmaintenance rate is associated directly or indirectly with swimmingcosts, with this expenditure of chemical energy being much greaterthan is required for the mechanical work being performed. Directmeasurement of the power output of red muscle indicates that theanimal is capable of delivering much greater mechanical powerthan is required for sustained swimming. Better understanding ofthese mismatches requires a deeper exploration of the short-termchanges in physiological rates than is possible here.
Example: Pacific salmonNumerous bioenergetic approaches previously developed to studysalmonid growth (e.g. Aydin et al., 2005; Ballantyne et al., 2003;Beauchamp et al., 2004; Brodeur et al., 1992; Cech and Myrick,1999; Madenjian et al., 2004; Petrell and Jones, 2000; Stewart andIbarra, 1991) are often limited to a particular size range ofindividuals and to a particular species. However, to fullyunderstand the cumulative impact of stressors at different lifestages, and how management and restoration actions could impactsalmon populations, we need tools that connect the different lifestages and their environments. For example, the effects of sublethalstress in early life (in rivers) may be manifest much later in the lifecycle.
To overcome these limitations, Pecquerie et al. (Pecquerie et al.,2011) and Nisbet et al. (Nisbet et al., 2011) proposed a full-life-cycle DEB model applicable to all species of Pacific salmon. Thiswork drew on both of the distinctive strengths of Kooijman’s DEBtheory highlighted in the Introduction: the full-life-cycle treatmentand the theory for interspecific comparisons. The modelsupplements the standard model (Tables2 and 3) with a limitednumber of assumptions on anadromy and semelparity. The body-size scaling relationships implied by DEB theory, i.e. theapplication to certain parameters of a zoom factor z (defined inTable2) to express species-specific differences in physiology,capture most variations in life-history traits such as egg size, frysize and fecundity among five species of Pacific salmon: pink(Oncorhynchus gorbuscha), sockeye (O. nerka), coho (O. kisutch),chum (O. keta) and chinook (O. tshawytscha). Initial discrepanciesbetween data and model predictions for one particular species –sockeye – are resolved by adjusting one parameter value, assumingthat sockeye lay eggs in finer substrate beds and that smaller eggsare more adapted to these substrates. This result is particularlyencouraging for the development of a ‘generalized’ Pacific salmonmodel, with a potential method to fill the species-specific data gapand study-species- and population-specific adaptations.
Nisbet et al. (Nisbet et al., 2011) have also worked on modelingone particular species, chinook salmon (O. tshawytscha), with aninitial aim of studying how variations in environmental conditionsaffect age and size of spawning adults. Qualitative examination ofthe intraspecific variations in life-history traits shows that theobserved patterns are also well reproduced. The observation that
fast-growing individuals migrate back to the river to spawn at anearlier age and smaller size than slow-growing individuals (Parkerand Larkin, 1959) is well reproduced. Quantitatively, preliminarysimulation results for chinook broadly agreed with experimentalstudies on chinook growth and development rates, but further workis required on fecundity patterns. Energy loss during upstreammigration is a potential cause of a mismatch of predictions withdata on fecundity.
Overall, the findings support the validity of modeling all thedifferent life stages of a Pacific salmon in a common framework.However, further refinement of chinook model for quantitativemodeling of specific populations requires making a connectionwith existing studies on chinook bioenergetics (e.g. Beer andAnderson, 1997; Madenjian et al., 2004; Petrell and Jones, 2000).As a first step, we compare the overall energy budget establishedfor a 3kg chinook by Petrell and Jones (Petrell and Jones, 2000)with the chinook-specific DEB model presented in Nisbet et al.(Nisbet et al., 2011) following the equations detailed in the fourthsection of this paper (Relating Kooijman’s DEB theory to otherbioenergetic approaches).
For a mean scaled functional response f0.9 (high food level),the model predicts that the mobilization flux is split betweensomatic maintenance (50%), growth (10%), maturity maintenance(11.5%) and allocation to reproductive reserve (28.5%). When wecompare these processes with the bioenergetic model presented byPetrell and Jones (Petrell and Jones, 2000), we find that growth (ofstructure, reserve and reproduction reserve) accounts for 34% ofthe amount of energy ingested. This value is in agreement with the29±6% estimated by Brett and Groves (Brett and Groves, 1979),cited by Petrell and Jones (Petrell and Jones, 2000), for 15 fishspecies.
As in a standard DEB model, the costs of swimming in thesalmon DEB model were considered as part of the maintenancecosts. But to look at specific local river management scenarios,swimming costs need to be detailed. River flow regimes,determined in part by management decisions, impact the earliestand latest life stages because they determine temperature andoxygen supply for embryos, and body temperature and swimmingrequirements (and hence swimming costs) for juveniles that feedand aim to sustain their location in the river. More obviously, flowregimes impact swimming costs of adults that migrate upstream toreach the spawning grounds.
We are considering two approaches for introducing swimmingcosts in a DEB model for Pacific salmon. First, we note that adultsdo not feed during their upstream migration to the spawninggrounds (Armstrong, 2010), which may last several months. Wecould therefore compare the energy expenditure due to totalmaintenance costs and egg production predicted by the salmonDEB at a given temperature for the duration of the migration fornon-feeding individuals with the energy expenditure reported forsockeye salmon during their migration (Cooke et al., 2006a; Cookeet al., 2006b; Cooke et al., 2008; Crossin et al., 2009; Hanson etal., 2008; Rand et al., 2006). Associated costs may depend onelevation gain, flow regime, water temperature and many otherfactors. We need to evaluate whether introducing these factors (andthus adding more complexity to the model) is necessary tounderstand the variations in energy allocated to reproduction aftermigration.
Second, as in the tuna case, we could incorporate theoreticalestimates of swimming costs in the DEB model. Petrell and Jones(Petrell and Jones, 2000), for example, evaluated the drag andpower requirement of swimming for chinook and Atlantic salmon
THE JOURNAL OF EXPERIMENTAL BIOLOGY
900
(Salmo salar) by calculating the drag coefficient and planform areausing body measurements and swimming speed. These authorssuggested that the difference in energy expenditure due to dragcould explain 20% of the observed difference in FCR between thetwo species. To obtain this estimation, they used a classicalbioenergetic approach to evaluate how the growth – in weight, notin structure – is reduced in chinook because of a higher cost ofswimming, largely due to a larger girth compared with an Atlanticsalmon of the same weight, and thus a higher drag. For DEBapplications, it is necessary to interpret the differences in powerrequirement for swimming in terms of structure-specific costs (andnot weight-specific costs). This would allow comparison of budgetsof individuals of the same weight of two different species in theDEB context. Deviations from DEB predictions could then behypothesized as arising from differences in power requirement dueto species-specific body form. Such interpretation would informmore precisely how we transfer parameter values among relatedspecies.
Finally, introducing specific swimming costs in our salmon DEBmodel would allow us to complement environmental flowassessment studies for juvenile salmon. We could potentiallyperform studies similar to that of Hayes et al. (Hayes et al., 2007),who evaluated energy uptake and expenditure in different riverflow regimes for brown trout (Salmo trutta), which requiredmodeling the trade-off between the costs in mechanical energy oflife in high flows and the benefits of enhanced delivery rates offood (drifting invertebrates).
DiscussionKooijman’s DEB theory is emerging as a powerful tool for relatingmetabolic organization within organisms to those aspects ofphysiological performance that impact higher levels of biologicalorganization, especially population dynamics and ecosystemprocesses. But the theory is highly abstract with neither the statevariables nor the internal energy or material fluxes being directlymeasurable. The high level of abstraction acts as a deterrent to itswider use, but is the key to its generality. In this review we haveprovided formulae for common bioenergetic measurements in termsof the state variables and fluxes in a ‘standard’ DEB model. Althoughour examples involve fish, the equations presented here (RelatingKooijman’s DEB theory to other bioenergetic approaches) aregeneral and can be used to interconnect bioenergetic measurementswith DEB variables and fluxes for any animal.
Nisbet et al. (Nisbet et al., 2010) recently reviewed the extent towhich the individual–population connection could be achieved withsimpler, empirically based models where the state of an animal wascharacterized by one variable (size). They concluded thatremarkably simple mass-balance models, well supported byempirical data and resembling those described here as traditionalbioenergetic models, are often adequate for connecting theperformance of a well-studied organism to the history of itsenvironment. But they also highlighted the serious downsides ofsuch pragmatism: (1) the loss of connection to theory describinginterspecific variation in physiological rates, and (2) the parameterrichness of empirically based models for a complete life cycle.
The motivation for the two applications in this paper ofKooijman’s more abstract approach to DEB theory came fromrecognition of these limitations. Each fish model was a variant ofKooijman’s ‘standard’ DEB model (Sousa et al., 2010), and reliedfor parameter estimation on the capacity of DEB theory to offer aunified description of the full life cycle. The salmon study alsoexploits the body-size scaling relationships. The decision to use the
R. M. Nisbet and others
full DEB model in each application was therefore justified, evenon pragmatic grounds. Yet there is a large body of empiricalliterature on the bioenergetics and biomechanics of both speciesthat is constructed around the simpler paradigm. We faced (and stillface) challenges figuring out how to relate these data to the DEBmodels, thereby giving added precision to the models inapplications. In this paper, we made connections that relied on theformulae presented, and identified further issues that must be partof future research.
A more ambitious ecological motivation for better understandingthe interconnections between the different modeling approaches isthat there are some systems where the simplifying assumptions of‘standard’ DEB theory may be invalid. We have already noted thepotential importance of changes in the theory that are required tocover anaerobic processes (Childress and Somero, 1990), and wehave discussed situations where mechanical work represents asignificant contribution to the energy budget. Both situationsrequire extensions of the thermodynamic underpinnings of DEBtheory (Sousa et al., 2006).
Notwithstanding the remaining challenges, our take-homemessage for ecologists is that the rigorous conceptual frameworkoffered by Kooijman’s theory has the potential to allow betterexperimental design, open the door for creative utilization of hard-earned data, and help predict individual growth and reproductionin hitherto unobserved environments. We have tried to demystifythe theory by clarifying the connections to measurementscommonly obtained in physiological ecology. Further case studiesare needed to further sharpen our understanding of the connections;over time, these should in turn lead to improved theory.
AcknowledgementsWe thank Mark Denny for the organization of the symposium on Biophysics,Bioenergetics and Mechanistic Approaches to Ecology in March 2011. We thankBill Gurney, Michael Kearney, Bas Kooijman, Ed McCauley, Erik Muller, TaniaSousa and others for discussions of DEB theory, and for sharing unpublishedwork.
FundingThis work was supported by the US National Science Foundation (grant EF-0742521); NOAA (subaward from NA100AR4320156); the Croatian Ministry forScience, Education and Sport (grant 098-0982934-2719); the US NationalScience Foundation and the US Environmental Protection Agency underCooperative Agreement Number EF 0830117; the Society for Conservation ofFisheries Resources and Marine Environment (CoFRaME), project ʻʻModelingapproach for efficient bluefin tuna aquacultureʼʼ; and The Japanese Ministry ofEducation, Culture, Sports, Science & Technology (MEXT), scholarship no.080755.
ReferencesAguado-Gimenez, F. and Garcia-Garcia, B. (2005). Growth, food intake and feed
conversion rates in captive Atlantic bluefin tuna (Thunnus thynnus Linnaeus, 1758)under fattening conditions. Aquacult. Res. 36, 610-614.
Altringham, J. F. and Ellerby, D. J. (1999). Fish swimming: patterns in musclefunction. J. Exp. Biol. 202, 3397-3403.
Anderson, E. J., McGillis, W. R. and Grosenbaugh, M. A. (2001). The boundarylayer of swimming fish. J. Exp. Biol. 204, 81-102.
Armstrong, J. B. (2010). Comment on “Egg consumption in mature Pacific salmon(Oncorhynchus spp.)”. Can. J. Fish. Aquat. Sci. 67, 2052-2054.
Aydin, K. Y., McFarlane, G. A., King, J. R., Megrey, B. A. and Myers, K. W. (2005).Linking oceanic food webs to coastal production and growth rates of Pacific salmon(Oncorhynchus spp.), using models on three scales. Deep-Sea Res. Part II 52, 757-780.
Ballantyne, A. P., Brett, M. T. and Schindler, D. E. (2003). The importance of dietaryphosphorus and highly unsaturated fatty acids for sockeye (Oncorhynchus nerka)growth in Lake Washington-a bioenergetics approach. Can. J. Fish. Aquat. Sci. 60,12-22.
Barrett, D. S., Triantafyllou, M. S., Yue, D. K. P., Grosenbaugh, M. A. andWolfgang, M. J. (1999). Drag reduction in fish-like locomotion. J. Fluid Mech. 392,183-212.
Beauchamp, D. A., Sergeant, C. J., Mazur, M. M., Scheuerell, J. M., Schindler, D.E., Scheuerell, M. D., Fresh, K. L., Seiler, D. E. and Quinn, T. P. (2004). Spatial-temporal dynamics of early feeding demand and food supply for sockeye salmon fryin Lake Washington. Trans. Am. Fish. Soc. 133, 1014-1032.
THE JOURNAL OF EXPERIMENTAL BIOLOGY
901Dynamic energy budget theory
Beer, W. N. and Anderson, J. J. (1997). Modelling the growth of salmonid embryos.J. Theor. Biol. 189, 297-306.
Bernal, D., Dickson, K. A., Shadwick, R. E. and Graham, J. B. (2001). Analysis ofthe evolutionary convergence for high performance swimming in lamnid sharks andtunas. Comp. Biochem. Physiol. 129A, 695-726.
Blake, R. W. (2004). Fish functional design and swimming performance. J. Fish Biol.65, 1193-1222.
Blank, J. M., Farwell, C. J., Morrissette, J. M., Schallert, R. J. and Block, B. A.(2007). Influence of swimming speed on metabolic rates of juvenile Pacific bluefintuna and yellowfin tuna. Physiol. Biochem. Zool. 80, 167-177.
Boggs, C. H. and J. F., Kitchell (1991). Tuna metabolic rates estimated from energy-losses during starvation. Physiol. Zool. 64, 502-524.
Bohrer, R. N. and Lampert, W. (1988). Simultaneous measurement of the effect offood concentration on assimilation and respiration in Daphnia magna Straus. Funct.Ecol. 2, 463-471.
Borazjani, I. and Sotiropoulos, F. (2010). On the role of form and kinematics on thehydrodynamics of self-propelled body/caudal fin swimming. J. Exp. Biol. 213, 89-107.
Brett, J. R. (1963). Energy required for swimming by young sockeye salmon with acomparison of drag force on a dead fish. Trans. R. Soc. Can. 1, 441-457.
Brett, J. R. and Groves, T. D. D. (1979). Physiological energetics. In Bioenergeticsand Growth, Vol. 8 (ed. W. S. Hoar, D. J. Randall and J. R. Brett), pp. 279-352. NewYork: Academic Press.
Brodeur, R. D., Francis, R. C. and Pearcy, W. G. (1992). Food consumption ofjuvenile coho (Oncorhynchus kisutch) and chinook salmon (O. tshawytscha) on thecontinental shelf off Washington and Oregon. Can. J. Fish. Aquat. Sci. 49, 1670-1685.
Brown, J. H., Gillooly, J. F., Allen, A. P., Savage, V. M. and West, G. B. (2004).Toward a metabolic theory of ecology. Ecology 85, 1771-1789.
Brucker, C. and Bleckmann, H. (2007). Vortex dynamics in the wake of a mechanicalfish. Exp. Fluids 43, 799-810.
Buckley, L. B., Rodda, G. H. and Jetz, W. (2008). Thermal and energetic constraintson ectotherm abundance: a global test using lizards. Ecology 89, 48-55.
Buckley, L. B., Urban, M. C., Angilletta, M. J., Crozier, L. G., Rissler, L. J. andSears, M. W. (2010). Can mechanism inform speciesʼ distribution models? Ecol.Lett. 13, 1041-1054.
Cech, J. J. and Myrick, C. A. (1999). Steelhead and Chinook Salmon Bioenergetics:Temperature, Ration, and Genetic Effects. Technical Completion Report, vol. 885,pp. 74. Davis, CA: University of California Water Resources Center.
Childress, J. J. and Somero, G. N. (1990). Metabolic scaling: a new perspectivebased on scaling of glycolytic enzyme activities. Am. Zool. 30, 161-173.
Chipps, S. R. and Wahl, D. H. (2008). Bioenergetics modeling in the 21st century:reviewing new insights and revisiting old constraints. Trans. Am. Fish. Soc. 137,298-313.
Clark, T. D., Taylor, B. D., Seymour, R. S., Ellis, D., Buchanan, J., Fitzgibbon, Q.P. and Frappell, P. B. (2008). Moving with the beat: heart rate and visceraltemperature of free-swimming and feeding bluefin tuna. Proc. R. Soc. Lond. B 275,2841-2850.
Cooke, S. J., Hinch, S. G., Crossin, G. T., Patterson, D. A., English, K. K., Healey,M. C., Shrimpton, J. M., Van Der Kraak, G. and Farrell, A. P. (2006a).Mechanistic basis of individual mortality in pacific salmon during spawningmigrations. Ecology 87, 1575-1586.
Cooke, S. J., Hinch, S. G., Crossin, G. T., Patterson, D. A., English, K. K.,Shrimpton, J. M., Van der Kraak, G. and Farrell, A. P. (2006b). Physiology ofindividual late-run Fraser River sockeye salmon (Oncorhynchus nerka) sampled inthe ocean correlates with fate during spawning migration. Can J. Fish. Aquat. Sci.63, 1469-1480.
Cooke, S. J., Hinch, S. G., Farrell, A. P., Patterson, D. A., Miller-Saunders, K.,Welch, D. W., Donaldson, M. R., Hanson, K. C., Crossin, G. T., Mathes, M. T. etal. (2008). Developing a mechanistic understanding of fish migrations by linkingtelemetry with physiology, behavior, genomics and experimental biology: aninterdisciplinary case study on adult Fraser River sockeye salmon. Fisheries 33, 321-338.
Crossin, G. T., Hinch, S. G., Cooke, S. J., Cooperman, M. S., Patterson, D. A.,Welch, D. W., Hanson, K. C., Olsson, I., English, K. K. and Farrell, A. P. (2009).Mechanisms influencing the timing and success of reproductive migration in a capitalbreeding semelparous fish species, the sockeye salmon. Physiol. Biochem. Zool. 82,635-652.
Dewar, H., and Graham, J. B. (1994). Studies of tropical tuna swimming performancein a large water tunnel. J. Exp. Biol. 192, 13-31.
Ellerby, D. J. (2010). How efficient is a fish? J. Exp. Biol. 213, 3765-3767.Farrell, A. P. and Steffensen, J. F. (1987). An analysis of the energetic cost of the
branchial and cardiac pumps during sustained swimming in trout. Fish Physiol.Biochem. 4, 73-79.
Fitzgibbon, Q. P., Seymour, R. S., Ellis, D. and Buchanan, J. (2007). The energeticconsequence of specific dynamic action in southern bluefin tuna Thunnus maccoyii.J. Exp. Biol. 210, 290-298.
Hanson, K. C., Cooke, S. J., Hinch, S. G., Crossin, G. T., Patterson, D. A.,English, K. K., Donaldson, M. R., Shrimpton, J. M., Van der Kraak, G. andFarrell, A. P. (2008). Individual variation in migration speed of upriver-migratingsockeye salmon in the Fraser River in relation to their physiological and energeticstatus at marine approach. Physiol. Biochem. Zool. 81, 255-268.
Hayes, J. W., Hughes, N. F. and Kelly, L. H. (2007). Process-based modelling ofinvertebrate drift transport, net energy intake and reach carrying capacity for drift-feeding salmonids. Ecol. Model. 207, 171-188.
Jayne, B. C. and Lauder, G. V. (1994). How swimming fish use slow and fast musclefibers: implications for models of vertebrate muscle recruitment. J. Comp. Physiol. A175, 123-131.
Jusup, M., Klanjscek, T., Matsuda, H. and Kooijman, S. A. L. M. (2011). A full lifecycle bioenergetic model for bluefin tuna. PLoS ONE 6, e21903.
Kearney, M. R., Simpson, S. J., Raubenheimer, D. and Helmuth, B. (2010).Modelling the ecological niche from functional traits. Philos. Trans. R. Soc. Lond. B365, 3469-3483.
Kearney, M. R., Matzelle, A. and Helmuth, B. (2012). Biomechanics meets theecological niche: the importance of temporal data resolution. J. Exp. Biol. 215, 922-933.
Kiceniuk, J. W. and Jones, D. R. (1977). The oxygen transport system in trout(Salmo gairdneri) during sustained exercise. J. Exp. Biol. 69, 247-260.
Kitagawa, T., Kimura, S., Nakata, S. and Yamada, H. (2006). Thermal adaptation ofPacific bluefin tuna Thunnus orientalis to temperate waters. Fish. Sci. 72, 149-156.
Kitagawa, T., Kimura, S., Nakata, S. and Yamada, H. (2007). Why do young Pacificbluefin tuna repeatedly dive to depths through the thermocline? Fish. Sci. 73, 98-106.
Kooijman, S. A. L. M. (1986). Population dynamics on the basis of energy budgets. InThe Dynamics of Physiologically Structured Populations, vol. 68 (ed. J. A. J. Metzand O. Diekmann), pp. 266-297. Berlin: Springer-Verlag.
Kooijman, S. A. L. M. (1993). Dynamic Energy Budgets in Biological Systems: Theoryand Applications in Ecotoxicology. New York: Cambridge University Press.
Kooijman, S. A. L. M. (2000). Dynamic Energy and Mass Budgets in BiologicalSystems. New York: Cambridge University Press.
Kooijman, S. A. L. M. (2001). Quantitative aspects of metabolic organization: adiscussion of concepts. Philos. Trans. R. Soc. Lond. B 356, 331-349.
Kooijman, S. A. L. M. (2010). Dynamic Energy Budget Theory for MetabolicOrganization, 3rd edn. Cambridge, UK: Cambridge University Press.
Kooijman, S. A. L. M., Sousa, T., Pecquerie, L., van der Meer, J. and Jager, T.(2008). From food-dependent statistics to metabolic parameters, a practical guide tothe use of dynamic energy budget theory. Biol. Rev. 83, 533-552.
Korsmeyer, K. E. and Dewar, H. (2001). Tuna metabolism and energetics. FishPhysiol. 19, 35-78.
Korsmeyer, K. E, Dewar, H., Lai, N. C. and Graham, J. B. (1996). The aerobiccapacity of tunas: adaptation for multiple metabolic demands. Comp. Biochem.Physiol. 113A, 17-24.
Korsmeyer, K. E., Steffensen, J. F. and Herskin, J. (2002). Energetics of medianand paired fin swimming, body and caudal fin swimming, and gait transition inparrotfish (Scarus schlegeli) and triggerfish (Rhinecanthus aculeatus). J. Exp. Biol.205, 1253-1263.
Kubo, T., Sakamoto, W., Murata, O. and Kumai, H. (2008). Whole-body heat transfercoefficient and body temperature change of juvenile Pacific bluefin tuna Thunnusorientalis according to growth. Fish. Sci. 74, 995-1004.
Madenjian, C. P., OʼConnor, D. V., Chernyak, S. M., Rediske, R. R. and OʼKeefe, J.P. (2004). Evaluation of a chinook salmon (Oncorhynchus tshawytscha)bioenergetics model. Can. J. Fish. Aquat. Sci. 61, 627-635.
Masuma, S. (2009). Biology of Pacific bluefin tuna inferred from approaches incaptivity. Collect. Vol. Sci. Pap. ICCAT 63, 207-229.
Miyashita, S., Tanaka, Y., Sawada, Y., Murata, O., Hattori, N., Takii, K., Mukai, Y.and Kumai, H. (2000). Embryonic development and effects of water temperature onhatching of the bluefin tuna, Thunnus thynnus. Suisanzoushoku 48, 199-207 (inJapanese).
Miyashita, S., Sawada, Y., Okada, T., Murata, O. and Kumai, H. (2001).Morphological development and growth of laboratory-reared larval and juvenileThunnus thynnus (Pisces: Scombridae). Fish. Bull. 99, 601-616.
Ney, J. J. (1993). Bioenergetics modeling today-growing pains on the cutting edge.Trans. Am. Fish. Soc. 122, 736-748.
Nisbet, R. M., Muller, E. B., Lika, K. and Kooijman, S. A. L. M. (2000). Frommolecules to ecosystems through dynamic energy budget models. J. Anim. Ecol. 69,913-926.
Nisbet, R. M., McCauley, E., Gurney, W. S. C., Murdoch, W. W. and Wood, S. N.(2004). Formulating and testing a partially specified dynamic energy budget model.Ecology 85, 3132-3139.
Nisbet, R. M., McCauley, E. and Johnson, L. R. (2010). Dynamic energy budgettheory and population ecology: lessons from Daphnia. Philos. Trans. R. Soc. Lond.B 365, 3541-3552.
Nisbet, R. M., Anderson, K. E., Pecquerie, L. and Harrison, L. (2011). Integratingbioenergetics, spatial scales, and population dynamics for environmental flowassessment. California Energy Commission, PIER 500-02-004.
Papadopoulos, A. (2008). On the hydrodynamics-based power-law function and itsapplication in fish swimming energetics. Trans. Am. Fish. Soc. 137, 997-1006.
Parker, R. R. and Larkin, P. A. (1959). A concept of growth in fishes. J. Fish. Res.Board Can. 16, 721-745.
Pecquerie, L., Johnson, L. R., Kooijman, S. A. L. M. and Nisbet, R. M. (2011).Analyzing variations in life-history traits of Pacific salmon in the context of dynamicenergy budget (DEB) theory. J. Sea Res. 66, 424-433.
Peng, J. and Dabiri, J. O. (2008). An overview of a Lagrangian method for analysis ofanimal wake dynamics. J. Exp. Biol. 211, 280-287.
Petrell, R. J. and Jones, R. E. (2000). Power requirement of swimming in chinooksalmon and Atlantic salmon and implications for food conversion and growthperformance. Aquacult. Eng. 22, 225-239.
Ponsard, S. and Averbuch, P. (1999). Should growing and adult animals fed on thesame diet show different delta N-15 values? Rapid Commun. Mass Spectrom. 13,1305-1310.
Rand, P. S., Hinch, S. G., Morrison, J., Foreman, M. G. G., MacNutt, M. J.,Macdonald, J. S., Healey, M. C., Farrell, A. P. and Higgs, D. A. (2006). Effects ofriver discharge, temperature, and future climates on energetics and mortality of adultmigrating Fraser River sockeye salmon. Trans. Am. Fish. Soc. 135, 655-667.
Sawada, Y., Okada, T., Miyashita, S., Murata, O. and Kumai, H. (2005). Completionof the Pacific bluefin tuna Thunnus orientalis (Temminck et Schlegel) life cycle.Aquacult. Res. 36, 413-421.
Schultz, W. W. and Webb, P. W. (2002). Power requirements of swimming: do newmethods resolve the old questions? Integr. Comp. Biol. 42, 1018-1025.
THE JOURNAL OF EXPERIMENTAL BIOLOGY
902 R. M. Nisbet and others
Secor, S. M. (2009). Specific dynamic action: a review of the postprandial metabolicresponse. J. Comp. Physiol. B 179, 1-56.
Sepulveda, C. and Dickson, K. A. (2000). Maximum sustainable speeds and cost ofswimming in juvenile kawakawa tuna (Euthynnus affinis) and chub mackerel(Scomber japonicus). J. Exp. Biol. 203, 3089-3101.
Shadwick, R. E. and Syme, D. A. (2008). Thunniform swimming: muscle dynamicsand mechanical power production of aerobic fibres in yellowfin tuna (Thunnusalbacares). J. Exp. Biol. 211, 1603-1611.
Sloman, K. A., Motherwell, G., OʼConnor, K. I. and Taylor, A. C. (2000). The effectof social stress on the standard metabolic rate (SMR) of brown trout, Salmo trutta.Fish Physiol. Biochem. 23, 49-53.
Smith, N. P., Barclay, C. J. and Loiselle, D. S. (2005). The efficiency of musclecontraction. Prog. Biophys. Mol. Biol. 88, 1-58.
Sousa, T., Mota, R., Domingos, T. and Kooijman, S. A. L. M. (2006).Thermodynamics of organisms in the context of dynamic energy budget theory.Phys. Rev. E Stat. Nonlin. Soft Matter Phys. 74, 051951.
Sousa, T., Domingos, T., Poggiale, J. C. and Kooijman, S. A. L. M. (2010).Dynamic energy budget theory restores coherence in biology Introduction. Philos.Trans. R. Soc. Lond. B 365, 3413-3428.
Stewart, D. J. and Ibarra, M. (1991). Predation and production by salmonine fishes inLake Michigan, 1978-88. Can. J. Fish. Aquat. Sci. 48, 909-922.
Syme, D. A. and Shadwick, R. E. (2002). Effects of longitudinal body position andswimming speed on mechanical power of deep red muscle from skipjack tuna(Katsuwonus pelamis). J. Exp. Biol. 205, 189-200.
Triantafyllou, M. S., Techet, A. H., Zhu, Q., Beal, D. N., Hover, F. S. and Yue, D. K.P. (2002). Vorticity control in fish-like propulsion and maneuvering. Integr. Comp.Biol. 42, 1026-1032.
Tytell, E. D. (2007). Do trout swim better than eels? Challenges for estimatingperformance based on the wake of self-propelled bodies. Exp. Fluids 43, 701-712.
Webb, P. W. (1971a). The swimming energetics of trout: I. Thrust and power output atcruising speeds. J. Exp. Biol. 55, 489-520.
Webb, P. W. (1971b). The swimming energetics of trout: II. Oxygen consumption andswimming efficiency. J. Exp. Biol. 55, 521-540.
Webb, P. W. and Cotel, A. J. (2010). Turbulence: does vorticity affect the structureand shape of body and fin propulsors? Integr. Comp. Biol. 50, 1155-1166.
Wolfgang, M. J., Anderson, J. M., Grosenbaugh, M. A., Yue, D. K. P. andTriantafyllou, M. S. (1999). Near-body flow dynamics in swimming fish. J. Exp. Biol.202, 2303-2327.
Zhu, Q., Wolfgang, M. J., Yue, D. K. P. and Triantafyllou, M. S. (2002). Three-dimensional flow structures and vorticity control in fish-like swimming. J. Fluid Mech.468, 1-28.
THE JOURNAL OF EXPERIMENTAL BIOLOGY