Embed Size (px)
DESCRIPTION
Dynamic Energy Budget theory. 1 Basic Concepts 2 Standard DEB model 3 Metabolism 4 Univariate DEB models 5 Multivariate DEB models 6 Effects of compounds 7 Extensions of DEB models 8 Co-variation of par values 9 Living together 10 Evolution 11 Evaluation. - PowerPoint PPT Presentation
Citation preview

Dynamic Energy Budget theory
1 Basic Concepts 2 Standard DEB model 3 Metabolism 4 Univariate DEB models 5 Multivariate DEB models 6 Effects of compounds 7 Extensions of DEB models 8 Co-variation of par values 9 Living together10 Evolution11 Evaluation

Linear pathway 7.1.1
SUi SUi+1
FX ij ,1 PX i
j , FX ij , PX i
j ,1
RX ij ,RX i
j ,1
iXPiXXi PyXyXiiii 111
1
11
0 1100with
i
j XXXPXP
n
iiXP jjiiii
yyyPyX
: Product i : Intermediary metabolite iiP iX
=
If all metabolites would follow the full pathway:

Chain of length 1 7.1.1a
111
111
11111
11111
10
0
11
10
10
ρ1
ρ)θ1(
ρ1θ
/ρθ)θ1(θ
kmj
jkmj
kmj
mjkdt
d
SFX
FXSPX
SFX
SFXChange inUnbounded fractionSteady stateUnbounded fraction
Production flux

Closed handshaking at all nodes 7.1.1b
j
kFXiiiSPX
n
inj
j
kjSjFXi
SFXnnn
SFXiiii
SFX
jkmj
kmj
mjkdt
d
mjkdt
d
mjkdt
d
ii
nn
ii
1k1
11
k1
n
i1
11121
ρ)θθ(
ρ1θ
/ρ)θ1(θ
/ρ)θθ(θ
/ρ)θθ(θ
0
0
1
1
10
Change inUnbounded fractions
Steady stateUnbounded fractions
Production fluxes
1.,,2for ni
1.,,1; ni

Open handshaking at all nodes 7.1.1c
1i
i
11i
i
1
1
1
1
ρ1
ρ)θ1(
ρ1θ
/ρθ)θ1(θ
iSFX
FXiiSPX
iSFXi
SFXiiii
kmj
jkmj
kmj
mjkdt
d
ii
i
ii
ii
ii
Change inUnbounded fractions
Steady stateUnbounded fractions
Production fluxes
ni .,,1For

General handshaking 7.1.1d
PXRX
iiiiPXRX
SXXnnFXPX
SXXiiiiFXPX
SFXnn-n
SFXnn-nn
SFXi
SFXiii
SFXnn-nnnn
SFXiiiiiiii
nn
ii
nnnnn
iiiii
nn
nn
ii
ii
nn
ii
jjjj
mykjjmykjj
mjk
mjkmjk
mjk
mjkdt
d
mjkdt
d
,,
111,,
,,
1,,
,1
,1
i1-i
i1-i1ii
,n1
,1-1i
)ρ))θ1(αθ(1(
)θ1()θ)θ1(α1(
/ρ)α1(
/ραθ
/ρ)α1(
/ρα)θαα1(θ
/ρ))θ1(αθ()θ1(θ
/ρ))θ1(αθ()θ)θ1(α1(θ
1
1
1
1
1
1
1
1Change inUnbounded fractions
Steady stateUnbounded fractions
Production fluxes
Rejection fluxes
1.,,1For ni

Trans-stage feeding strategies 7.2
Juvenile mayflies (Emphemeroptera) cover all adult needs for food; Adult’s digestive system is filled with air
Adult Anoplius viaticus collects all food (here Trochosa terricola) for the juvenile stage of the next generation; the adult feeds on nectar
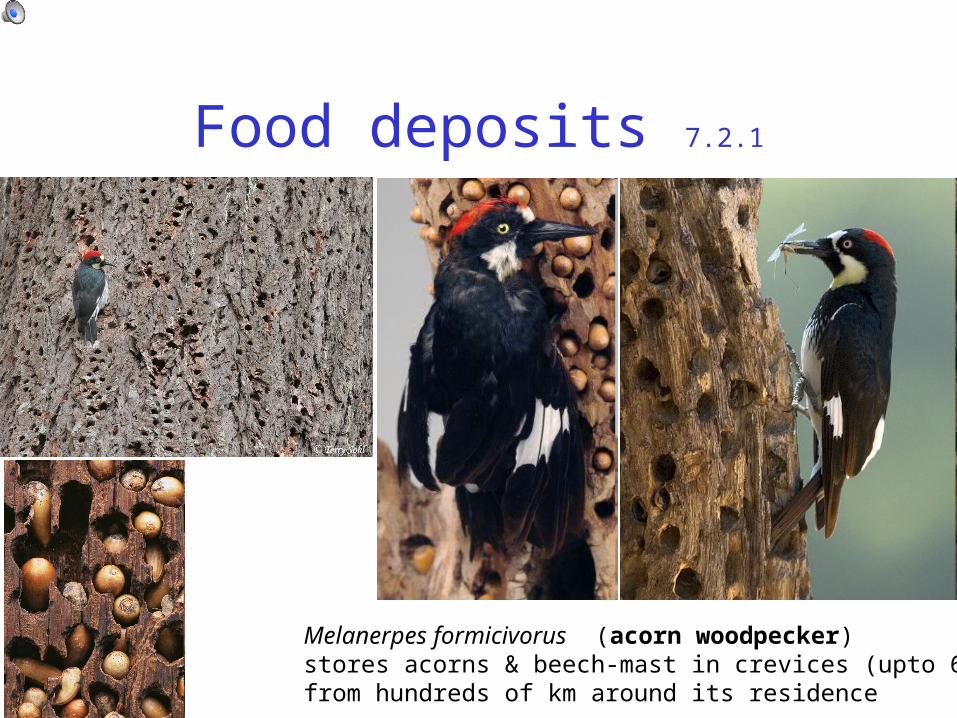
Food deposits 7.2.1
Melanerpes formicivorus (acorn woodpecker)stores acorns & beech-mast in crevices (upto 60000)from hundreds of km around its residence

Farming: external storage 7.2.1a
Ambrosia beetles garden fungi under tree bark, and some have special structures in their head,
mycangia, to transport the fungus
The gardener-nurse caste of leafcutter ants garden fungi under ground, transplanting them onto fresh substrate and weeding out wrong species of fungus
The social amoeba Dictyostelium carries
bacteria in their multi-cellularslug-stage and inoculate fresh stubstrate with them

Fast/slow substrate uptake 7.2.2
DEB-consistent variant of Morel 1987• uptake depends on substrate concentration and reserve density• reserve mobilization independent of uptake
Not yet tested against experimental data

Short vs long-term nutrient uptake 7.2.2a
Morel 1987 on nutrient uptake in algae
Variant that is consistent with DEB/Droop

Satiation-driven feeding 7.2.3
Suppose that satiation s is a system variable which• increases instantaneously with an amount sX
upon feeding on a food particle • decays exponentially at rate kS during starvationFeeding occurs when a food particle arrives, while satiation s(t) < 1The resulting feeding rate is numerically well described by
},min{5/1;
)1ln(;
5/44)(
2
5/4
,,,
,,
,,2
,,,
FmXXFXXFmXX
FmXXFXX
X
SFmX
X
XFmXFmXXFmXX
XFX
JJJsJJ
JJJs
s
kJ
s
JJJJJJ
sJ
Doucet, 2003 The H-response:A satiation-driven functional response (not published)
Extendable to more food types, preferences are set by type-specific satiation thresholds

Functional surface area 7.2.5
Heliozoans and foraminiferans have threat-like extensions of protoplasm on which they take up food particles
functional surface area depends on feeding rate relative to ratio of moving rate and thickness of stagnant water mantle

Diffusion limitation 7.2.5b
distance from membrane
subs
trat
e co
ncen
trat
ion
0
20
0
0,,
42
1
KXX
XKXXX
XK
XJJ
c
cc
FmXFX
Uptake rate:
0,KK saturation constants
0, XX substrate conc., - at membr
FmXJ , max uptake rate
XXKK 00
0
XXKK 00 ,generally:
mantle thickness

External digestion 7.2.6
Yie
ld m
etab
on
enzy
me
time, h
conc
enz
yme,
met
ab
distance from cell, mm distance from cell, mm
solitary feedingsocial feeding
social
feedingstrategy
solitary
intracellular
metabprofilet = ∞
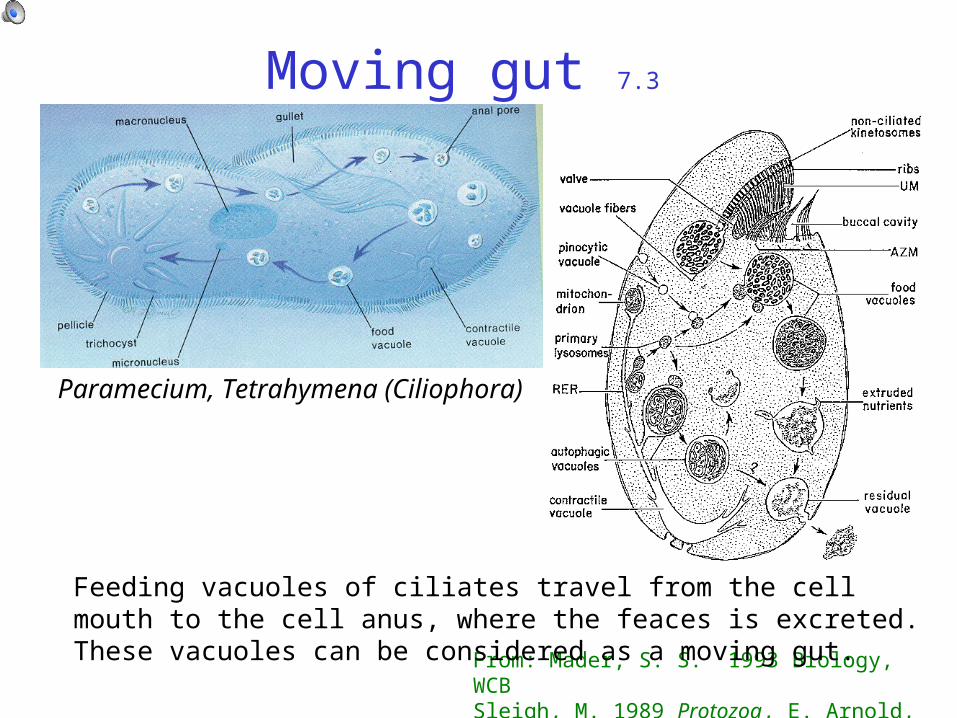
Moving gut 7.3
From: Mader, S. S. 1993 Biology, WCBSleigh, M. 1989 Protozoa, E. Arnold, London
Feeding vacuoles of ciliates travel from the cell mouth to the cell anus, where the feaces is excreted. These vacuoles can be considered as a moving gut.
Paramecium, Tetrahymena (Ciliophora)

Digestive system 7.3a
time
inpu
t, ou
tput
time
inpu
t, ou
tput
time
inpu
t, ou
tput
completely stirred reactor
plugflow reactor
both reactors in series
stomach model
gut model
Stomach• good in buffering• residence times exponentially distributed many short times, few large ones
Gut• bad in buffering• residence time constant digestion requires some time
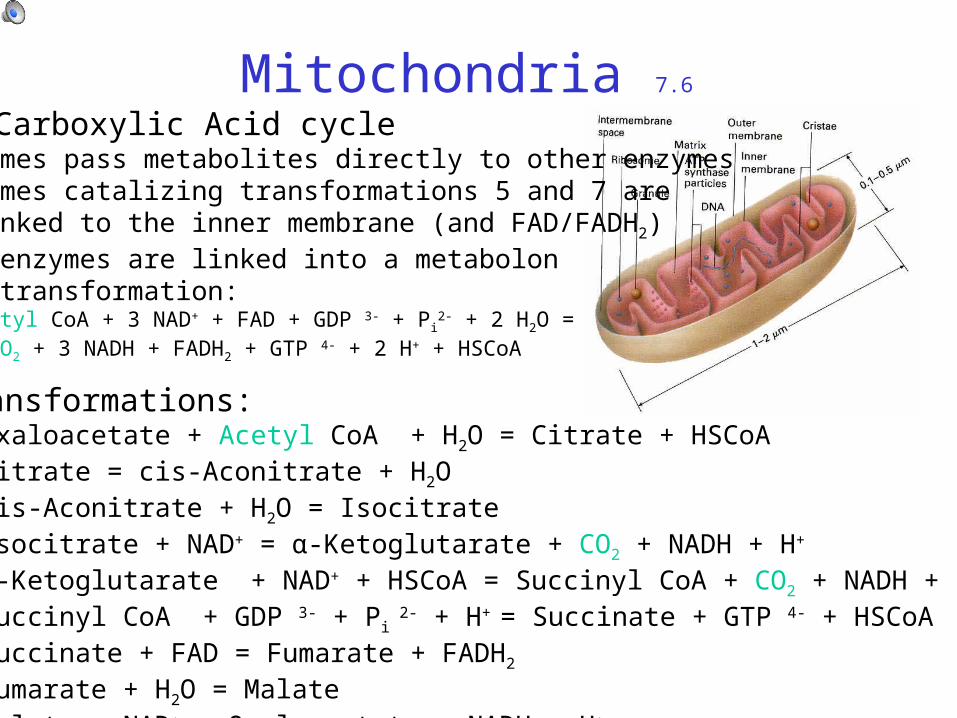
Mitochondria 7.6
Transformations:1 Oxaloacetate + Acetyl CoA + H2O = Citrate + HSCoA2 Citrate = cis-Aconitrate + H2O3 cis-Aconitrate + H2O = Isocitrate4 Isocitrate + NAD+ = α-Ketoglutarate + CO2 + NADH + H+
5 α-Ketoglutarate + NAD+ + HSCoA = Succinyl CoA + CO2 + NADH + H+
6 Succinyl CoA + GDP 3- + Pi 2- + H+ = Succinate + GTP 4- + HSCoA
7 Succinate + FAD = Fumarate + FADH2
8 Fumarate + H2O = Malate9 Malate + NAD+ = Oxaloacetate + NADH + H+
TriCarboxylic Acid cycleEnzymes pass metabolites directly to other enzymesEnzymes catalizing transformations 5 and 7 are linked to the inner membrane (and FAD/FADH2)All enzymes are linked into a metabolonNet transformation: Acetyl CoA + 3 NAD+ + FAD + GDP 3- + Pi
2- + 2 H2O = 2 CO2 + 3 NADH + FADH2 + GTP 4- + 2 H+ + HSCoA

Dilemma of pathway enzymes 7.6b
Many metabolites have a dual function: • building block for synthesis of functional units• substrate to generation of energy (ATP) or reducing power (NADH, NADPH)
Cell’s need for building blocks depends on variable growth rate
Problem:How is cell’s need “known” by enzyme molecules of pathway?
Example of competing needs: growth versus maintenance
Kooijman & Segel 2005 How growth affects the fate of cellular substrates. Bull Math Biol 67: 57-77

Pathway whole cell 7.6c
GiXP
n
iiXX
n
i
MiXP
n
iiXX
n
i
XPyXy
XPyXy
GiGi
MiMi
111
111
1
1
Fixed stoichiometries for maintenance and growth
Variable overall stoichiometry
GXXMXX XYXYXGM 000
)/(1;
/10
0
0
0 ryj
yY
jry
yY
EVEM
XXXX
EMEV
XXXX
G
G
M
M
Can a model for pathway kinetics give this result?

Constraints on pathway dynamics 7.6d
ryjyjryjyj
PVXME
PEXPX
VXMEEXRX
iii
iii
,,
,,
Amount of SU i per mol of structure:
)( ,, 00ryjnj EVMEEXFX
Supply flux to pathway:
VSEESS iiinmnm
VSES
EX
E
VXEX
ME
PXRX
i
i
ii
ii
ii
nnnm
yyrj
jjSX
,
,
,,
0
,
,
metabolite ienzyme irejection, production fluxspec maintenance fluxspec growth rateyield coefficients (fixed)reserve density ME/MV
abundance of X0 in Eabundance of Si in E, V
Requirements by cell for maintenance and growth:

Pathways & allocation 7.6e
rese
rve
rese
rvere
serve
ma
inten
ance
ma
inten
ance
ma
inten
ance
structure structure
structure
Mixture of products &intermediary metabolites
that is allocated tomaintenance (or growth)has constant composition
Kooijman & Segel 2005

Diauxic growth 7.9.4a
time, h
biom
ass
conc
., O
D43
3
acetate
oxalate
Sub
stra
te c
onc.
, mM
Growth of acetate-adapted Pseudomonas oxalaticus OX1data from Dijkhuizen et al 1980
SU-based DEB curves fitted by Bernd Brandt
Adaptation todifferent substratesis controlled by:
enzyme turnover 0.15 h-1
preference ratio 0.5
cells
Brandt, 2002PhD thesisVU, Amsterdam

Numerical matching for n=4 7.6f
Pro
duct
flux
Re
ject
ed fl
ux
Un
bou
nd
fra
ctio
n = 0.73, 0.67, 0.001, 0.27 handshaking = 0.67, 0.91, 0.96, 0.97 binding probk = 0.12, 0.19, 0.54, 0.19 dissociation nSE = 0.032,0.032,0.032,0.032 # in reservenSV = 0.045,0.045,0.045,0.045 # in structureyEV = 1.2 res/struct kE = 0.4 res turnover jEM = 0.02 maint flux n0E = 0.05 sub in res
0
0
1
1
1
2
2
23
3
3
4
4
Spec growth rate
Spec growth rate

Matching pathway whole cell 7.6g
No exact match possible between production of products and intermediary metabolites by pathway and requirements by the cell
But very close approximation is possible by tuning abundance parameters and/or binding and handshaking parameters
Good approximation requires all four tuning parameters per node growth-dependent reserve abundance plays a key role in tuning
VSES iinn ,
ii αρ ,
Kooijman and Segel 2005

Aging in adult insects 7.8.1
age after eclosion, d age after eclosion, d age after eclosion, d
surv
ivin
g nu
mbe
r
surv
ivin
g nu
mbe
r
# of
egg
s/be
etle
, d-1
Drosophila melanogaster Notiophilus biguttatus
Data: Rose 1984Data: Ernsting & Isaaks, 1991
High food, 20/10 °C 0.63 a-2
High food, 10 °C 0.547 a-2
Low food, 20/10 °C 0.374 a-2
:
)(2
)(
30
0 0 12230
21
glκ
eh
dtdttRglκ
ehkh
tth
R
a
t t
R
aMa
survival based onobserved reproductionNo growth
R
glκ
ehkh
tth
R
aMa 3
02
2)(
initialrandom
mort
WeibullModel=3

Anchovy Engraulis encrasicolus 7.8.2
time, d
leng
th,
cm 0.16 cm 0.22 cm
0.4 cm
0.9 cm
1.2 cm
>4 cm
embryo
Pecquerie 2008PhD thesis VU A’dam

Adaptation 7.9.3
glucose, mg/l glucose, mg/l
spec
ific
grow
th r
ate,
h-1
“wild type”Schulze & Lipe, 1964
glucose-adaptedSenn, 1989
Glucose-limited growth of Escherichia coli
70 mg/l 0.06 mg/l
max
.5 max
many types of carriers only carriers for glucose

Adaptation 7.9.4
)(1)()0(1)0(
)(
)(
;
;
;
tκtκκκ
κfwκfκ
fwκhrκ
dt
d
κfwκfκ
fκhrκ
dt
d
KS
SfXfκYrS
dt
dKS
SfXfκYrS
dt
d
rfκrfκrrXXdt
d
ABAB
BBBAA
BBB
ABBAA
AAA
BB
BBBBBXBmB
AA
AAAAAXAmA
BmBBAmAA
Batch culture, Monod special case Model elements:• uptake of substrate by specific carriers• carrier densities nA and nB
• metabolic signals from uptake fini
• relative signal sA = pA fAnA/i pi fini
• carrier production by SUs that are fed by relative signals that inhibit reciprocally• carriers have a common turnover rate
Result:Expression fraction 0 asymptotically in absence of substrate
Xi
i
i
i
YKfSX
whκrr
i
im
biomass densitysubstrate i concscaled func responsesaturation coeff for iyield of biom on substr
spec growth ratemax spec growth rate on iexpression fraction for icarrier turnover ratepreference ratio
Brandt et al, 2004Water Research,38, 1003 - 1013

Diauxic growth 7.9.4b
biom
ass
conc
., O
D59
0
Growth of succinate-adapted Azospirillum brasilenseintracellular amounts followed with radio labels
data from Mukherjee & Ghosh 1987
Adaptation todifferent substratesis controlled by:
enzyme turnover 0.7 h-1
preference ratio 0.8
time, h
fruc
tose
con
c, m
M
succ
inat
e co
nc, m
M
succinate
fructose cells
suc in cells
fruc in cells
Brandt, 2002PhD thesisVU, Amsterdam

Adaptation in degradation 7.9.4.c
time, h time, h
Kooijman & Troost 2007Biol Rev 82: 1-30
conc
entr
atio
n, g
/l
conc
entr
atio
n, g
/l
-- E. coli-- fumarate-- pyruvate
-- E. coli-- fumarate-- glucose
Active pyruvate carriers suppress expression of fumarate carriers
Active glucose carriers don’t suppress expression of fumarate carriers
Dynamic Energy Budget theory
1 Basic Concepts 2 Standard DEB model 3 Metabolism 4 Univariate DEB models 5 Multivariate DEB models 6 Effects of compounds 7 Extensions of DEB models 8 Co-variation of par values 9 Living together10 Evolution11 Evaluation