Embed Size (px)
Citation preview
ERCOT Monthly Operational Overview (February 2014) ERCOT Public March 15, 2014

Grid Operations & Planning
ERCOT Public 3
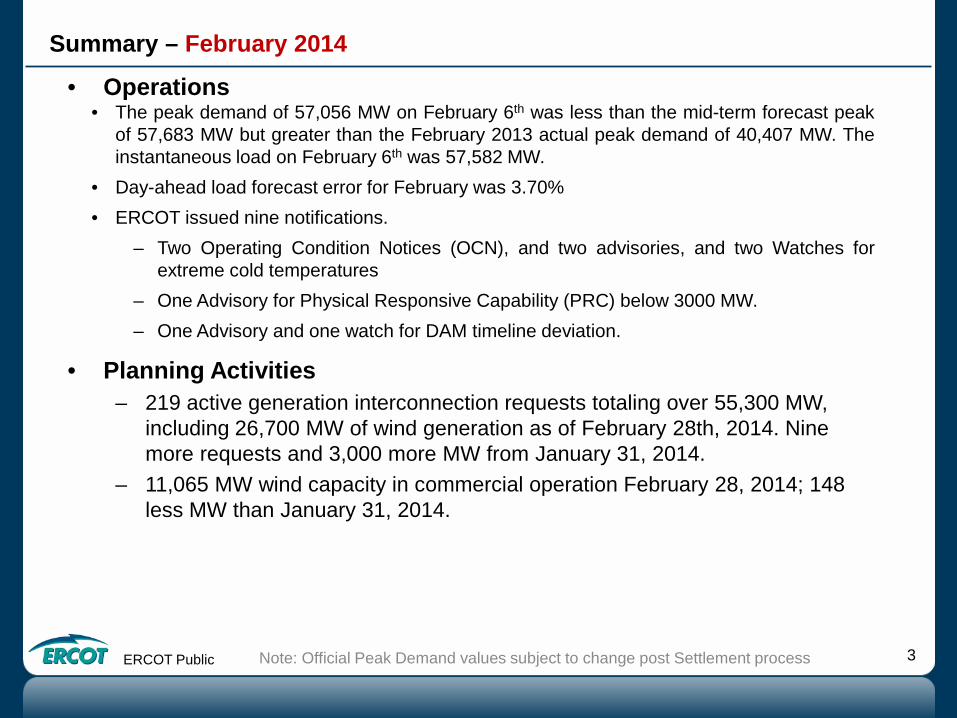
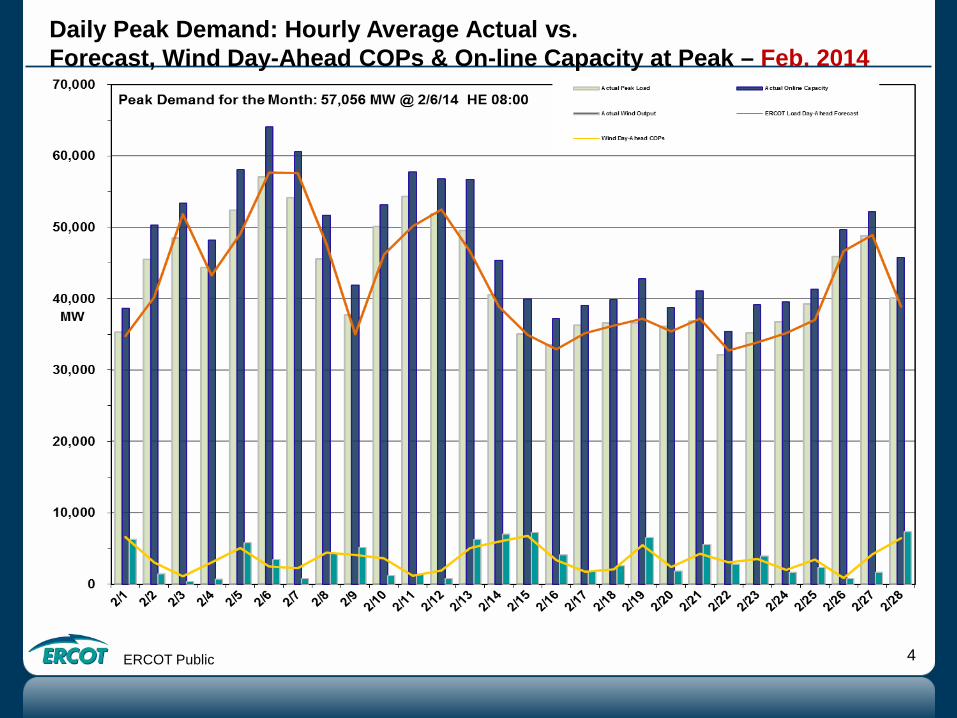
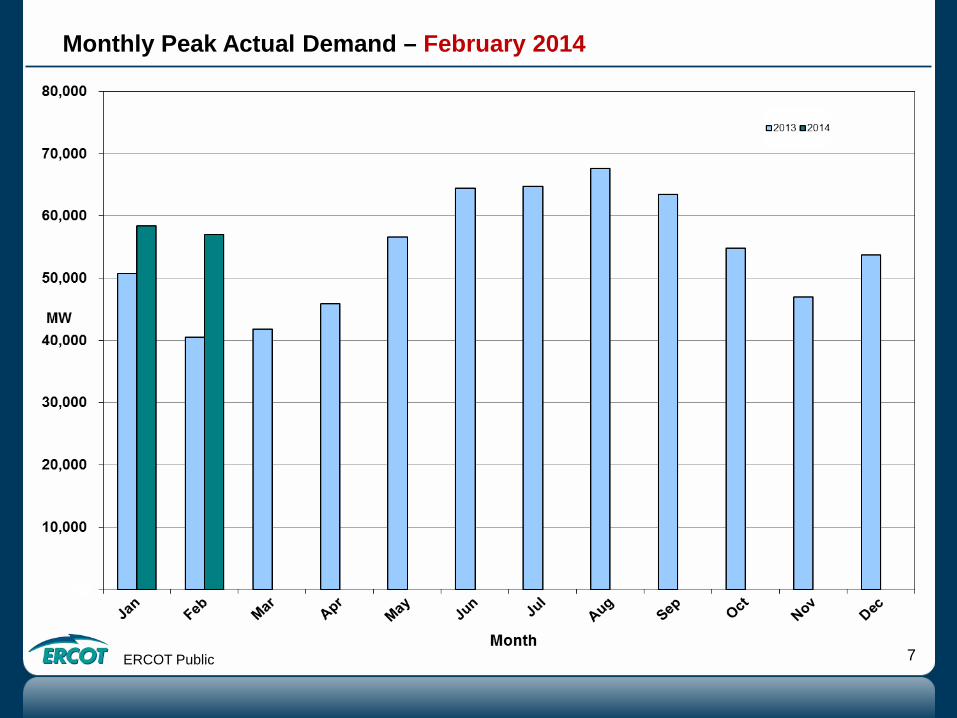
• Operations • The peak demand of 57,056 MW on February 6th was less than the mid-term forecast peak
of 57,683 MW but greater than the February 2013 actual peak demand of 40,407 MW. The instantaneous load on February 6th was 57,582 MW.
• Day-ahead load forecast error for February was 3.70% • ERCOT issued nine notifications.
– Two Operating Condition Notices (OCN), and two advisories, and two Watches for extreme cold temperatures
– One Advisory for Physical Responsive Capability (PRC) below 3000 MW. – One Advisory and one watch for DAM timeline deviation.
• Planning Activities – 219 active generation interconnection requests totaling over 55,300 MW,
including 26,700 MW of wind generation as of February 28th, 2014. Nine more requests and 3,000 more MW from January 31, 2014.
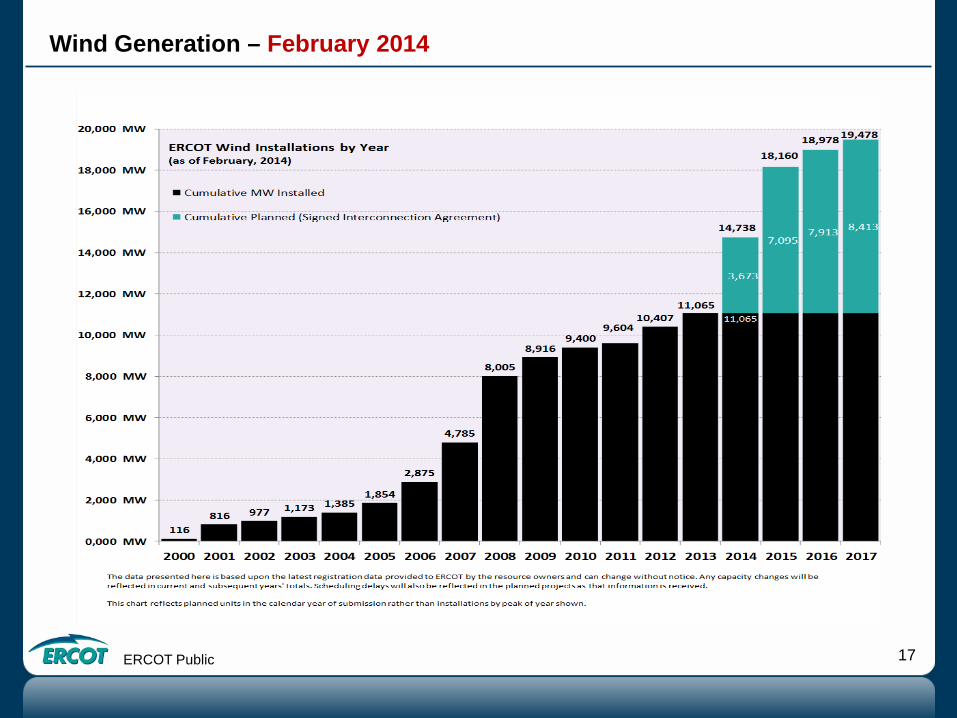
– 11,065 MW wind capacity in commercial operation February 28, 2014; 148 less MW than January 31, 2014.
Summary – February 2014
Note: Official Peak Demand values subject to change post Settlement process
ERCOT Public 4
Daily Peak Demand: Hourly Average Actual vs. Forecast, Wind Day-Ahead COPs & On-line Capacity at Peak – Feb. 2014
ERCOT Public 5
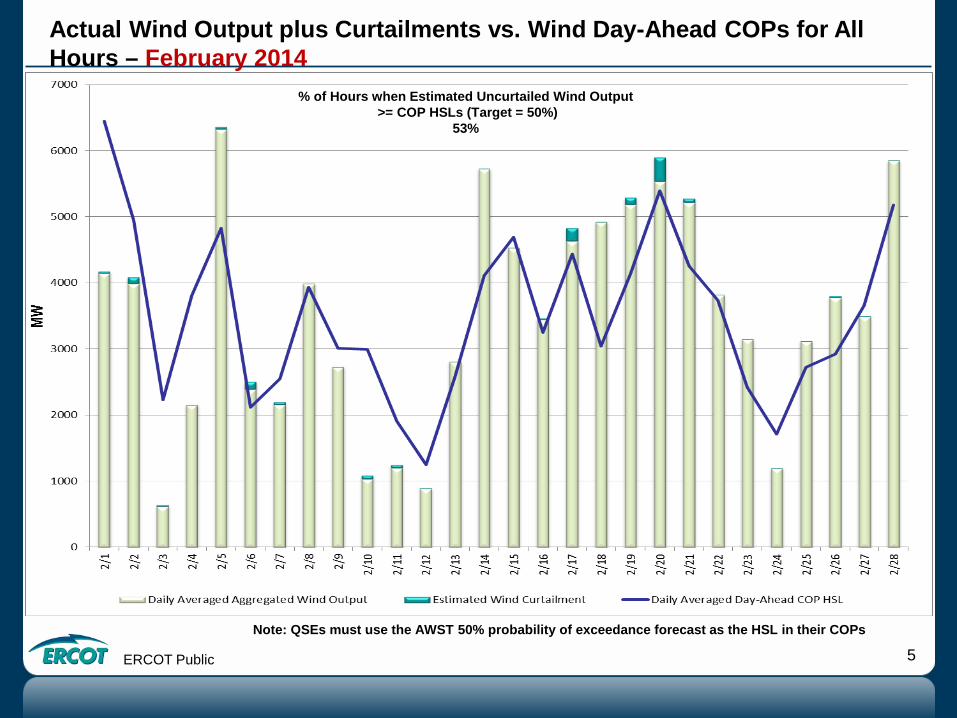
Actual Wind Output plus Curtailments vs. Wind Day-Ahead COPs for All Hours – February 2014
Note: QSEs must use the AWST 50% probability of exceedance forecast as the HSL in their COPs
% of Hours when Estimated Uncurtailed Wind Output >= COP HSLs (Target = 50%)
53%
ERCOT Public 6
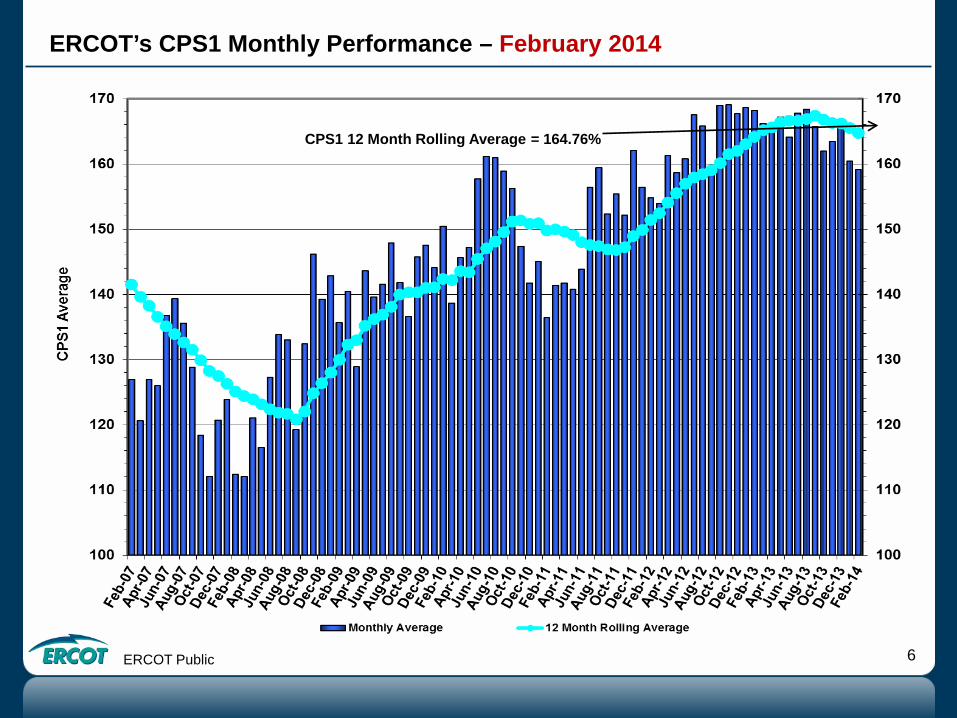
ERCOT’s CPS1 Monthly Performance – February 2014
CPS1 12 Month Rolling Average = 164.76%
ERCOT Public 7
Monthly Peak Actual Demand – February 2014
ERCOT Public 8
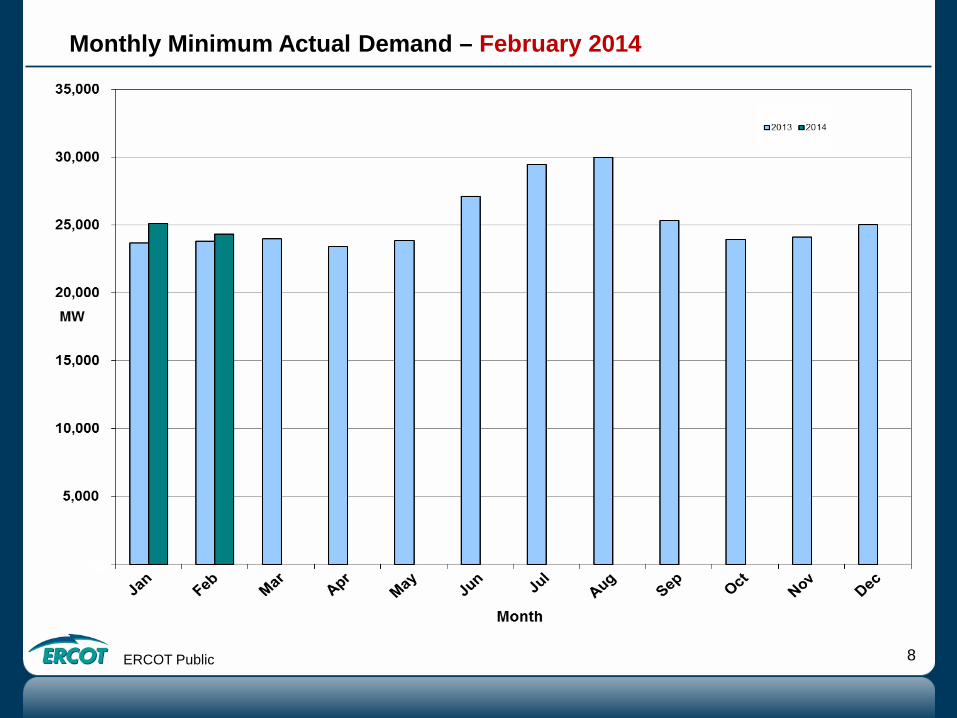
Monthly Minimum Actual Demand – February 2014
ERCOT Public 9
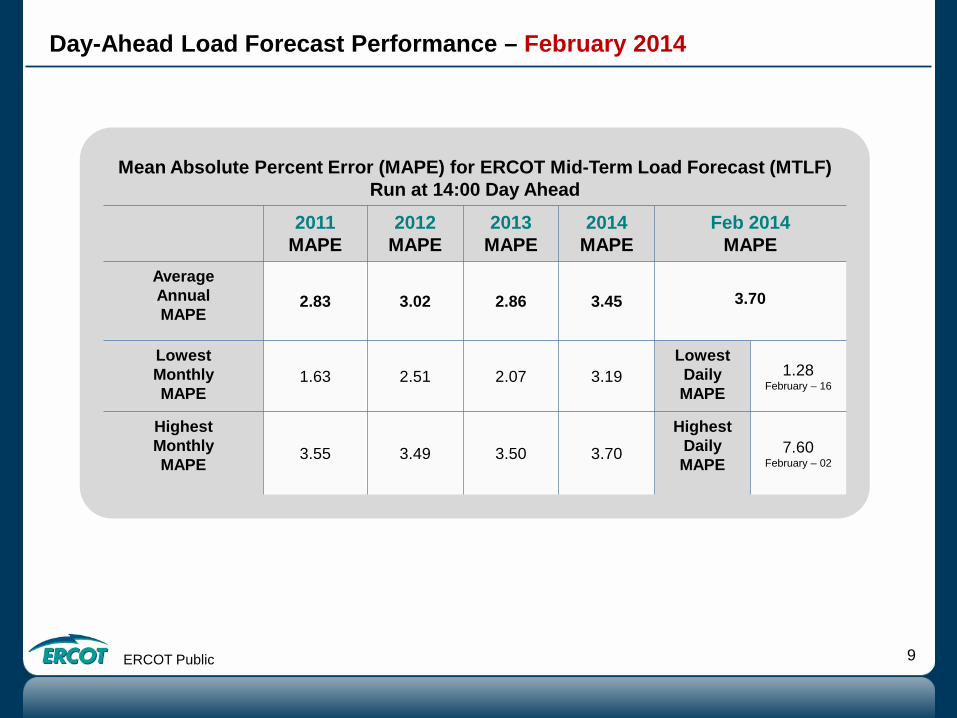
Day-Ahead Load Forecast Performance – February 2014
Mean Absolute Percent Error (MAPE) for ERCOT Mid-Term Load Forecast (MTLF) Run at 14:00 Day Ahead
2011 MAPE
2012 MAPE
2013 MAPE
2014 MAPE
Feb 2014 MAPE
Average Annual MAPE
2.83 3.02 2.86 3.45
3.70
Lowest Monthly MAPE
1.63 2.51 2.07 3.19 Lowest Daily MAPE
1.28 February – 16
Highest Monthly MAPE
3.55 3.49 3.50 3.70
Highest Daily MAPE
7.60
February – 02
ERCOT Public 10
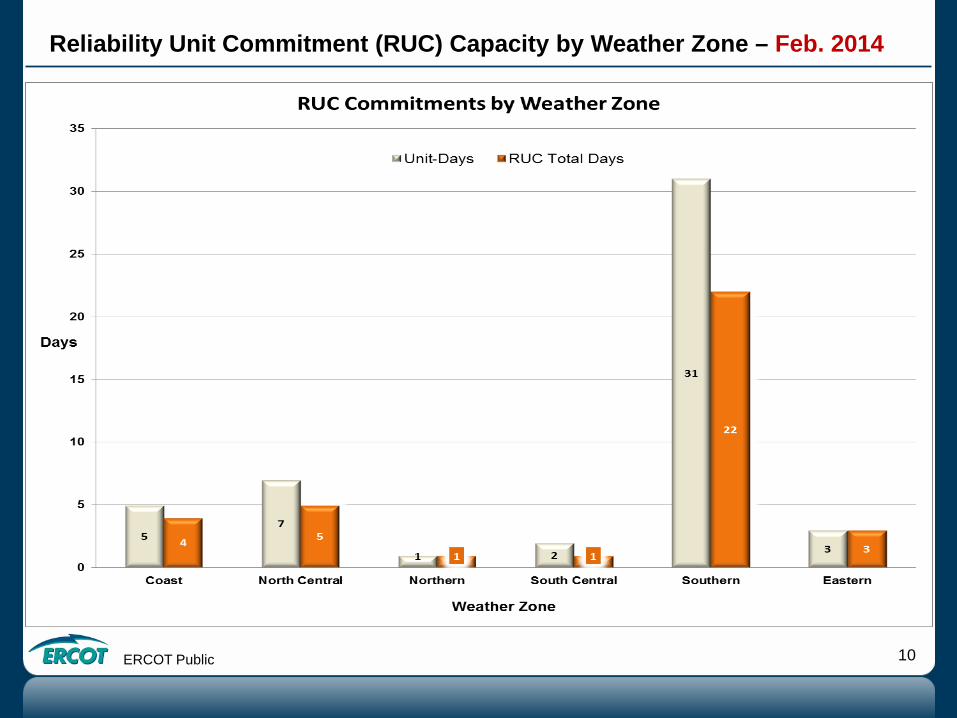
Reliability Unit Commitment (RUC) Capacity by Weather Zone – Feb. 2014
ERCOT Public 11
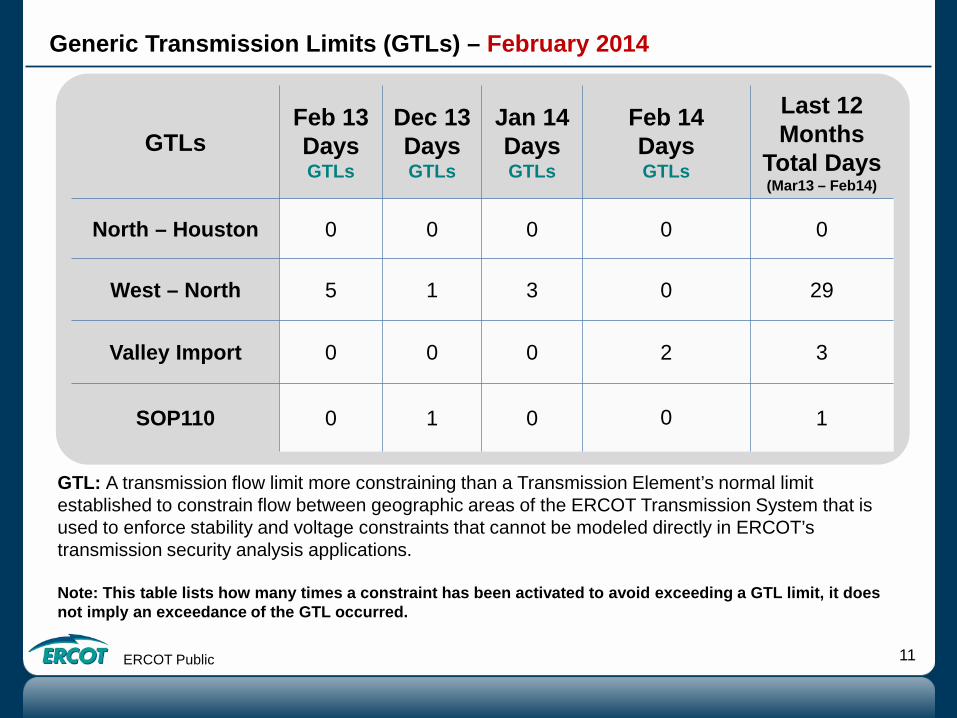
Generic Transmission Limits (GTLs) – February 2014
GTL: A transmission flow limit more constraining than a Transmission Element’s normal limit established to constrain flow between geographic areas of the ERCOT Transmission System that is used to enforce stability and voltage constraints that cannot be modeled directly in ERCOT’s transmission security analysis applications. Note: This table lists how many times a constraint has been activated to avoid exceeding a GTL limit, it does not imply an exceedance of the GTL occurred.
GTLs Feb 13 Days GTLs
Dec 13 Days GTLs
Jan 14 Days GTLs
Feb 14 Days GTLs
Last 12 Months
Total Days (Mar13 – Feb14)
North – Houston 0 0 0 0 0
West – North 5 1 3 0 29
Valley Import 0 0 0 2 3
SOP110 0 1 0
0
1
ERCOT Public 12
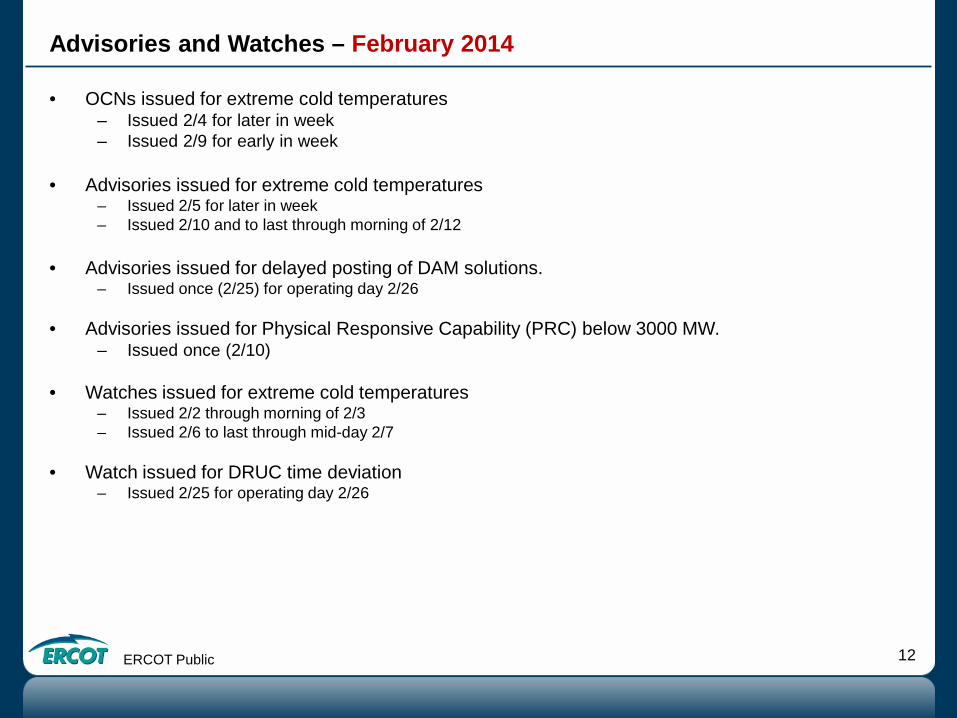
• OCNs issued for extreme cold temperatures – Issued 2/4 for later in week – Issued 2/9 for early in week
• Advisories issued for extreme cold temperatures
– Issued 2/5 for later in week – Issued 2/10 and to last through morning of 2/12
• Advisories issued for delayed posting of DAM solutions.
– Issued once (2/25) for operating day 2/26
• Advisories issued for Physical Responsive Capability (PRC) below 3000 MW. – Issued once (2/10)
• Watches issued for extreme cold temperatures
– Issued 2/2 through morning of 2/3 – Issued 2/6 to last through mid-day 2/7
• Watch issued for DRUC time deviation
– Issued 2/25 for operating day 2/26
Advisories and Watches – February 2014
ERCOT Public 13
Significant Events – February 2014
• Conservation in Lower Rio Grande Valley (February 6 - 7)
– Increase demand due to cold weather – ERCOT and TSP managing to a lower Generic Transmission Limit – Need for public appeal for energy conservation in Lower Rio Grande Valley
ERCOT Public 14
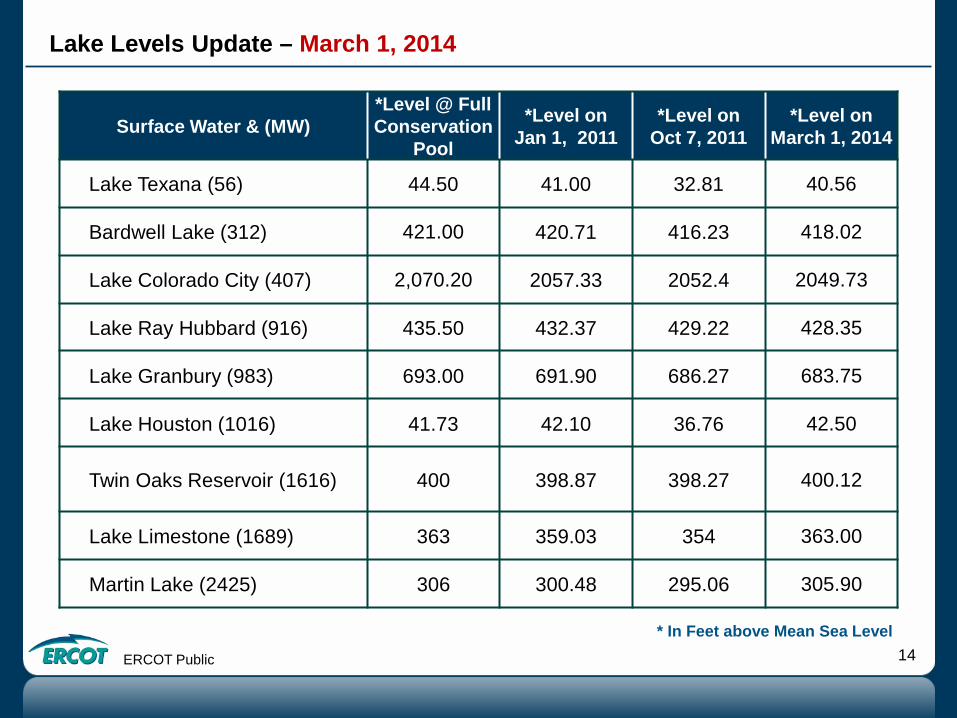
Lake Levels Update – March 1, 2014
Surface Water & (MW) *Level @ Full Conservation
Pool
*Level on Jan 1, 2011
*Level on Oct 7, 2011
*Level on March 1, 2014
Lake Texana (56) 44.50 41.00 32.81 40.56
Bardwell Lake (312) 421.00 420.71 416.23 418.02
Lake Colorado City (407) 2,070.20 2057.33 2052.4 2049.73
Lake Ray Hubbard (916) 435.50 432.37 429.22 428.35
Lake Granbury (983) 693.00 691.90 686.27 683.75
Lake Houston (1016) 41.73 42.10 36.76 42.50
Twin Oaks Reservoir (1616) 400 398.87 398.27 400.12
Lake Limestone (1689) 363 359.03 354 363.00
Martin Lake (2425) 306 300.48 295.06 305.90
* In Feet above Mean Sea Level
ERCOT Public 15
Planning Summary – February 2014
• ERCOT is currently tracking 219 active generation interconnection requests totaling over 55,300 MW. This includes over 26,700 MW of wind generation.
• ERCOT is currently reviewing proposed transmission improvements with a total cost of $917.7 Million.
• Transmission Projects endorsed in 2013 total $349.8 Million. No transmission projects endorsed in 2014 (January & February 2014).
• All projects (in engineering, routing, licensing and construction) total approximately $4.4 Billion.
• Transmission Projects energized in 2014 total about $123.3 Million.
ERCOT Public 16
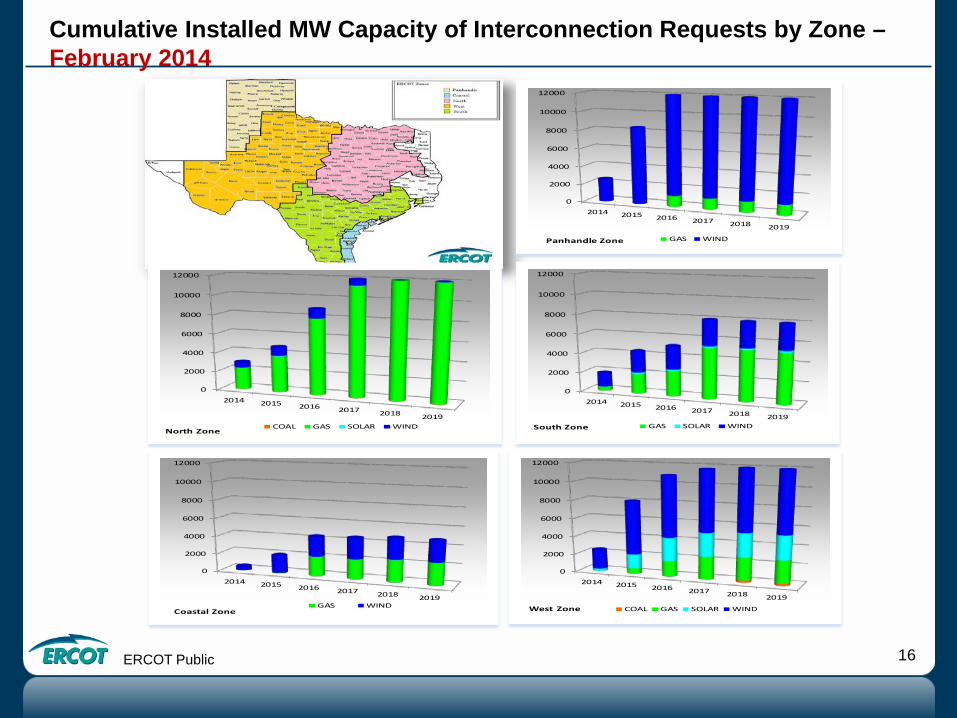
Cumulative Installed MW Capacity of Interconnection Requests by Zone – February 2014
0
2000
4000
6000
8000
10000
12000
2014 2015 2016 2017 2018 2019
GAS WINDPanhandle Zone
0
2000
4000
6000
8000
10000
12000
2014 2015 2016 2017 2018 2019COAL GAS SOLAR WIND
North Zone
0
2000
4000
6000
8000
10000
12000
2014 2015 2016 2017 2018 2019GAS SOLAR WINDSouth Zone
0
2000
4000
6000
8000
10000
12000
2014 2015 2016 2017 2018 2019GAS WIND
Coastal Zone
0
2000
4000
6000
8000
10000
12000
2014 2015 2016 2017 2018 2019
COAL GAS SOLAR WINDWest Zone
ERCOT Public 17
Wind Generation – February 2014
ERCOT Public 18
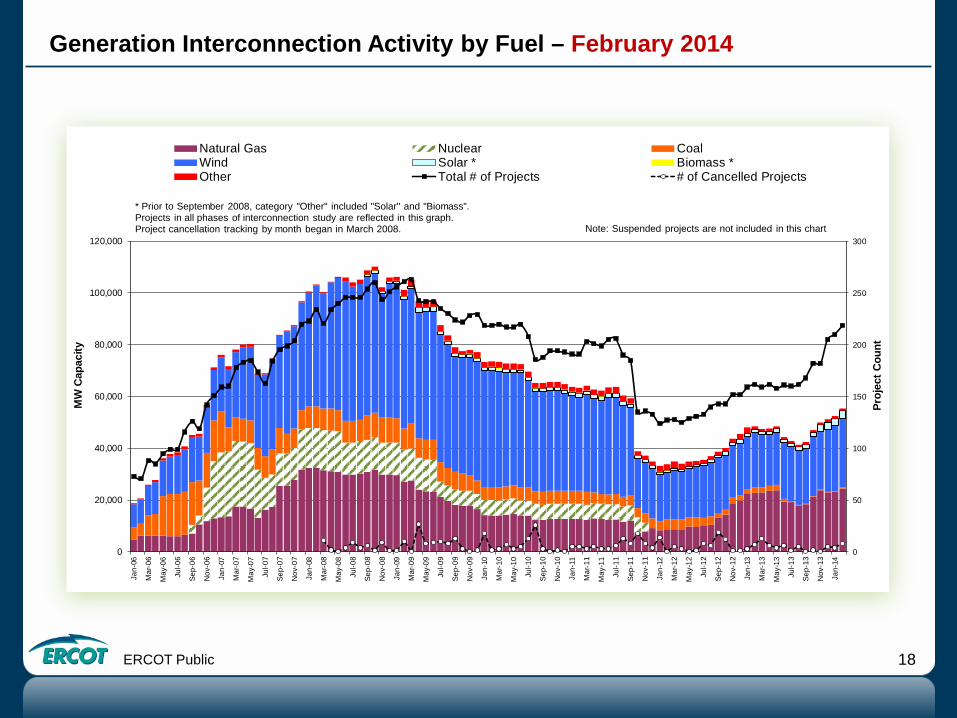
Generation Interconnection Activity by Fuel – February 2014
0
50
100
150
200
250
300
0
20,000
40,000
60,000
80,000
100,000
120,000
Jan-
06
Mar
-06
May
-06
Jul-0
6
Sep-
06
Nov
-06
Jan-
07
Mar
-07
May
-07
Jul-0
7
Sep-
07
Nov
-07
Jan-
08
Mar
-08
May
-08
Jul-0
8
Sep-
08
Nov
-08
Jan-
09
Mar
-09
May
-09
Jul-0
9
Sep-
09
Nov
-09
Jan-
10
Mar
-10
May
-10
Jul-1
0
Sep-
10
Nov
-10
Jan-
11
Mar
-11
May
-11
Jul-1
1
Sep-
11
Nov
-11
Jan-
12
Mar
-12
May
-12
Jul-1
2
Sep-
12
Nov
-12
Jan-
13
Mar
-13
May
-13
Jul-1
3
Sep-
13
Nov
-13
Jan-
14
Proj
ect C
ount
MW
Cap
acity
Natural Gas Nuclear CoalWind Solar * Biomass *Other Total # of Projects # of Cancelled Projects
* Prior to September 2008, category "Other" included "Solar" and "Biomass".Projects in all phases of interconnection study are reflected in this graph.Project cancellation tracking by month began in March 2008. Note: Suspended projects are not included in this chart
ERCOT Public 19
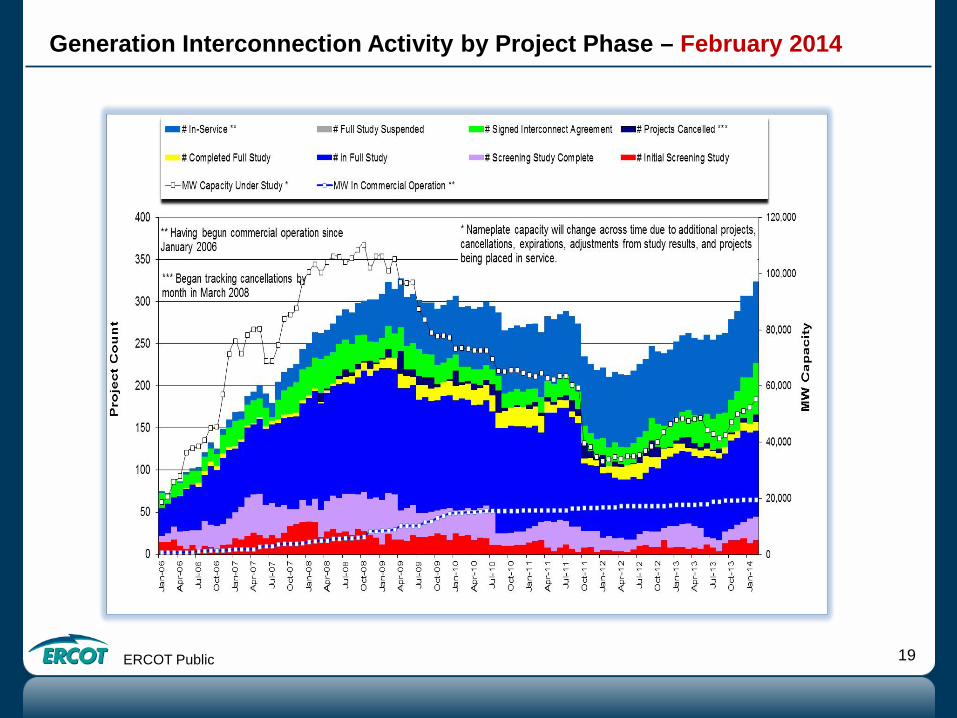
Generation Interconnection Activity by Project Phase – February 2014

Market Operations
ERCOT Public 21
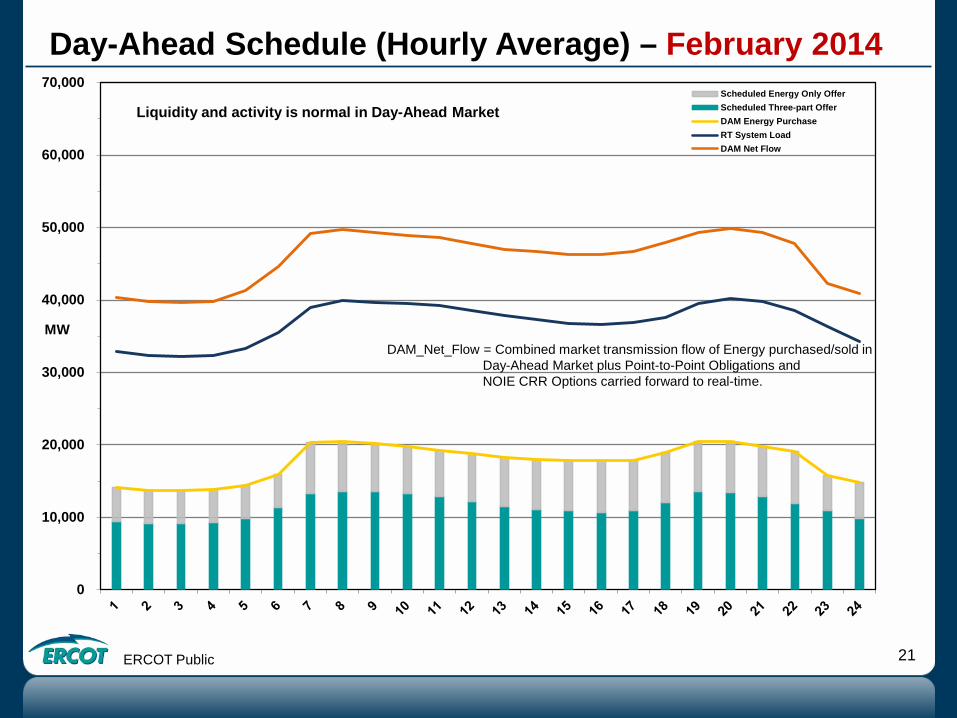
Day-Ahead Schedule (Hourly Average) – February 2014
0
10,000
20,000
30,000
40,000
50,000
60,000
70,000
MW
Scheduled Energy Only OfferScheduled Three-part OfferDAM Energy PurchaseRT System LoadDAM Net Flow
Liquidity and activity is normal in Day-Ahead Market
DAM_Net_Flow = Combined market transmission flow of Energy purchased/sold in Day-Ahead Market plus Point-to-Point Obligations and NOIE CRR Options carried forward to real-time.
ERCOT Public 22
0
20
40
60
80
100
120
140
160
180
200
220
240
260
280
300
Pric
e ($
/MW
h)
Regulation Up
Regulation Down
Responsive Reserve
Non Spinning Reserve
DAM Power Balance Price(System Lambda)
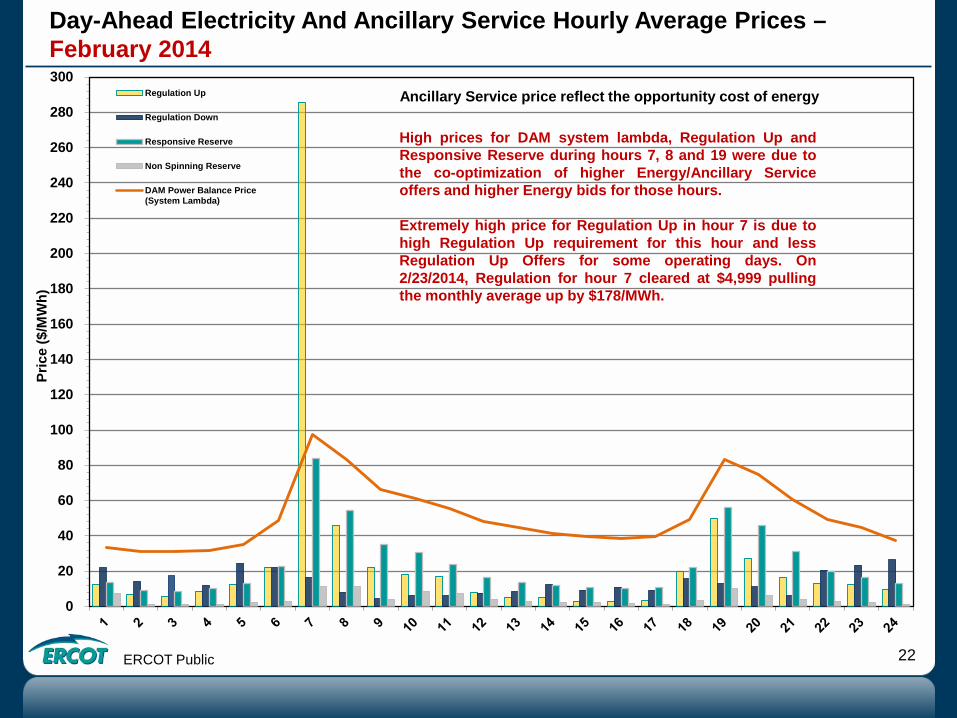
Ancillary Service price reflect the opportunity cost of energy
Day-Ahead Electricity And Ancillary Service Hourly Average Prices – February 2014
High prices for DAM system lambda, Regulation Up and Responsive Reserve during hours 7, 8 and 19 were due to the co-optimization of higher Energy/Ancillary Service offers and higher Energy bids for those hours. Extremely high price for Regulation Up in hour 7 is due to high Regulation Up requirement for this hour and less Regulation Up Offers for some operating days. On 2/23/2014, Regulation for hour 7 cleared at $4,999 pulling the monthly average up by $178/MWh.
ERCOT Public 23
0
20
40
60
80
100
120
140
Pric
e ($
/MW
h)
RTSPP - LZ West
RTSPP - LZ North
RTSPP - LZ South
RTSPP - LZ Houston
DASPP - LZ West
DASPP - LZ North
DASPP - LZ South
DASPP - LZ Houston
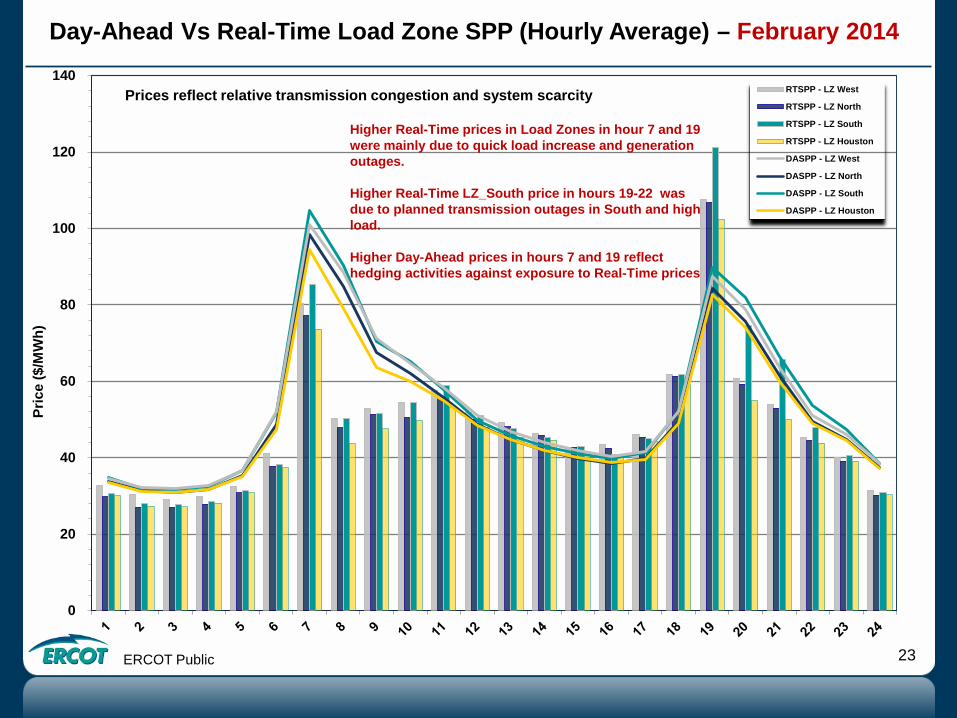
Prices reflect relative transmission congestion and system scarcity
Day-Ahead Vs Real-Time Load Zone SPP (Hourly Average) – February 2014
Higher Real-Time prices in Load Zones in hour 7 and 19 were mainly due to quick load increase and generation outages. Higher Real-Time LZ_South price in hours 19-22 was due to planned transmission outages in South and high load. Higher Day-Ahead prices in hours 7 and 19 reflect hedging activities against exposure to Real-Time prices
ERCOT Public 24
Day-Ahead Vs Real-Time Hub Average SPP (Hourly Average) – February 2014
0
20
40
60
80
100
120
Pric
e ($
/MW
h)
RTSPP - Hub Average
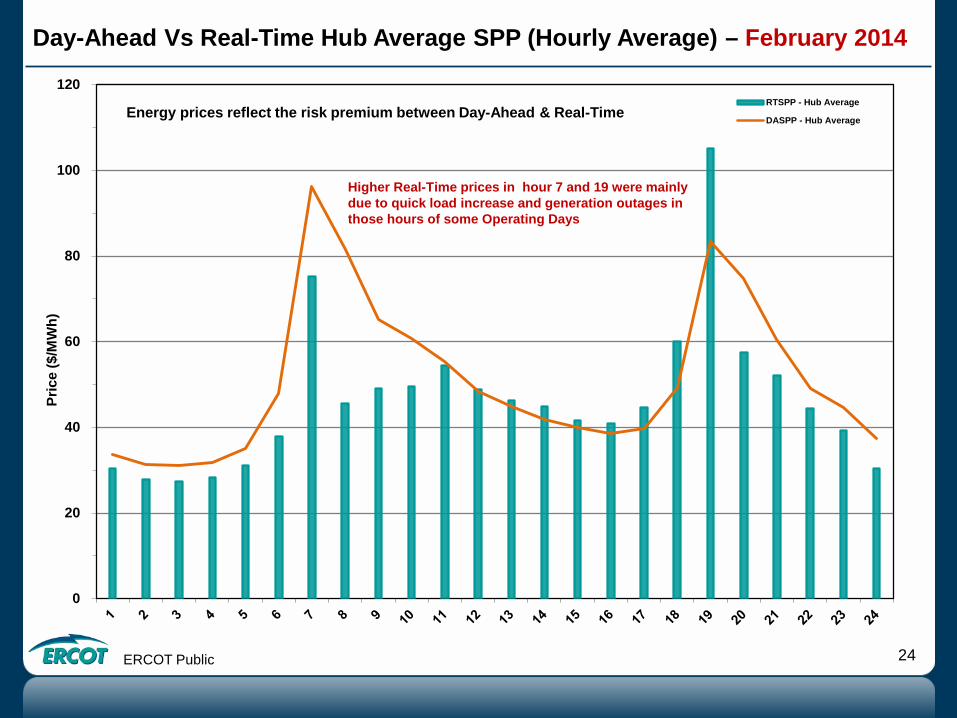
DASPP - Hub AverageEnergy prices reflect the risk premium between Day-Ahead & Real-Time
Higher Real-Time prices in hour 7 and 19 were mainly due to quick load increase and generation outages in those hours of some Operating Days
ERCOT Public 25
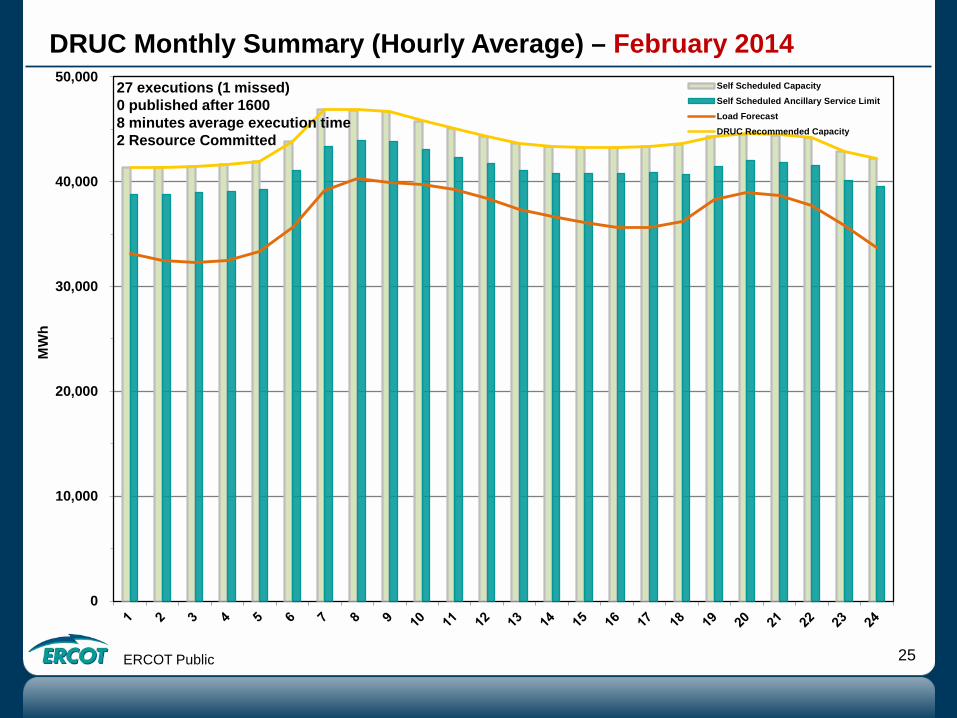
DRUC Monthly Summary (Hourly Average) – February 2014
0
10,000
20,000
30,000
40,000
50,000
MW
h
Self Scheduled CapacitySelf Scheduled Ancillary Service LimitLoad ForecastDRUC Recommended Capacity
27 executions (1 missed) 0 published after 1600 8 minutes average execution time 2 Resource Committed
ERCOT Public 26
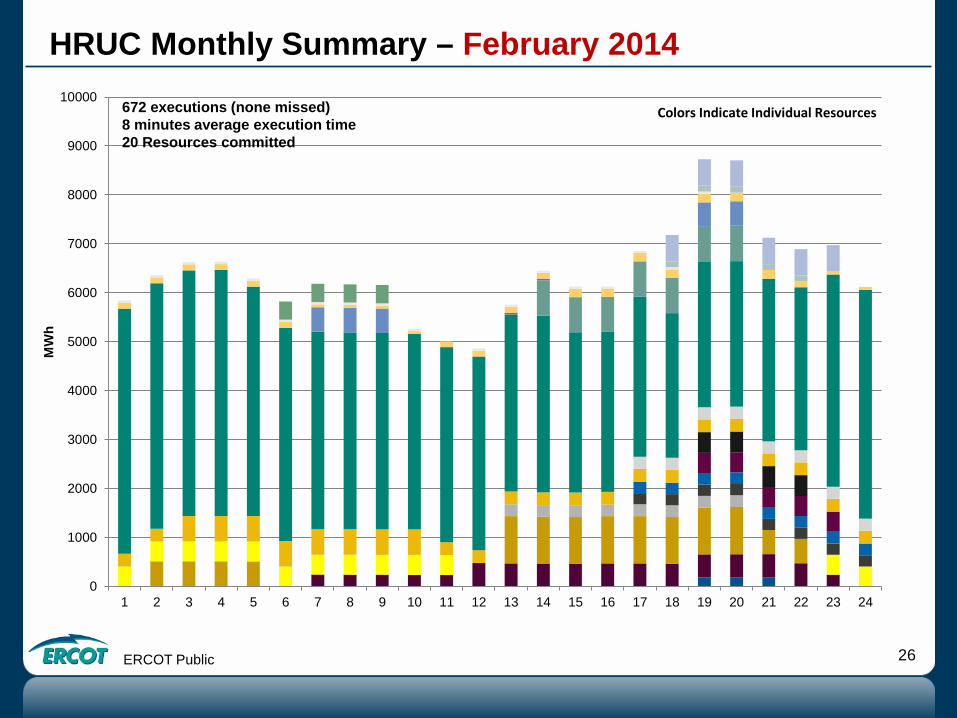
HRUC Monthly Summary – February 2014
0
1000
2000
3000
4000
5000
6000
7000
8000
9000
10000
1 2 3 4 5 6 7 8 9 10 11 12 13 14 15 16 17 18 19 20 21 22 23 24
MW
h
672 executions (none missed) 8 minutes average execution time 20 Resources committed
Colors Indicate Individual Resources
ERCOT Public 27
Non-Spinning Reserve Service Deployment – February 2014
Deployment Start Time Deployment End Time
Deployment Duration (Hours)
Max Deployment (MW) Reason
None
ERCOT Public 28
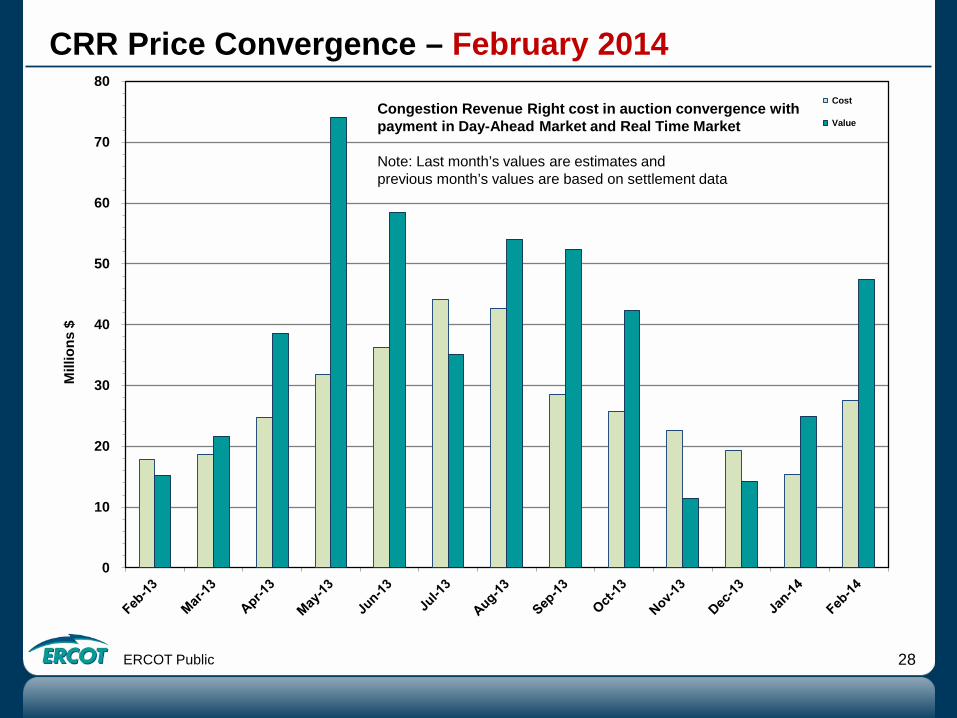
CRR Price Convergence – February 2014
0
10
20
30
40
50
60
70
80M
illio
ns $
Cost
ValueCongestion Revenue Right cost in auction convergence with payment in Day-Ahead Market and Real Time Market Note: Last month’s values are estimates and previous month’s values are based on settlement data
ERCOT Public 29
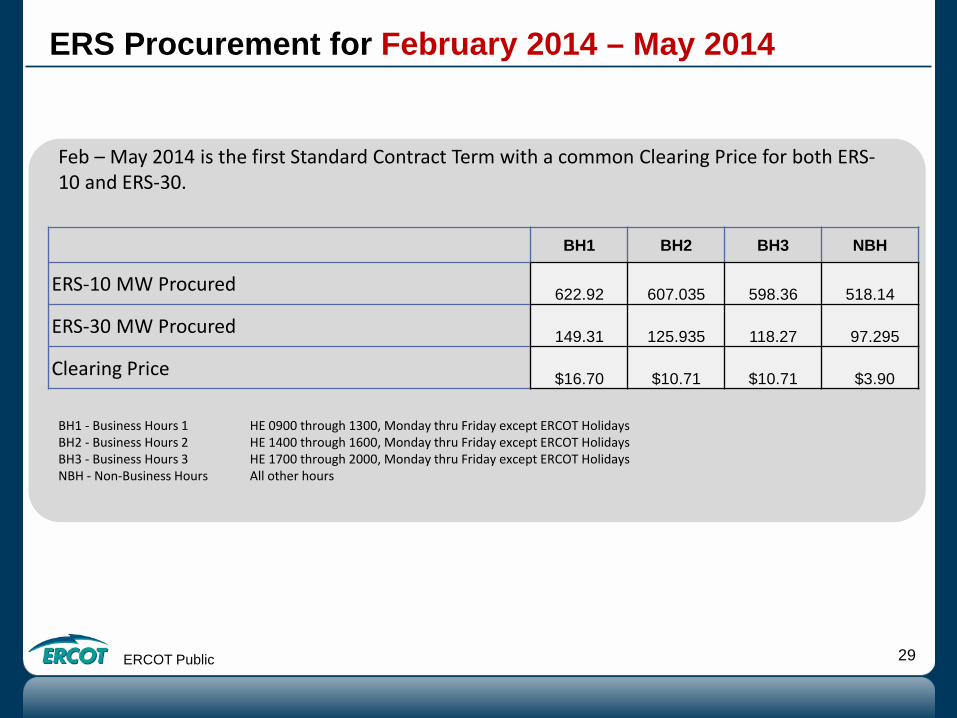
ERS Procurement for February 2014 – May 2014
BH1 - Business Hours 1 HE 0900 through 1300, Monday thru Friday except ERCOT Holidays BH2 - Business Hours 2 HE 1400 through 1600, Monday thru Friday except ERCOT Holidays BH3 - Business Hours 3 HE 1700 through 2000, Monday thru Friday except ERCOT Holidays NBH - Non-Business Hours All other hours
Feb – May 2014 is the first Standard Contract Term with a common Clearing Price for both ERS-10 and ERS-30.
BH1 BH2 BH3 NBH
ERS-10 MW Procured 622.92 607.035 598.36 518.14
ERS-30 MW Procured 149.31 125.935 118.27 97.295
Clearing Price $16.70 $10.71 $10.71 $3.90
ERCOT Public 30
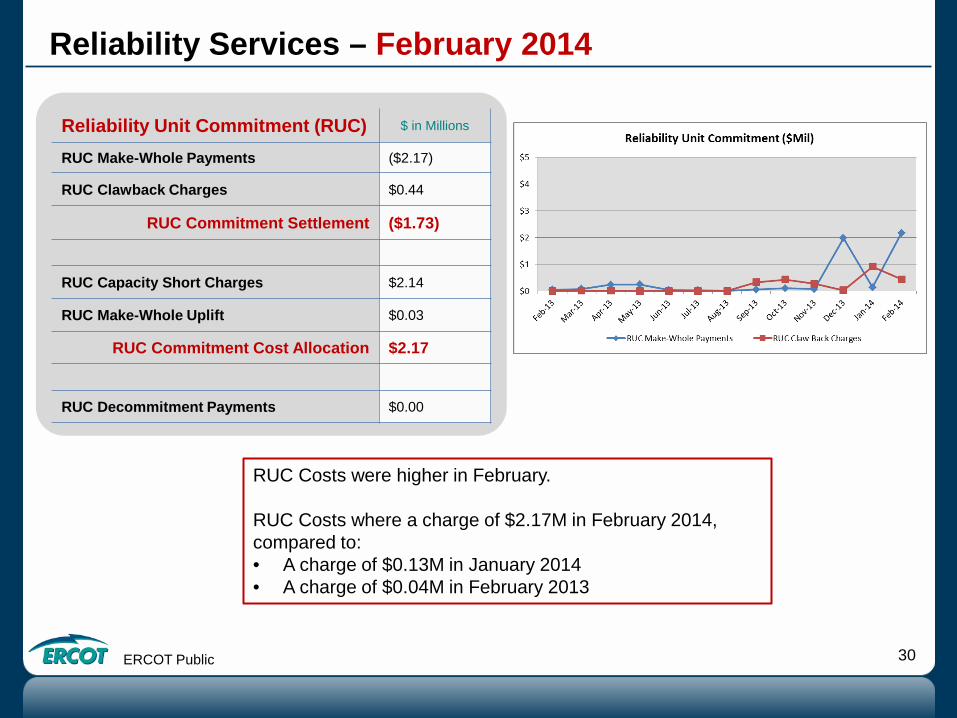
Reliability Services – February 2014
Reliability Unit Commitment (RUC) $ in Millions
RUC Make-Whole Payments ($2.17)
RUC Clawback Charges $0.44
RUC Commitment Settlement ($1.73)
RUC Capacity Short Charges $2.14
RUC Make-Whole Uplift $0.03
RUC Commitment Cost Allocation $2.17
RUC Decommitment Payments $0.00
RUC Costs were higher in February. RUC Costs where a charge of $2.17M in February 2014, compared to: • A charge of $0.13M in January 2014 • A charge of $0.04M in February 2013
ERCOT Public 31
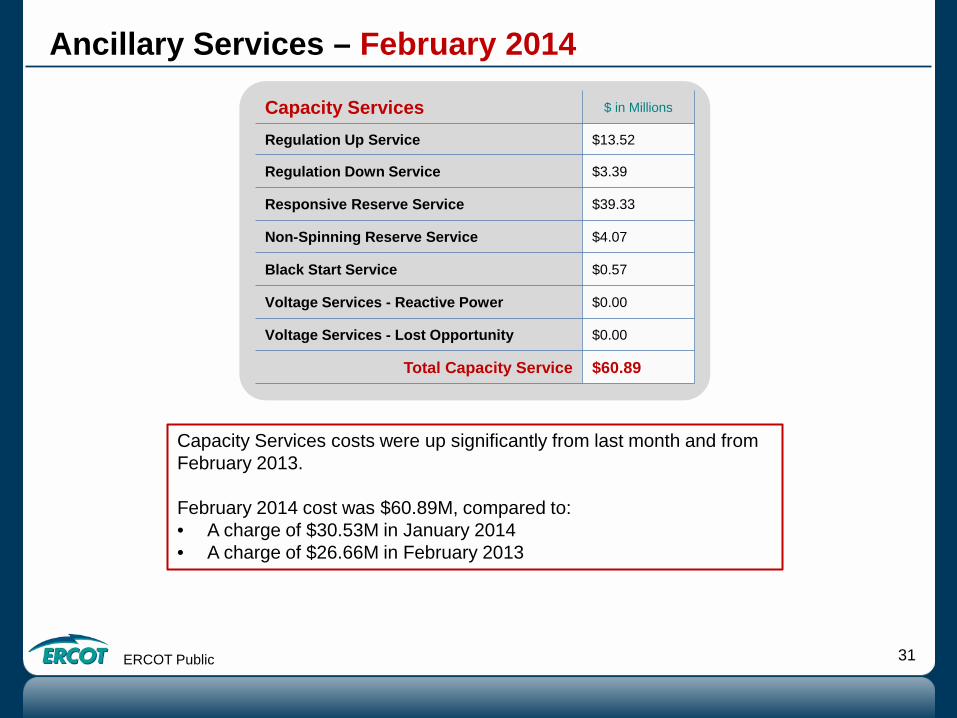
Ancillary Services – February 2014
Capacity Services $ in Millions
Regulation Up Service $13.52
Regulation Down Service $3.39
Responsive Reserve Service $39.33
Non-Spinning Reserve Service $4.07
Black Start Service $0.57
Voltage Services - Reactive Power $0.00
Voltage Services - Lost Opportunity $0.00
Total Capacity Service $60.89
Capacity Services costs were up significantly from last month and from February 2013. February 2014 cost was $60.89M, compared to: • A charge of $30.53M in January 2014 • A charge of $26.66M in February 2013
ERCOT Public 32
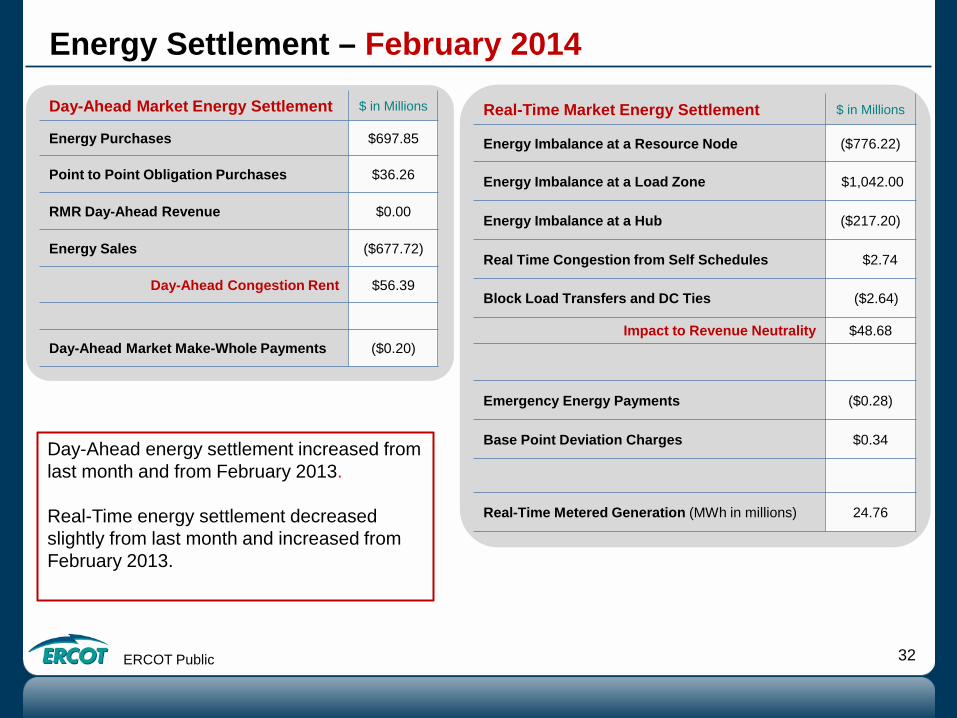
Energy Settlement – February 2014
Day-Ahead energy settlement increased from last month and from February 2013. Real-Time energy settlement decreased slightly from last month and increased from February 2013.
Day-Ahead Market Energy Settlement $ in Millions
Energy Purchases $697.85
Point to Point Obligation Purchases $36.26
RMR Day-Ahead Revenue $0.00
Energy Sales ($677.72)
Day-Ahead Congestion Rent $56.39
Day-Ahead Market Make-Whole Payments ($0.20)
Real-Time Market Energy Settlement $ in Millions
Energy Imbalance at a Resource Node ($776.22)
Energy Imbalance at a Load Zone $1,042.00
Energy Imbalance at a Hub ($217.20)
Real Time Congestion from Self Schedules $2.74
Block Load Transfers and DC Ties ($2.64)
Impact to Revenue Neutrality $48.68
Emergency Energy Payments ($0.28)
Base Point Deviation Charges $0.34
Real-Time Metered Generation (MWh in millions) 24.76
ERCOT Public 33
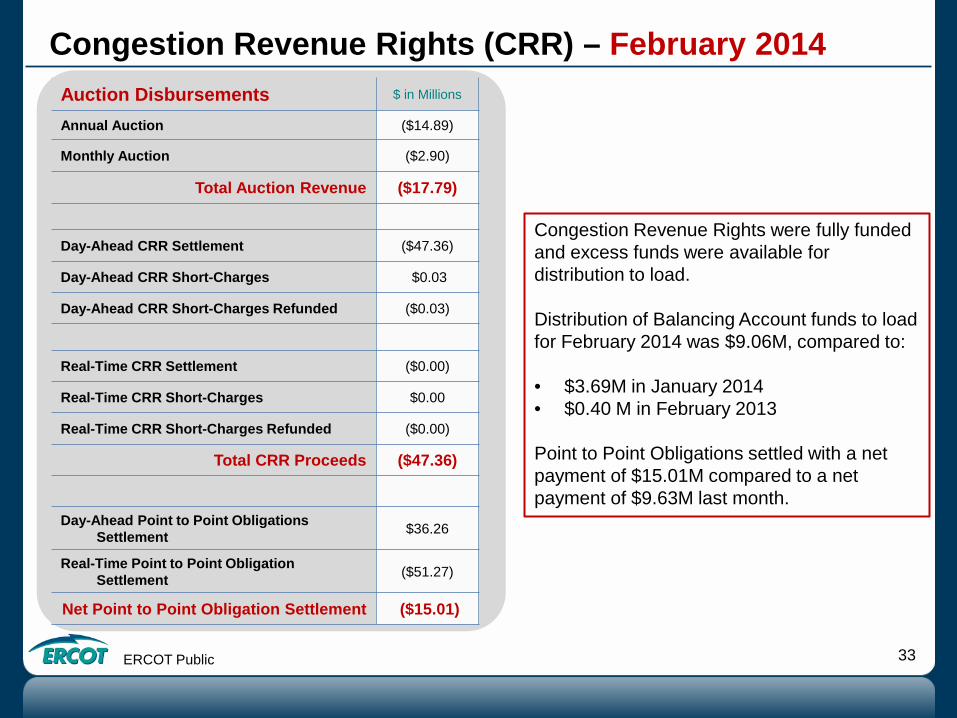
Congestion Revenue Rights (CRR) – February 2014
Auction Disbursements $ in Millions
Annual Auction ($14.89)
Monthly Auction ($2.90)
Total Auction Revenue ($17.79)
Day-Ahead CRR Settlement ($47.36)
Day-Ahead CRR Short-Charges $0.03
Day-Ahead CRR Short-Charges Refunded ($0.03)
Real-Time CRR Settlement ($0.00)
Real-Time CRR Short-Charges $0.00
Real-Time CRR Short-Charges Refunded ($0.00)
Total CRR Proceeds ($47.36)
Day-Ahead Point to Point Obligations Settlement $36.26
Real-Time Point to Point Obligation Settlement ($51.27)
Net Point to Point Obligation Settlement ($15.01)
Congestion Revenue Rights were fully funded and excess funds were available for distribution to load. Distribution of Balancing Account funds to load for February 2014 was $9.06M, compared to: • $3.69M in January 2014 • $0.40 M in February 2013
Point to Point Obligations settled with a net payment of $15.01M compared to a net payment of $9.63M last month.
ERCOT Public 34
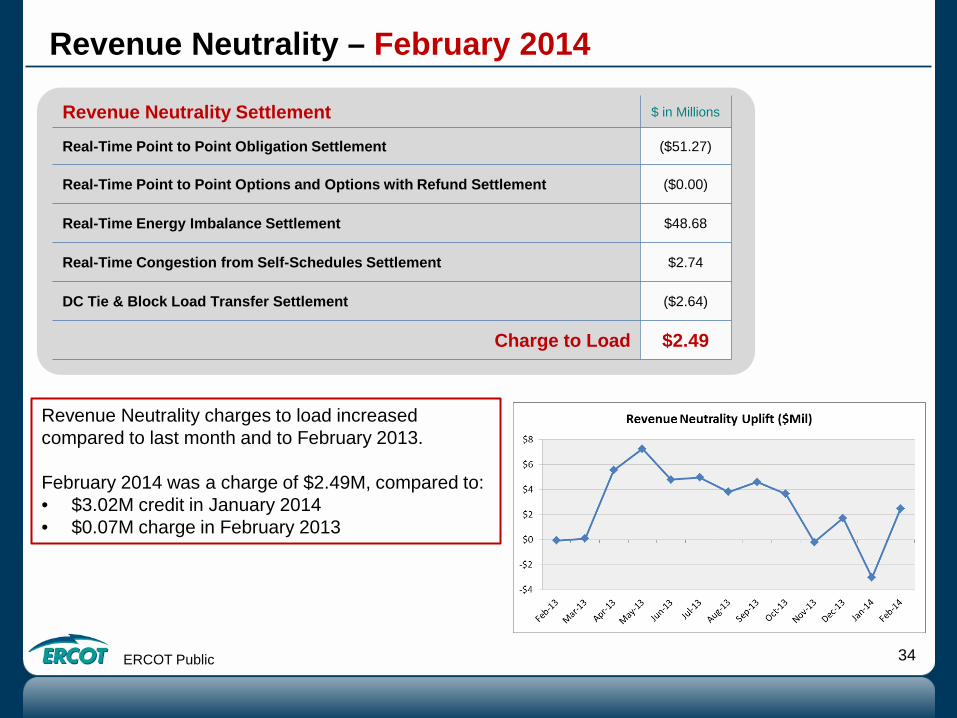
Revenue Neutrality – February 2014
Revenue Neutrality Settlement $ in Millions
Real-Time Point to Point Obligation Settlement ($51.27)
Real-Time Point to Point Options and Options with Refund Settlement ($0.00)
Real-Time Energy Imbalance Settlement $48.68
Real-Time Congestion from Self-Schedules Settlement $2.74
DC Tie & Block Load Transfer Settlement ($2.64)
Charge to Load $2.49
Revenue Neutrality charges to load increased compared to last month and to February 2013. February 2014 was a charge of $2.49M, compared to: • $3.02M credit in January 2014 • $0.07M charge in February 2013
ERCOT Public 35
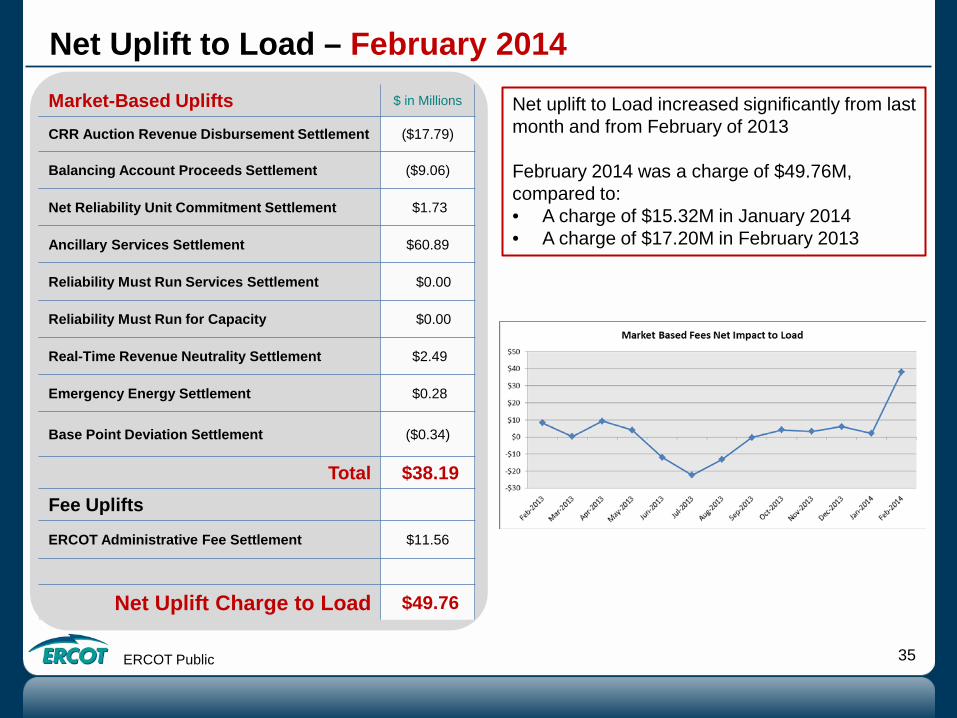
Net Uplift to Load – February 2014
Net uplift to Load increased significantly from last month and from February of 2013 February 2014 was a charge of $49.76M, compared to: • A charge of $15.32M in January 2014 • A charge of $17.20M in February 2013
Market-Based Uplifts $ in Millions
CRR Auction Revenue Disbursement Settlement ($17.79)
Balancing Account Proceeds Settlement ($9.06)
Net Reliability Unit Commitment Settlement $1.73
Ancillary Services Settlement $60.89
Reliability Must Run Services Settlement $0.00
Reliability Must Run for Capacity $0.00
Real-Time Revenue Neutrality Settlement $2.49
Emergency Energy Settlement $0.28
Base Point Deviation Settlement ($0.34)
Total $38.19 Fee Uplifts
ERCOT Administrative Fee Settlement $11.56
Net Uplift Charge to Load $49.76
ERCOT Public 36
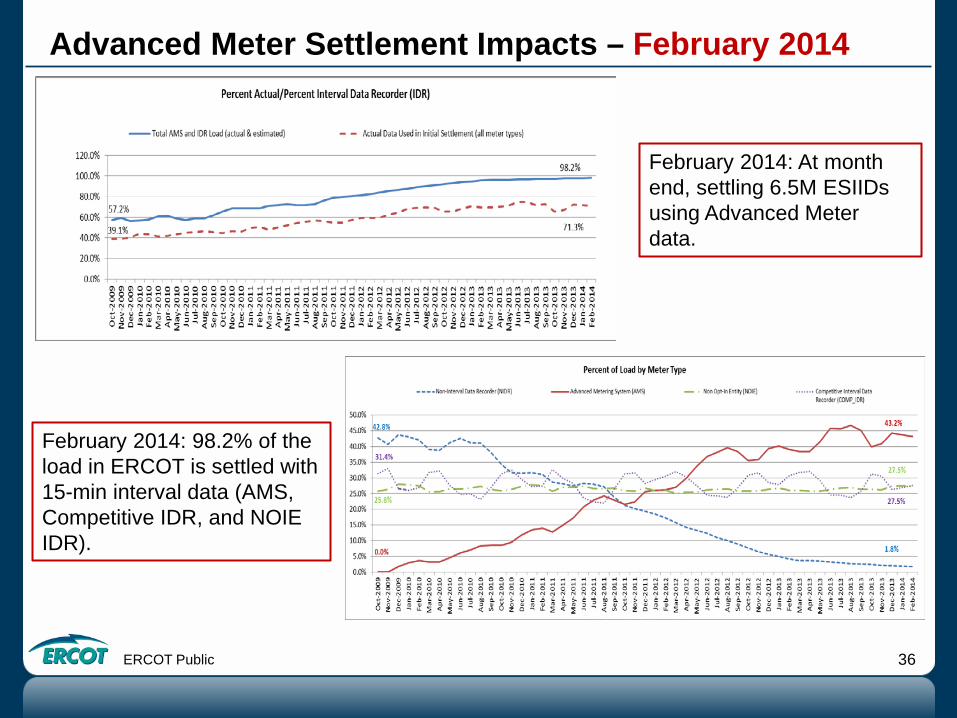
Advanced Meter Settlement Impacts – February 2014
February 2014: At month end, settling 6.5M ESIIDs using Advanced Meter data.
February 2014: 98.2% of the load in ERCOT is settled with 15-min interval data (AMS, Competitive IDR, and NOIE IDR).
ERCOT Public 37
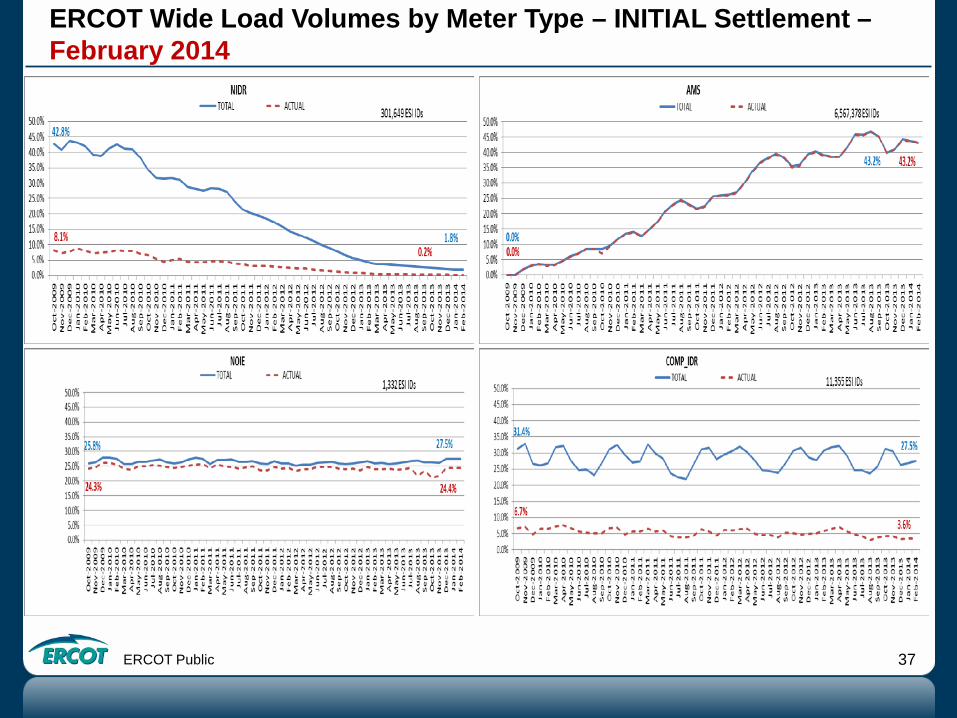
ERCOT Wide Load Volumes by Meter Type – INITIAL Settlement – February 2014
ERCOT Public 38
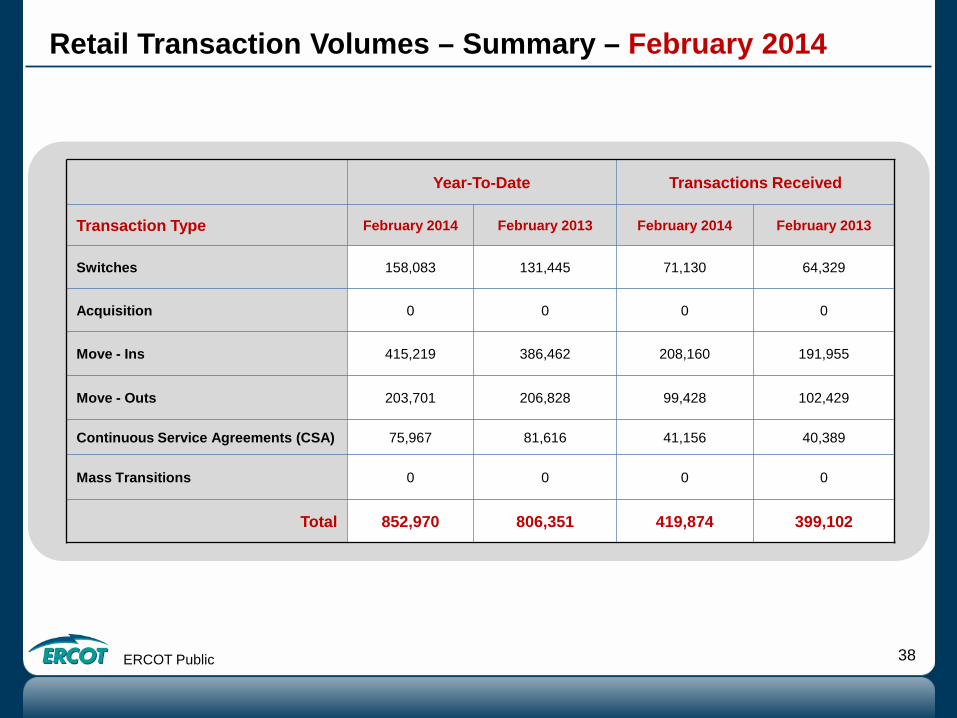
Retail Transaction Volumes – Summary – February 2014
Year-To-Date Transactions Received
Transaction Type February 2014 February 2013 February 2014 February 2013
Switches 158,083 131,445 71,130 64,329
Acquisition 0 0 0 0
Move - Ins 415,219 386,462 208,160 191,955
Move - Outs 203,701 206,828 99,428 102,429
Continuous Service Agreements (CSA) 75,967 81,616 41,156 40,389
Mass Transitions 0 0 0 0
Total 852,970 806,351 419,874 399,102
ERCOT Public 39
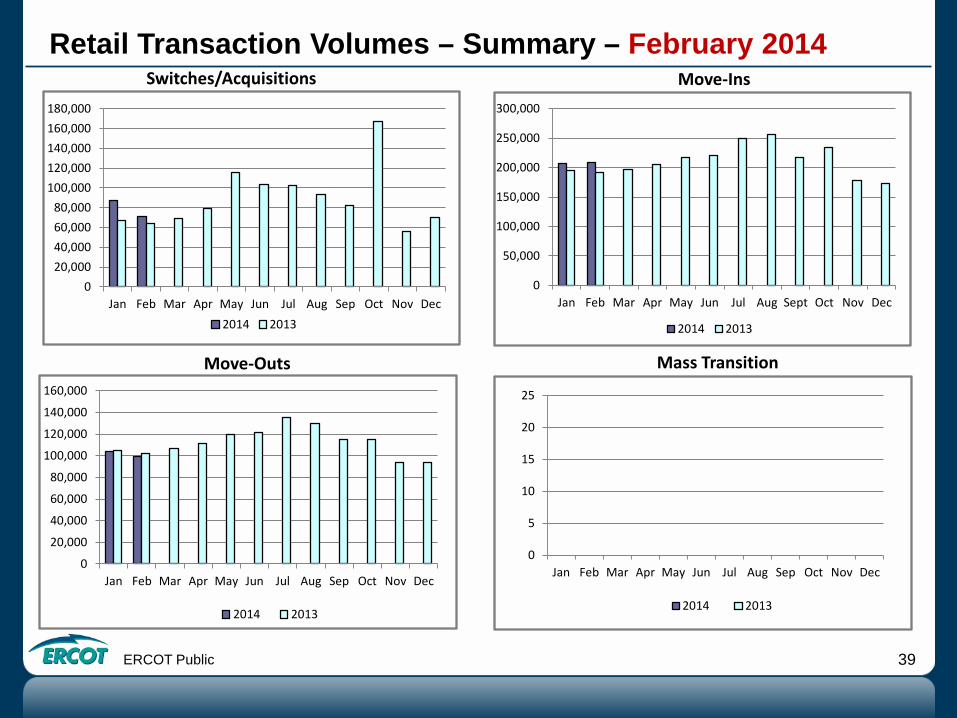
Retail Transaction Volumes – Summary – February 2014 Switches/Acquisitions
Move-Ins
Move-Outs Mass Transition
020,00040,00060,00080,000
100,000120,000140,000160,000180,000
Jan Feb Mar Apr May Jun Jul Aug Sep Oct Nov Dec2014 2013
0
50,000
100,000
150,000
200,000
250,000
300,000
Jan Feb Mar Apr May Jun Jul Aug Sept Oct Nov Dec
2014 2013
0
20,000
40,000
60,000
80,000
100,000
120,000
140,000
160,000
Jan Feb Mar Apr May Jun Jul Aug Sep Oct Nov Dec
2014 2013
0
5
10
15
20
25
Jan Feb Mar Apr May Jun Jul Aug Sep Oct Nov Dec
2014 2013
ERCOT Public 40
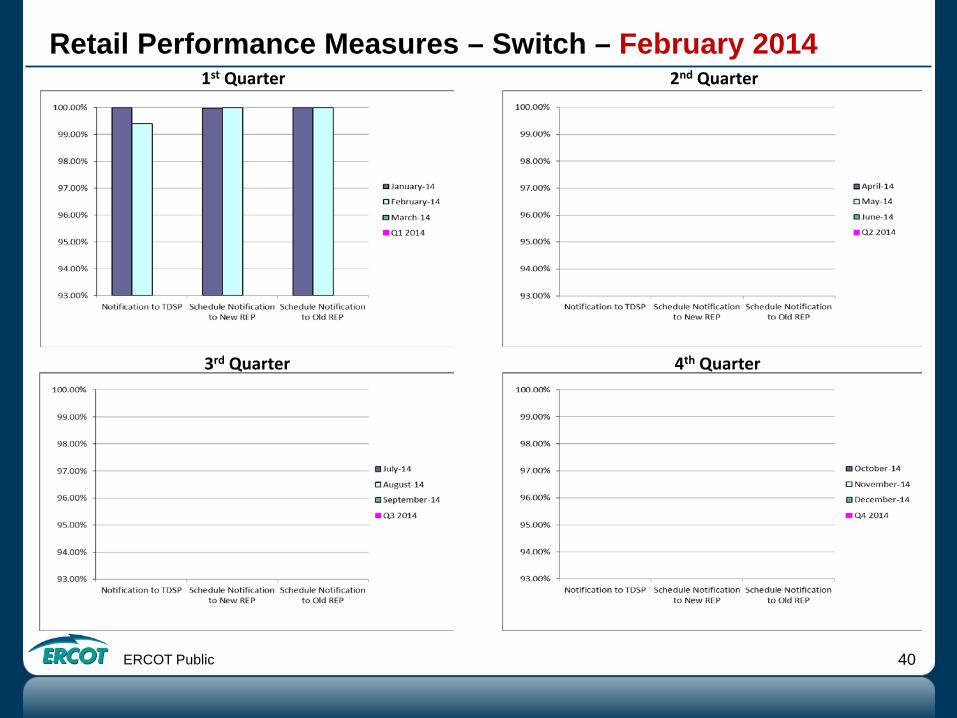
Retail Performance Measures – Switch – February 2014 1st Quarter 2nd Quarter
3rd Quarter 4th Quarter

ERCOT Public 41
1st Quarter 2nd Quarter
3rd Quarter 4th Quarter
Retail Performance Measures (Same Day Move-In) – February 2014
ERCOT Public 42
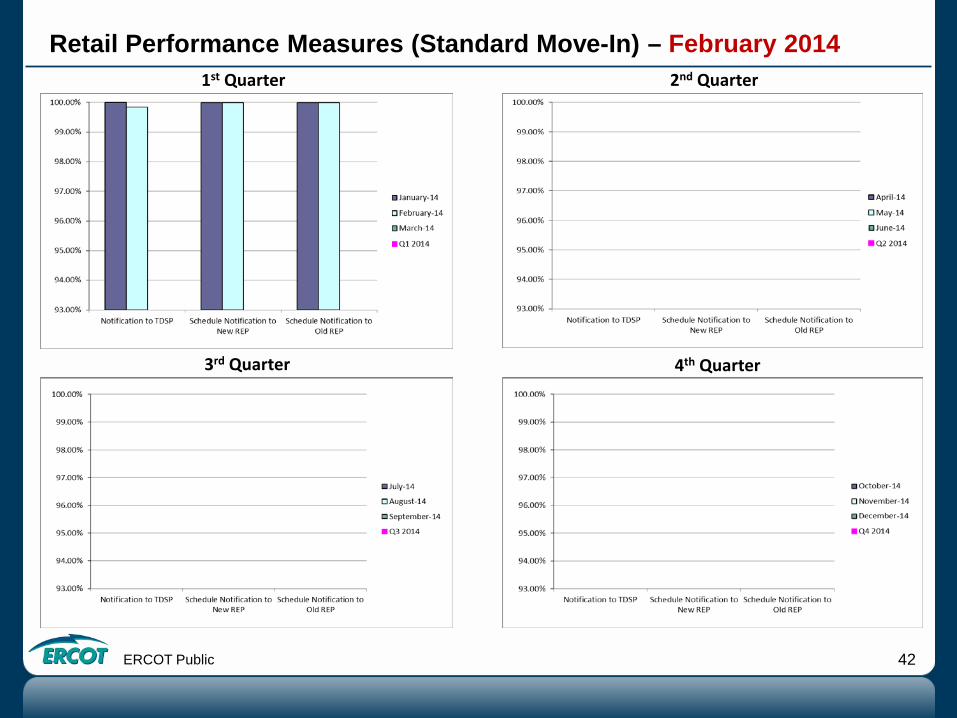
1st Quarter 2nd Quarter
3rd Quarter 4th Quarter
Retail Performance Measures (Standard Move-In) – February 2014

Projects Report
ERCOT Public 44
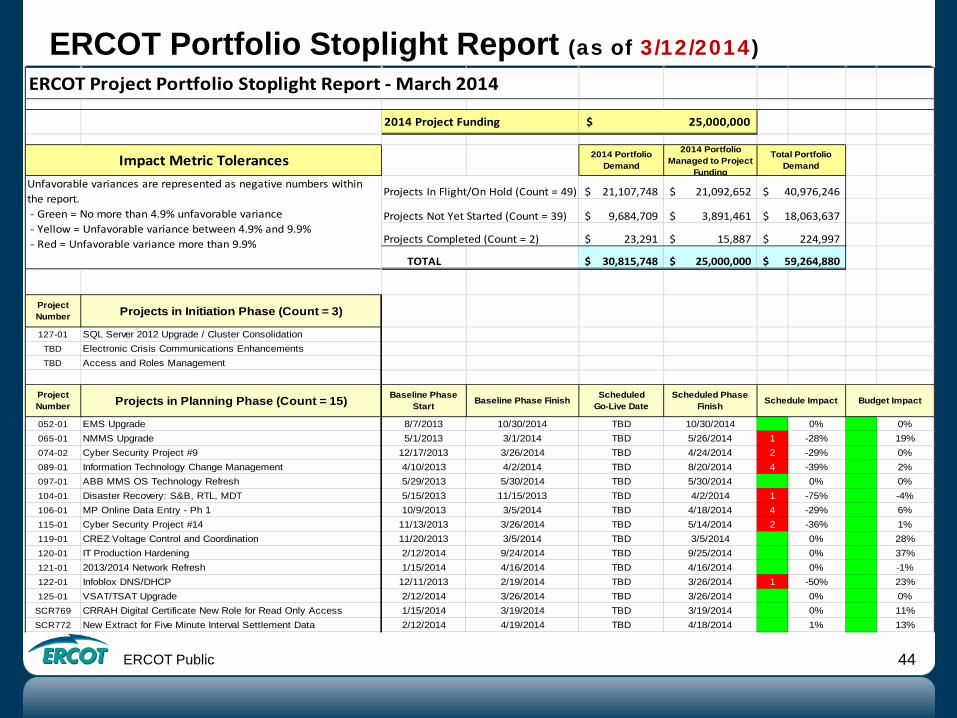
ERCOT Portfolio Stoplight Report (as of 3/12/2014) ERCOT Project Portfolio Stoplight Report - March 2014
2014 Project Funding
2014 Portfolio Demand
2014 Portfolio Managed to Project
Funding
Projects In Flight/On Hold (Count = 49) 21,107,748$ 21,092,652$
Projects Not Yet Started (Count = 39) 9,684,709$ 3,891,461$
Projects Completed (Count = 2) 23,291$ 15,887$
TOTAL 30,815,748$ 25,000,000$
Project Number Projects in Initiation Phase (Count = 3)
127-01 SQL Server 2012 Upgrade / Cluster ConsolidationTBD Electronic Crisis Communications EnhancementsTBD Access and Roles Management
Project Number Projects in Planning Phase (Count = 15) Baseline Phase
Start Baseline Phase Finish ScheduledGo-Live Date
Scheduled Phase Finish
052-01 EMS Upgrade 8/7/2013 10/30/2014 TBD 10/30/2014 0% 0%065-01 NMMS Upgrade 5/1/2013 3/1/2014 TBD 5/26/2014 1 -28% 19%074-02 Cyber Security Project #9 12/17/2013 3/26/2014 TBD 4/24/2014 2 -29% 0%089-01 Information Technology Change Management 4/10/2013 4/2/2014 TBD 8/20/2014 4 -39% 2%097-01 ABB MMS OS Technology Refresh 5/29/2013 5/30/2014 TBD 5/30/2014 0% 0%104-01 Disaster Recovery: S&B, RTL, MDT 5/15/2013 11/15/2013 TBD 4/2/2014 1 -75% -4%106-01 MP Online Data Entry - Ph 1 10/9/2013 3/5/2014 TBD 4/18/2014 4 -29% 6%115-01 Cyber Security Project #14 11/13/2013 3/26/2014 TBD 5/14/2014 2 -36% 1%119-01 CREZ Voltage Control and Coordination 11/20/2013 3/5/2014 TBD 3/5/2014 0% 28%120-01 IT Production Hardening 2/12/2014 9/24/2014 TBD 9/25/2014 0% 37%121-01 2013/2014 Network Refresh 1/15/2014 4/16/2014 TBD 4/16/2014 0% -1%122-01 Infoblox DNS/DHCP 12/11/2013 2/19/2014 TBD 3/26/2014 1 -50% 23%125-01 VSAT/TSAT Upgrade 2/12/2014 3/26/2014 TBD 3/26/2014 0% 0%
SCR769 CRRAH Digital Certificate New Role for Read Only Access 1/15/2014 3/19/2014 TBD 3/19/2014 0% 11%SCR772 New Extract for Five Minute Interval Settlement Data 2/12/2014 4/19/2014 TBD 4/18/2014 1% 13%
Total Portfolio Demand
40,976,246$
25,000,000$
Unfavorable variances are represented as negative numbers within the report. - Green = No more than 4.9% unfavorable variance - Yellow = Unfavorable variance between 4.9% and 9.9% - Red = Unfavorable variance more than 9.9%
18,063,637$
224,997$
59,264,880$
Budget Impact
Impact Metric Tolerances
Schedule Impact
ERCOT Public 45
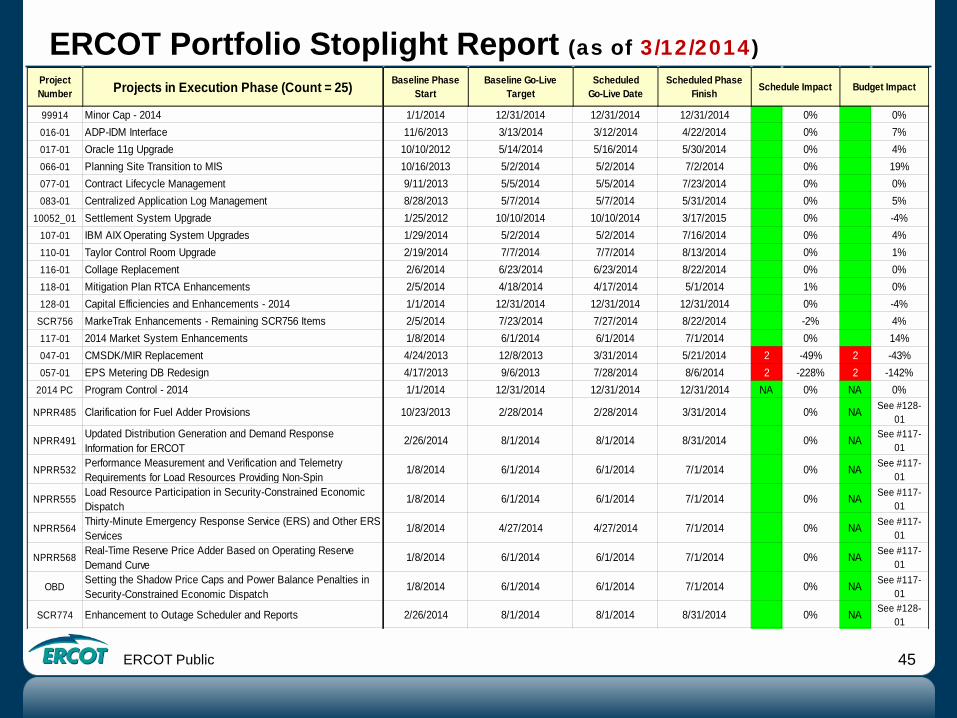
ERCOT Portfolio Stoplight Report (as of 3/12/2014) Project Number Projects in Execution Phase (Count = 25) Baseline Phase
StartBaseline Go-Live
TargetScheduled
Go-Live DateScheduled Phase
Finish
99914 Minor Cap - 2014 1/1/2014 12/31/2014 12/31/2014 12/31/2014 0% 0%016-01 ADP-IDM Interface 11/6/2013 3/13/2014 3/12/2014 4/22/2014 0% 7%017-01 Oracle 11g Upgrade 10/10/2012 5/14/2014 5/16/2014 5/30/2014 0% 4%066-01 Planning Site Transition to MIS 10/16/2013 5/2/2014 5/2/2014 7/2/2014 0% 19%077-01 Contract Lifecycle Management 9/11/2013 5/5/2014 5/5/2014 7/23/2014 0% 0%083-01 Centralized Application Log Management 8/28/2013 5/7/2014 5/7/2014 5/31/2014 0% 5%
10052_01 Settlement System Upgrade 1/25/2012 10/10/2014 10/10/2014 3/17/2015 0% -4%107-01 IBM AIX Operating System Upgrades 1/29/2014 5/2/2014 5/2/2014 7/16/2014 0% 4%110-01 Taylor Control Room Upgrade 2/19/2014 7/7/2014 7/7/2014 8/13/2014 0% 1%116-01 Collage Replacement 2/6/2014 6/23/2014 6/23/2014 8/22/2014 0% 0%118-01 Mitigation Plan RTCA Enhancements 2/5/2014 4/18/2014 4/17/2014 5/1/2014 1% 0%128-01 Capital Efficiencies and Enhancements - 2014 1/1/2014 12/31/2014 12/31/2014 12/31/2014 0% -4%
SCR756 MarkeTrak Enhancements - Remaining SCR756 Items 2/5/2014 7/23/2014 7/27/2014 8/22/2014 -2% 4%117-01 2014 Market System Enhancements 1/8/2014 6/1/2014 6/1/2014 7/1/2014 0% 14%047-01 CMSDK/MIR Replacement 4/24/2013 12/8/2013 3/31/2014 5/21/2014 2 -49% 2 -43%057-01 EPS Metering DB Redesign 4/17/2013 9/6/2013 7/28/2014 8/6/2014 2 -228% 2 -142%
2014 PC Program Control - 2014 1/1/2014 12/31/2014 12/31/2014 12/31/2014 NA 0% NA 0%
NPRR485 Clarification for Fuel Adder Provisions 10/23/2013 2/28/2014 2/28/2014 3/31/2014 0% NA See #128-01
NPRR491Updated Distribution Generation and Demand Response Information for ERCOT
2/26/2014 8/1/2014 8/1/2014 8/31/2014 0% NA See #117-01
NPRR532Performance Measurement and Verification and Telemetry Requirements for Load Resources Providing Non-Spin
1/8/2014 6/1/2014 6/1/2014 7/1/2014 0% NA See #117-01
NPRR555Load Resource Participation in Security-Constrained Economic Dispatch
1/8/2014 6/1/2014 6/1/2014 7/1/2014 0% NA See #117-01
NPRR564Thirty-Minute Emergency Response Service (ERS) and Other ERS Services
1/8/2014 4/27/2014 4/27/2014 7/1/2014 0% NA See #117-01
NPRR568Real-Time Reserve Price Adder Based on Operating Reserve Demand Curve
1/8/2014 6/1/2014 6/1/2014 7/1/2014 0% NA See #117-01
OBDSetting the Shadow Price Caps and Power Balance Penalties in Security-Constrained Economic Dispatch
1/8/2014 6/1/2014 6/1/2014 7/1/2014 0% NA See #117-01
SCR774 Enhancement to Outage Scheduler and Reports 2/26/2014 8/1/2014 8/1/2014 8/31/2014 0% NA See #128-01
Budget ImpactSchedule Impact
ERCOT Public 46
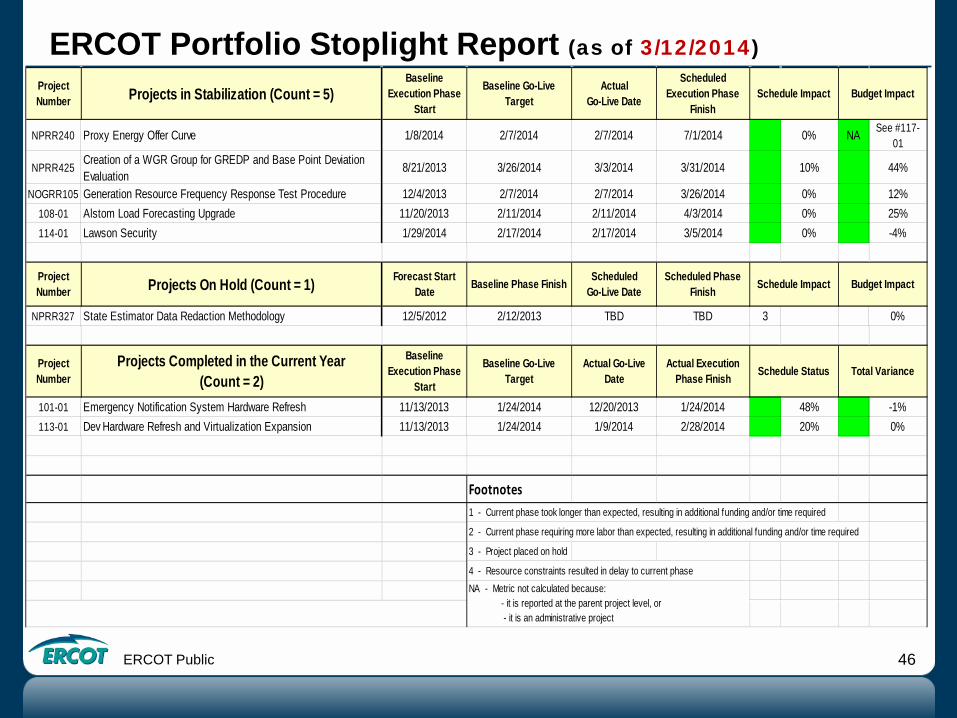
ERCOT Portfolio Stoplight Report (as of 3/12/2014) Project Number Projects in Stabilization (Count = 5)
Baseline Execution Phase
Start
Baseline Go-Live Target
ActualGo-Live Date
Scheduled Execution Phase
Finish
NPRR240 Proxy Energy Offer Curve 1/8/2014 2/7/2014 2/7/2014 7/1/2014 0% NA See #117-01
NPRR425Creation of a WGR Group for GREDP and Base Point Deviation Evaluation
8/21/2013 3/26/2014 3/3/2014 3/31/2014 10% 44%
NOGRR105 Generation Resource Frequency Response Test Procedure 12/4/2013 2/7/2014 2/7/2014 3/26/2014 0% 12%108-01 Alstom Load Forecasting Upgrade 11/20/2013 2/11/2014 2/11/2014 4/3/2014 0% 25%114-01 Lawson Security 1/29/2014 2/17/2014 2/17/2014 3/5/2014 0% -4%
Project Number Projects On Hold (Count = 1) Forecast Start
Date Baseline Phase Finish ScheduledGo-Live Date
Scheduled Phase Finish
NPRR327 State Estimator Data Redaction Methodology 12/5/2012 2/12/2013 TBD TBD 3 0%
Project Number
Projects Completed in the Current Year (Count = 2)
Baseline Execution Phase
Start
Baseline Go-Live Target
Actual Go-Live Date
Actual Execution Phase Finish
101-01 Emergency Notification System Hardware Refresh 11/13/2013 1/24/2014 12/20/2013 1/24/2014 48% -1%113-01 Dev Hardware Refresh and Virtualization Expansion 11/13/2013 1/24/2014 1/9/2014 2/28/2014 20% 0%
Footnotes1 - Current phase took longer than expected, resulting in additional funding and/or time required
2 - Current phase requiring more labor than expected, resulting in additional funding and/or time required
3 - Project placed on hold
4 - Resource constraints resulted in delay to current phase
Schedule Status Total Variance
NA - Metric not calculated because: - it is reported at the parent project level, or - it is an administrative project
Budget Impact
Schedule Impact Budget Impact
Schedule Impact
ERCOT Public 47
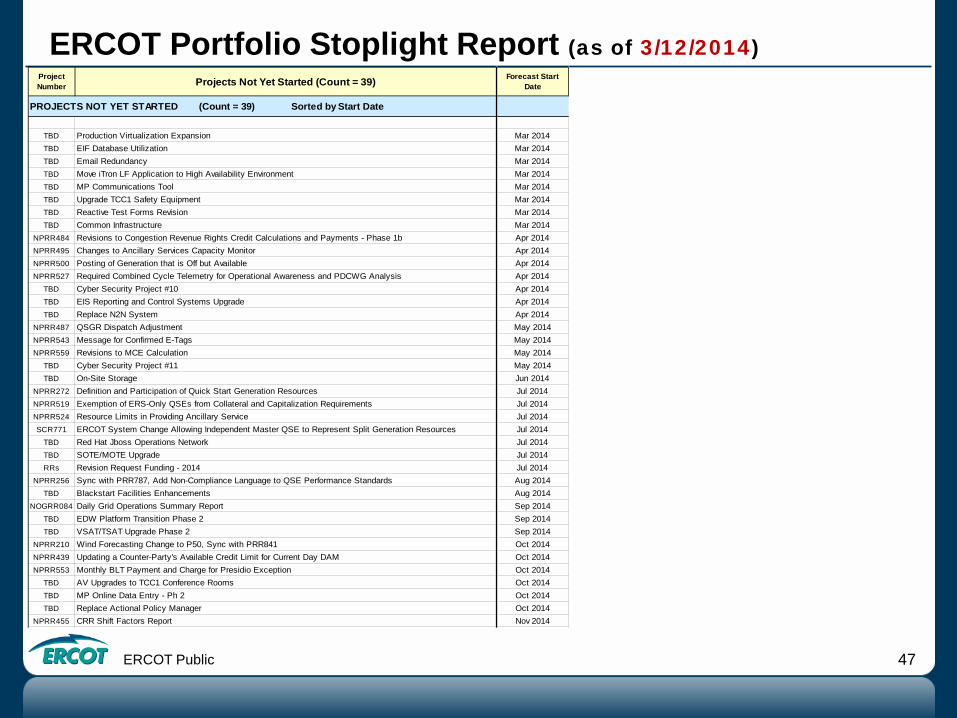
ERCOT Portfolio Stoplight Report (as of 3/12/2014) Project Number Projects Not Yet Started (Count = 39) Forecast Start
Date
PROJECTS NOT YET STARTED (Count = 39) Sorted by Start Date
TBD Production Virtualization Expansion Mar 2014TBD EIF Database Utilization Mar 2014TBD Email Redundancy Mar 2014TBD Move iTron LF Application to High Availability Environment Mar 2014TBD MP Communications Tool Mar 2014TBD Upgrade TCC1 Safety Equipment Mar 2014TBD Reactive Test Forms Revision Mar 2014TBD Common Infrastructure Mar 2014
NPRR484 Revisions to Congestion Revenue Rights Credit Calculations and Payments - Phase 1b Apr 2014NPRR495 Changes to Ancillary Services Capacity Monitor Apr 2014NPRR500 Posting of Generation that is Off but Available Apr 2014NPRR527 Required Combined Cycle Telemetry for Operational Awareness and PDCWG Analysis Apr 2014
TBD Cyber Security Project #10 Apr 2014TBD EIS Reporting and Control Systems Upgrade Apr 2014TBD Replace N2N System Apr 2014
NPRR487 QSGR Dispatch Adjustment May 2014NPRR543 Message for Confirmed E-Tags May 2014NPRR559 Revisions to MCE Calculation May 2014
TBD Cyber Security Project #11 May 2014TBD On-Site Storage Jun 2014
NPRR272 Definition and Participation of Quick Start Generation Resources Jul 2014NPRR519 Exemption of ERS-Only QSEs from Collateral and Capitalization Requirements Jul 2014NPRR524 Resource Limits in Providing Ancillary Service Jul 2014SCR771 ERCOT System Change Allowing Independent Master QSE to Represent Split Generation Resources Jul 2014
TBD Red Hat Jboss Operations Network Jul 2014TBD SOTE/MOTE Upgrade Jul 2014RRs Revision Request Funding - 2014 Jul 2014
NPRR256 Sync with PRR787, Add Non-Compliance Language to QSE Performance Standards Aug 2014TBD Blackstart Facilities Enhancements Aug 2014
NOGRR084 Daily Grid Operations Summary Report Sep 2014TBD EDW Platform Transition Phase 2 Sep 2014TBD VSAT/TSAT Upgrade Phase 2 Sep 2014
NPRR210 Wind Forecasting Change to P50, Sync with PRR841 Oct 2014NPRR439 Updating a Counter-Party's Available Credit Limit for Current Day DAM Oct 2014NPRR553 Monthly BLT Payment and Charge for Presidio Exception Oct 2014
TBD AV Upgrades to TCC1 Conference Rooms Oct 2014TBD MP Online Data Entry - Ph 2 Oct 2014TBD Replace Actional Policy Manager Oct 2014
NPRR455 CRR Shift Factors Report Nov 2014