Embed Size (px)
Citation preview
applied sciences
Article
Equilibrium Study, Modeling and Optimization ofModel Drug Adsorption Process by SunflowerSeed Shells
Bahdja Hayoun 1,2,*, Mustapha Bourouina 1, Marta Pazos 2 , Mª Angeles Sanromán 2 andSaliha Bourouina-Bacha 3
1 Department of Chemistry, Faculty of Exact Sciences, Campus Targa Ouzemmour, University of Bejaia,Bejaia 06000, Algeria; [email protected]
2 CINTECX-Universidade de Vigo, Department of Chemical Engineering Campus As Lagoas-Marcosende,University of Vigo, 36310 Vigo, Spain; [email protected] (M.P.); [email protected] (M.A.S.)
3 Department of Process Engineering, Faculty of Technology, Campus Targa Ouzemmour, University of Bejaia,Bejaia 06000, Algeria; [email protected]
* Correspondence: [email protected]
Received: 14 April 2020; Accepted: 4 May 2020; Published: 8 May 2020�����������������
Abstract: The adsorption capacity of the medication methylthioninium chloride (MC) fromaqueous solution onto sunflower seed shells (SSS), a low cost and abundant alternative adsorbent,was investigated in a batch system. The surface properties of the adsorbent were characterizedby Fourier transform infrared (FTIR) spectroscopy, scanning electron microscopy (SEM), specificsurface area (by using the Brunauer–Emmett–Teller equation), the liquid displacement method andpHPZC. The ability of SSS to remove the medication was assessed through kinetic, thermodynamicand equilibrium investigations. The adsorption efficiency of the SSS adsorbent for the removal ofMC was evaluated considering the effects of its concentration, temperature, adsorption contact time,and the pH of the medium. The results obtained from the kinetic and isotherm studies show thatthe adsorption of the MC on SSS follows pseudo-second-order kinetics (R2 > 0.99) and the Temkinisotherm model (R2 = 0.97), respectively. The thermodynamic study showed that the adsorptionwas endothermic and spontaneous, according to its physisorption mechanism. The mathematicalmodeling of this process was carried out by using the surface response methodology of Box–Behenken.It was possible to deduce a statistically reliable regression equation that related the adsorption yieldto the chosen operating parameters, that is, the initial MC concentration, the adsorbent dosage andthe pH. Analysis of the variance indicated that the most influential parameters were the SSS dosage,the pH and their interaction and showed the optimal values for ensuring the best adsorption capacityof 95.58%.
Keywords: adsorption; experimental design; isotherm; methylthioninium chloride; kinetics;sunflower seed shells
1. Introduction
There has been a great deal of concern about the detection of pharmaceuticals and personal careproducts in soil, sediments, surface and groundwater [1] as they have become major pollutants due totheir low biodegradability, high persistence, and facile bioaccumulation [2]. Among these products,methylthioninium chloride (MC), which is part of a type of medication derived from phenothiazines,has been widely used in a variety of medical treatments, such as methemoglobinemia [3] and lymphaticmapping/sentinel lymphadenectomy in staging melanoma and breast cancer [4]. It has also beenused as a therapeutic agent in neurodegenerative diseases [5,6]. This product is not only used in the
Appl. Sci. 2020, 10, 3271; doi:10.3390/app10093271 www.mdpi.com/journal/applsci

Appl. Sci. 2020, 10, 3271 2 of 17
pharmaceutical field, but it is also used in several other industrial fields including textiles, leather,cosmetics, paper, printing, plastic and food [7–9].Therefore, MC is often present in the various effluentsthat are discharged into the environment. Thus, the continuous release of this pollutant into theenvironment significantly affects human health and aquatic systems [9,10].
Therefore, the treatment of these effluents by appropriate techniques is very necessary [9,11]. For thispurpose, several physical, chemical and biological methods have been developed including coagulationand flocculation, membrane separation, reverse osmosis, oxidation and co-precipitation [9,12]. The useof an inexpensive and effective method is very important [11,13]. The adsorption technique has certainadvantages; it is a simple and easy technique, it costs less and it is respectful of the environment [14,15].Activated carbon is the most commonly used adsorbent due to its very high adsorption capacity [16–18],but the disadvantage is that it is expensive [16]. For this reason, several studies have been carried outto examine the use of low-cost adsorbents [19]. For example, various agricultural byproducts, clays [20],biomass [15], synthetic and natural polymers [21], have been evaluated. Thus, it is useful to find effectiveadsorbent materials, that are available locally and especially, low cost [7,22]. Indeed, sunflower seed shells,an agricultural byproduct of biomass, could be exploited in this area as they are a low-cost product, widelyused and can be used without any treatment.
However, several factors greatly influence the adsorption process, such as the initial pollutantconcentration, adsorbent dosage, pH and temperature of the solution, etc. These are important becausethey affect the adsorption process, particularly the adsorption capacity.
Accordingly, it is necessary to use methods based on statistical calculations like the Box–Behnkendesign (BBD), which is a useful tool because it is fast, efficient and economical in comparison to theclassic univariate methods where only one factor is studied at a time. Indeed, the advantage of thistechnique is the collection of a large amount of information from a minimum of experimental trials,without sacrificing the accuracy of the results. The main aim of this study was to find the best operatingconditions for the adsorption of MC on a low-cost adsorbent prepared from sunflower seed shells(SSS). Thus, a study was carried out to determine the influence of the operating parameters on theadsorption efficiency. The adsorption mechanism of the SSS is shown through the study of adsorptionisotherms, kinetics and thermodynamics. The efficiency of the adsorption of SSS for the elimination ofMC was optimized by evaluating the effects of three parameters, namely, the initial concentration ofthe drug, the dose of adsorbent and the pH of the solution. Modeling and optimization were carriedout by the Box–Behnken design, which allowed us to determine the optimal values of these parametersand to ensure the high adsorption efficiency of MC on the SSS powder.
2. Materials and Methods
2.1. Reagents
Methylthioninium chloride (3,7-bis(dimethylamino)-phenazathionium chloridetetramethyle-thionine chloride), a model medication pollutant (CAS n◦: 61-73-4) with a molecularweight of 373.9 g/mol, and maximum wavelength of 668 nm was purchased from Merck (BiochemChemopharma). A range of concentrations from 20 to 150 mg/L were prepared by successive dilutionof the stock solution (150 mg/L). Distilled water was used to prepare all solutions. The pH adjustmentof the solutions was made by the addition of HCl (0.1 M) or NaOH (0.1 M) using a pH-meter (Boeco).
2.2. Preparation of Adsorbent
The sunflower seed shells (SSS) was purchased from a local store (Béjaia, Algeria). First, theywere washed several times with distilled water and then dried at 60 ◦C for one day. Then, the dryproduct was crushed and then sieved to obtain a particle size less than or equal to 0.3 mm. After that,it was stored in closed bottles.

Appl. Sci. 2020, 10, 3271 3 of 17
2.3. Characterization of Adsorbent
To analyze the functional groups, a Fourier transform infrared (FTIR) spectroscopy study wascarried out using a 630 Cary spectrometer using a small amount of adsorbent before and after adsorptionof MC.
A scanning electron microscope (SEM) FEI Quanta FEG 250 from the University of Lyon 1, France,was used to study the morphology of the adsorbent.
The specific surface area was determined by the adsorption of N2 at 77.3 K using a surface analyzerNova 2000e (quantachrome instruments) using the BET (Brunauer–Emmett–Teller) equation model.In addition, the total pore volume and average pore diameter were measured.
The real density, apparent density (bulk density), porous volume and porosity of the adsorbentwere measured by the liquid displacement method. The real density ρreal (g/cm3) was determined byfilling a pycnometer with a well-defined mass of the adsorbent note, mads and then the pycnometerwas adjusted to its volume (Vpyc) by adding a well-defined volume of methanol (99% purity) and wasweighed. The calculation was made by using the following equation [23].
ρreal =mads
Vreal of adsorbent(1)
However, the apparent density ρapp (g/cm3) (bulk density) was determined using a calibratedcylinder, which was filled with a given adsorbent weight (mads) and then the cylinder was tappeduntil a minimum volume was recorded. This represents the apparent volume (Vapp) of the adsorbentwhich was evaluated using the following equation [23].
ρapp =mads
Vapp(2)
The porous volume P.V (cm3/g) and porosity ε of the adsorbent were calculated using the resultsof the densities as well as the following equations [23].
P.V =1ρapp
−1ρreal
(3)
ε = 1−ρapp
ρreal(4)
The determination of the zero point charge of SSS (ZPC) was performed by the salt additionmethod [24]. A 0.05 M NaCl solution was prepared, transferred to a series of 50 mL beakers andthe pH of each solution was adjusted from 2 to 12 by adding 0.1 M HCl or 0.1 M NaOH solution.The initial pH of these solutions (noted as pHi) was measured. Then, 0.15 g of SSS was added to eachof the beakers, which were tightly closed using parafilm paper and then stirred at 300 rpm at roomtemperature. The final pH value was measured after 48 h of agitation, the noted pHf and the ZCPvalue of the surface was calculated from the plot of ∆pH= f(pHi).
2.4. Adsorption Experiments
Adsorption experiments were carried out by agitating the SSS powder in an Erlenmeyer flask(500 mL) that contained 250 mL of the MC solution of desired concentration and pH in a magnetic stirrerat 300 rpm. The experiments were carried out with varying adsorbent dosage (1–3 g/L), initial MCconcentration (20 −150 mg/L), temperature (25–40 ◦C) and pH (2–12). The samples were withdrawnfrom the Erlenmeyer at predetermined time intervals. The MC solution was separated from theadsorbent using a Hettich brand centrifuge at 5000 rpm for 3 min and analyzed for their MC contentspectrophotometrically at the appropriate wavelength (λmax = 264 nm) using a UV spectrophotometer(Shimadzu). The effect of pH was studied by adjusting the pH of the MC solutions using HCl and

Appl. Sci. 2020, 10, 3271 4 of 17
NaOH. All experiments were performed in duplicate, all data was calculated and average values aretaken to represent the results.
The uptake of MC adsorbed onto SSS per unit mass was calculated using the following equation:
qt =(C0 − Ct)V
m(5)
where qt is the amount of MC adsorbed onto SSS (mg/g) at time t, C0 and Ct are the liquid phaseconcentrations of MC at initial and time t, respectively. V (L) is the volume of MC solution and m (g) isthe mass of the SSS adsorbent used. The MC removal efficiency was calculated as follows:
Y% =(C0 −Ct)
C0× 100 (6)
and the average relative error (ARE) was calculated as follows [25]:
ARE =N∑
i=1
∣∣∣∣∣∣qe, exp−qe, model
qe, exp
∣∣∣∣∣∣i
(7)
where qe exp and qe model (mg/g) are the uptake at equilibrium measured (exp) and calculated by theisotherm model (model), respectively. We also used the same relationship to determine the meanrelative errors for the kinetic models.
2.5. Data Analysis
2.5.1. Kinetics Study
The study of the adsorption kinetics helps to determine the adsorption equilibrium time as afunction of the adsorbent used and the operating conditions. It also allows us to understand thephenomena at the interface between the absorbing material and the pollutant molecules in termsof the diffusion and adsorption mechanism [9,18]. Three kinetic models: the pseudo-first order,the pseudo-second order and the intra-particle diffusion model [26–28] were used to analyze the kineticdata of MC adsorption on SSS. These models can be written as follows:
pseudo-first order model:qt = q1
(1− e−k1t
)(8)
pseudo-second order model:
qt =q2
2k2t
1 + q2k2t(9)
intra-particle diffusion model:qt = Kd
√t + c (10)
where q1 and q2 are the theoretical uptakes at equilibrium (mg/g), qt (mg/g) is the uptake at time t,and k1 (1/min) and k2 (g/mg min) are the pseudo-first-order rate constant and the pseudo-second-orderrate constant, respectively. Kd (mg.g.
√min) is the intra-particle diffusion constant and c (mg/g) is a
constant related to the thickness of the boundary layer.
2.5.2. Equilibrium Study
The adsorption isotherms can be defined as the set of adsorption equilibrium states, at a giventemperature. Several models have been used in the literature to describe the experimental data ofadsorption isotherms [7]. In this study, we chose three models [29–31] and we calculated the variousparameters by the equations defined as follows:

Appl. Sci. 2020, 10, 3271 5 of 17
Langmuir model:
qe =qm KL Ce
1 + KL Ce(11)
Freundlich model:qe = KF C1/nF
e (12)
Temkin model:qe = BT ln(K TCe) (13)
where qe and Ce. are the uptake and concentration at the equilibrium, respectively. qm (mg/g) is themaximum uptake of the adsorbent, KL (L/mg) is the Langmuir constant related to the free energyof adsorption. KF (mg/g) (L/g)n and nf are Freundlich constants, which are indicators of adsorptioncapacity and adsorption intensity, respectively. BT (KJ/mol) and KT (L/g) are the Temkin constants.
2.5.3. Thermodynamic Study
Temperature is an indicator of the nature of the adsorption, that is, whether it is an exothermic(∆H◦ < 0) or endothermic (∆H◦ > 0) process. Measurement of the adsorption heat ∆H◦ is the maincriterion for differentiating chemisorption from physisorption [32].
∆G◦, ∆H◦ and ∆S◦ are the thermodynamic parameters that determine the feasibility andspontaneity of the adsorption process. They were determined using the following relations [7,33]:
Kad =qe
Ce(14)
∆G = −RT. ln Kad (15)
ln Kad =∆SR−
∆HRT
(16)
where, Kad (L/g) is the distribution constant, qe (mg/g) represents the equilibrium solid-phaseconcentration, ∆G◦ (J/mol) is the standard free energy change, ∆H◦ (J/mol) is the standard enthalpychange and ∆S◦ (J/mol.K) is the standard entropy change, R is the universal gas constant (J/mol. K),and T is the absolute temperature (K).
2.6. Experimental Design and Statistical Analysis
A three-level, three-factor, 15-assay Box–Behnken factorial design was used to optimize MCadsorption on the adsorbent prepared from SSS using the software Minitab (version 17). The advantagesof BBD are that it avoids having to experiment in extreme conditions and it does not involve combinationsfor which all factors are simultaneously at their highest or lowest points [19,34,35].
The independent variables selected for the study are the initial concentration of the aqueous solutionMC (X1), the adsorbent dosage (X2) and the solution pH (X3), which are considered the factors thathave the most influence on the adsorption of the model medication. However, the adsorbent-adsorbatecontact time is set at 90 min, as this is the time needed to reach equilibrium. These independentvariables were studied at three different levels, low (−1), middle (0) and high (+1), as shown inTable 1 [19]. The predicted response Y is related to these factors through a quadratic polynomialas follows:
Y% = a0 + a1X1 + a2X21 + a3X3 + a11X21 + a22X2
2 + a33X23 + a12X1X2 + a13X1X3 + a23X2X3 (17)
where Y is the measured response, a0 is the intercept, a1, a2, a3 are linear coefficients, aii(i=1,3) arequadratic coefficients, and aij(i,j=1,3, i,j) are interactive coefficients.

Appl. Sci. 2020, 10, 3271 6 of 17
Table 1. Range of variation of operating parameters.
Symbol Variable Level (−1) Level (0) Level (+1)
X1 Ci (mg/l) MC initial concentration 20 55 90
X2 m (g/L) SSS dosage 1 2 3
X3 pH 4 7 10
3. Results
3.1. Characterization of SSS Adsorbent
3.1.1. Fourier Transform Infrared Spectroscopy
The FTIR spectra of the adsorbent before and after adsorption of MC are presented in Figure 1.The FTIR spectra of the SSS clearly show several absorption peaks which reflect the complex natureof the material examined. The broad absorption peak around 3331.5 cm−1 was indicative of theexistence of bonded hydroxyl groups on the surface of SSS. The peaks around 2912 and 2102 cm−1
were assigned to the stretching vibration and bending vibration of the C–H bond, respectively [7,16,36].The broadband at 1732 cm−1 was assigned to the carbonyl group (C=O). The peaks associated with thestretching vibration in aromatic rings (C=O and –NH of amide groups) were observed at 1591 and1505 cm−1. The weak peaks around 1419 cm−1, 1369 cm−1 and 1316 cm−1 were attributed to thevibration of the –CN bond [9,16]. The peak at nearly 1234 cm−1 was assigned to the bending vibrationof carboxylic groups while deformation related to C–O bond was observed at 1040 cm−1 [32].
Appl. Sci. 2020, 10, x FOR PEER REVIEW 6 of 17
3. Results
3.1. Characterization of SSS Adsorbent
3.1.1. Fourier Transform Infrared Spectroscopy
The FTIR spectra of the adsorbent before and after adsorption of MC are presented in Figure 1. The FTIR spectra of the SSS clearly show several absorption peaks which reflect the complex nature of the material examined. The broad absorption peak around 3331.5 cm−1 was indicative of the existence of bonded hydroxyl groups on the surface of SSS. The peaks around 2912 and 2102 cm−1 were assigned to the stretching vibration and bending vibration of the C–H bond, respectively [7,16,36]. The broadband at 1732 cm−1 was assigned to the carbonyl group (C=O). The peaks associated with the stretching vibration in aromatic rings (C=O and –NH of amide groups) were observed at 1591 and 1505 cm−1. The weak peaks around 1419 cm−1, 1369 cm−1 and 1316 cm−1 were attributed to the vibration of the –CN bond [9,16]. The peak at nearly 1234 cm−1 was assigned to the bending vibration of carboxylic groups while deformation related to C–O bond was observed at 1040 cm−1 [32].
The strong peak at 1029 cm−1 was attributed to the Si (Si–O) valence vibrational binding. However, the weak peaks that intervene in the range 450–650 cm−1 can be attributed to the Si-reflection vibration binding S–O. All these peaks indicate the massive presence of oxygenated groups on the surface of SSS [36]. However, when the two spectra are compared, it is clear that the SSS spectrum after adsorption of MC shows a slight difference, namely, a generally slight shift in all peaks as well as an increase in the intensity of the peaks around 1594, 1316 and 983 cm−1. These changes are attributed to the loading of the SSS surface with the molecule of the model drug MC [22].
Figure 1. FTIR spectra of sunflower seed shells (SSS) before and after adsorption of
methylthioninium chloride (MC).
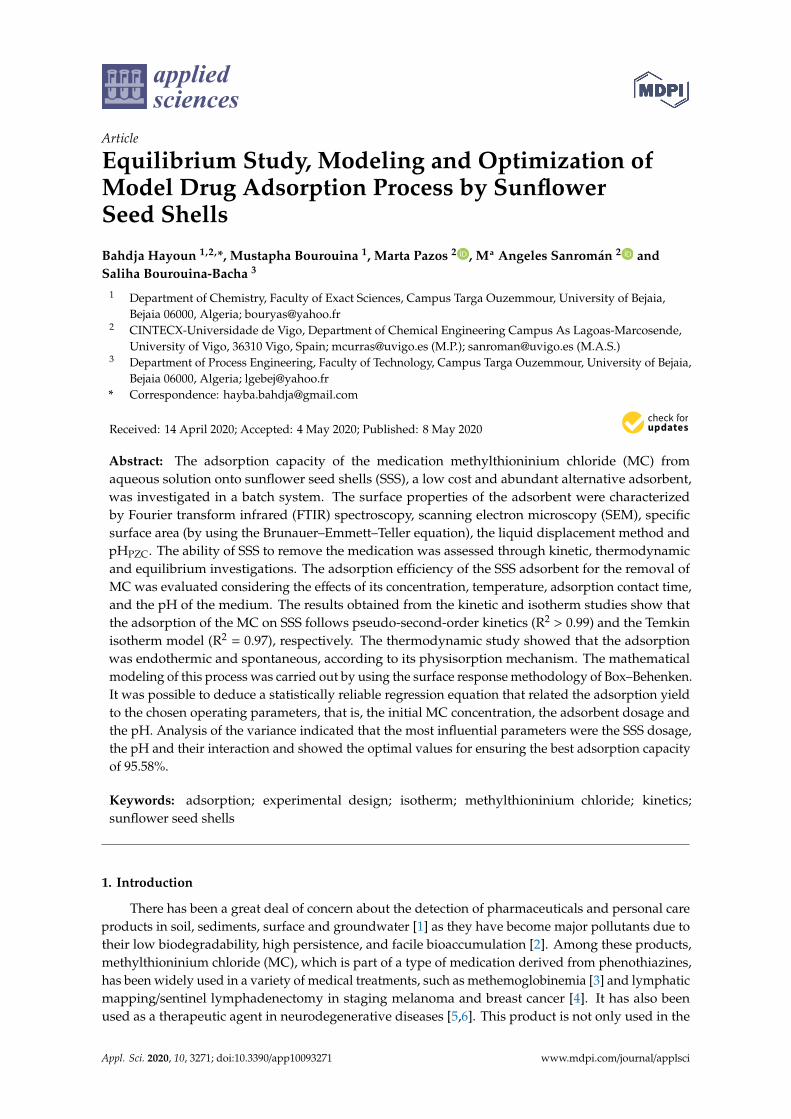
3.1.2. Scanning Electro-Microscopy (SEM)
The morphology of SSS examined by SEM, is illustrated in Figure 2. The SEM micrograph clearly shows that the SSS has an irregular and porous surface and the pores form a kind of honeycomb. This structure allows the MC solution to penetrate into the pores and attach to host sites. Indeed, this ability of the SSS to adsorb the MC was confirmed visually by the staining of the adsorbent after the adsorption test.
4000 3500 3000 2500 2000 1500 1000 500
65
70
75
80
85
90
95
100
105
110
115
450-650
983,
210
29,5
1029
,5
1237
,612
34,3
1326
,613
16,8
1376
,213
69,7
1419
,214
19,2
1505
1505
1594
,315
9117
32,9
1732
,9
2106
,321
02,7
2912
2912
3318
,433
31,5
Tran
smitt
ance
(%)
Wavenumbers (cm-1)
Before Ads After Ads
Figure 1. FTIR spectra of sunflower seed shells (SSS) before and after adsorption of methylthioniniumchloride (MC).
The strong peak at 1029 cm−1 was attributed to the Si (Si–O) valence vibrational binding.However, the weak peaks that intervene in the range 450–650 cm−1 can be attributed to the Si-reflectionvibration binding S–O. All these peaks indicate the massive presence of oxygenated groups on thesurface of SSS [36]. However, when the two spectra are compared, it is clear that the SSS spectrumafter adsorption of MC shows a slight difference, namely, a generally slight shift in all peaks as well asan increase in the intensity of the peaks around 1594, 1316 and 983 cm−1. These changes are attributedto the loading of the SSS surface with the molecule of the model drug MC [22].
Appl. Sci. 2020, 10, 3271 7 of 17
3.1.2. Scanning Electro-Microscopy (SEM)
The morphology of SSS examined by SEM, is illustrated in Figure 2. The SEM micrograph clearlyshows that the SSS has an irregular and porous surface and the pores form a kind of honeycomb.This structure allows the MC solution to penetrate into the pores and attach to host sites. Indeed, thisability of the SSS to adsorb the MC was confirmed visually by the staining of the adsorbent after theadsorption test.Appl. Sci. 2020, 10, x FOR PEER REVIEW 7 of 17
Figure 2. SEM micrograph of SSS.
3.1.3. BET Specific Surface Area and Other Characteristics of SSS
The physico-chemical characteristics of SSS are summarized in Table 2. As observed, the BET surface area of the SSS was found to be 6.106 m2/g, with a total pore volume of 9.689 cm3/g, and average pore diameter of 3.17330 Å; this shows that the SSS have better surface characteristics as a natural adsorbent, without any treatment.
In addition, the SSS had a very high porosity of about 90% which is in agreement with the SEM characterization, as shown in Figure 2. On the other hand, the real and apparent density, as well as the zero load point were determined. These gave us the same resolution as the other parameters.
Guediri et al. [37] showed a porosity of 79% with a bulk density of 0.026 g/cm3 for orange peels treated with phosphoric acid (OP-H3 PO4). Stavrinou et al. [38] determined BET surface areas of 0.8549 m2/g and 0.6140 m2/g for cucumber peel and potato peel, respectively.
Table 2. Physical and chemical characteristics of SSS.
Parameters Values Specific surface (m2/g) 6.106
Average pore radius (Å) 3.17330 Total pore volume (cm3/g) 9.689
Porosity (%) 82.92 Porous volume (cm3/g) 2.217
Apparent density (g/cm3) 0.374 Real density (g/cm3) 2.189
pHZPC 7.14
3.2. Adsorption Equilibria
3.2.1. Effect of Adsorbent–Adsorbate Contact Time and Initial MC Concentration
The effect of the contact time (0–120 min) and the initial MC concentration (20, 30, 60, 90, 120, 150 mg/L) on the adsorption efficiency are shown in Figure 3. The adsorption efficiency of MC increases with the contact time and reaches equilibrium at about 90 min with a maximum removal value of 90.07% for an initial concentration of 20 mg/L, pH = 6 of the solution and 2 g/L of the SSS dosage. The rapid increase in MC adsorption efficiency in the first 30 min can be attributed to the availability of the uncovered surface as well as the high number of empty active sites at the initial time of the process on the adsorbent surface. It is clear that the elimination efficiency decreases from 90.07 to 69.77% when the initial concentration of MC decreases from 20 to 150 mg/L. This result can
Figure 2. SEM micrograph of SSS.
3.1.3. BET Specific Surface Area and Other Characteristics of SSS
The physico-chemical characteristics of SSS are summarized in Table 2. As observed, the BETsurface area of the SSS was found to be 6.106 m2/g, with a total pore volume of 9.689 cm3/g, and averagepore diameter of 3.17330 Å; this shows that the SSS have better surface characteristics as a naturaladsorbent, without any treatment.
Table 2. Physical and chemical characteristics of SSS.
Parameters Values
Specific surface (m2/g) 6.106
Average pore radius (Å) 3.17330
Total pore volume (cm3/g) 9.689
Porosity (%) 82.92
Porous volume (cm3/g) 2.217
Apparent density (g/cm3) 0.374
Real density (g/cm3) 2.189
pHZPC 7.14
In addition, the SSS had a very high porosity of about 90% which is in agreement with the SEMcharacterization, as shown in Figure 2. On the other hand, the real and apparent density, as well as thezero load point were determined. These gave us the same resolution as the other parameters.
Guediri et al. [37] showed a porosity of 79% with a bulk density of 0.026 g/cm3 for orange peelstreated with phosphoric acid (OP-H3 PO4). Stavrinou et al. [38] determined BET surface areas of0.8549 m2/g and 0.6140 m2/g for cucumber peel and potato peel, respectively.
Appl. Sci. 2020, 10, 3271 8 of 17
3.2. Adsorption Equilibria
3.2.1. Effect of Adsorbent–Adsorbate Contact Time and Initial MC Concentration
The effect of the contact time (0–120 min) and the initial MC concentration (20, 30, 60, 90, 120,150 mg/L) on the adsorption efficiency are shown in Figure 3. The adsorption efficiency of MC increaseswith the contact time and reaches equilibrium at about 90 min with a maximum removal value of 90.07%for an initial concentration of 20 mg/L, pH = 6 of the solution and 2 g/L of the SSS dosage. The rapidincrease in MC adsorption efficiency in the first 30 min can be attributed to the availability of theuncovered surface as well as the high number of empty active sites at the initial time of the process onthe adsorbent surface. It is clear that the elimination efficiency decreases from 90.07 to 69.77% when theinitial concentration of MC decreases from 20 to 150 mg/L. This result can be explained by consideringthat at a lower initial MC concentration, the ratio of the adsorbent active sites to the total adsorbate ishigh and therefore all adsorbate molecules can interact with the adsorbent and be removed from thesolution [7,17]. However, the uptake of MC at equilibrium state climbed from 8.96 mg/g to 52.50 mg/g,when the initial drug concentration increased from 20 to 150 mg/L. Indeed, it can be assumed thatbecause of the increase in the content of MC in solution, and therefore the increase in the concentrationgradient, the arrival of the molecules of the adsorbate towards the surface of the adsorbent becomeseasier, which induces the higher occupation of active sites. [18–39]. Therefore, 60 mg/L was selected asthe optimum initial concentration of MC for the adsorption experiments.
Appl. Sci. 2020, 10, x FOR PEER REVIEW 8 of 17
be explained by considering that at a lower initial MC concentration, the ratio of the adsorbent active sites to the total adsorbate is high and therefore all adsorbate molecules can interact with the adsorbent and be removed from the solution [7,17]. However, the uptake of MC at equilibrium state climbed from 8.96 mg/g to 52.50 mg/g, when the initial drug concentration increased from 20 to 150 mg/L. Indeed, it can be assumed that because of the increase in the content of MC in solution, and therefore the increase in the concentration gradient, the arrival of the molecules of the adsorbate towards the surface of the adsorbent becomes easier, which induces the higher occupation of active sites. [18–39]. Therefore, 60 mg/L was selected as the optimum initial concentration of MC for the adsorption experiments.
(a) (b)
Figure 3. Evolution of adsorption efficiency (a) and uptake (b) of MC at equilibrium in terms of contact time and initial MC concentration (conditions: SSS dose: 2 g/L, pH 6.0, flask shaking at 300 rpm at 25 °C).
3.2.2. Effect of Adsorbent Dosage
The dependence of the MC adsorption efficiency on the dosage of SSS (1–3 g/L) for an initial concentration of 60 mg/L, a solution pH 6 and a contact time of 120 min is illustrated in Figure 4. The adsorption rate increases with the dose of SSS and stabilizes from 2.5 g/L. A significant improvement in the adsorption of MC from 66.39% to 89.04% is observed when the SSS dosage changes from 1 to 2.5 g/L. This result is due to the increase in functional groups and adsorption sites, which is linked to the properties of the adsorbent [7,17].
On the other hand, the increase in sorbent dose from 1 g/L to 3 g/L caused a decrease in the uptake of MC from 39.72 mg/g at 17.60 mg/g, respectively, which is entirely logical given that “q” is inversely proportional to the total quantity of adsorbent in suspension [39].
0
20
40
60
80
100
0 50 100 150
Y(%
)
time (min)
20 mg/L 30 mg/L
60 mg/L 90 mg/L
120 mg/L 150 mg/L0
10
20
30
40
50
60
0 5 0 1 0 0 1 5 0
q t(m
g/g)
time (min)
20 mg/L
30 mg/L
60 mg/L
90 mg/L
120 mg/L
150 mg/L
Figure 3. Evolution of adsorption efficiency (a) and uptake (b) of MC at equilibrium in terms of contacttime and initial MC concentration (conditions: SSS dose: 2 g/L, pH 6.0, flask shaking at 300 rpm at 25 ◦C).
3.2.2. Effect of Adsorbent Dosage
The dependence of the MC adsorption efficiency on the dosage of SSS (1–3 g/L) for an initialconcentration of 60 mg/L, a solution pH 6 and a contact time of 120 min is illustrated in Figure 4.The adsorption rate increases with the dose of SSS and stabilizes from 2.5 g/L. A significant improvementin the adsorption of MC from 66.39% to 89.04% is observed when the SSS dosage changes from 1 to2.5 g/L. This result is due to the increase in functional groups and adsorption sites, which is linked tothe properties of the adsorbent [7,17].
On the other hand, the increase in sorbent dose from 1 g/L to 3 g/L caused a decrease in the uptakeof MC from 39.72 mg/g at 17.60 mg/g, respectively, which is entirely logical given that “q” is inverselyproportional to the total quantity of adsorbent in suspension [39].
Appl. Sci. 2020, 10, 3271 9 of 17Appl. Sci. 2020, 10, x FOR PEER REVIEW 9 of 17
(a) (b)
Figure 4. Effect of adsorbent dose on the adsorption efficiency (a) and uptake (b) of MC onto SSS (conditions: initial MC concentration 60 mg/L, pH 6, flask shaking at 300 rpm at 25 °C).
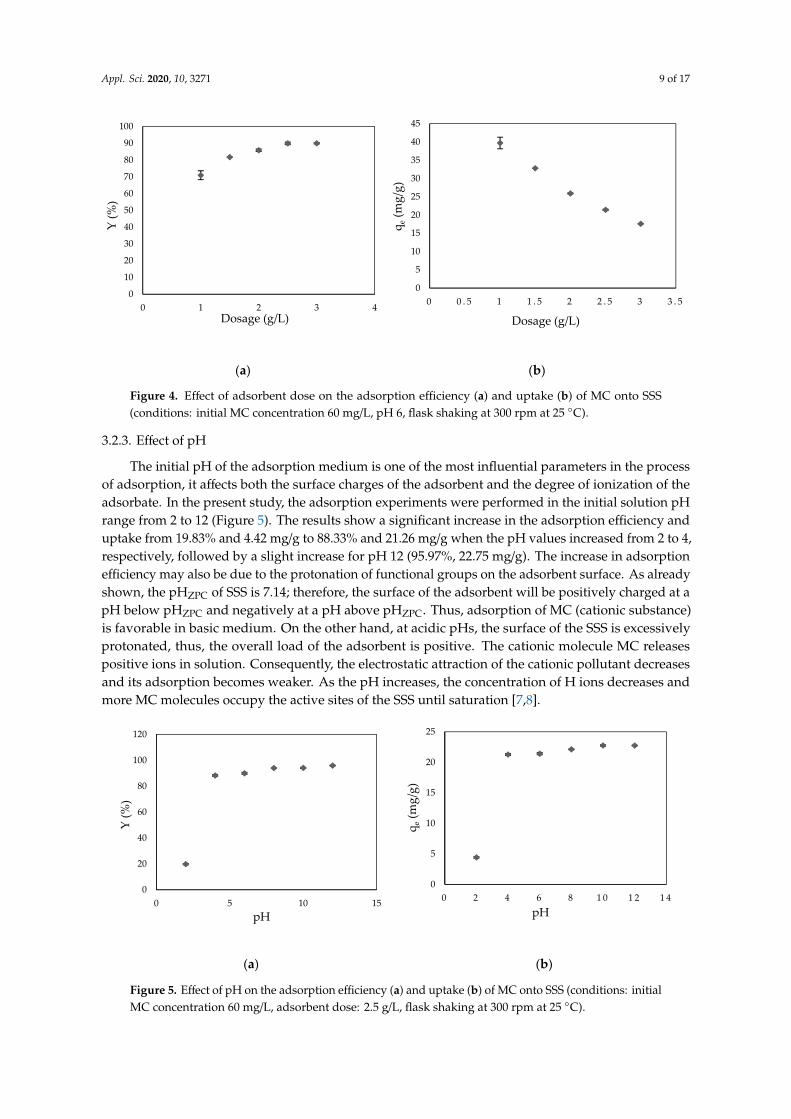
3.2.3. Effect of pH
The initial pH of the adsorption medium is one of the most influential parameters in the process of adsorption, it affects both the surface charges of the adsorbent and the degree of ionization of the adsorbate. In the present study, the adsorption experiments were performed in the initial solution pH range from 2 to 12 (Figure 5). The results show a significant increase in the adsorption efficiency and uptake from 19.83% and 4.42 mg/g to 88.33% and 21.26 mg/g when the pH values increased from 2 to 4, respectively, followed by a slight increase for pH 12 (95.97%, 22.75 mg/g). The increase in adsorption efficiency may also be due to the protonation of functional groups on the adsorbent surface. As already shown, the pHZPC of SSS is 7.14; therefore, the surface of the adsorbent will be positively charged at a pH below pHZPC and negatively at a pH above pHZPC. Thus, adsorption of MC (cationic substance) is favorable in basic medium. On the other hand, at acidic pHs, the surface of the SSS is excessively protonated, thus, the overall load of the adsorbent is positive. The cationic molecule MC releases positive ions in solution. Consequently, the electrostatic attraction of the cationic pollutant decreases and its adsorption becomes weaker. As the pH increases, the concentration of H ions decreases and more MC molecules occupy the active sites of the SSS until saturation [7,8].
(a) (b)
Figure 5. Effect of pH on the adsorption efficiency (a) and uptake (b) of MC onto SSS (conditions: initial MC concentration 60 mg/L, adsorbent dose: 2.5 g/L, flask shaking at 300 rpm at 25 °C).
0
10
20
30
40
50
60
70
80
90
100
0 1 2 3 4
Y (%
)
Dosage (g/L)
0
5
10
15
20
25
30
35
40
45
0 0 . 5 1 1 . 5 2 2 . 5 3 3 . 5
q e(m
g/g)
Dosage (g/L)
0
20
40
60
80
100
120
0 5 10 15
Y (%
)
pH
0
5
10
15
20
25
0 2 4 6 8 1 0 1 2 1 4
q e(m
g/g)
pH
Figure 4. Effect of adsorbent dose on the adsorption efficiency (a) and uptake (b) of MC onto SSS(conditions: initial MC concentration 60 mg/L, pH 6, flask shaking at 300 rpm at 25 ◦C).
3.2.3. Effect of pH
The initial pH of the adsorption medium is one of the most influential parameters in the processof adsorption, it affects both the surface charges of the adsorbent and the degree of ionization of theadsorbate. In the present study, the adsorption experiments were performed in the initial solution pHrange from 2 to 12 (Figure 5). The results show a significant increase in the adsorption efficiency anduptake from 19.83% and 4.42 mg/g to 88.33% and 21.26 mg/g when the pH values increased from 2 to 4,respectively, followed by a slight increase for pH 12 (95.97%, 22.75 mg/g). The increase in adsorptionefficiency may also be due to the protonation of functional groups on the adsorbent surface. As alreadyshown, the pHZPC of SSS is 7.14; therefore, the surface of the adsorbent will be positively charged at apH below pHZPC and negatively at a pH above pHZPC. Thus, adsorption of MC (cationic substance)is favorable in basic medium. On the other hand, at acidic pHs, the surface of the SSS is excessivelyprotonated, thus, the overall load of the adsorbent is positive. The cationic molecule MC releasespositive ions in solution. Consequently, the electrostatic attraction of the cationic pollutant decreasesand its adsorption becomes weaker. As the pH increases, the concentration of H ions decreases andmore MC molecules occupy the active sites of the SSS until saturation [7,8].
Appl. Sci. 2020, 10, x FOR PEER REVIEW 9 of 17
(a) (b)
Figure 4. Effect of adsorbent dose on the adsorption efficiency (a) and uptake (b) of MC onto SSS (conditions: initial MC concentration 60 mg/L, pH 6, flask shaking at 300 rpm at 25 °C).
3.2.3. Effect of pH
The initial pH of the adsorption medium is one of the most influential parameters in the process of adsorption, it affects both the surface charges of the adsorbent and the degree of ionization of the adsorbate. In the present study, the adsorption experiments were performed in the initial solution pH range from 2 to 12 (Figure 5). The results show a significant increase in the adsorption efficiency and uptake from 19.83% and 4.42 mg/g to 88.33% and 21.26 mg/g when the pH values increased from 2 to 4, respectively, followed by a slight increase for pH 12 (95.97%, 22.75 mg/g). The increase in adsorption efficiency may also be due to the protonation of functional groups on the adsorbent surface. As already shown, the pHZPC of SSS is 7.14; therefore, the surface of the adsorbent will be positively charged at a pH below pHZPC and negatively at a pH above pHZPC. Thus, adsorption of MC (cationic substance) is favorable in basic medium. On the other hand, at acidic pHs, the surface of the SSS is excessively protonated, thus, the overall load of the adsorbent is positive. The cationic molecule MC releases positive ions in solution. Consequently, the electrostatic attraction of the cationic pollutant decreases and its adsorption becomes weaker. As the pH increases, the concentration of H ions decreases and more MC molecules occupy the active sites of the SSS until saturation [7,8].
(a) (b)
Figure 5. Effect of pH on the adsorption efficiency (a) and uptake (b) of MC onto SSS (conditions: initial MC concentration 60 mg/L, adsorbent dose: 2.5 g/L, flask shaking at 300 rpm at 25 °C).
0
10
20
30
40
50
60
70
80
90
100
0 1 2 3 4
Y (%
)
Dosage (g/L)
0
5
10
15
20
25
30
35
40
45
0 0 . 5 1 1 . 5 2 2 . 5 3 3 . 5
q e(m
g/g)
Dosage (g/L)
0
20
40
60
80
100
120
0 5 10 15
Y (%
)
pH
0
5
10
15
20
25
0 2 4 6 8 1 0 1 2 1 4
q e(m
g/g)
pH
Figure 5. Effect of pH on the adsorption efficiency (a) and uptake (b) of MC onto SSS (conditions: initialMC concentration 60 mg/L, adsorbent dose: 2.5 g/L, flask shaking at 300 rpm at 25 ◦C).
Appl. Sci. 2020, 10, 3271 10 of 17
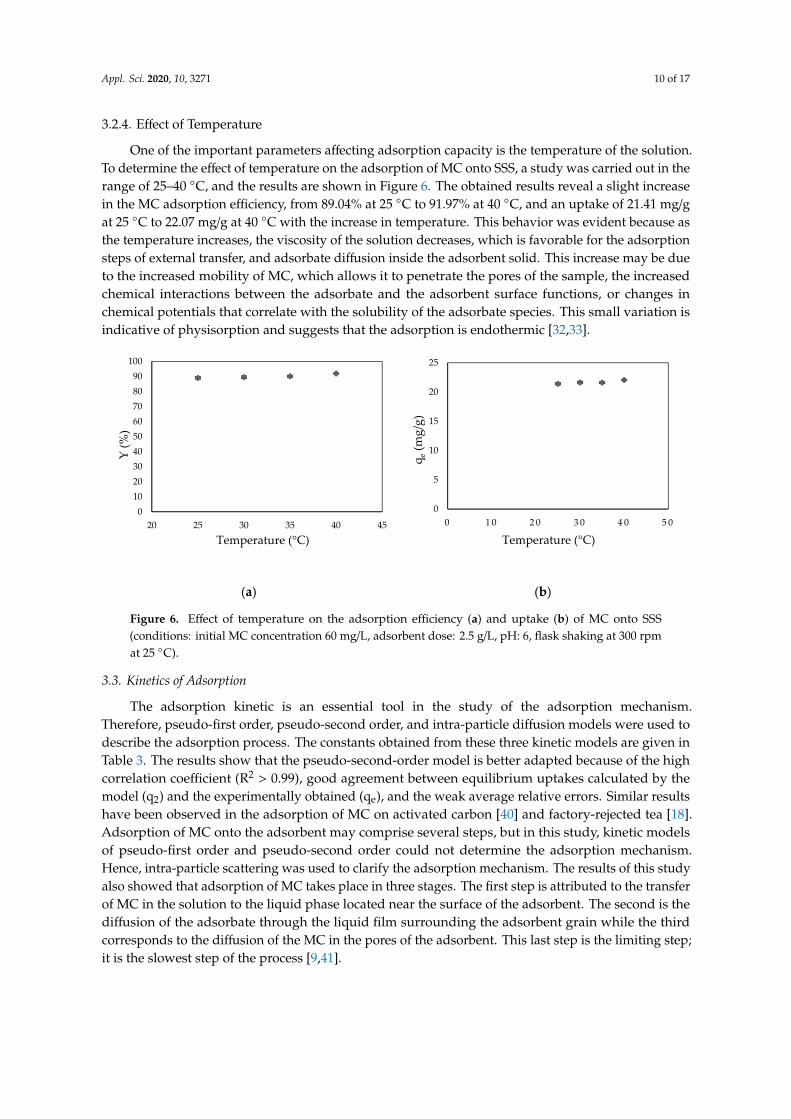
3.2.4. Effect of Temperature
One of the important parameters affecting adsorption capacity is the temperature of the solution.To determine the effect of temperature on the adsorption of MC onto SSS, a study was carried out in therange of 25–40 ◦C, and the results are shown in Figure 6. The obtained results reveal a slight increasein the MC adsorption efficiency, from 89.04% at 25 ◦C to 91.97% at 40 ◦C, and an uptake of 21.41 mg/gat 25 ◦C to 22.07 mg/g at 40 ◦C with the increase in temperature. This behavior was evident because asthe temperature increases, the viscosity of the solution decreases, which is favorable for the adsorptionsteps of external transfer, and adsorbate diffusion inside the adsorbent solid. This increase may be dueto the increased mobility of MC, which allows it to penetrate the pores of the sample, the increasedchemical interactions between the adsorbate and the adsorbent surface functions, or changes inchemical potentials that correlate with the solubility of the adsorbate species. This small variation isindicative of physisorption and suggests that the adsorption is endothermic [32,33].
Appl. Sci. 2020, 10, x FOR PEER REVIEW 10 of 17
3.2.4. Effect of Temperature
One of the important parameters affecting adsorption capacity is the temperature of the solution. To determine the effect of temperature on the adsorption of MC onto SSS, a study was carried out in the range of 25–40 °C, and the results are shown in Figure 6. The obtained results reveal a slight increase in the MC adsorption efficiency, from 89.04% at 25 °C to 91.97% at 40 °C, and an uptake of 21.41 mg/g at 25 °C to 22.07 mg/g at 40 °C with the increase in temperature. This behavior was evident because as the temperature increases, the viscosity of the solution decreases, which is favorable for the adsorption steps of external transfer, and adsorbate diffusion inside the adsorbent solid. This increase may be due to the increased mobility of MC, which allows it to penetrate the pores of the sample, the increased chemical interactions between the adsorbate and the adsorbent surface functions, or changes in chemical potentials that correlate with the solubility of the adsorbate species. This small variation is indicative of physisorption and suggests that the adsorption is endothermic [32,33].
(a) (b)
Figure 6. Effect of temperature on the adsorption efficiency (a) and uptake (b) of MC onto SSS (conditions: initial MC concentration 60 mg/L, adsorbent dose: 2.5 g/L, pH: 6, flask shaking at 300 rpm at 25 °C).
3.3. Kinetics of Adsorption
The adsorption kinetic is an essential tool in the study of the adsorption mechanism. Therefore, pseudo-first order, pseudo-second order, and intra-particle diffusion models were used to describe the adsorption process. The constants obtained from these three kinetic models are given in Table 3. The results show that the pseudo-second-order model is better adapted because of the high correlation coefficient (R² > 0.99), good agreement between equilibrium uptakes calculated by the model (q2) and the experimentally obtained (qe), and the weak average relative errors. Similar results have been observed in the adsorption of MC on activated carbon [40] and factory-rejected tea [18]. Adsorption of MC onto the adsorbent may comprise several steps, but in this study, kinetic models of pseudo-first order and pseudo-second order could not determine the adsorption mechanism. Hence, intra-particle scattering was used to clarify the adsorption mechanism. The results of this study also showed that adsorption of MC takes place in three stages. The first step is attributed to the transfer of MC in the solution to the liquid phase located near the surface of the adsorbent. The second is the diffusion of the adsorbate through the liquid film surrounding the adsorbent grain while the third corresponds to the diffusion of the MC in the pores of the adsorbent. This last step is the limiting step; it is the slowest step of the process [9,41].
0102030405060708090
100
20 25 30 35 40 45
Y (%
)
Temperature (°C)
0
5
10
15
20
25
0 1 0 2 0 3 0 4 0 5 0
q e(m
g/g)
Temperature (°C)
Figure 6. Effect of temperature on the adsorption efficiency (a) and uptake (b) of MC onto SSS(conditions: initial MC concentration 60 mg/L, adsorbent dose: 2.5 g/L, pH: 6, flask shaking at 300 rpmat 25 ◦C).
3.3. Kinetics of Adsorption
The adsorption kinetic is an essential tool in the study of the adsorption mechanism.Therefore, pseudo-first order, pseudo-second order, and intra-particle diffusion models were used todescribe the adsorption process. The constants obtained from these three kinetic models are given inTable 3. The results show that the pseudo-second-order model is better adapted because of the highcorrelation coefficient (R2 > 0.99), good agreement between equilibrium uptakes calculated by themodel (q2) and the experimentally obtained (qe), and the weak average relative errors. Similar resultshave been observed in the adsorption of MC on activated carbon [40] and factory-rejected tea [18].Adsorption of MC onto the adsorbent may comprise several steps, but in this study, kinetic modelsof pseudo-first order and pseudo-second order could not determine the adsorption mechanism.Hence, intra-particle scattering was used to clarify the adsorption mechanism. The results of this studyalso showed that adsorption of MC takes place in three stages. The first step is attributed to the transferof MC in the solution to the liquid phase located near the surface of the adsorbent. The second is thediffusion of the adsorbate through the liquid film surrounding the adsorbent grain while the thirdcorresponds to the diffusion of the MC in the pores of the adsorbent. This last step is the limiting step;it is the slowest step of the process [9,41].

Appl. Sci. 2020, 10, 3271 11 of 17
Table 3. Kinetic parameters of the adsorption of MC on the SSS following different kinetic models.
Initial Concentration of MC (mg/L) 20 30 60 90 120 150
qe (exp.) (mg/g) 9.029 13.927 25.893 37.389 48.51 51.522
Pseudo-first order model
q1 (mg/g) 0.457 1.528 7.649 12.222 12.958 15.979
k1 (1/min) 0.0358 0.0646 0.0744 0.0472 0.0371 0.038
R2 0.87 0.944 0.969 0.965 0.989 0.972
ARE (%) 97.191 92.531 79.186 78.708 84.380 82.813
Pseudo-second order model
q2 (mg/g) 9.047 12.453 26.247 38.759 44.444 54.054
k2 (g/mg min) 0.243 0.016 0.027 0.009 0.003 0.005
R2 1 0.994 0.999 0.999 0.991 0.999
ARE (%) 1.455 28.099 2.424 3.064 26.584 7.421
Intra-particle diffusion model
Kd1 (mg/g√
min) 0.338 1.137 1.167 2.62 2.26 2.62
C1 (mg/g) 7.863 9.858 13.433 20.461 31.975 23.101
R2 1 0.993 0.874 0.914 0.972 0.978
Kd2(mg/g√
min) 0.048 0.071 0.08 0.369 0.848 0.963
C2 (mg/g) 8.58 13.273 25.121 33.85 40.324 42.743
R2 0.875 0.889 0.741 0.977 0.998 0.806
ARE (%) 3.743 8.439 15.498 19.304 3.286 17.329
3.4. Adsorption Isotherms
To carry out a more detailed study of the adsorption mechanism, the adsorption isotherms wereadjusted to the Langmuir, Freundlich and Temkin models. The constants obtained from the equationsof these three models are summarized in Table 4. The results show that the Temkin model is the onethat best simulates this process because of the higher correlation coefficient (R2 > 0.970), and a lowermean relative error (ARE = 9.804%). Similar results were observed in the study of adsorption of MCvia maize silk powder [25]. For the Langmuir model, the value of the separation factor RL describes thefeasibility of the adsorption process. In our study, RL values vary between 0.071 and 0.652 indicatingfavorability of adsorption [42]. The latter also allowed us to determine the maximum uptake of MC onSSS, qm = 63.29 mg/g at equilibrium time tequ = 90 min. As a comparison, Oguntimein [39] determineda maximum uptake of qm = 0.0365 mg/g for the adsorption of MC onto SSS treated with sodiumhydroxide (0.05 M NaOH) at tequ = 120 min, and El-Halwany [43] determined a maximum uptake ofqm = 39.4 mg/g for the adsorption of MC onto activated carbon prepared by chemical activation of SSSuses phosphoric acid (H3PO4) at tequ = 150 min.
The Freundlich isotherm model allowed us to determine the parameter nF, which determines theadsorption effectiveness. According to the results, the calculated value of the Freundlich isothermmodel constant, nf is greater than 1 (nF = 1.879), which confirms that the adsorption phenomenon isfavorable [42].

Appl. Sci. 2020, 10, 3271 12 of 17
Table 4. Parameters of the adsorption isotherm models.
Isotherms Models Parameters Values R2 ARE (%)
Langmuir
qm(mg/g) 63.29 0.986 57.611
KL(L/mg) 0.275
RL 0.071–0.652
FreundlichKF (mg/g) (L/g)n 8.005 0.945 14.365
nF 1.872
TemkinKT(L/g) 1.093 0.970 9.804
RT/b (BT(KJ/mol)) 13.508
3.5. Thermodynamic Study
Since temperature plays an important role in MC adsorption, the thermodynamic adsorptionparameters were calculated to evaluate the thermodynamic feasibility and the spontaneous natureof the process (Table 5). The results showed that the adsorption of MC on SSS was spontaneous andfavorable at all experimental temperatures as a result of the negative values of ∆G; furthermore, the ∆Gvalues decrease with increasing temperature (from −2.967 KJ/mol for 25 ◦C to −3.953 KJ/mol for 40 ◦C),which indicates that this process becomes less favorable as the temperature increases. Similar resultswere observed by Gao et al. [42] in the study of adsorption of MC onto activated carbon producedfrom tea (Camellia sinensis L.) seed shells. The positive value of ∆H (∆H = 58.461 KJ/mol) suggests thatthe process is endothermic [33]. We can see that the entropy value ∆S is positive, almost constant andweak for the whole range of temperatures studied (0.206–0.199 KJ/mol K); this indicates an increase inthe randomness of interactions in the diffusion layer during the adsorption process [17].
Table 5. Obtained thermodynamic parameters in the range of tested temperatures.
T (◦K) ∆G◦ (KJ/mol) ∆S◦ (KJ/mol K) ∆H◦ (KJ/mol)
298 −2.967 0.206
58.461303 −3.245 0.204
308 −3.314 0.201
313 −3.953 0.199
3.6. Optimization and Modeling by Response Surface
In this study, a three-level, three-factor, 15-assay BBD was used to optimize MC adsorptionon adsorbent prepared from SSS. The independent variables evaluated for the study are the initialconcentration of the aqueous solution MC (X1), the adsorbent dosage (X2) and the solution pH (X3)(Table 1). The experiments were performed to optimize the adsorption efficiency of the medicationon the prepared adsorbent. The obtained results are summarized in Table 6, in which the responseevaluated was the MC removal (Y).
The obtained responses were analyzed using Minitab 17 software. The polynomial equation thatdescribes the main effects, the interaction effects and the quadratic effects of the selected independentvariables show a significant influence on the responses [44]. The results of the analysis were evaluatedusing ANOVA variance analysis and are presented in Table 7.

Appl. Sci. 2020, 10, 3271 13 of 17
Table 6. Matrix of experiments with coded, uncoded factors and the response.
N0 X1 X2 X3 Ci (mg/L) m (g/L) pH Y (%)
1 −1 −1 0 20 1 7 88.5539
2 1 −1 0 90 1 7 75.1651
3 −1 1 0 20 3 7 96.5097
4 1 1 0 90 3 7 93.3073
5 −1 0 −1 20 2 4 77.9135
6 1 0 −1 90 2 4 77.3905
7 −1 0 1 20 2 10 96.6233
8 1 0 1 90 2 10 92.3212
9 0 −1 −1 55 1 4 59.7206
10 0 1 −1 55 3 4 89.1495
11 0 −1 1 55 1 10 85.9411
12 0 1 1 55 3 10 96.7700
13 0 0 0 55 2 7 91.1453
14 0 0 0 55 2 7 92.5922
15 0 0 0 55 2 7 93.4458
Table 7. Analysis of variance (ANOVA) of the model.
Source DF Adj SS Adj MS F-Value p-Value
Model 9 1458.65 162.072 17.98 0.003Linear 3 1176.94 392.312 43.52 0.001
Ci 1 57.33 57.332 6.36 0.053m 1 550.38 550.385 61.05 0.001
pH 1 569.22 569.219 63.14 0.001Square 3 165.71 55.238 6.13 0.040Ci·Ci 1 0.66 0.657 0.07 0.798m·m 1 47.55 47.550 5.27 0.070
pH·pH 1 128.99 128.986 14.31 0.0132-way Interaction 3 116.00 38.667 4.29 0.075
Ci·m 1 25.94 25.940 2.88 0.151Ci·pH 1 3.57 3.571 0.40 0.557m·pH 1 86.49 86.490 9.59 0.027Error 5 45.08 9.015
Lack-of-fit 3 42.37 14.124 10.44 0.089Pure error 2 2.70 1.352
Total 14 1503.73
The high values of the correlation coefficient (R2) and the adjusted correlation coefficient (R2Adj),0.97 and 0.91, respectively, show that the proposed model explains more than 91% of the variations inthe experimental response [35].
Similar results were determined by Gulen and Demircivi [45] who determined values of 0.9224 and0.8227 for R2 and R2Adj coefficients, respectively. So, the authors concluded that these values indicatedgood fitness and high significance for the statistical model. Elmoubarki et al. [46] also reported thatthe obtained R2 coefficients are in reasonable agreement with the R2 Adj and more than 95% of theresponse can be well predicted by the models.
The quadratic model is written in the following form:.
Y% = −4.4− 0.121 Ci + 29.50 m + 15.60 pH− 0.67 pH2− 1.550 m·pH (18)

Appl. Sci. 2020, 10, 3271 14 of 17
The quadratic model well describes the adsorption efficiency (Y%) of MC on the adsorbent (SSS).It is significant and adequate as proved by the p-value (p-value = 0.003) with only 3% of total unappliedvariations for the model (R2 = 97%) [35,44].
Figure 7 shows the 3-D response surfaces of the individual and interaction effects of the parametersthat influence the MC adsorption process on SSS. The 3-D curves were plotted by varying twoparameters in the experimental domain while the third parameter is kept constant (at the center level).It was found that high adsorption efficiency can be attained at low initial concentrations and high pH(Figure 7b). With respect to the effect of amount on adsorption efficiency, it can be seen in Figure 7a,cthat high efficiency can be obtained when the adsorbent dosage of SSS is high [35]. This is confirmedby Figure 8 which shows the optimal conditions for maximum MC adsorption efficiency onto SSS.
Appl. Sci. 2020, 10, x FOR PEER REVIEW 14 of 17
(a) (b)
(c)
Figure 7. Response surface plots of Y% or R%: (a) interaction Ci*m, (b) interaction Ci*pH, (c) interaction m*pH.
(a) (b) (c)
Figure 8. Optimal conditions for maximum MC adsorption efficiency onto SSS: (a) Ci (mg/L) MC initial concentration, (b) m (g/L) SSS dosage and (c) pH.
4. Conclusions
In this work, two approaches were used , the first was the evaluation of MC adsorption on SSS by kinetic, thermodynamic and equilibrium studies; and the second was modeling with an experimental Box–Behnken design. The equilibrium data indicated that the adsorption was fast and achieved within 120 min of contact time. Analyses of the kinetic and isotherm models revealed that the experimental data were well fitted by the pseudo-second order model and the Temkin isotherm, respectively. The adsorption process was shown to be controlled by intra-particle diffusion in the later stages. The thermodynamic study showed that adsorption was endothermic, spontaneous, and thus followed a physisorption mechanism. Furthermore, BBD design was appropriate for determining the optimal conditions for MC adsorption onto SSS. The optimal conditions of adsorption are an adsorbent dose of 2.4 g/L, an initial MC concentration of 20 mg/L and pH = 8,9 with
Ci 55m 2pH 7
Hold Values
30 06
80
90
3
2190
90
1 00
%R
m
iC03 06
08
09
0,509
,001,7 5
100
%R
Hp
iC
601
2600708
1 0,07,5
5 0,3
90%R
Hp
m
CurHigh
LowD: 1,000Optimal
Predict
d = 1,0000
MaximumR%
y = 98,7669
4,0
10,0
1,0
3,0
20,0
90,0m pHCi
[20,0] [2,3939] [8,9091]
Figure 7. Response surface plots of Y% or R%: (a) interaction Ci*m, (b) interaction Ci*pH,(c) interaction m*pH.
Appl. Sci. 2020, 10, x FOR PEER REVIEW 14 of 17
(a) (b)
(c)
Figure 7. Response surface plots of Y% or R%: (a) interaction Ci*m, (b) interaction Ci*pH, (c) interaction m*pH.
(a) (b) (c)
Figure 8. Optimal conditions for maximum MC adsorption efficiency onto SSS: (a) Ci (mg/L) MC initial concentration, (b) m (g/L) SSS dosage and (c) pH.
4. Conclusions
In this work, two approaches were used , the first was the evaluation of MC adsorption on SSS by kinetic, thermodynamic and equilibrium studies; and the second was modeling with an experimental Box–Behnken design. The equilibrium data indicated that the adsorption was fast and achieved within 120 min of contact time. Analyses of the kinetic and isotherm models revealed that the experimental data were well fitted by the pseudo-second order model and the Temkin isotherm, respectively. The adsorption process was shown to be controlled by intra-particle diffusion in the later stages. The thermodynamic study showed that adsorption was endothermic, spontaneous, and thus followed a physisorption mechanism. Furthermore, BBD design was appropriate for determining the optimal conditions for MC adsorption onto SSS. The optimal conditions of adsorption are an adsorbent dose of 2.4 g/L, an initial MC concentration of 20 mg/L and pH = 8,9 with
Ci 55m 2pH 7
Hold Values
30 06
80
90
3
2190
90
1 00
%R
m
iC03 06
08
09
0,509
,001,7 5
100
%R
Hp
iC
601
2600708
1 0,07,5
5 0,3
90%R
Hp
m
CurHigh
LowD: 1,000Optimal
Predict
d = 1,0000
MaximumR%
y = 98,7669
4,0
10,0
1,0
3,0
20,0
90,0m pHCi
[20,0] [2,3939] [8,9091]
Figure 8. Optimal conditions for maximum MC adsorption efficiency onto SSS: (a) Ci (mg/L) MC initialconcentration, (b) m (g/L) SSS dosage and (c) pH.

Appl. Sci. 2020, 10, 3271 15 of 17
Model terms with a p-value <0.05 are significant at a 95% confidence level, while terms with ap-value <0.05 do not affect the response [44].
Based on the analysis of the statistical results, it can be concluded that the resulting quadraticmodel is adequate and appropriate for describing the relationship between experimental parametersand adsorption efficiency [35].
Moreover, the optimization of the operating conditions was conducted using the maximumresponse function (Y = 98.77%) which could be obtained by taking the following operating conditions:Ci = 20 mg /L, m = 2.4 g/L and pH = 8.9.
The predicted optimal adsorption yield was verified by performing three tests under optimaloperating conditions (Y = 95.58%). The standard deviation of the achieved experimental results incomparison to the theoretical results is 2.25. Thus, it can be concluded that the model describing theadsorption of MC on SSS is valid.
4. Conclusions
In this work, two approaches were used, the first was the evaluation of MC adsorption on SSS bykinetic, thermodynamic and equilibrium studies; and the second was modeling with an experimentalBox–Behnken design. The equilibrium data indicated that the adsorption was fast and achieved within120 min of contact time. Analyses of the kinetic and isotherm models revealed that the experimentaldata were well fitted by the pseudo-second order model and the Temkin isotherm, respectively.The adsorption process was shown to be controlled by intra-particle diffusion in the later stages.The thermodynamic study showed that adsorption was endothermic, spontaneous, and thus followeda physisorption mechanism. Furthermore, BBD design was appropriate for determining the optimalconditions for MC adsorption onto SSS. The optimal conditions of adsorption are an adsorbent dose of2.4 g/L, an initial MC concentration of 20 mg/L and pH = 8,9 with a solution temperature of 25 ◦C;in these conditions the adsorption efficiency was 95.58%. Thus, SSS may be considered as a cheapand excellent adsorbent that shows excellent adsorptive characteristics for the removal of MC fromaqueous solutions.
Author Contributions: B.H. contributed to the design of the experiment, performed the experimental work,considered the results and wrote the paper. M.B. and S.B.-B. supervised and contributed to writing and editing.M.P. and M.A.S. revised and corrected the paper. All authors have read and agreed to the published version ofthe manuscript.
Funding: This study was funded by the Algerian Ministry of Higher Education and Scientific research, researchproject code N: A16N01UN060120190001 and the Spanish Ministry of Science, Innovation and Universities, Xuntade Galicia and ERDF (Grant Nº CTM2017−87326-R and ED431C 2017/47).
Conflicts of Interest: Page: 38The authors declare no conflict of interest.
References
1. Zhou, J.L.; Zhang, Z.L.; Banks, E.; Grover, D.; Jiang, J.Q. Résidus pharmaceutiques dans les effluents desusines de traitement des eaux usées et leur impact sur la réception de l’eau de la rivière. J. Hazard. Mater.2009, 166, 655–661. [CrossRef]
2. Zhang, S.; Dong, Y.; Yang, Z.; Yang, W.; Wu, J.; Dong, C. Adsorption of pharmaceuticals on chitosan-basedmagnetic composite particles with core-brush topology. Chem. Eng. J. 2016, 304, 325–334. [CrossRef]
3. Bradberry, S. Methaemoglobinaemia (review). Medicine (U.K.) 2016, 44, 91–92.4. Choulis, N.H. Dermatological drugs, topical agents, and cosmetics. Side Eff. Drugs Annu. 2012, 34, 257–269.5. Congdon, E.E.; Wu, J.W.; Myeku, N.; Figueroa, Y.H.; Herman, M.; Marinec, P.S.; Ge Stwicki, J.E.; Dickey, C.A.;
Yu, W.H.; Duff, K.E. Methylthioninium chloride (methylene blue) induces autophagy and attenuatestauopathy in vitro and in vivo. Autophagy 2012, 84, 609–622. [CrossRef] [PubMed]
6. Hashweh, N.N.; Bartochowski, Z.; Khoury, R.; Grossberg, G.T. An evaluation of hydromethylthionine as atreatment option for Alzheimer’s disease. Expert Opin. Pharmacother. 2020. [CrossRef] [PubMed]
7. Moussavi, G.; Khosravi, R. The removal of cationic dyes from aqueous solutions by adsorption onto pistachiohull waste. Chem. Eng. Res. Des. 2011, 89, 2182–2189. [CrossRef]

Appl. Sci. 2020, 10, 3271 16 of 17
8. Dahlan, N.A.; Ng, S.L.; Pushpamalar, J. Adsorption of methylene blue onto powdered activated carbonimmobilized in a carboxymethyl sago pulp hydrogel. J. Appl. Polym. Sci. 2017, 134, 44271. [CrossRef]
9. Krishni, R.R.; Foo, K.Y.; Hameed, B.H. Food cannery effluent, pineapple peel as an effective low-costbiosorbent for removing cationic dye from aqueous solutions. J. Desalin. Water Treat. 2014, 52, 6096–6103.[CrossRef]
10. Lu, M.C.; Chen, Y.Y.; Chiou, M.R.; Chen, M.Y.; Fan, H.J. Occurrence and treatment efficiency of pharmaceuticalsin landfill leachates. Waste Manag. 2016, 55, 257–264. [CrossRef]
11. Han, R.; Wang, Y.; Zhao, X.; Wang, Y.; Xie, F.; Cheng, J.; Tang, M. Adsorption of methylene blue by phoenixtree leaf powder in a fixed-bed column: Experiments and prediction of breakthrough curves. Desalination2009, 245, 284–297. [CrossRef]
12. Rafatullah, M.; Sulaiman, O.; Hashim, R.; Ahmad, A. Adsorption of methylene blue on low-cost adsorbents:A review. J. Hazard. Mater. 2010, 177, 70–80. [CrossRef]
13. Ip, A.W.M.; Barford, J.P.; McKay, G. Reactive Black dye adsorption/desorption onto different adsorbents:Effect of salt, surface chemistry, pore size and surface area. J. Collid Interface Sci. 2009, 337, 32–38. [CrossRef][PubMed]
14. Pandya, K.Y.; Patel, R.V.; Jasrai, R.T.; Brahmbhatt, N.H. Preliminary study on potential of seaweeds indecolorization efficacy of synthetic dyes effluent. Int. J. Plant Anim. Environ. Sci. 2017, 7, 223–4490.
15. Sulyman, M. Agricultural by-products/waste as dye and metal ions adsorbents: A review. Int. J. Eng. Sci.2016, 6, 1–20.
16. Feng, Y.; Liu, Y.; Xue, L.; Sun, H.; Guo, Z.; Zhang, Y.; Yang, L. Carboxylic acid functionalized sesame straw:A sustainable cost-effective bio adsorbent with superior dye adsorption capacity. Bioresour. Technol. 2017,238, 675–683. [CrossRef]
17. Pouretedal, H.R.; Sadegh, N. Effective removal of amoxicillin, cephalexin, tetracycline and penicillin G fromaqueous solutions using activated carbon nanoparticles prepared from vine wood. J. Water Process Eng. 2014,1, 64–73. [CrossRef]
18. Islam, M.A.; Benhouria, A.; Asif, M.; Hameed, B.H. Methylene blue adsorption on factory-rejected teaactivated carbon prepared by conjunction of hydrothermal carbonization and sodium hydroxide activationprocesses. J. Taiwan Inst. Chem. Eng. 2015, 52, 57–64. [CrossRef]
19. Danish, M.; Khanday, W.A.; Hashim, R.; Sulaiman, N.S.B.; Akhtar, M.N.; Nizami, M. Maniruddin, Applicationof optimized large surface area date stone (Phoenix dactylifera ) activated carbon for rhodamin B removalfrom aqueous solution: BoxBehnken design approach. Ecotoxicol. Environ. Saf. 2017, 139, 280–290. [CrossRef]
20. Kausar, A.; Iqbal, M.; Javed, A.; Aftab, K.; Nazli, Z.H.; Bhatti, H.N.; Nouren, S. Dyes adsorption using clayand modified clay: A review. J. Mol. Liq. 2018, 256, 395–407. [CrossRef]
21. Li, M.; Zhao, H.; Lu, Z.Y. Porphyrin-based porous organic polymer, Py-POP, as a multifunctional platformfor efficient selective adsorption and photocatalytic degradation of cationic dyes. Microp. Mesoporous Mater.2020, 292, 109774. [CrossRef]
22. Suteu, D.; Zaharia, C.; Malutan, T. Removal of Orange 16 reactive dye from aqueous solutions by wastesunflower seed shells. J. Serb. Chem. Soc. 2011, 76, 607–624. [CrossRef]
23. Narbat, M.K.; Orang, F.; Hashtjin, M.S.; Goudarzi, A. Fabrication of porous hydroxyapatite-gelatin compositescaffolds for bone tissue engineering. Iran. Biomed. J. 2006, 10, 215–223.
24. Muhammad, S.; Hussain, S.T.; Waseem, M.; Naeem, A.; Hussain, J.; Jan, M.T. Surface charge properties ofzirconium dioxide. Iran. J. Sci. Technol. 2012, 4, 481–486.
25. Miraboutalebi, S.M.; Nikouzad, S.K.; Peydayesh, M.; Allahgholi, N.; Vafajoo, L.; McKay, G. Methylene blueadsorption via maize silk powder: Kinetic, equilibrium, thermodynamic studies and residual error analysis.Process Saf. Environ. 2017, 6, 191–202. [CrossRef]
26. Langergen, S.; Svenska, B.K. Zur theorie der sogenannten adsoption geloester stoffe. K. Sven. Vetensk. Handl.1898, 24, 1–39.
27. Ho, Y.S.; Mckay, G. Pseudo-second order model for sorption processes. Process Biochem. 1999, 34, 451–465.[CrossRef]
28. Weber, W.J.; Morris, J.C. Kinetics of adsorption on carbon from solution. J. Sanit. Eng. Div. Proc. Am. Soc.Civ. Eng. 1963, 89, 31–60.
29. Langmuir, I. The constitution and fundamental properties of solids and liquids. J. Am. Chem. Soc. 1916, 38,2221–2295. [CrossRef]

Appl. Sci. 2020, 10, 3271 17 of 17
30. Freundlich, H.M.F. Über die adsorption in lösungen. Z. Phys. Chem. 1906, 57, 385–470. [CrossRef]31. Temkin, M.J.; Phyzev, V. Recent modifications to Langmuir isotherms. Acta Physicochim. USSR 1940, 12,
217–222.32. Colak, F.; Atar, N.; Olgun, A. Biosorption of acidic dyes from aqueous solution by Paenibacillus macerans:
Kineti, thermodynamic and equilibrium studies. Chem. Eng. J. 2009, 150, 122–130. [CrossRef]33. Chaudhry, S.A.; Ahmed, M.; Siddiqui, S.I.; Ahmed, S. Fe(III)-Sn(IV) mixed binary oxide-coated sand
preparation and its use for the removal of As(III) and As(V) from water: Application of isotherm, kinetic andthermodynamics. J. Mol. Liq. 2016, 224, 431–441. [CrossRef]
34. Mourabet, M.; ElRhilassi, A.; ElBoujaady, H.; Bennani-Ziatni, M.; ElHamri, R.; Taitai, A. Removal of fluoridefrom aqueous solution by adsorption on Apatitic tricalcium phosphate using Box–Behnken design anddesirability function. Appl. Surf. Sci. 2012, 258, 4402–4410. [CrossRef]
35. Tripathi, P.; Srivastava, V.C.; Kumar, A. Optimization of an azo dye batch adsorption parameters usingBox–Behnken design. Desalination 2009, 249, 1273–1279. [CrossRef]
36. Oliveira, R.N.; Mancini, M.C.; Oliveira, F.C.S.; Passos, T.M.; Quility, B.; Thire, R.M.S.; Mcguiness, G.B.FTIR analysis and quantification of phenols and flavonoids of five commercially available plants extractsused in wound healing. Revista Matéria 2016, 21, 767–779. [CrossRef]
37. Guediri, A.; Bouguettoucha, A.; Chebli, D.; Chafai, N.; Amrane, A. Molecular dynamic simulation and DFTcomputational studies on the adsorption performances of methylene blue in aqueous solutions by orangepeel-modified phosphoric acid. J. Mol. Struct. 2020, 1202, 127290. [CrossRef]
38. Stavrinoua, A.; Aggelopoulosa, C.A.; Tsakiroglou, C.D. Exploring the adsorption mechanisms of cationicand anionic dyes onto agricultural waste peels of banana, cucumber and potato: Adsorption kinetics andequilibrium isotherms as a tool. J. Environ. Chem. Eng. 2018, 6, 6958–6970. [CrossRef]
39. Oguntimein, G.B. Textile Dye Removal using Dried Sun Flower Seed Hull a New Low Cost Biosorbent:Equilibrium, Kinetics and Thermodynamic Studies. Adv. Res. Text. Eng. 2016, 1, 1008–1014.
40. Foo, K.Y.; Hameed, B.H. Preparation and characterization of activated carbon from sunflower seed oil residuevia microwave assisted K2CO3 activation. Bioresour. Technol. 2011, 102, 9794–9799. [CrossRef]
41. Marrakchia, F.; Ahmed, F.; Khanday, W.A.; Asif, M.; Hameed, B.H. Mesoporous-activated carbon preparedfrom chitosan flakes via single-step sodium hydroxide activation for the adsorption of methylene blue. Int. J.Biol. Macromol. 2017, 98, 233–239. [CrossRef] [PubMed]
42. Gao, J.; Qin, Y.; Zhou, T.; Cao, D.; Xu, P.; Hochstetter, D.; Wang, Y. Adsorption of methylene blue on activatedcarbon produced from tea (Camellia sinensis L.) seed shells: Kinetics, equilibrium, and thermodynamicsstudies. J. Zhejiang Univ. Sci. B 2013, 14, 650–658. [CrossRef] [PubMed]
43. El-Halwany, M.M. Kinetics and Thermodynamics of Activated Sunflowers Seeds Shell Carbon (SSSC) asSorbent Material. J. Chromatogr. Sep. Tech. 2013, 4, 5–11. [CrossRef]
44. Segurola, J.; Allen, N.S.; Edge, M.; Mahon, M.M. Design of eutectic photoinitiator blends for UV/visiblecurable acrylated printing inks and coatings. Prog. Org. Coat. 1999, 37, 23–37. [CrossRef]
45. Gulen, B.; Demircivi, P. Adsorption properties of flouroquinolone type antibiotic ciprofloxacin into2:1 dioctahedral clay structure: Box-Behnken experimental design. J. Mol. Struct. 2020, 1206, 127657.[CrossRef]
46. Elmoubarki, R.; Taoufik, M.; Moufti, A.; Tounsadi, H.; Mahjoubi, F.Z.; Bouabi1, Y.; Qourzal, S.; Abdennouri, M.;Barka, N. Box-Behnken experimental design for the optimization of methylene blue adsorption onto Aleppopine cones. J. Mater. Environ. Sci. 2017, 8, 2184–2191.
© 2020 by the authors. Licensee MDPI, Basel, Switzerland. This article is an open accessarticle distributed under the terms and conditions of the Creative Commons Attribution(CC BY) license (http://creativecommons.org/licenses/by/4.0/).