Embed Size (px)
Citation preview
Episerver Mobile Commerce Report 2015 – Australia
Episerver Mobile Commerce Report 2015
“Talking about ‘mobile’ commerce is almost an anachronism now.”As high street and online shopping have merged, this
evolution has continued onto all of our mobile electronic
devices. We are, as consumers, as comfortable buying
on our smartphones and tablets, as we are desktops
and laptops. Even more so, perhaps.
For the last five years, we at Episerver have been
monitoring this evolution through our annual mobile
commerce report. In 2012 our findings highlighted the
challenges of the new digital economy and the need for
retailers to improve the quality of their content online.
Our 2013 report accurately predicted the shift towards
mobile-first retailing, emphasising the move away from
laptops and towards shopping on the go. Then in 2014,
we highlighted a growing need for ecommerce providers
to target their audiences through a genuinely cross-
channel marketing approach.
This year we commissioned five independent surveys,
researching 5300 consumers across Australia, the
Nordics, US, UK, and Benelux. These surveys analysed
everything from international customer expectations
through to preferences for mobile layout and application
design.
Foreword
Having identified what it was that consumers looked for
in a mobile site (speed, ease of navigation, etc.) we ran
a benchmark of the top 20 retailers from each region
around the globe. This process examined the mobile
websites, tablet applications, iPhone and Android apps
of each retailer, comparing their current functionality
to the consumer expectations outlined through our
international research.
Through this benchmark, we’ve been able to learn a
great deal about the current and future direction of
mobile marketing. So whilst we have seen the rapid
evolution of consumer expectations, retailers have
struggled to keep up with the pace. This is why it still
makes sense to look at how retailers are approaching
mobile commerce, and why it’s so interesting this time
around to expand our view to an international level.
As the expectations of customers have grown
increasingly stringent, so too have the criteria and
scoring behind our benchmark. As this report shows,
the average overall score for mobile strategy throughout
Australia was only 34%, far lower than that of the UK,
US and Nordic regions. This leaves significant room for
improvement, with many Australian brands shunning
mobile and tablet applications in favour of more
traditional mobile sites (despite consumer demand
for apps). But it’s not all bad news, with so few brands
taking advantage of mobile apps, now is a great time for
marketers to get ahead of the game – particularly given
the country’s growing mobile adoption rates.
Natalia GamarraExecutive- Business Development at Episerver APAC
Episerver Mobile Commerce Report 2015
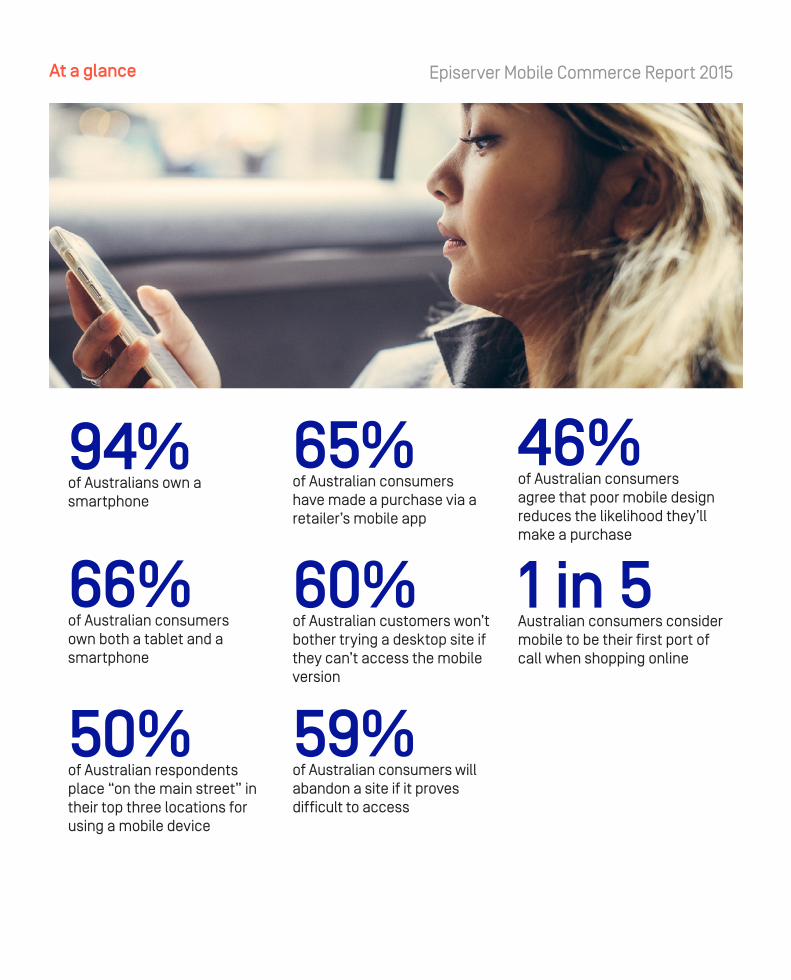
94% of Australians own a smartphone
66% of Australian consumers own both a tablet and a smartphone
50% of Australian respondents place “on the main street” in their top three locations for using a mobile device
65% of Australian consumers have made a purchase via a retailer’s mobile app
60% of Australian customers won’t bother trying a desktop site if they can’t access the mobile version
59% of Australian consumers will abandon a site if it proves difficult to access
46% of Australian consumers agree that poor mobile design reduces the likelihood they’ll make a purchase
1 in 5 Australian consumers consider mobile to be their first port of call when shopping online
At a glance
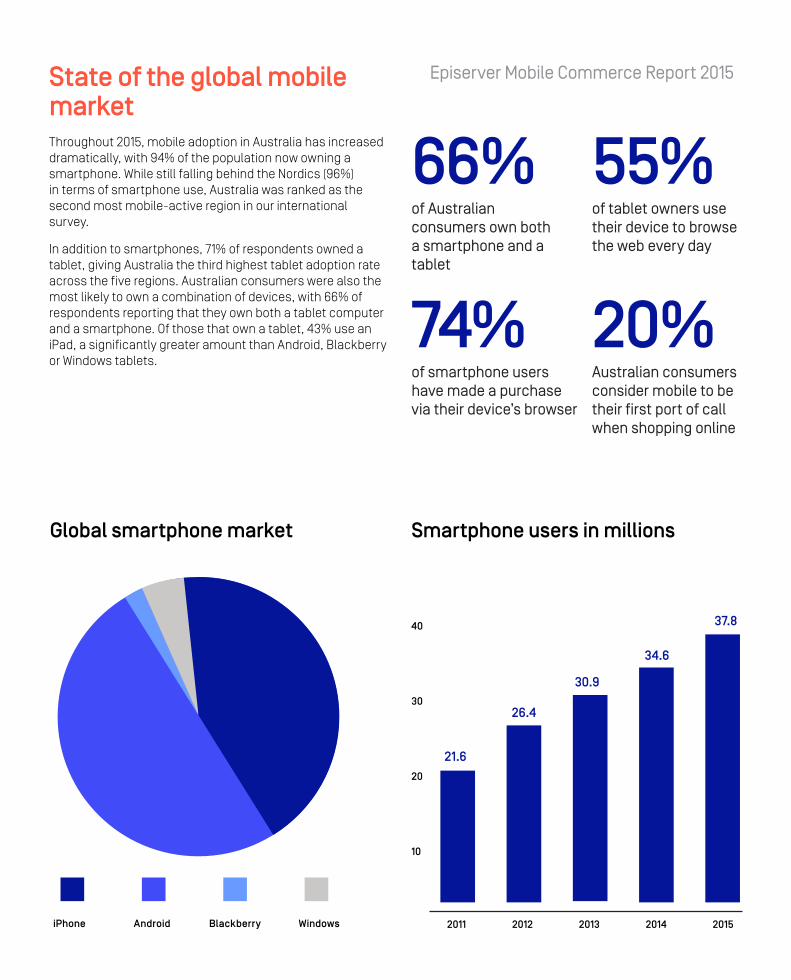
Episerver Mobile Commerce Report 2015State of the global mobile marketThroughout 2015, mobile adoption in Australia has increased dramatically, with 94% of the population now owning a smartphone. While still falling behind the Nordics (96%) in terms of smartphone use, Australia was ranked as the second most mobile-active region in our international survey.
In addition to smartphones, 71% of respondents owned a tablet, giving Australia the third highest tablet adoption rate across the five regions. Australian consumers were also the most likely to own a combination of devices, with 66% of respondents reporting that they own both a tablet computer and a smartphone. Of those that own a tablet, 43% use an iPad, a significantly greater amount than Android, Blackberry or Windows tablets.
66%of Australian consumers own both a smartphone and a tablet
74%of smartphone users have made a purchase via their device’s browser
20%Australian consumers consider mobile to be their first port of call when shopping online
55%of tablet owners use their device to browse the web every day
Smartphone users in millions
2011 2012 2013 2014 2015
21.6
26.4
30.9
34.6
37.840
30
20
10
Global smartphone market
iPhone Android Blackberry Windows
Episerver Mobile Commerce Report 2015
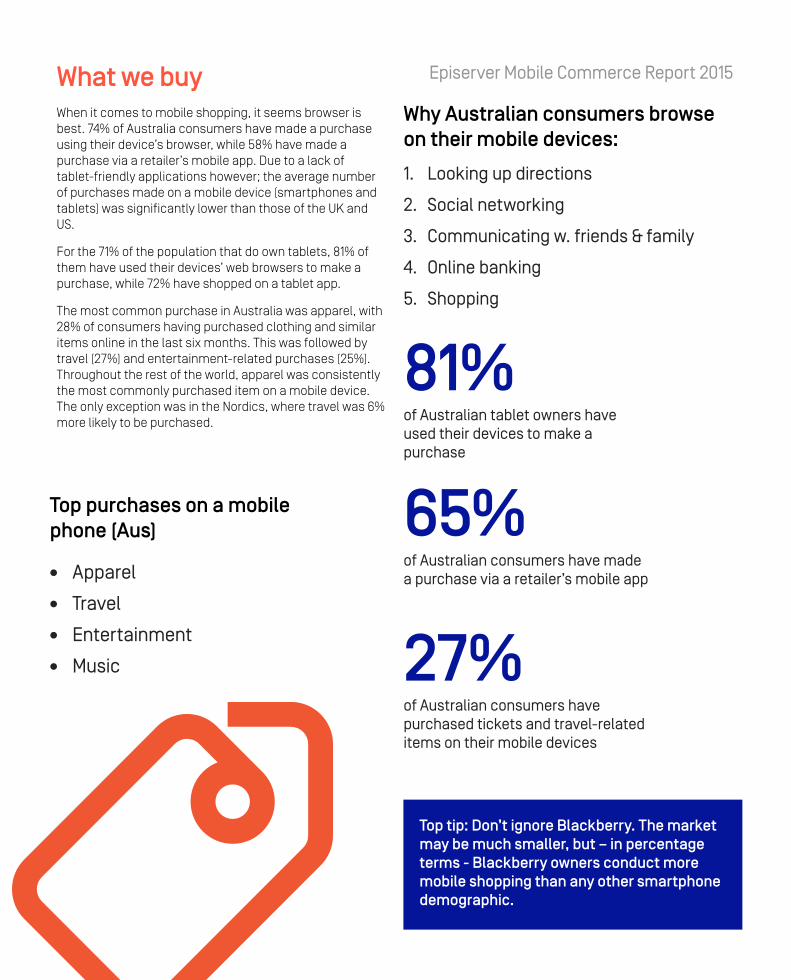
81%of Australian tablet owners have used their devices to make a purchase
65%of Australian consumers have made a purchase via a retailer’s mobile app
27%of Australian consumers have purchased tickets and travel-related items on their mobile devices
Why Australian consumers browse on their mobile devices:
1. Looking up directions
2. Social networking
3. Communicating w. friends & family
4. Online banking
5. Shopping
What we buyWhen it comes to mobile shopping, it seems browser is best. 74% of Australia consumers have made a purchase using their device’s browser, while 58% have made a purchase via a retailer’s mobile app. Due to a lack of tablet-friendly applications however; the average number of purchases made on a mobile device (smartphones and tablets) was significantly lower than those of the UK and US.
For the 71% of the population that do own tablets, 81% of them have used their devices’ web browsers to make a purchase, while 72% have shopped on a tablet app.
The most common purchase in Australia was apparel, with 28% of consumers having purchased clothing and similar items online in the last six months. This was followed by travel (27%) and entertainment-related purchases (25%). Throughout the rest of the world, apparel was consistently the most commonly purchased item on a mobile device. The only exception was in the Nordics, where travel was 6% more likely to be purchased.
Top purchases on a mobile phone (Aus)
• Apparel
• Travel
• Entertainment
• Music
Top tip: Don’t ignore Blackberry. The market may be much smaller, but – in percentage terms - Blackberry owners conduct more mobile shopping than any other smartphone demographic.
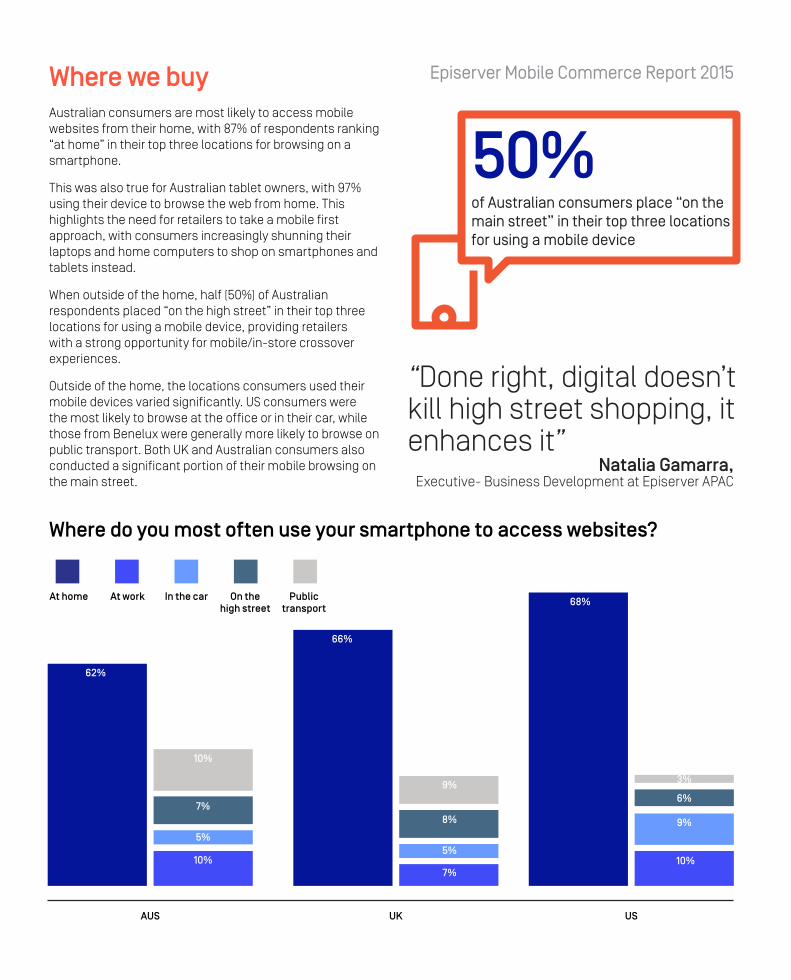
Episerver Mobile Commerce Report 2015Where we buyAustralian consumers are most likely to access mobile websites from their home, with 87% of respondents ranking “at home” in their top three locations for browsing on a smartphone.
This was also true for Australian tablet owners, with 97% using their device to browse the web from home. This highlights the need for retailers to take a mobile first approach, with consumers increasingly shunning their laptops and home computers to shop on smartphones and tablets instead.
When outside of the home, half (50%) of Australian respondents placed “on the high street” in their top three locations for using a mobile device, providing retailers with a strong opportunity for mobile/in-store crossover experiences.
Outside of the home, the locations consumers used their mobile devices varied significantly. US consumers were the most likely to browse at the office or in their car, while those from Benelux were generally more likely to browse on public transport. Both UK and Australian consumers also conducted a significant portion of their mobile browsing on the main street.
50%of Australian consumers place “on the main street” in their top three locations for using a mobile device
Natalia Gamarra,Executive- Business Development at Episerver APAC
“Done right, digital doesn’t kill high street shopping, it enhances it”
Where do you most often use your smartphone to access websites?
Public transport
On the high street
At home
AUS
62%
10%
10%
5%
7%
UK
66%
7%
9%
5%
8%
US
68%
10%
3%
9%
6%
In the carAt work
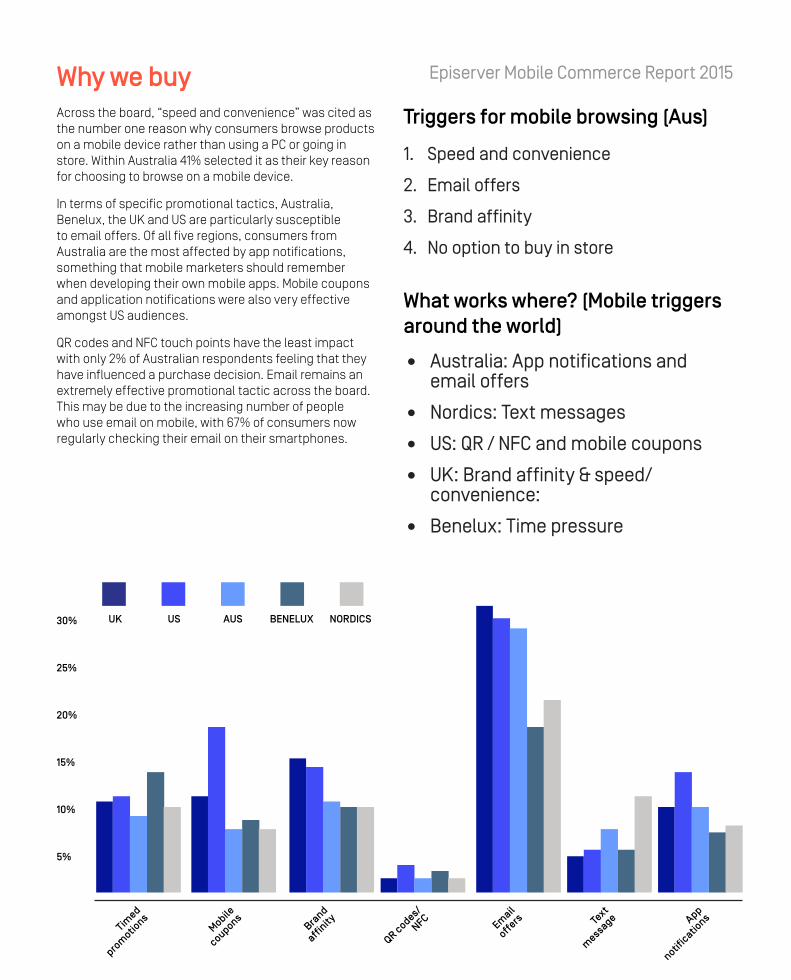
Episerver Mobile Commerce Report 2015Why we buyAcross the board, “speed and convenience” was cited as the number one reason why consumers browse products on a mobile device rather than using a PC or going in store. Within Australia 41% selected it as their key reason for choosing to browse on a mobile device.
In terms of specific promotional tactics, Australia, Benelux, the UK and US are particularly susceptible to email offers. Of all five regions, consumers from Australia are the most affected by app notifications, something that mobile marketers should remember when developing their own mobile apps. Mobile coupons and application notifications were also very effective amongst US audiences.
QR codes and NFC touch points have the least impact with only 2% of Australian respondents feeling that they have influenced a purchase decision. Email remains an extremely effective promotional tactic across the board. This may be due to the increasing number of people who use email on mobile, with 67% of consumers now regularly checking their email on their smartphones.
Triggers for mobile browsing (Aus)
1. Speed and convenience
2. Email offers
3. Brand affinity
4. No option to buy in store
What works where? (Mobile triggers around the world)
• Australia: App notifications and email offers
• Nordics: Text messages
• US: QR / NFC and mobile coupons
• UK: Brand affinity & speed/ convenience:
• Benelux: Time pressure
30%
25%
20%
15%
10%
5%
App
notificatio
nsText
message
offers
QR codes/
NFCBra
nd
affinityMobile
couponsTim
ed
prom
otions
NORDICSBENELUXUK AUSUS
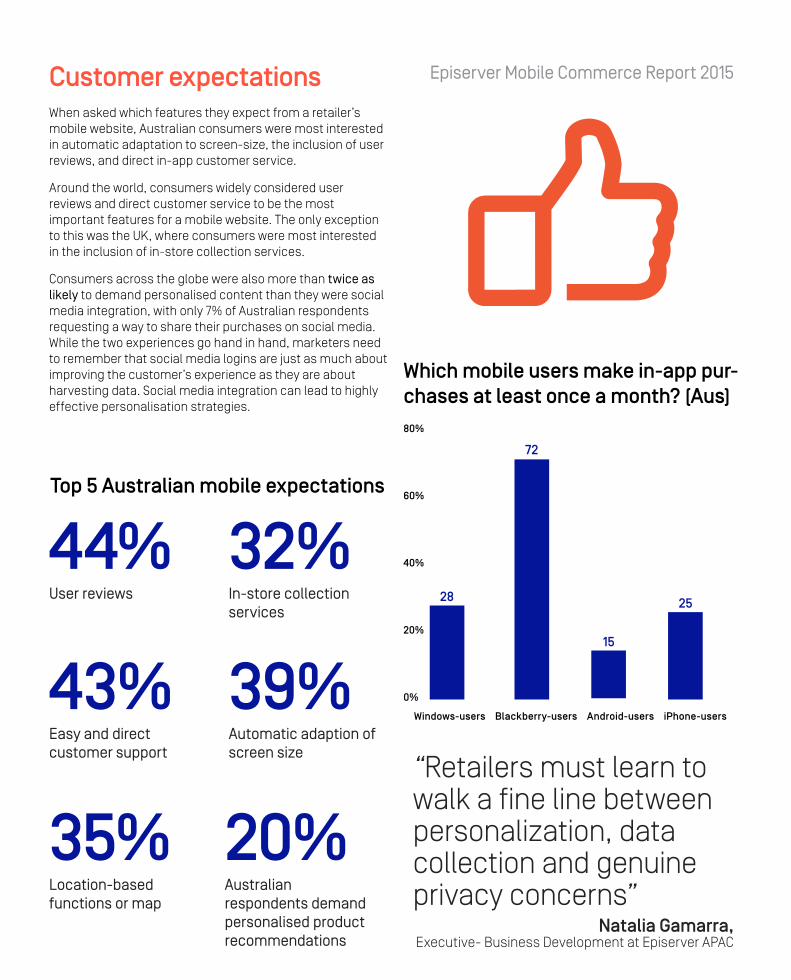
Episerver Mobile Commerce Report 2015Customer expectationsWhen asked which features they expect from a retailer’s mobile website, Australian consumers were most interested in automatic adaptation to screen-size, the inclusion of user reviews, and direct in-app customer service.
Around the world, consumers widely considered user reviews and direct customer service to be the most important features for a mobile website. The only exception to this was the UK, where consumers were most interested in the inclusion of in-store collection services.
Consumers across the globe were also more than twice as likely to demand personalised content than they were social media integration, with only 7% of Australian respondents requesting a way to share their purchases on social media. While the two experiences go hand in hand, marketers need to remember that social media logins are just as much about improving the customer’s experience as they are about harvesting data. Social media integration can lead to highly effective personalisation strategies.
Top 5 Australian mobile expectations
Which mobile users make in-app pur-chases at least once a month? (Aus)
44%User reviews
43%Easy and direct customer support
35%Location-based functions or map
32%In-store collection services
39%Automatic adaption of screen size
20%Australian respondents demand personalised product recommendations
Natalia Gamarra,Executive- Business Development at Episerver APAC
“Retailers must learn to walk a fine line between personalization, data collection and genuine privacy concerns”
Windows-users Blackberry-users Android-users iPhone-users
28
72
15
25
80%
60%
40%
20%
0%
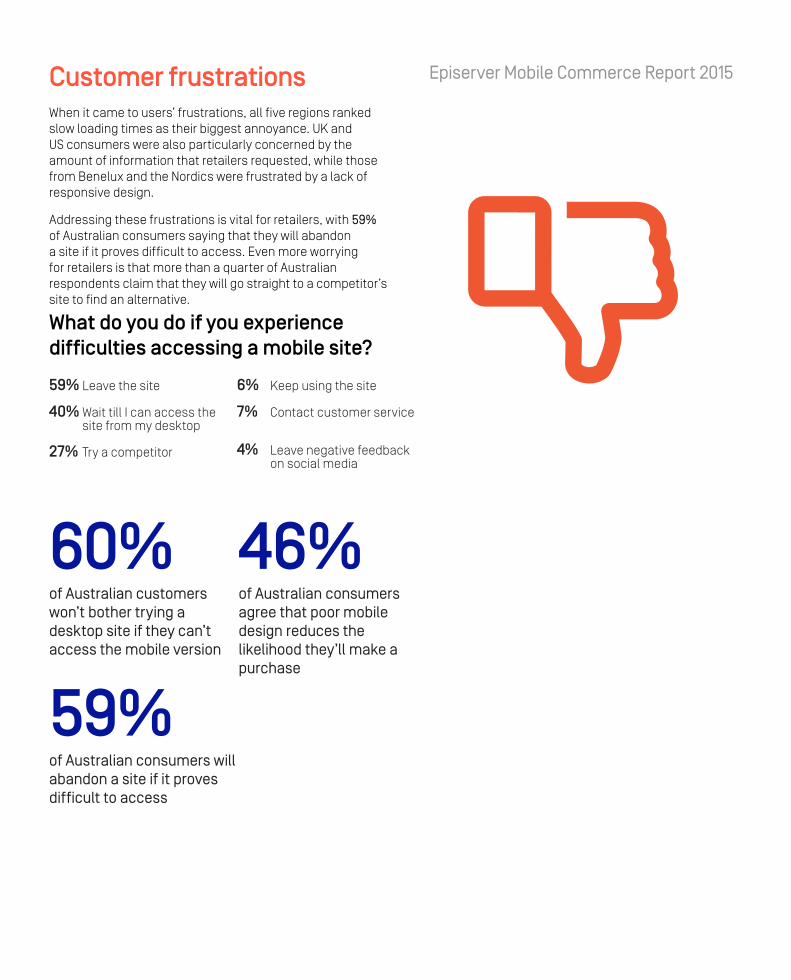
Episerver Mobile Commerce Report 2015Customer frustrationsWhen it came to users’ frustrations, all five regions ranked slow loading times as their biggest annoyance. UK and US consumers were also particularly concerned by the amount of information that retailers requested, while those from Benelux and the Nordics were frustrated by a lack of responsive design.
Addressing these frustrations is vital for retailers, with 59% of Australian consumers saying that they will abandon a site if it proves difficult to access. Even more worrying for retailers is that more than a quarter of Australian respondents claim that they will go straight to a competitor’s site to find an alternative.
59%of Australian consumers will abandon a site if it proves difficult to access
46%of Australian consumers agree that poor mobile design reduces the likelihood they’ll make a purchase
60%of Australian customers won’t bother trying a desktop site if they can’t access the mobile version
What do you do if you experience difficulties accessing a mobile site?
59% Leave the site 40% Wait till I can access the site from my desktop 27% Try a competitor
6% Keep using the site 7% Contact customer service
4% Leave negative feedback on social media
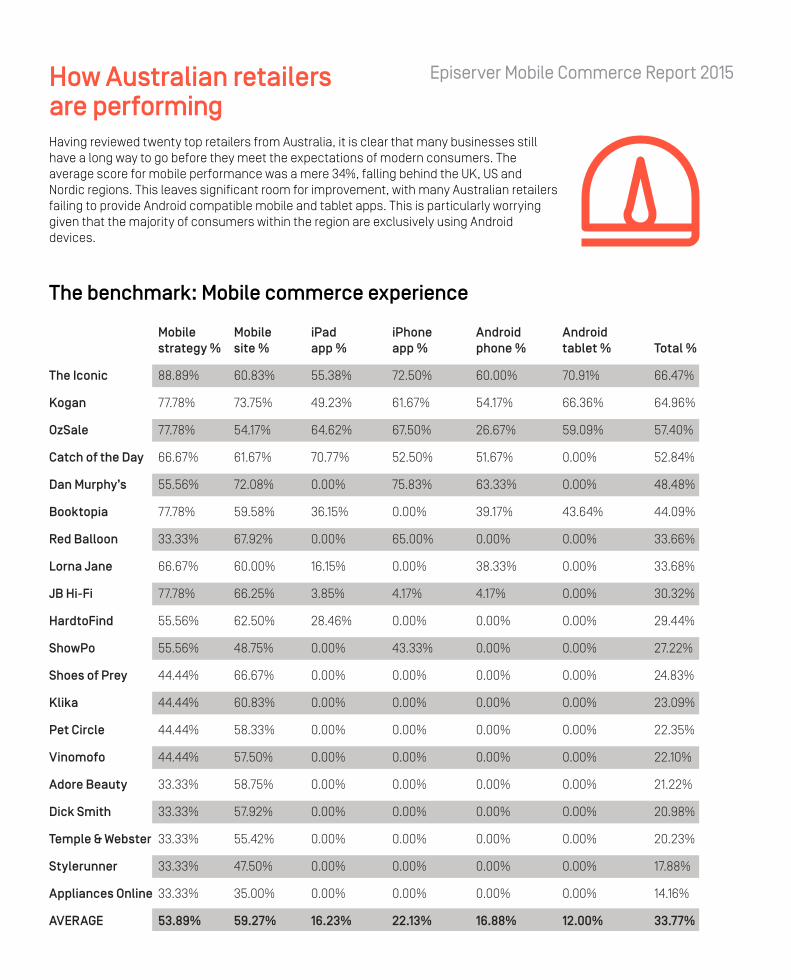
Episerver Mobile Commerce Report 2015How Australian retailers are performingHaving reviewed twenty top retailers from Australia, it is clear that many businesses still have a long way to go before they meet the expectations of modern consumers. The average score for mobile performance was a mere 34%, falling behind the UK, US and Nordic regions. This leaves significant room for improvement, with many Australian retailers failing to provide Android compatible mobile and tablet apps. This is particularly worrying given that the majority of consumers within the region are exclusively using Android devices.
The benchmark: Mobile commerce experience
Mobile Mobile iPad iPhone Android Android strategy % site % app % app % phone % tablet % Total %
The Iconic 88.89% 60.83% 55.38% 72.50% 60.00% 70.91% 66.47%
Kogan 77.78% 73.75% 49.23% 61.67% 54.17% 66.36% 64.96%
OzSale 77.78% 54.17% 64.62% 67.50% 26.67% 59.09% 57.40%
Catch of the Day 66.67% 61.67% 70.77% 52.50% 51.67% 0.00% 52.84%
Dan Murphy’s 55.56% 72.08% 0.00% 75.83% 63.33% 0.00% 48.48%
Booktopia 77.78% 59.58% 36.15% 0.00% 39.17% 43.64% 44.09%
Red Balloon 33.33% 67.92% 0.00% 65.00% 0.00% 0.00% 33.66%
Lorna Jane 66.67% 60.00% 16.15% 0.00% 38.33% 0.00% 33.68%
JB Hi-Fi 77.78% 66.25% 3.85% 4.17% 4.17% 0.00% 30.32%
HardtoFind 55.56% 62.50% 28.46% 0.00% 0.00% 0.00% 29.44%
ShowPo 55.56% 48.75% 0.00% 43.33% 0.00% 0.00% 27.22%
Shoes of Prey 44.44% 66.67% 0.00% 0.00% 0.00% 0.00% 24.83%
Klika 44.44% 60.83% 0.00% 0.00% 0.00% 0.00% 23.09%
Pet Circle 44.44% 58.33% 0.00% 0.00% 0.00% 0.00% 22.35%
Vinomofo 44.44% 57.50% 0.00% 0.00% 0.00% 0.00% 22.10%
Adore Beauty 33.33% 58.75% 0.00% 0.00% 0.00% 0.00% 21.22%
Dick Smith 33.33% 57.92% 0.00% 0.00% 0.00% 0.00% 20.98%
Temple & Webster 33.33% 55.42% 0.00% 0.00% 0.00% 0.00% 20.23%
Stylerunner 33.33% 47.50% 0.00% 0.00% 0.00% 0.00% 17.88%
Appliances Online 33.33% 35.00% 0.00% 0.00% 0.00% 0.00% 14.16%
AVERAGE 53.89% 59.27% 16.23% 22.13% 16.88% 12.00% 33.77%
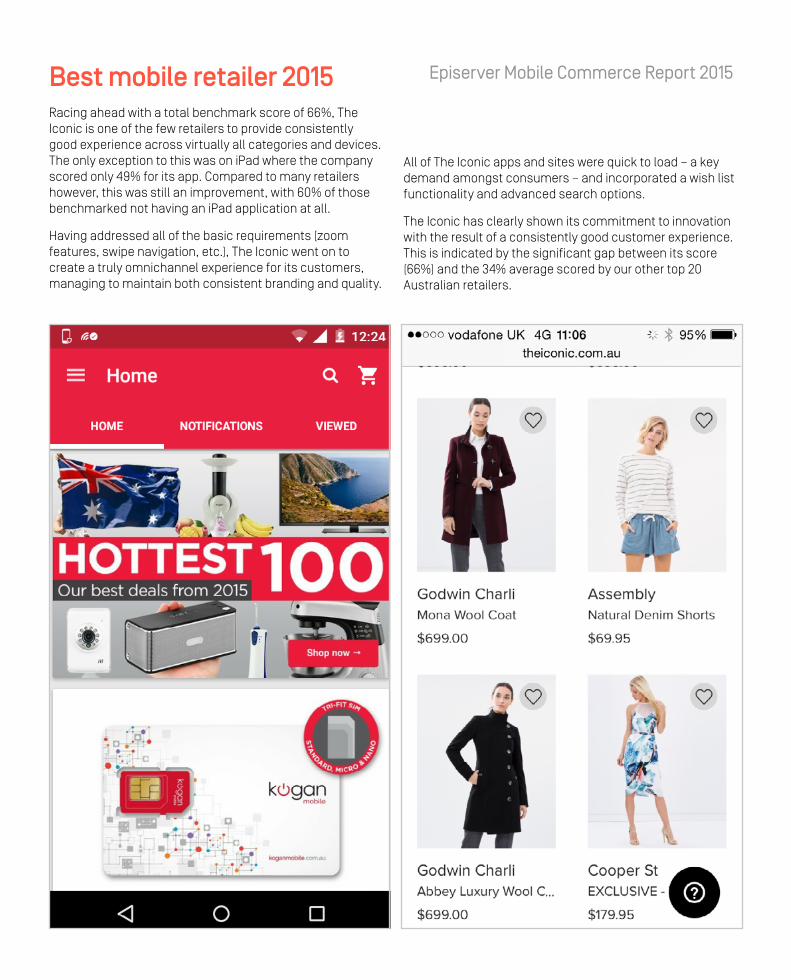
Episerver Mobile Commerce Report 2015Best mobile retailer 2015Racing ahead with a total benchmark score of 66%, The Iconic is one of the few retailers to provide consistently good experience across virtually all categories and devices. The only exception to this was on iPad where the company scored only 49% for its app. Compared to many retailers however, this was still an improvement, with 60% of those benchmarked not having an iPad application at all.
Having addressed all of the basic requirements (zoom features, swipe navigation, etc.), The Iconic went on to create a truly omnichannel experience for its customers, managing to maintain both consistent branding and quality.
All of The Iconic apps and sites were quick to load – a key demand amongst consumers – and incorporated a wish list functionality and advanced search options.
The Iconic has clearly shown its commitment to innovation with the result of a consistently good customer experience. This is indicated by the significant gap between its score (66%) and the 34% average scored by our other top 20 Australian retailers.
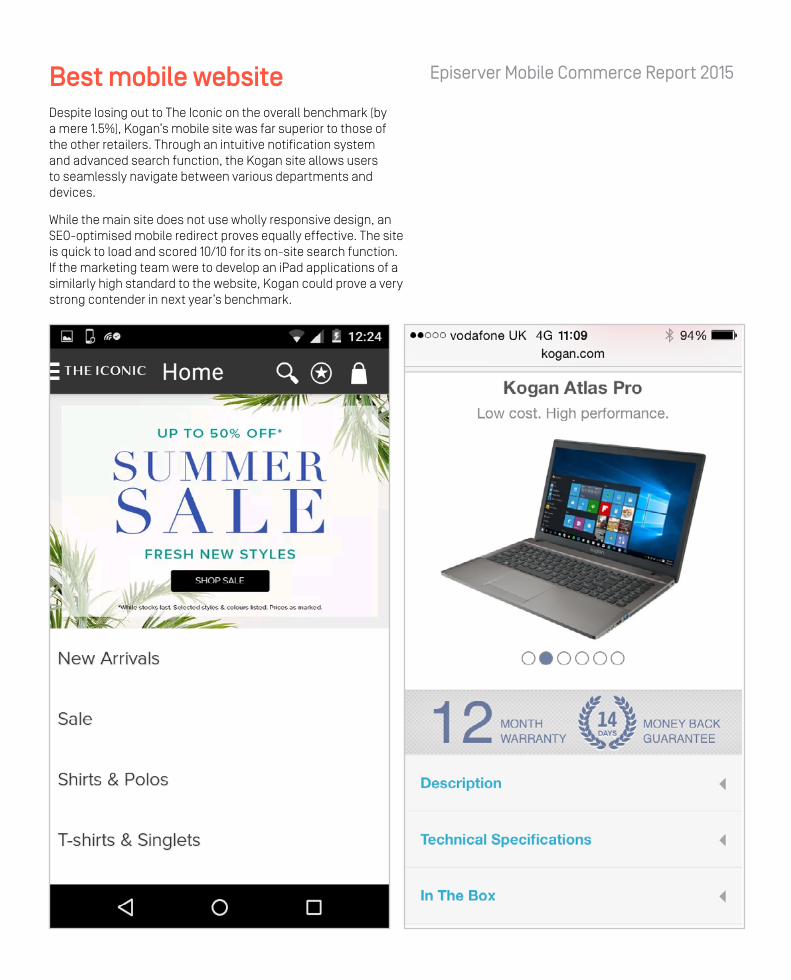
Episerver Mobile Commerce Report 2015Best mobile websiteDespite losing out to The Iconic on the overall benchmark (by a mere 1.5%), Kogan’s mobile site was far superior to those of the other retailers. Through an intuitive notification system and advanced search function, the Kogan site allows users to seamlessly navigate between various departments and devices.
While the main site does not use wholly responsive design, an SEO-optimised mobile redirect proves equally effective. The site is quick to load and scored 10/10 for its on-site search function. If the marketing team were to develop an iPad applications of a similarly high standard to the website, Kogan could prove a very strong contender in next year’s benchmark.
Episerver Mobile Commerce Report 2015Analysis: Four steps to an effective omnichannel approach
1. Balance unified experiences with device capabilitiesWhen preparing their omnichannel approach, marketers have to walk a fine line between user experience and device capabilities. On the one hand, they should look to create unified experiences across all platforms; on the other, they must play to the specific strengths of each device or platform. As an example, of the brands that did develop an Android tablet app, many opted to develop a single Android app for use across both tablets and mobiles. While this helped to create a seamless user experience, these apps ended up being stretched on larger tablet screens – a poor use of the additional screen space.
2. Invest in contentIn the omnichannel age, engaging content is more vital than ever. As audiences increasingly flit between various applications, platforms and screens, it grows ever harder for marketers to retain their attention. Informative and entertaining content offers the best solution to keeping your customers engaged throughout the buying cycle. By incorporating genuinely helpful content such as recipe suggestions, how-to videos and user guides, marketers not only maintain the interest of potential prospects, but can also encourage additional purchases throughout the process.
3. Don’t be afraid to restructureIt’s all too easy for marketers to find themselves working in siloed teams. In order to develop a successful omnichannel strategy, businesses should not be afraid to mix up their teams and establish a wider point of view. Rather than having a web design team, a social media team and a mobile development team, businesses need to encourage collaborative working throughout all stages of the marketing process. This collaborative effort can then be overseen by a decisive – and brand conscious – marketing department.
4. Joined up marketing requires joined up techOmnichannel is just as much about finding the right technologies as it is about taking the right approach. In order for a customer’s journey to be truly seamless, marketers must ensure a tight integration between mobile, POS, customer data, content management and e-commerce platforms. Developing an omnichannel strategy is about more than just using multiple platforms, it’s about building a fully integrated marketing ecosystem. Think long and hard about the strategy you are looking to implement and then select the platforms that make it easiest to enact.
To find out how to improve your mobile e-commerce experience, visit Episerver.com
Customer success, deliveredWith Episerver Digital Experience Cloud™, you have the perfect platform to create an engaging, efficient and scalable digital marketing solution. But how do you ensure that your business architecture is sound, and how do you validate that the solution meets performance, security and compliance standards?
At Episerver, we recognize that customer success is dependent not only on the platform, but also on the implementation and management of it. That is why we have a team of Episerver experts and a vast network of dedicated Solution Partners that can connect your digital strategy to the platform that will deliver it.
Together with our Solution Partners, we back you up all the way, throughout the project and beyond.
Your success is our commitment
We are EpiserverMarketing is changing rapidly, but one thing remains true: value comes from great relationships. Episerver Digital Experience Cloud™ helps you deliver experiences that matter to your customers, while driving sales growth for you. Our unified content and commerce platform supports you from lead generation through conversion and repeat sales, across multiple channels. We’ve made it easy to put your business in the cloud, so you can focus more on engaging with your customers – wherever they are online. It’s what we call Digital Experience Delivered™.
At Episerver, we believe that digital transformation is a journey. We have been guiding customers for more than 20 years in providing outstanding digital experiences. Today our network of 880 partners, in 30 countries, supports 8,800 customers with 30,000 websites. Our customers include American Express, Canal Digital, Electrolux, KLM, Lloyds Bank, Mazda, Pizza Hut, Sony, Toshiba, and Walmart.
For more information visit www.episerver.com