Embed Size (px)
DESCRIPTION
How SAAS & Cloud Based Platforms are redefining the industry landscape for performance monitoring solutions
Citation preview
An AppDynamics Business White Paper October 2013
End-to-End Performance Monitoring
An AppDynamics Business White Paper 2
End-to-End Performance Monitoring
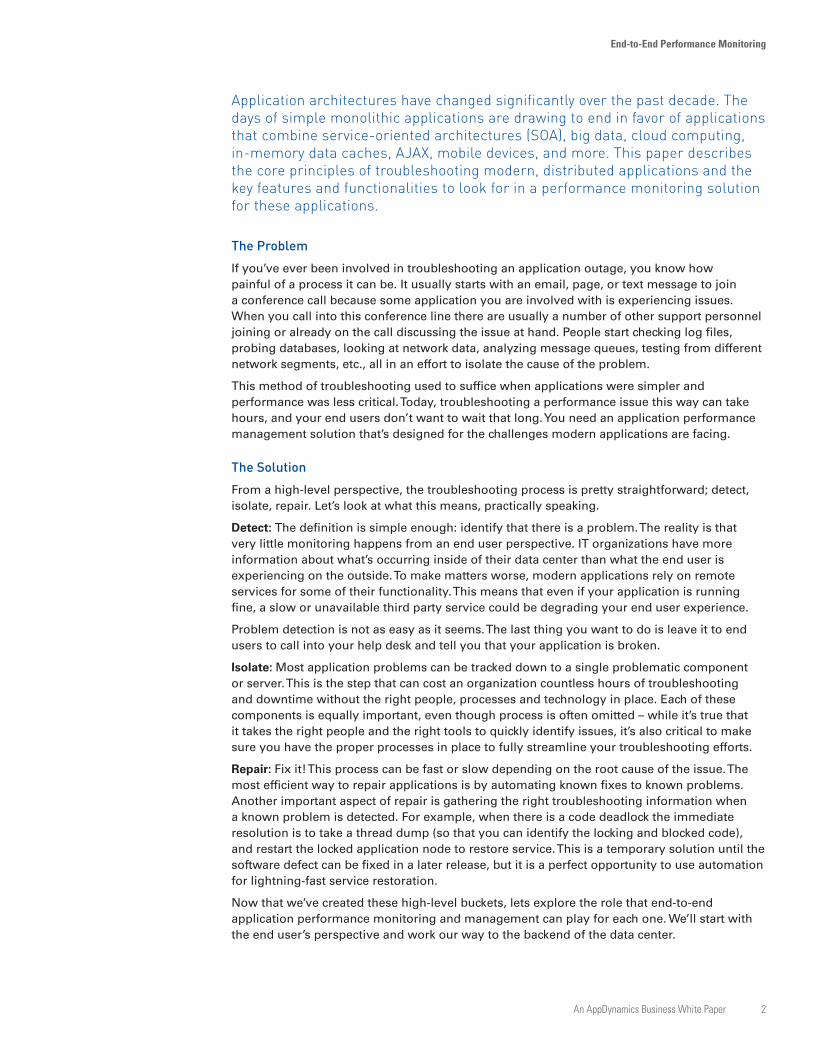
Application architectures have changed significantly over the past decade. The days of simple monolithic applications are drawing to end in favor of applications that combine service-oriented architectures (SOA), big data, cloud computing, in-memory data caches, AJAX, mobile devices, and more. This paper describes the core principles of troubleshooting modern, distributed applications and the key features and functionalities to look for in a performance monitoring solution for these applications.
The ProblemIf you’ve ever been involved in troubleshooting an application outage, you know how painful of a process it can be. It usually starts with an email, page, or text message to join a conference call because some application you are involved with is experiencing issues. When you call into this conference line there are usually a number of other support personnel joining or already on the call discussing the issue at hand. People start checking log files, probing databases, looking at network data, analyzing message queues, testing from different network segments, etc., all in an effort to isolate the cause of the problem.
This method of troubleshooting used to suffice when applications were simpler and performance was less critical. Today, troubleshooting a performance issue this way can take hours, and your end users don’t want to wait that long. You need an application performance management solution that’s designed for the challenges modern applications are facing.
The SolutionFrom a high-level perspective, the troubleshooting process is pretty straightforward; detect, isolate, repair. Let’s look at what this means, practically speaking.
Detect: The definition is simple enough: identify that there is a problem. The reality is that very little monitoring happens from an end user perspective. IT organizations have more information about what’s occurring inside of their data center than what the end user is experiencing on the outside. To make matters worse, modern applications rely on remote services for some of their functionality. This means that even if your application is running fine, a slow or unavailable third party service could be degrading your end user experience.
Problem detection is not as easy as it seems. The last thing you want to do is leave it to end users to call into your help desk and tell you that your application is broken.
Isolate: Most application problems can be tracked down to a single problematic component or server. This is the step that can cost an organization countless hours of troubleshooting and downtime without the right people, processes and technology in place. Each of these components is equally important, even though process is often omitted – while it’s true that it takes the right people and the right tools to quickly identify issues, it’s also critical to make sure you have the proper processes in place to fully streamline your troubleshooting efforts.
Repair: Fix it! This process can be fast or slow depending on the root cause of the issue. The most efficient way to repair applications is by automating known fixes to known problems. Another important aspect of repair is gathering the right troubleshooting information when a known problem is detected. For example, when there is a code deadlock the immediate resolution is to take a thread dump (so that you can identify the locking and blocked code), and restart the locked application node to restore service. This is a temporary solution until the software defect can be fixed in a later release, but it is a perfect opportunity to use automation for lightning-fast service restoration.
Now that we’ve created these high-level buckets, lets explore the role that end-to-end application performance monitoring and management can play for each one. We’ll start with the end user’s perspective and work our way to the backend of the data center.
An AppDynamics Business White Paper 3
End-to-End Performance Monitoring
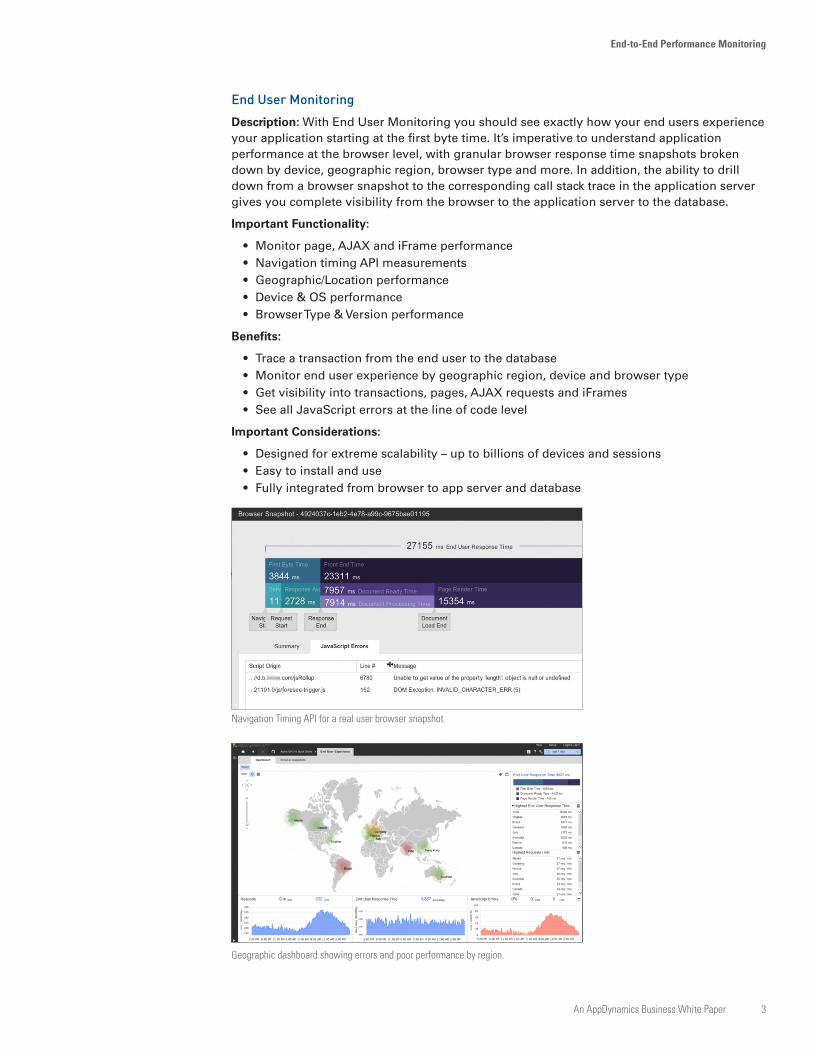
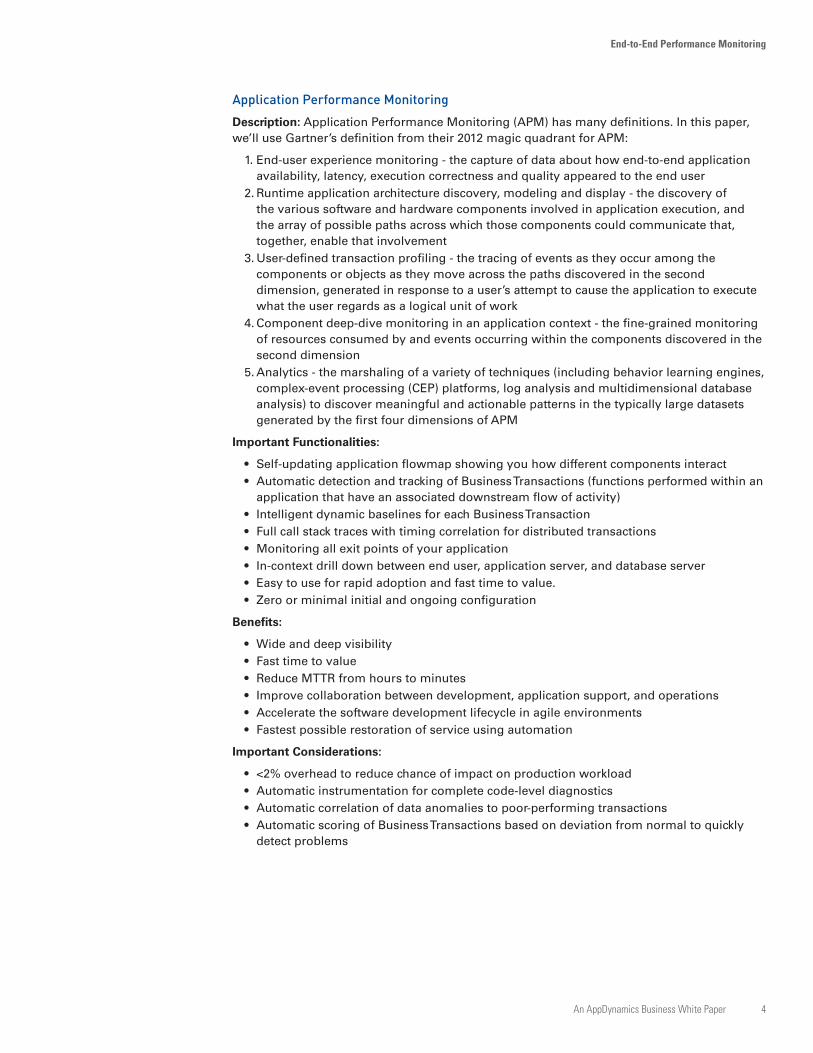
End User MonitoringDescription: With End User Monitoring you should see exactly how your end users experience your application starting at the first byte time. It’s imperative to understand application performance at the browser level, with granular browser response time snapshots broken down by device, geographic region, browser type and more. In addition, the ability to drill down from a browser snapshot to the corresponding call stack trace in the application server gives you complete visibility from the browser to the application server to the database.
Important Functionality:
• Monitor page, AJAX and iFrame performance• Navigation timing API measurements• Geographic/Location performance• Device & OS performance• Browser Type & Version performance
Benefits:
• Trace a transaction from the end user to the database• Monitor end user experience by geographic region, device and browser type• Get visibility into transactions, pages, AJAX requests and iFrames• See all JavaScript errors at the line of code level
Important Considerations:
• Designed for extreme scalability – up to billions of devices and sessions• Easy to install and use• Fully integrated from browser to app server and database
Navigation Timing API for a real user browser snapshot.
Geographic dashboard showing errors and poor performance by region.
An AppDynamics Business White Paper 4
End-to-End Performance Monitoring
Application Performance MonitoringDescription: Application Performance Monitoring (APM) has many definitions. In this paper, we’ll use Gartner’s definition from their 2012 magic quadrant for APM:
1. End-user experience monitoring - the capture of data about how end-to-end application availability, latency, execution correctness and quality appeared to the end user
2. Runtime application architecture discovery, modeling and display - the discovery of the various software and hardware components involved in application execution, and the array of possible paths across which those components could communicate that, together, enable that involvement
3. User-defined transaction profiling - the tracing of events as they occur among the components or objects as they move across the paths discovered in the second dimension, generated in response to a user’s attempt to cause the application to execute what the user regards as a logical unit of work
4. Component deep-dive monitoring in an application context - the fine-grained monitoring of resources consumed by and events occurring within the components discovered in the second dimension
5. Analytics - the marshaling of a variety of techniques (including behavior learning engines, complex-event processing (CEP) platforms, log analysis and multidimensional database analysis) to discover meaningful and actionable patterns in the typically large datasets generated by the first four dimensions of APM
Important Functionalities:
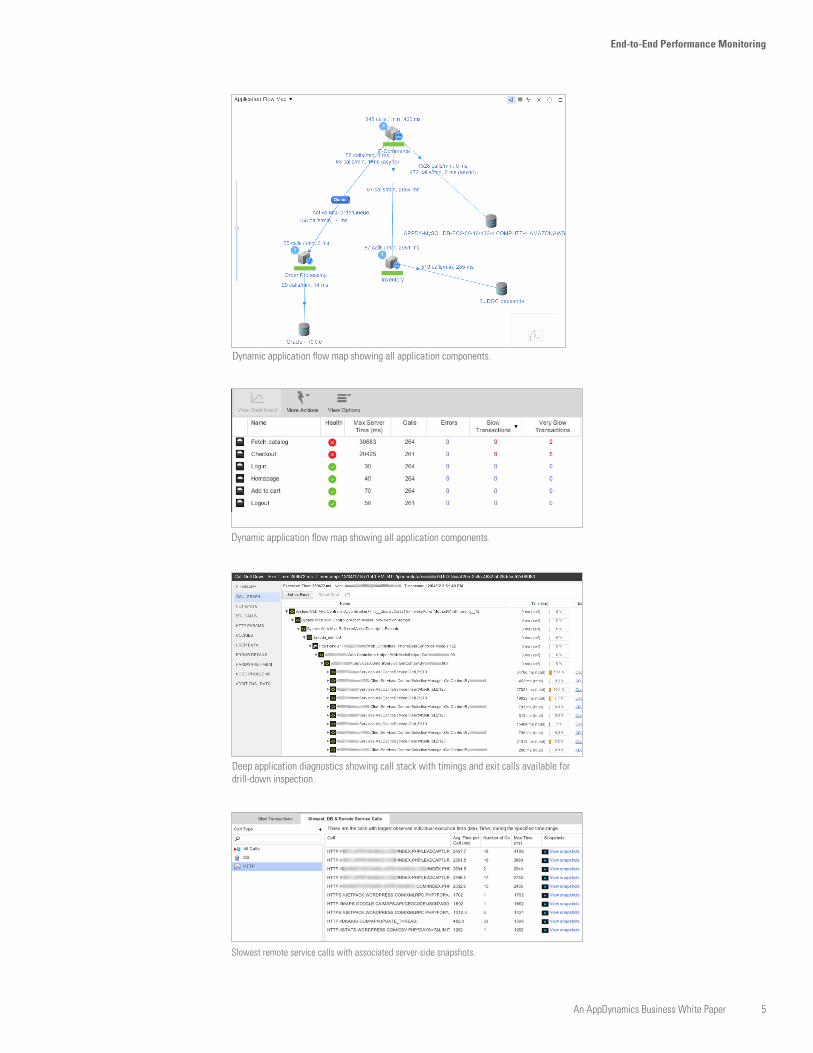
• Self-updating application flowmap showing you how different components interact• Automatic detection and tracking of Business Transactions (functions performed within an
application that have an associated downstream flow of activity)• Intelligent dynamic baselines for each Business Transaction• Full call stack traces with timing correlation for distributed transactions• Monitoring all exit points of your application• In-context drill down between end user, application server, and database server• Easy to use for rapid adoption and fast time to value.• Zero or minimal initial and ongoing configuration
Benefits:
• Wide and deep visibility• Fast time to value• Reduce MTTR from hours to minutes• Improve collaboration between development, application support, and operations• Accelerate the software development lifecycle in agile environments• Fastest possible restoration of service using automation
Important Considerations:
• <2% overhead to reduce chance of impact on production workload• Automatic instrumentation for complete code-level diagnostics• Automatic correlation of data anomalies to poor-performing transactions• Automatic scoring of Business Transactions based on deviation from normal to quickly
detect problems
An AppDynamics Business White Paper 5
End-to-End Performance Monitoring
Dynamic application flow map showing all application components.
Dynamic application flow map showing all application components.
Slowest remote service calls with associated server-side snapshots.
Deep application diagnostics showing call stack with timings and exit calls available for drill-down inspection.
An AppDynamics Business White Paper 6
End-to-End Performance Monitoring
Database MonitoringIf you want true end-to-end monitoring, it’s not enough to just monitor the end users and the application servers. You also need to monitor the backend databases from the inside out so that you can quickly remediate problems within the database tier.
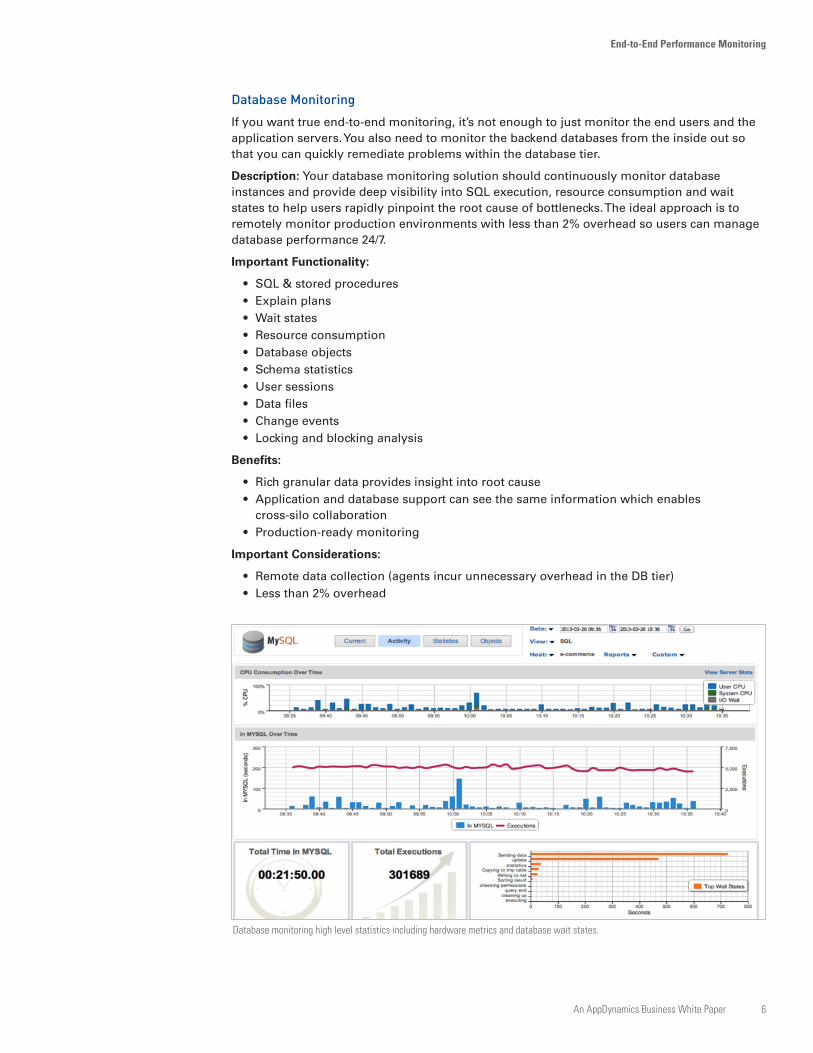
Description: Your database monitoring solution should continuously monitor database instances and provide deep visibility into SQL execution, resource consumption and wait states to help users rapidly pinpoint the root cause of bottlenecks. The ideal approach is to remotely monitor production environments with less than 2% overhead so users can manage database performance 24/7.
Important Functionality:
• SQL & stored procedures• Explain plans• Wait states• Resource consumption• Database objects• Schema statistics• User sessions• Data files• Change events• Locking and blocking analysis
Benefits:
• Rich granular data provides insight into root cause• Application and database support can see the same information which enables
cross-silo collaboration• Production-ready monitoring
Important Considerations:
• Remote data collection (agents incur unnecessary overhead in the DB tier)• Less than 2% overhead
Database monitoring high level statistics including hardware metrics and database wait states.
An AppDynamics Business White Paper 7
End-to-End Performance Monitoring
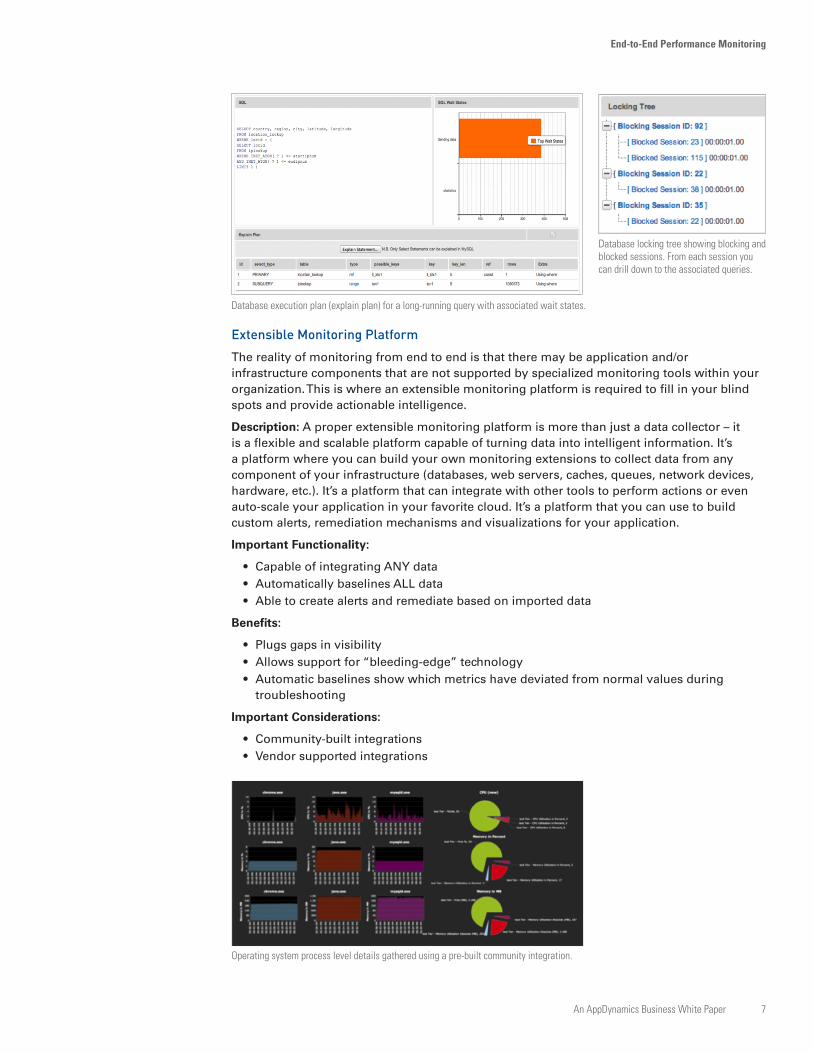
Extensible Monitoring PlatformThe reality of monitoring from end to end is that there may be application and/or infrastructure components that are not supported by specialized monitoring tools within your organization. This is where an extensible monitoring platform is required to fill in your blind spots and provide actionable intelligence.
Description: A proper extensible monitoring platform is more than just a data collector – it is a flexible and scalable platform capable of turning data into intelligent information. It’s a platform where you can build your own monitoring extensions to collect data from any component of your infrastructure (databases, web servers, caches, queues, network devices, hardware, etc.). It’s a platform that can integrate with other tools to perform actions or even auto-scale your application in your favorite cloud. It’s a platform that you can use to build custom alerts, remediation mechanisms and visualizations for your application.
Important Functionality:
• Capable of integrating ANY data• Automatically baselines ALL data• Able to create alerts and remediate based on imported data
Benefits:
• Plugs gaps in visibility• Allows support for “bleeding-edge” technology• Automatic baselines show which metrics have deviated from normal values during
troubleshooting
Important Considerations:
• Community-built integrations• Vendor supported integrations
Database execution plan (explain plan) for a long-running query with associated wait states.
Database locking tree showing blocking and blocked sessions. From each session you can drill down to the associated queries.
Operating system process level details gathered using a pre-built community integration.
AppDynamics, Inc. 303 Second Street, Suite 450 North Tower, San Francisco, CA 94107 www.appdynamics.com Copyright © 2013 AppDynamics, Inc. All rights reserved. The term APPDYNAMICS and any logos of AppDynamics are trademarked or registered trademarks of AppDynamics, Inc.
Try it for FREEwww.appdynamics.com
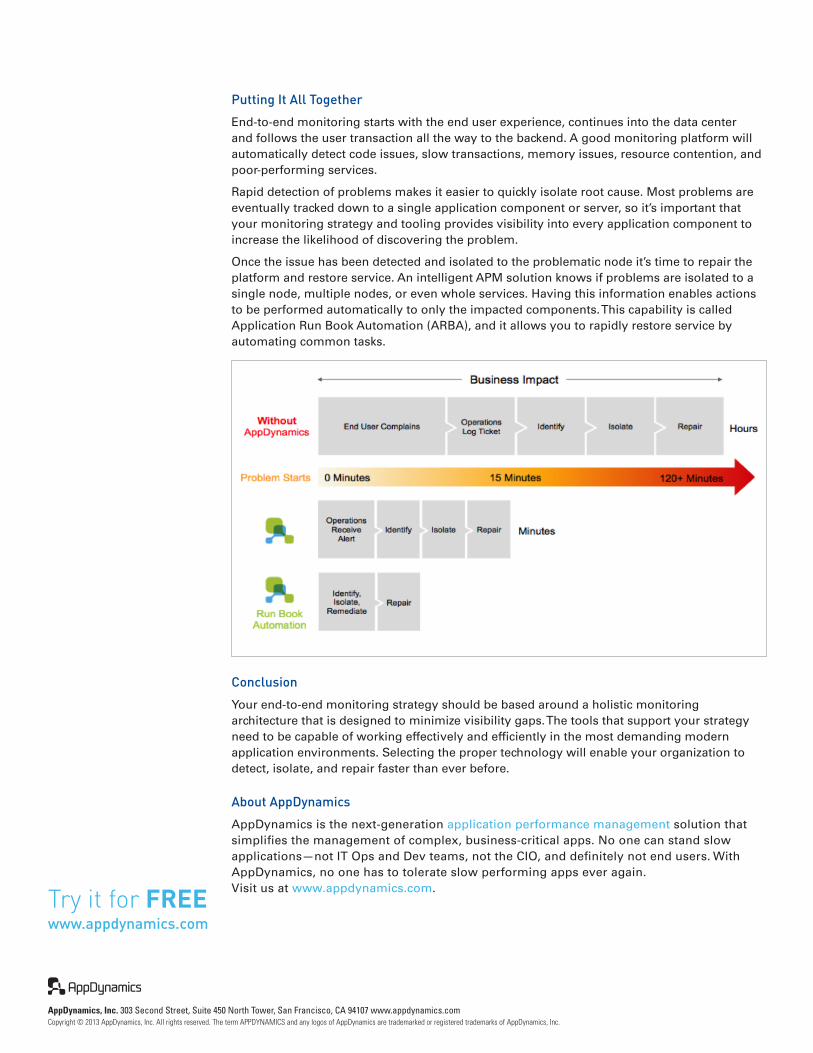
Putting It All TogetherEnd-to-end monitoring starts with the end user experience, continues into the data center and follows the user transaction all the way to the backend. A good monitoring platform will automatically detect code issues, slow transactions, memory issues, resource contention, and poor-performing services.
Rapid detection of problems makes it easier to quickly isolate root cause. Most problems are eventually tracked down to a single application component or server, so it’s important that your monitoring strategy and tooling provides visibility into every application component to increase the likelihood of discovering the problem.
Once the issue has been detected and isolated to the problematic node it’s time to repair the platform and restore service. An intelligent APM solution knows if problems are isolated to a single node, multiple nodes, or even whole services. Having this information enables actions to be performed automatically to only the impacted components. This capability is called Application Run Book Automation (ARBA), and it allows you to rapidly restore service by automating common tasks.
ConclusionYour end-to-end monitoring strategy should be based around a holistic monitoring architecture that is designed to minimize visibility gaps. The tools that support your strategy need to be capable of working effectively and efficiently in the most demanding modern application environments. Selecting the proper technology will enable your organization to detect, isolate, and repair faster than ever before.
About AppDynamicsAppDynamics is the next-generation application performance management solution that simplifies the management of complex, business-critical apps. No one can stand slow applications—not IT Ops and Dev teams, not the CIO, and definitely not end users. With AppDynamics, no one has to tolerate slow performing apps ever again. Visit us at www.appdynamics.com.