Embed Size (px)
Citation preview
Engineering Fracture Mechanics 98 (2013) 185–199
Contents lists available at SciVerse ScienceDirect
Engineering Fracture Mechanics
journal homepage: www.elsevier .com/locate /engfracmech
Measurement of crack-tip and punch-tip transient deformations andstress intensity factors using Digital Gradient Sensing technique
Chandru Periasamy, Hareesh V. Tippur ⇑Department of Mechanical Engineering, Auburn University, AL 36849, United States
a r t i c l e i n f o a b s t r a c t
Article history:Received 17 May 2012Received in revised form 4 September 2012Accepted 15 September 2012
Keywords:Experimental fracture mechanicsOptical measurementsHigh speed photographySpeckle imagingElasto-optic effectStress gradientsTransparent materialsDynamic crack growthImpact loadingStress intensity factors
0013-7944/$ - see front matter � 2012 Elsevier Ltdhttp://dx.doi.org/10.1016/j.engfracmech.2012.09.011
⇑ Corresponding author. Tel.: +1 334 844 3327.E-mail address: [email protected] (H.V. Tippu
The optical method of Digital Gradient Sensing (DGS) is extended to the study of fracturemechanics and impact mechanics problems. DGS is based on the elasto-optic effect exhib-ited by transparent materials subjected to non-uniform state of stress causing the angulardeflection of light rays propagating through the material. Under plane stress conditions,the deflections of light rays can be related to two orthogonal in-plane stress gradients. Inthis paper, the principle of the method is presented first, followed by crack and punchexperiments on PMMA plates for quantifying stress gradients near stress risers. Thecrack-tip stress intensity factors under both quasi-static and dynamic loading conditionsare extracted from DGS measurements and are in good agreement with analytical andfinite element results. The problem of a square-punch impacting the edge of a PMMA sheetis also studied using the new method by exploiting punch-tip–crack-tip analogy. Thedynamic punch-tip stress intensity factors are extracted from the optical measurementsand are again in good agreement with the ones from a complementary finite element anal-ysis of the problem.
� 2012 Elsevier Ltd. All rights reserved.
1. Introduction
Understanding the fracture behavior of materials is vital to the design of critical structures. Its implications are evengreater for materials used in transparent armor [1], helmet visors, aircraft canopies, etc., for shielding personnel and/or sen-sitive equipment while providing adequate optical transparency. Other more common situations include structural windowmaterials, impact resistant transparent enclosures and composites. Wright et al. [2] have reported on ballistic testing of thickand thin polycarbonate plates in which different mechanisms of dynamic failure including elastic dishing, petalling, deeppenetration, cone cracking and plugging have been identified. Numerous studies exist on dynamic fracture of transparentpolymers for understanding either the material behavior or for validating fracture mechanics theories by utilizing their opti-cal transparency [3–7]. In other works, fracture mechanics of glass and other transparent ceramics have been studied eitherin the monolithic form or layered form [8–11] for their crack deflection, crack arrest and fragmentation responses.
In fracture mechanics studies, experimental procedures that employ full-field measurement techniques are preferred, asthey offer abundant qualitative as well as quantitative data for analysis when compared to point-wise methods. Among themphotoelasticity [12,13], moiré interferometry [14], caustics [15,16] and coherent gradient sensing (CGS) [17,18] have all beenused to study dynamic crack growth problems. However, since these techniques use light as the sensing signal, they alsohave certain restrictions – need for specimen birefringence, extensive surface preparation and/or sophisticated coherent op-tics, to name a few. In recent times, digital image correlation (DIC) techniques have become increasingly popular as they re-
. All rights reserved.
r).
Nomenclature
d unit propagation vectori; j; k unit vectors in x-, y- and z-directionsax;ay;az direction cosinesdS optical path changen refractive indexB thicknessr normal stresse normal strainE elastic modulusm Poisson’s ratioCr elasto-optic constant/x, /y angular componentshx, hy solid anglesdx, dy displacement componentsD target distancer, h crack tip polar coordinatesa crack lengthW uncracked ligament lengthKI mode-I stress intensity factorKp punch tip stress intensity factorCL, Cs longitudinal and shear wave speedsC crack speedu2 crack opening displacementt timeV particle velocityq densityA area
186 C. Periasamy, H.V. Tippur / Engineering Fracture Mechanics 98 (2013) 185–199
quire ordinary white light illumination, relatively simple optics, digital electronics and little/no surface preparation [19].With the recent introduction of ultra high-speed digital photography (>100,000 frames per sec) capable of high temporaland spatial resolutions, DIC is becoming a method of choice to study transient fracture problems [20–22] as well. As anextension of DIC based methods, the authors have recently introduced a full-field optical technique called Digital GradientSensing (DGS) [23] that employs 2D DIC method for quantifying elasto-optic effects in transparent materials. They havealso been able to link the optical measurements to two orthogonal in-plane stress gradients under plane stress conditions.The method is shown to be particularly useful in the study of stress concentration problems. The focus of the current workis on demonstrating the feasibility of DGS for measuring crack-tip stress gradients and extraction of stress intensityfactors.
In the following, the experimental setup, working principle and governing equations for the DGS method are discussedfirst. Next, the implementation of DGS method to quasi-static and dynamic crack problems is detailed. The extraction ofmode-I stress intensity factors and comparisons of the measured angular deflections with analytical and numerical solutionsfor quasi-static and dynamic cases, respectively, follow. Finally, the problem of a square punch impacting the edge of a planarsheet is reported in view of its analogous features to a double edged crack subjected to a far-field compressive load perpen-dicular to the crack faces. This analogy permits the use of mode-I crack-tip fields to extract punch-tip stress intensity factorswhich have been compared with the ones based on an elasto-dynamic finite element simulation of the problem.
2. Experimental setup
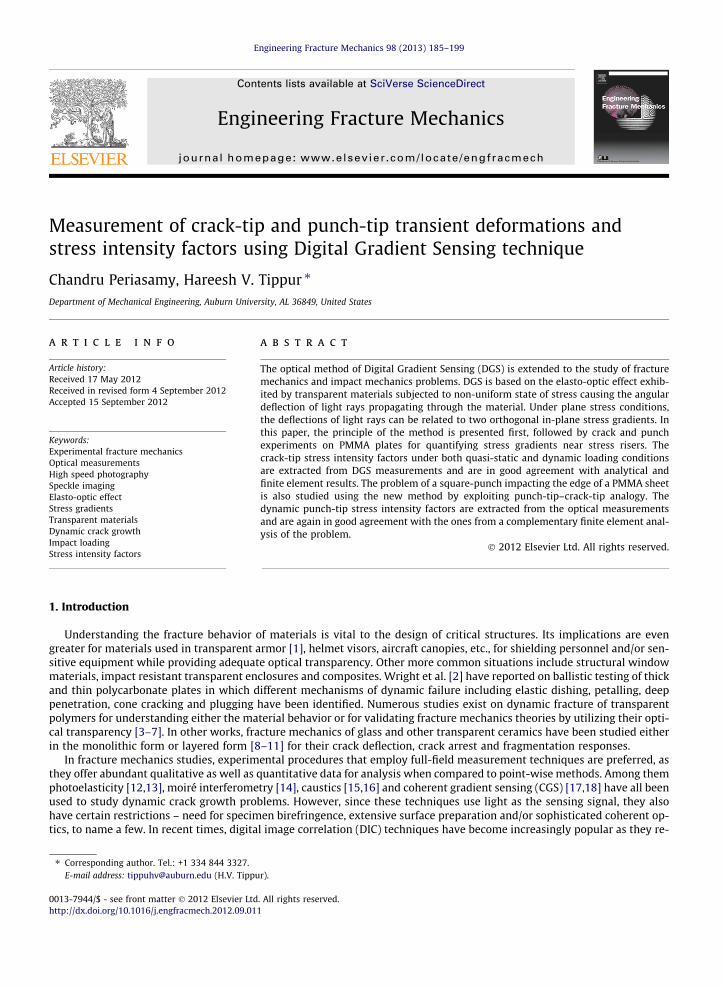
A schematic of the experimental setup for Digital Gradient Sensing (DGS) method is shown in Fig. 1. In view of its relativenovelty [23] to the fracture mechanics community, the experimental details and the working principle of DGS are detailed inthe following for studying fracture and contact mechanics problems. It consists of a uniformly illuminated speckle target, anoptically transparent specimen with an edge crack and a digital camera. The speckle target is a planar surface coated with astochastic black and white pattern produced by spraying fine mists of black and white paints. The transparent specimen tobe tested is placed in front of and parallel to the target plane at a known distance D (=distance between the mid-plane of thespecimen and the target plane). A camera fitted with a long focal length lens is placed behind the specimen at a sufficientlylarge distance L and focused on the target through the specimen in the region of interest. The target is illuminated using twobroadband white light sources. The illumination sources are situated sufficiently far away from the specimen to minimizethermal currents from distorting the speckle images and/or heating the specimen during the experiment. The digital camera
speckle target
specimen
OF
Q
P
y
B
L
x
y
camera
x0
y0
x
z
crack
δ
δ
Δ
Fig. 1. Schematic of the experimental set up for the Digital Gradient Sensing (DGS) method to determine planar stress gradients near a crack tip.
C. Periasamy, H.V. Tippur / Engineering Fracture Mechanics 98 (2013) 185–199 187
settings and lens parameters are selected such that the aperture is sufficiently small for achieving a good focus of speckles onthe target whilst preserving the salient features of the specimen plane (say, crack/flaw, specimen edges, etc.) discernible inthe recorded image for easy post processing of data.
3. Working principle and governing equations
Consider a planar transparent specimen of thickness B and refractive index n in its reference state. Let the in-plane coor-dinates of the specimen and target planes be (x,y) and (x0,y0), respectively, and the optical axis of the setup coincide with thez-axis (see Fig. 1). When speckles on the target plate are photographed normally through the transparent specimen, a genericpoint P on the target plane, corresponding to point O on the specimen (object) plane, is recorded by the camera in the ref-erence state. When subjected to mechanical load, both refractive index and thickness changes occur throughout the speci-men depending on the local state of stress. A combination of these changes causes light rays to deflect as shown in Fig. 1.That is, the light ray OP recorded in the reference/undeformed state now corresponds to OQ after the specimen deforms.By quantifying PQ and knowing the spatial separation D between the mid-plane of the specimen and the target plane, theangular deflection of the light ray relative to the optical axis can be determined.
Let i; j, and k denote unit vectors relative to the Cartesian coordinates defined with point O as the origin. In the referencestate, the unit vector k coincides with OP bringing point P(x0,y0) to focus when imaged by the camera via point O(x,y). Upondeformation, the optical path is locally perturbed, bringing a neighboring point Q(x0 þ dx; y0 þ dy) to the camera’s focus,where dx and dy denote components of PQ in the x- and y-directions. Let the unit vector corresponding to the perturbed opti-cal path be,
d ¼ axiþ ayjþ azk; ð1Þ
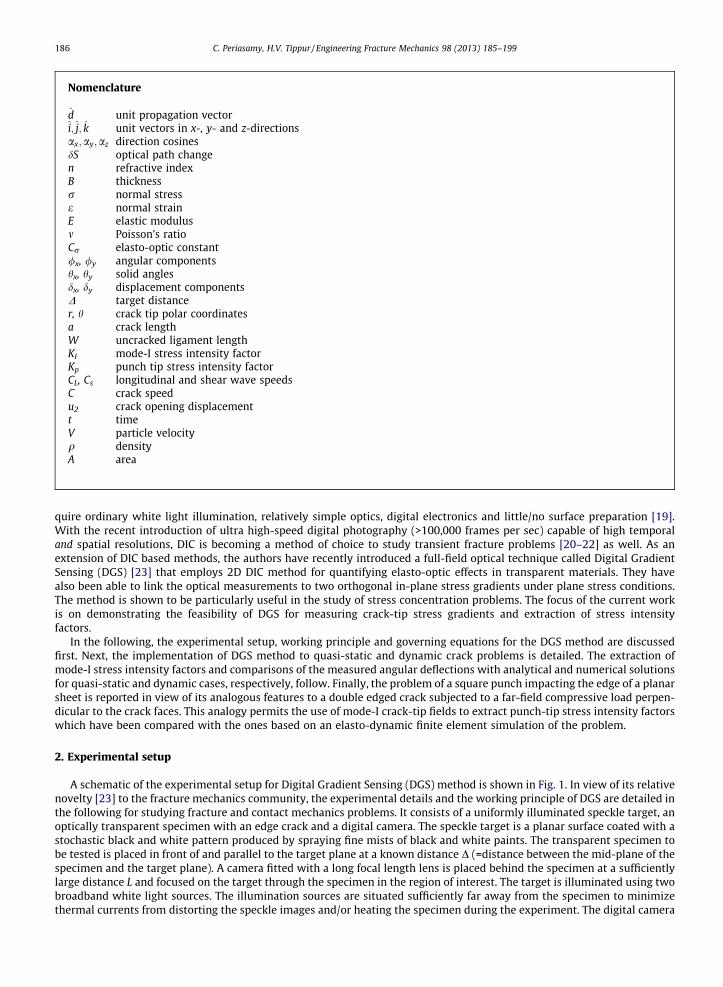
where ax, ay and az are the direction cosines of d, and components of the angular deflection be /x and /y in the x–z and y–zplanes, respectively, as shown in Fig. 2.
The optical path change, dS, due to the deformation of the specimen can be expressed as [17],
dSðx; yÞ ¼ 2Bðn� 1ÞZ 1=2
0ezz dðz=BÞ þ 2B
Z 1=2
0dndðz=BÞ ð2Þ
The two terms in the above equation represent the contribution of normal strain in the thickness direction, ezz, and thechange in the refractive index, dn, to the overall optical path change, respectively. The refractive index change caused by thelocal stress state in the specimen, is given by the well known Maxwell relationship [24],
dnðx; yÞ ¼ D1ðrxx þ ryy þ rzzÞ ð3Þ
y
z
O
P
Q
δyx0
y0
R
B
C
D
E
Δ
δx
δ
x
θy
θx
A
φy φx
Fig. 2. Schematic representing measured quantities and their relationship to other geometric parameters used in DGS.
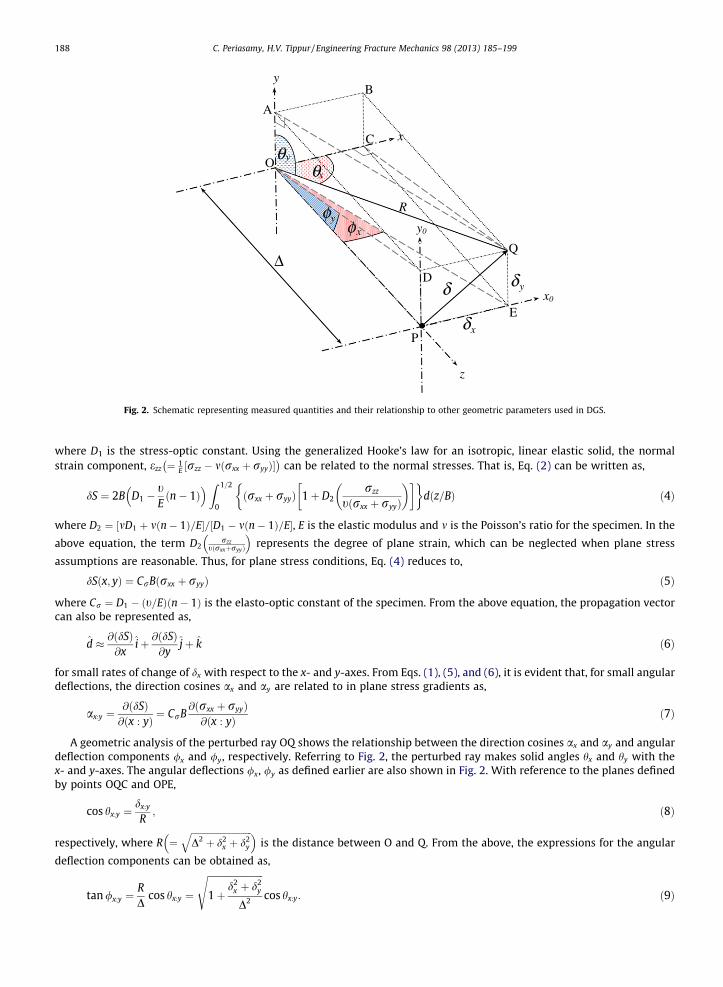
188 C. Periasamy, H.V. Tippur / Engineering Fracture Mechanics 98 (2013) 185–199
where D1 is the stress-optic constant. Using the generalized Hooke’s law for an isotropic, linear elastic solid, the normalstrain component, ezz ¼ 1
E ½rzz � mðrxx þ ryyÞ�� �
can be related to the normal stresses. That is, Eq. (2) can be written as,
dS ¼ 2B D1 �tEðn� 1Þ
� �Z 1=2
0ðrxx þ ryyÞ 1þ D2
rzz
tðrxx þ ryyÞ
� �� �dðz=BÞ ð4Þ
where D2 ¼ ½mD1 þ mðn� 1Þ=E�=½D1 � mðn� 1Þ=E�, E is the elastic modulus and m is the Poisson’s ratio for the specimen. In the
above equation, the term D2rzz
tðrxxþryyÞ
� �represents the degree of plane strain, which can be neglected when plane stress
assumptions are reasonable. Thus, for plane stress conditions, Eq. (4) reduces to,
dSðx; yÞ ¼ CrBðrxx þ ryyÞ ð5Þ
where Cr ¼ D1 � ðt=EÞðn� 1Þ is the elasto-optic constant of the specimen. From the above equation, the propagation vectorcan also be represented as,
d � @ðdSÞ@x
iþ @ðdSÞ@y
jþ k ð6Þ
for small rates of change of dx with respect to the x- and y-axes. From Eqs. (1), (5), and (6), it is evident that, for small angulardeflections, the direction cosines ax and ay are related to in plane stress gradients as,
ax:y ¼@ðdSÞ@ðx : yÞ ¼ CrB
@ðrxx þ ryyÞ@ðx : yÞ ð7Þ
A geometric analysis of the perturbed ray OQ shows the relationship between the direction cosines ax and ay and angulardeflection components /x and /y, respectively. Referring to Fig. 2, the perturbed ray makes solid angles hx and hy with thex- and y-axes. The angular deflections /x, /y as defined earlier are also shown in Fig. 2. With reference to the planes definedby points OQC and OPE,
cos hx:y ¼dx:y
R; ð8Þ
respectively, where R ¼ffiffiffiffiffiffiffiffiffiffiffiffiffiffiffiffiffiffiffiffiffiffiffiffiffiffiffiD2 þ d2
x þ d2y
q� �is the distance between O and Q. From the above, the expressions for the angular
deflection components can be obtained as,
tan /x:y ¼RD
cos hx:y ¼
ffiffiffiffiffiffiffiffiffiffiffiffiffiffiffiffiffiffiffiffiffiffiffiffi1þ
d2x þ d2
y
D2
scos hx:y: ð9Þ
C. Periasamy, H.V. Tippur / Engineering Fracture Mechanics 98 (2013) 185–199 189
It can be noted from Eq. (9) that for small angular deflections (or, dx; dy � D), the expressions reduce to/x:y � cos hx:y ¼ ax:y. Thus, for the case of small angular deflections of light rays, the governing equations for the method re-duce to,
Fig. 3.subject
/x:y �dx:y
D� ax:y ¼ CrB
@ðrxx þ ryyÞ@ðx : yÞ ; ð10Þ
using which stress gradients can be obtained from angular deflections. Thus by photographing speckles on the target planethrough the specimen before and after the application of load, the reference and deformed speckle patterns can be digitallyacquired. Subsequently, 2D digital image correlation of the two acquired images yields full-field information regarding dis-placements dx and dy. Knowing the distance D between the specimen and target planes, angles /x and /y can be evaluated.
4. Quasi-static crack problem
4.1. Experimental setup
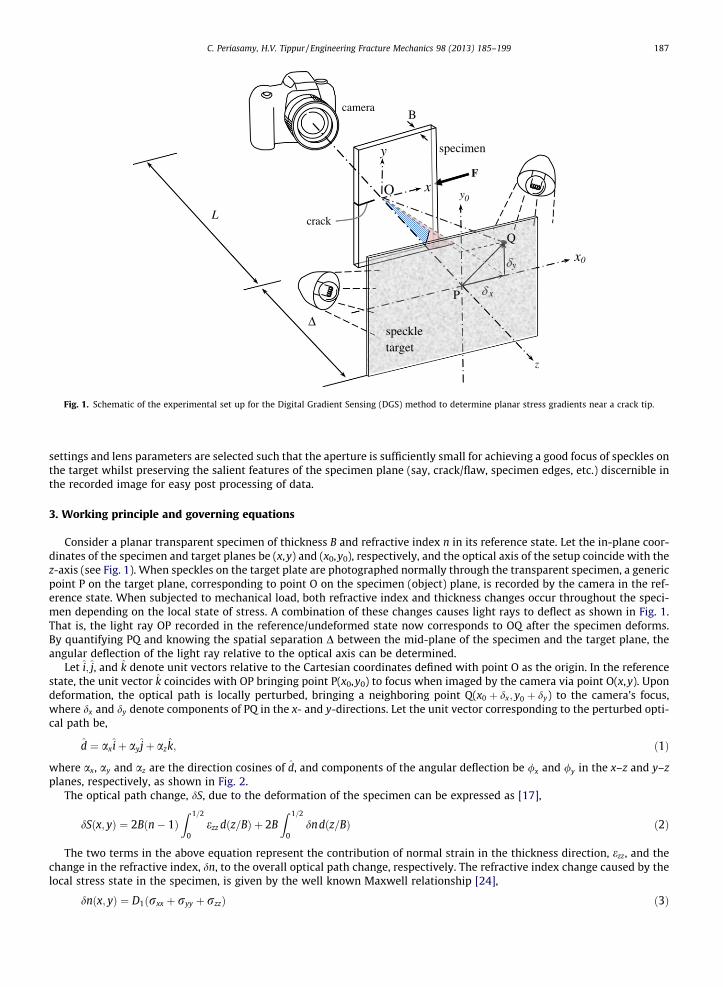
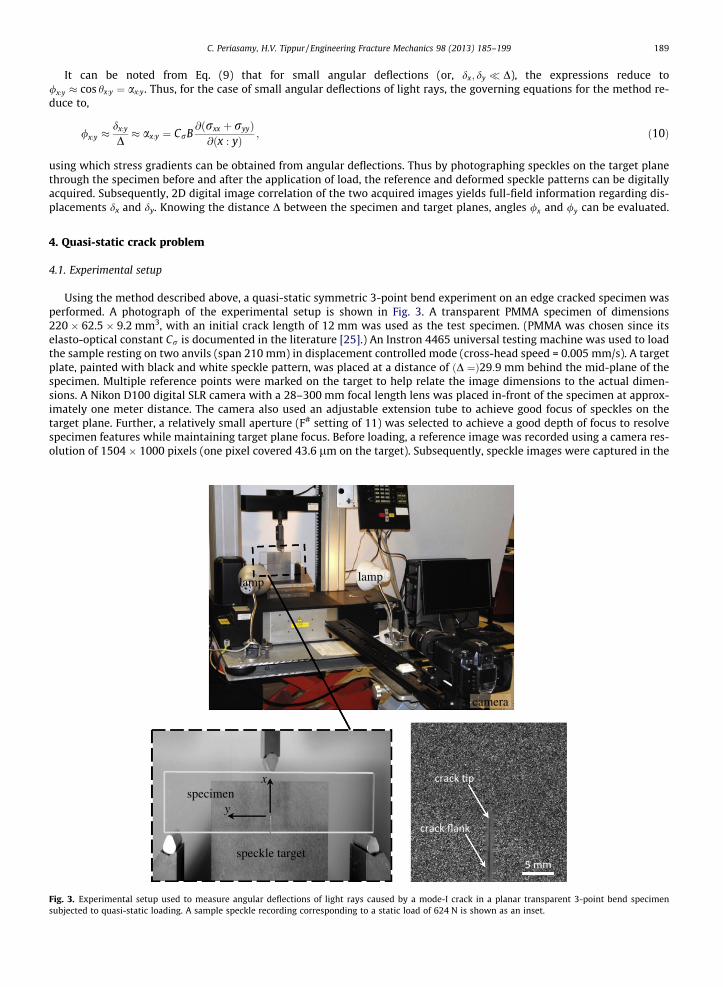
Using the method described above, a quasi-static symmetric 3-point bend experiment on an edge cracked specimen wasperformed. A photograph of the experimental setup is shown in Fig. 3. A transparent PMMA specimen of dimensions220 � 62.5 � 9.2 mm3, with an initial crack length of 12 mm was used as the test specimen. (PMMA was chosen since itselasto-optical constant Cr is documented in the literature [25].) An Instron 4465 universal testing machine was used to loadthe sample resting on two anvils (span 210 mm) in displacement controlled mode (cross-head speed = 0.005 mm/s). A targetplate, painted with black and white speckle pattern, was placed at a distance of ðD ¼Þ29:9 mm behind the mid-plane of thespecimen. Multiple reference points were marked on the target to help relate the image dimensions to the actual dimen-sions. A Nikon D100 digital SLR camera with a 28–300 mm focal length lens was placed in-front of the specimen at approx-imately one meter distance. The camera also used an adjustable extension tube to achieve good focus of speckles on thetarget plane. Further, a relatively small aperture (F# setting of 11) was selected to achieve a good depth of focus to resolvespecimen features while maintaining target plane focus. Before loading, a reference image was recorded using a camera res-olution of 1504 � 1000 pixels (one pixel covered 43.6 lm on the target). Subsequently, speckle images were captured in the
Experimental setup used to measure angular deflections of light rays caused by a mode-I crack in a planar transparent 3-point bend specimened to quasi-static loading. A sample speckle recording corresponding to a static load of 624 N is shown as an inset.
190 C. Periasamy, H.V. Tippur / Engineering Fracture Mechanics 98 (2013) 185–199
deformed state once every 5 s during loading using time lapse photography. As the crack-tip vicinity suffered deformation,light rays passing through the specimen were deflected by the local non-uniform state of stress distorting the speckle imagesrelative to the reference state. The images corresponding to the deformed state along with the one from the reference statewere then used to extract the angular deflection fields (/x and /y) using 2D digital image correlation using ARAMIS imageanalysis software. During the analysis, the images were segmented into 15 � 15 pixel non-overlapping sub-images. Thisyielded an array of 99 � 65 data points to analyze.
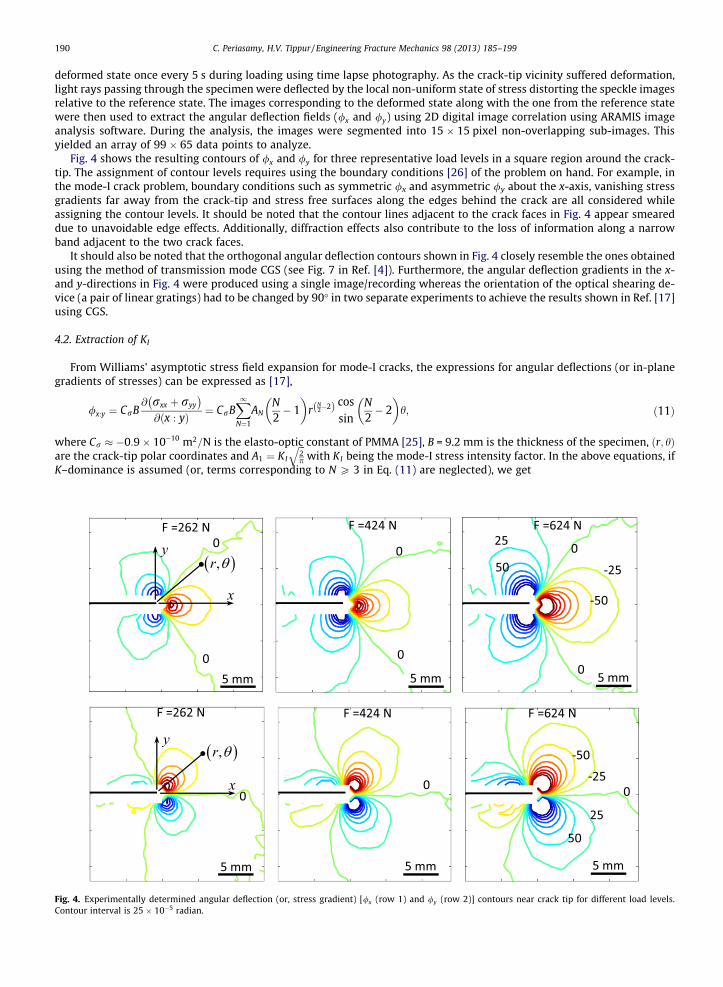
Fig. 4 shows the resulting contours of /x and /y for three representative load levels in a square region around the crack-tip. The assignment of contour levels requires using the boundary conditions [26] of the problem on hand. For example, inthe mode-I crack problem, boundary conditions such as symmetric /x and asymmetric /y about the x-axis, vanishing stressgradients far away from the crack-tip and stress free surfaces along the edges behind the crack are all considered whileassigning the contour levels. It should be noted that the contour lines adjacent to the crack faces in Fig. 4 appear smeareddue to unavoidable edge effects. Additionally, diffraction effects also contribute to the loss of information along a narrowband adjacent to the two crack faces.
It should also be noted that the orthogonal angular deflection contours shown in Fig. 4 closely resemble the ones obtainedusing the method of transmission mode CGS (see Fig. 7 in Ref. [4]). Furthermore, the angular deflection gradients in the x-and y-directions in Fig. 4 were produced using a single image/recording whereas the orientation of the optical shearing de-vice (a pair of linear gratings) had to be changed by 90� in two separate experiments to achieve the results shown in Ref. [17]using CGS.
4.2. Extraction of KI
From Williams’ asymptotic stress field expansion for mode-I cracks, the expressions for angular deflections (or in-planegradients of stresses) can be expressed as [17],
Fig. 4.Contou
/x:y ¼ CrB@ rxx þ ryy� �@ðx : yÞ ¼ CrB
X1N¼1
ANN2� 1
� �r
N2�2ð Þ cos
sinN2� 2
� �h; ð11Þ
where Cr � �0:9� 10�10 m2=N is the elasto-optic constant of PMMA [25], B = 9.2 mm is the thickness of the specimen, ðr; hÞare the crack-tip polar coordinates and A1 ¼ KI
ffiffiffi2p
qwith KI being the mode-I stress intensity factor. In the above equations, if
K–dominance is assumed (or, terms corresponding to N P 3 in Eq. (11) are neglected), we get
Experimentally determined angular deflection (or, stress gradient) [/x (row 1) and /y (row 2)] contours near crack tip for different load levels.r interval is 25 � 10�5 radian.
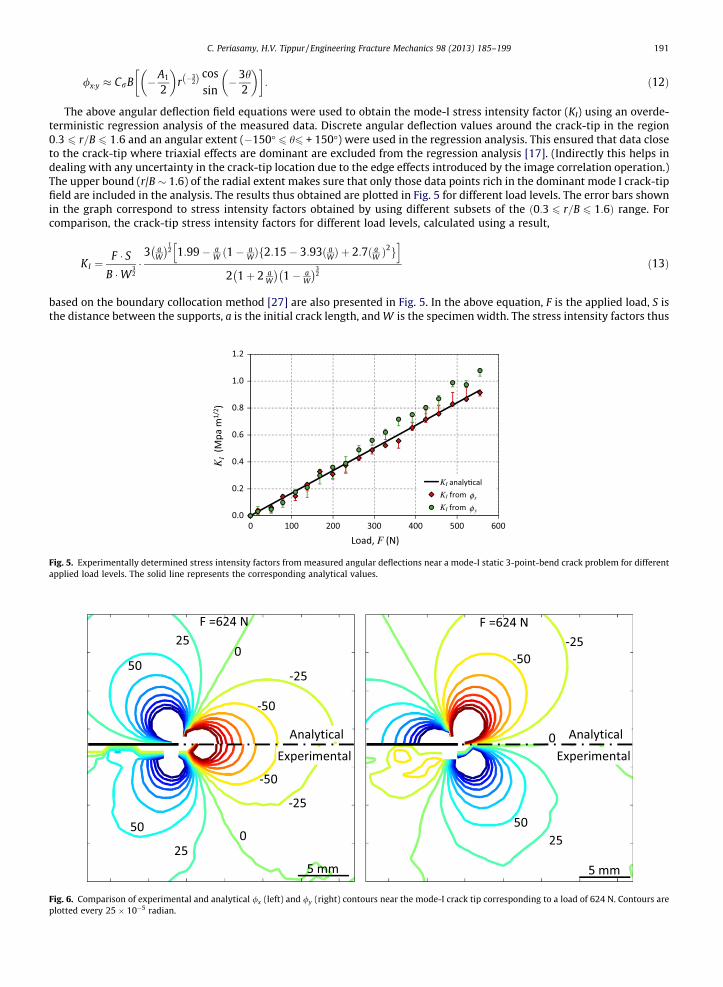
Fig. 5.applied
Fig. 6.plotted
C. Periasamy, H.V. Tippur / Engineering Fracture Mechanics 98 (2013) 185–199 191
/x:y � CrB �A1
2
� �r �
32ð Þ cos
sin�3h
2
� �� : ð12Þ
The above angular deflection field equations were used to obtain the mode-I stress intensity factor (KI) using an overde-terministic regression analysis of the measured data. Discrete angular deflection values around the crack-tip in the region0:3 6 r=B 6 1:6 and an angular extent (�150� 6 h6 + 150�) were used in the regression analysis. This ensured that data closeto the crack-tip where triaxial effects are dominant are excluded from the regression analysis [17]. (Indirectly this helps indealing with any uncertainty in the crack-tip location due to the edge effects introduced by the image correlation operation.)The upper bound (r/B � 1.6) of the radial extent makes sure that only those data points rich in the dominant mode I crack-tipfield are included in the analysis. The results thus obtained are plotted in Fig. 5 for different load levels. The error bars shownin the graph correspond to stress intensity factors obtained by using different subsets of the ð0:3 6 r=B 6 1:6Þ range. Forcomparison, the crack-tip stress intensity factors for different load levels, calculated using a result,
KI ¼F � S
B �W32�3 a
W
� �12 1:99� a
W ð1� aWÞf2:15� 3:93ð a
WÞ þ 2:7ð aW Þ
2gh i
2 1þ 2 aW
� �1� a
W
� �32
ð13Þ
based on the boundary collocation method [27] are also presented in Fig. 5. In the above equation, F is the applied load, S isthe distance between the supports, a is the initial crack length, and W is the specimen width. The stress intensity factors thus
Experimentally determined stress intensity factors from measured angular deflections near a mode-I static 3-point-bend crack problem for differentload levels. The solid line represents the corresponding analytical values.
Comparison of experimental and analytical /x (left) and /y (right) contours near the mode-I crack tip corresponding to a load of 624 N. Contours areevery 25 � 10�5 radian.
192 C. Periasamy, H.V. Tippur / Engineering Fracture Mechanics 98 (2013) 185–199
obtained were in turn used in Eq. (12) to obtain the analytical /x and /y contours. Fig. 6 shows a comparison of the exper-imental and analytical angular deflection contours for a representative load level of F = 624 N. Evidently the agreement be-tween the analytical and experimental contour lines is rather good.
5. Dynamic crack problem
5.1. Experimental setup
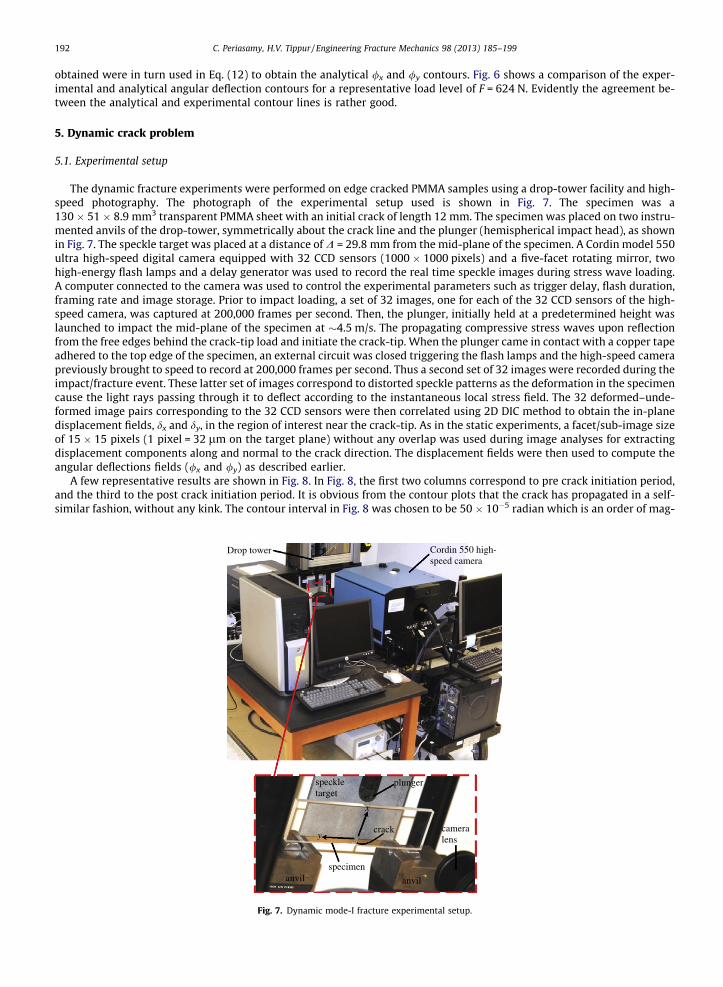
The dynamic fracture experiments were performed on edge cracked PMMA samples using a drop-tower facility and high-speed photography. The photograph of the experimental setup used is shown in Fig. 7. The specimen was a130 � 51 � 8.9 mm3 transparent PMMA sheet with an initial crack of length 12 mm. The specimen was placed on two instru-mented anvils of the drop-tower, symmetrically about the crack line and the plunger (hemispherical impact head), as shownin Fig. 7. The speckle target was placed at a distance of D = 29.8 mm from the mid-plane of the specimen. A Cordin model 550ultra high-speed digital camera equipped with 32 CCD sensors (1000 � 1000 pixels) and a five-facet rotating mirror, twohigh-energy flash lamps and a delay generator was used to record the real time speckle images during stress wave loading.A computer connected to the camera was used to control the experimental parameters such as trigger delay, flash duration,framing rate and image storage. Prior to impact loading, a set of 32 images, one for each of the 32 CCD sensors of the high-speed camera, was captured at 200,000 frames per second. Then, the plunger, initially held at a predetermined height waslaunched to impact the mid-plane of the specimen at �4.5 m/s. The propagating compressive stress waves upon reflectionfrom the free edges behind the crack-tip load and initiate the crack-tip. When the plunger came in contact with a copper tapeadhered to the top edge of the specimen, an external circuit was closed triggering the flash lamps and the high-speed camerapreviously brought to speed to record at 200,000 frames per second. Thus a second set of 32 images were recorded during theimpact/fracture event. These latter set of images correspond to distorted speckle patterns as the deformation in the specimencause the light rays passing through it to deflect according to the instantaneous local stress field. The 32 deformed–unde-formed image pairs corresponding to the 32 CCD sensors were then correlated using 2D DIC method to obtain the in-planedisplacement fields, dx and dy, in the region of interest near the crack-tip. As in the static experiments, a facet/sub-image sizeof 15 � 15 pixels (1 pixel = 32 lm on the target plane) without any overlap was used during image analyses for extractingdisplacement components along and normal to the crack direction. The displacement fields were then used to compute theangular deflections fields (/x and /y) as described earlier.
A few representative results are shown in Fig. 8. In Fig. 8, the first two columns correspond to pre crack initiation period,and the third to the post crack initiation period. It is obvious from the contour plots that the crack has propagated in a self-similar fashion, without any kink. The contour interval in Fig. 8 was chosen to be 50 � 10�5 radian which is an order of mag-
plungerspeckle target
camera lensy
x
Cordin 550 high-speed camera
specimenanvil anvil
crack
Drop tower
Fig. 7. Dynamic mode-I fracture experimental setup.
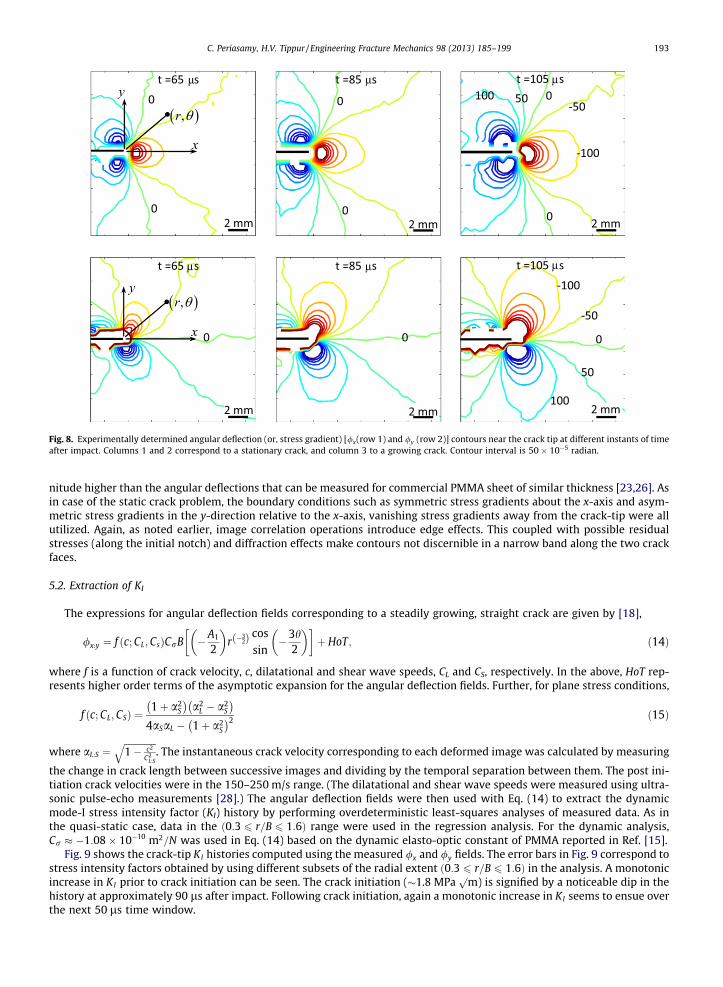
Fig. 8. Experimentally determined angular deflection (or, stress gradient) [/x(row 1) and /y (row 2)] contours near the crack tip at different instants of timeafter impact. Columns 1 and 2 correspond to a stationary crack, and column 3 to a growing crack. Contour interval is 50 � 10�5 radian.
C. Periasamy, H.V. Tippur / Engineering Fracture Mechanics 98 (2013) 185–199 193
nitude higher than the angular deflections that can be measured for commercial PMMA sheet of similar thickness [23,26]. Asin case of the static crack problem, the boundary conditions such as symmetric stress gradients about the x-axis and asym-metric stress gradients in the y-direction relative to the x-axis, vanishing stress gradients away from the crack-tip were allutilized. Again, as noted earlier, image correlation operations introduce edge effects. This coupled with possible residualstresses (along the initial notch) and diffraction effects make contours not discernible in a narrow band along the two crackfaces.
5.2. Extraction of KI
The expressions for angular deflection fields corresponding to a steadily growing, straight crack are given by [18],
/x:y ¼ f ðc; CL;CsÞCrB �A1
2
� �r �
32ð Þ cos
sin�3h
2
� �� þ HoT; ð14Þ
where f is a function of crack velocity, c, dilatational and shear wave speeds, CL and CS, respectively. In the above, HoT rep-resents higher order terms of the asymptotic expansion for the angular deflection fields. Further, for plane stress conditions,
f ðc; CL;CSÞ ¼1þ a2
S
� �a2
L � a2S
� �4aSaL � 1þ a2
S
� �2 ð15Þ
where aL:S ¼ffiffiffiffiffiffiffiffiffiffiffiffiffiffi1� c2
C2L:S
q. The instantaneous crack velocity corresponding to each deformed image was calculated by measuring
the change in crack length between successive images and dividing by the temporal separation between them. The post ini-tiation crack velocities were in the 150–250 m/s range. (The dilatational and shear wave speeds were measured using ultra-sonic pulse-echo measurements [28].) The angular deflection fields were then used with Eq. (14) to extract the dynamicmode-I stress intensity factor (KI) history by performing overdeterministic least-squares analyses of measured data. As inthe quasi-static case, data in the ð0:3 6 r=B 6 1:6Þ range were used in the regression analysis. For the dynamic analysis,Cr � �1:08� 10�10 m2=N was used in Eq. (14) based on the dynamic elasto-optic constant of PMMA reported in Ref. [15].
Fig. 9 shows the crack-tip KI histories computed using the measured /x and /y fields. The error bars in Fig. 9 correspond tostress intensity factors obtained by using different subsets of the radial extent ð0:3 6 r=B 6 1:6Þ in the analysis. A monotonicincrease in KI prior to crack initiation can be seen. The crack initiation (�1.8 MPa
pm) is signified by a noticeable dip in the
history at approximately 90 ls after impact. Following crack initiation, again a monotonic increase in KI seems to ensue overthe next 50 ls time window.
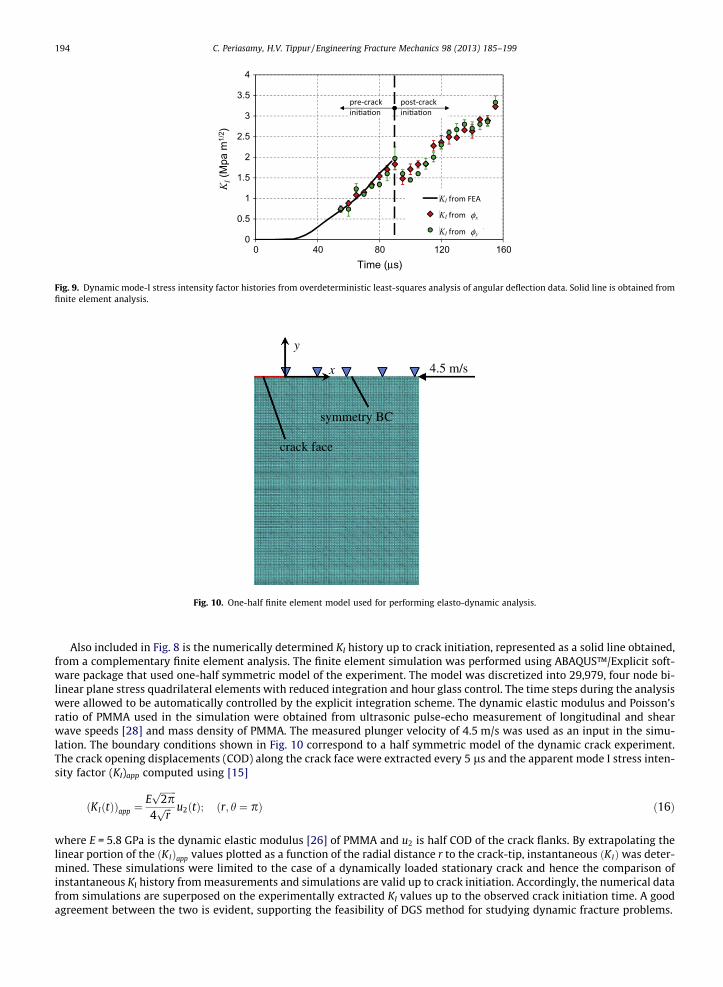
Fig. 9. Dynamic mode-I stress intensity factor histories from overdeterministic least-squares analysis of angular deflection data. Solid line is obtained fromfinite element analysis.
y
4.5 m/s
crack face
symmetry BC
x
Fig. 10. One-half finite element model used for performing elasto-dynamic analysis.
194 C. Periasamy, H.V. Tippur / Engineering Fracture Mechanics 98 (2013) 185–199
Also included in Fig. 8 is the numerically determined KI history up to crack initiation, represented as a solid line obtained,from a complementary finite element analysis. The finite element simulation was performed using ABAQUS™/Explicit soft-ware package that used one-half symmetric model of the experiment. The model was discretized into 29,979, four node bi-linear plane stress quadrilateral elements with reduced integration and hour glass control. The time steps during the analysiswere allowed to be automatically controlled by the explicit integration scheme. The dynamic elastic modulus and Poisson’sratio of PMMA used in the simulation were obtained from ultrasonic pulse-echo measurement of longitudinal and shearwave speeds [28] and mass density of PMMA. The measured plunger velocity of 4.5 m/s was used as an input in the simu-lation. The boundary conditions shown in Fig. 10 correspond to a half symmetric model of the dynamic crack experiment.The crack opening displacements (COD) along the crack face were extracted every 5 ls and the apparent mode I stress inten-sity factor (KI)app computed using [15]
ðKIðtÞÞapp ¼Effiffiffiffiffiffiffi2pp
4ffiffiffirp u2ðtÞ; ðr; h ¼ pÞ ð16Þ
where E = 5.8 GPa is the dynamic elastic modulus [26] of PMMA and u2 is half COD of the crack flanks. By extrapolating thelinear portion of the ðKIÞapp values plotted as a function of the radial distance r to the crack-tip, instantaneous ðKIÞwas deter-mined. These simulations were limited to the case of a dynamically loaded stationary crack and hence the comparison ofinstantaneous KI history from measurements and simulations are valid up to crack initiation. Accordingly, the numerical datafrom simulations are superposed on the experimentally extracted KI values up to the observed crack initiation time. A goodagreement between the two is evident, supporting the feasibility of DGS method for studying dynamic fracture problems.
C. Periasamy, H.V. Tippur / Engineering Fracture Mechanics 98 (2013) 185–199 195
6. Dynamic punch impact problem
6.1. Square punch-crack analogy
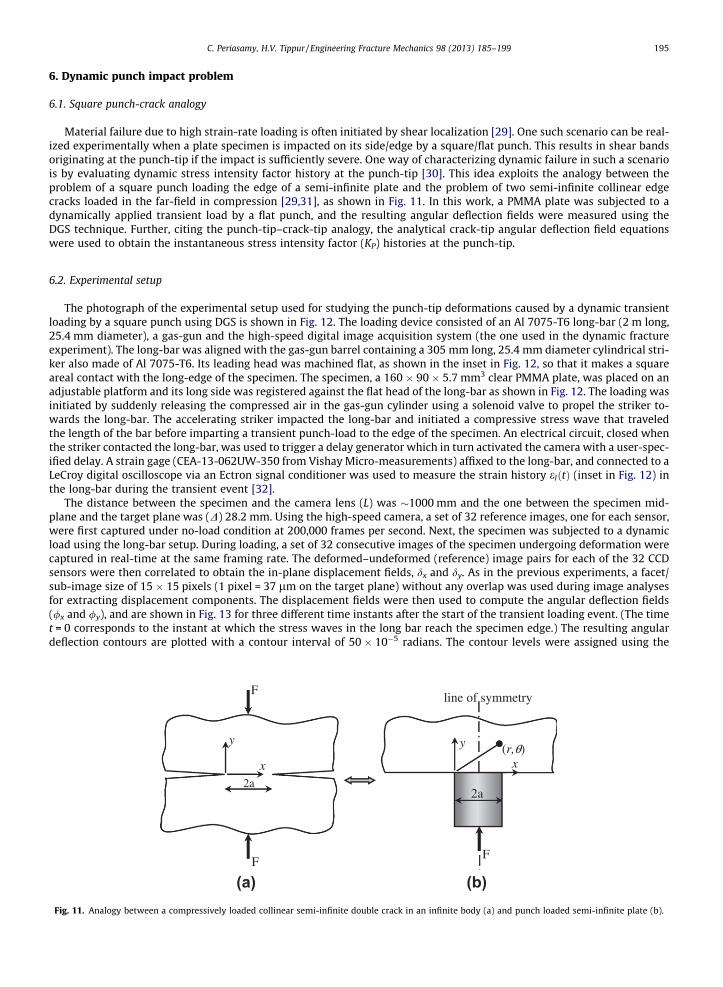
Material failure due to high strain-rate loading is often initiated by shear localization [29]. One such scenario can be real-ized experimentally when a plate specimen is impacted on its side/edge by a square/flat punch. This results in shear bandsoriginating at the punch-tip if the impact is sufficiently severe. One way of characterizing dynamic failure in such a scenariois by evaluating dynamic stress intensity factor history at the punch-tip [30]. This idea exploits the analogy between theproblem of a square punch loading the edge of a semi-infinite plate and the problem of two semi-infinite collinear edgecracks loaded in the far-field in compression [29,31], as shown in Fig. 11. In this work, a PMMA plate was subjected to adynamically applied transient load by a flat punch, and the resulting angular deflection fields were measured using theDGS technique. Further, citing the punch-tip–crack-tip analogy, the analytical crack-tip angular deflection field equationswere used to obtain the instantaneous stress intensity factor (KP) histories at the punch-tip.
6.2. Experimental setup
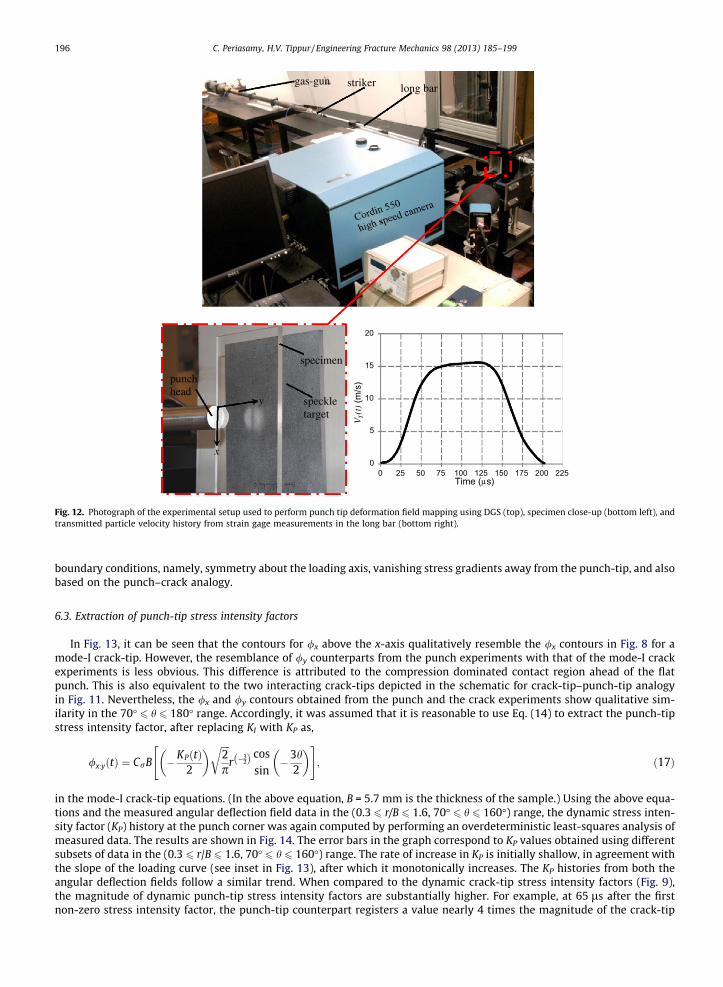
The photograph of the experimental setup used for studying the punch-tip deformations caused by a dynamic transientloading by a square punch using DGS is shown in Fig. 12. The loading device consisted of an Al 7075-T6 long-bar (2 m long,25.4 mm diameter), a gas-gun and the high-speed digital image acquisition system (the one used in the dynamic fractureexperiment). The long-bar was aligned with the gas-gun barrel containing a 305 mm long, 25.4 mm diameter cylindrical stri-ker also made of Al 7075-T6. Its leading head was machined flat, as shown in the inset in Fig. 12, so that it makes a squareareal contact with the long-edge of the specimen. The specimen, a 160 � 90 � 5.7 mm3 clear PMMA plate, was placed on anadjustable platform and its long side was registered against the flat head of the long-bar as shown in Fig. 12. The loading wasinitiated by suddenly releasing the compressed air in the gas-gun cylinder using a solenoid valve to propel the striker to-wards the long-bar. The accelerating striker impacted the long-bar and initiated a compressive stress wave that traveledthe length of the bar before imparting a transient punch-load to the edge of the specimen. An electrical circuit, closed whenthe striker contacted the long-bar, was used to trigger a delay generator which in turn activated the camera with a user-spec-ified delay. A strain gage (CEA-13-062UW-350 from Vishay Micro-measurements) affixed to the long-bar, and connected to aLeCroy digital oscilloscope via an Ectron signal conditioner was used to measure the strain history eIðtÞ (inset in Fig. 12) inthe long-bar during the transient event [32].
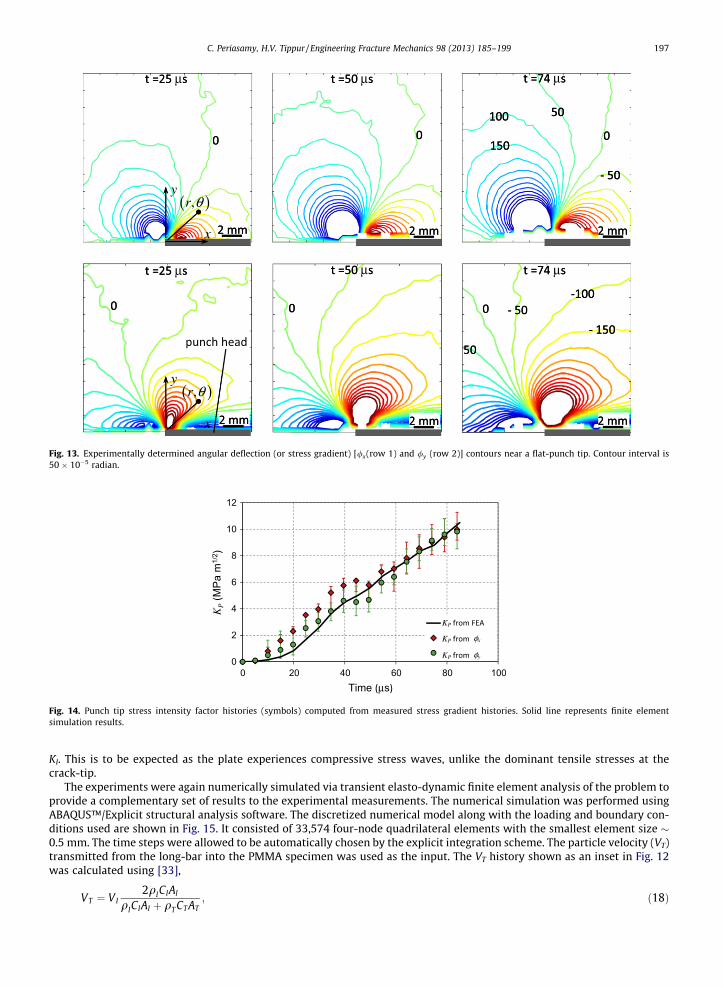
The distance between the specimen and the camera lens (L) was �1000 mm and the one between the specimen mid-plane and the target plane was (D) 28.2 mm. Using the high-speed camera, a set of 32 reference images, one for each sensor,were first captured under no-load condition at 200,000 frames per second. Next, the specimen was subjected to a dynamicload using the long-bar setup. During loading, a set of 32 consecutive images of the specimen undergoing deformation werecaptured in real-time at the same framing rate. The deformed–undeformed (reference) image pairs for each of the 32 CCDsensors were then correlated to obtain the in-plane displacement fields, dx and dy. As in the previous experiments, a facet/sub-image size of 15 � 15 pixels (1 pixel = 37 lm on the target plane) without any overlap was used during image analysesfor extracting displacement components. The displacement fields were then used to compute the angular deflection fields(/x and /y), and are shown in Fig. 13 for three different time instants after the start of the transient loading event. (The timet = 0 corresponds to the instant at which the stress waves in the long bar reach the specimen edge.) The resulting angulardeflection contours are plotted with a contour interval of 50 � 10�5 radians. The contour levels were assigned using the
(a) (b)
line of symmetry
2a
y
x
F
2a
x
y(r,θ)
F
F
Fig. 11. Analogy between a compressively loaded collinear semi-infinite double crack in an infinite body (a) and punch loaded semi-infinite plate (b).
gas-gun striker long bar
speckle target
specimen
punch head
x
y
0
5
10
15
20
0 25 50 75 100 125 150 175 200 225
V T(t
)(m
/s)
Time ( s)μ
Fig. 12. Photograph of the experimental setup used to perform punch tip deformation field mapping using DGS (top), specimen close-up (bottom left), andtransmitted particle velocity history from strain gage measurements in the long bar (bottom right).
196 C. Periasamy, H.V. Tippur / Engineering Fracture Mechanics 98 (2013) 185–199
boundary conditions, namely, symmetry about the loading axis, vanishing stress gradients away from the punch-tip, and alsobased on the punch–crack analogy.
6.3. Extraction of punch-tip stress intensity factors
In Fig. 13, it can be seen that the contours for /x above the x-axis qualitatively resemble the /x contours in Fig. 8 for amode-I crack-tip. However, the resemblance of /y counterparts from the punch experiments with that of the mode-I crackexperiments is less obvious. This difference is attributed to the compression dominated contact region ahead of the flatpunch. This is also equivalent to the two interacting crack-tips depicted in the schematic for crack-tip–punch-tip analogyin Fig. 11. Nevertheless, the /x and /y contours obtained from the punch and the crack experiments show qualitative sim-ilarity in the 70� 6 h 6 180� range. Accordingly, it was assumed that it is reasonable to use Eq. (14) to extract the punch-tipstress intensity factor, after replacing KI with KP as,
/x:yðtÞ ¼ CrB �KPðtÞ2
� � ffiffiffiffi2p
rr �
32ð Þ cos
sin�3h
2
� �" #; ð17Þ
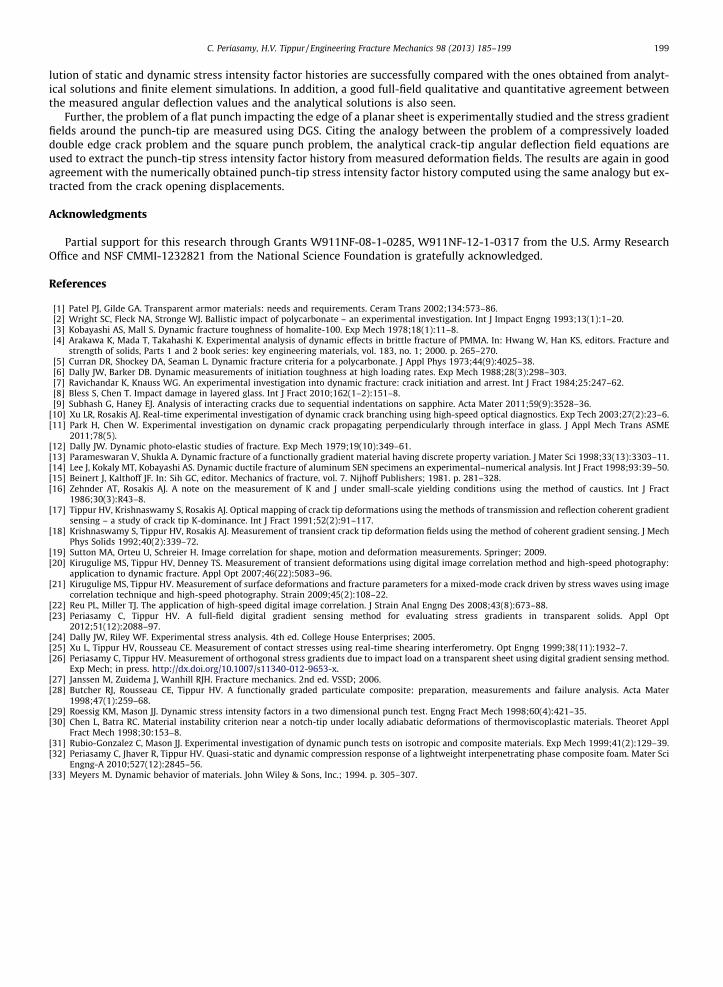
in the mode-I crack-tip equations. (In the above equation, B = 5.7 mm is the thickness of the sample.) Using the above equa-tions and the measured angular deflection field data in the (0.3 6 r/B 6 1.6, 70� 6 h 6 160�) range, the dynamic stress inten-sity factor (KP) history at the punch corner was again computed by performing an overdeterministic least-squares analysis ofmeasured data. The results are shown in Fig. 14. The error bars in the graph correspond to KP values obtained using differentsubsets of data in the (0.3 6 r/B 6 1.6, 70� 6 h 6 160�) range. The rate of increase in KP is initially shallow, in agreement withthe slope of the loading curve (see inset in Fig. 13), after which it monotonically increases. The KP histories from both theangular deflection fields follow a similar trend. When compared to the dynamic crack-tip stress intensity factors (Fig. 9),the magnitude of dynamic punch-tip stress intensity factors are substantially higher. For example, at 65 ls after the firstnon-zero stress intensity factor, the punch-tip counterpart registers a value nearly 4 times the magnitude of the crack-tip
μ μ μ
y
x
( ),r θ
μ μ μ
y
x
( ),r θ
Fig. 13. Experimentally determined angular deflection (or stress gradient) [/x(row 1) and /y (row 2)] contours near a flat-punch tip. Contour interval is50 � 10�5 radian.
Fig. 14. Punch tip stress intensity factor histories (symbols) computed from measured stress gradient histories. Solid line represents finite elementsimulation results.
C. Periasamy, H.V. Tippur / Engineering Fracture Mechanics 98 (2013) 185–199 197
KI. This is to be expected as the plate experiences compressive stress waves, unlike the dominant tensile stresses at thecrack-tip.
The experiments were again numerically simulated via transient elasto-dynamic finite element analysis of the problem toprovide a complementary set of results to the experimental measurements. The numerical simulation was performed usingABAQUS™/Explicit structural analysis software. The discretized numerical model along with the loading and boundary con-ditions used are shown in Fig. 15. It consisted of 33,574 four-node quadrilateral elements with the smallest element size �0.5 mm. The time steps were allowed to be automatically chosen by the explicit integration scheme. The particle velocity (VT)transmitted from the long-bar into the PMMA specimen was used as the input. The VT history shown as an inset in Fig. 12was calculated using [33],
VT ¼ VI2qICIAI
qICIAI þ qT CT AT; ð18Þ
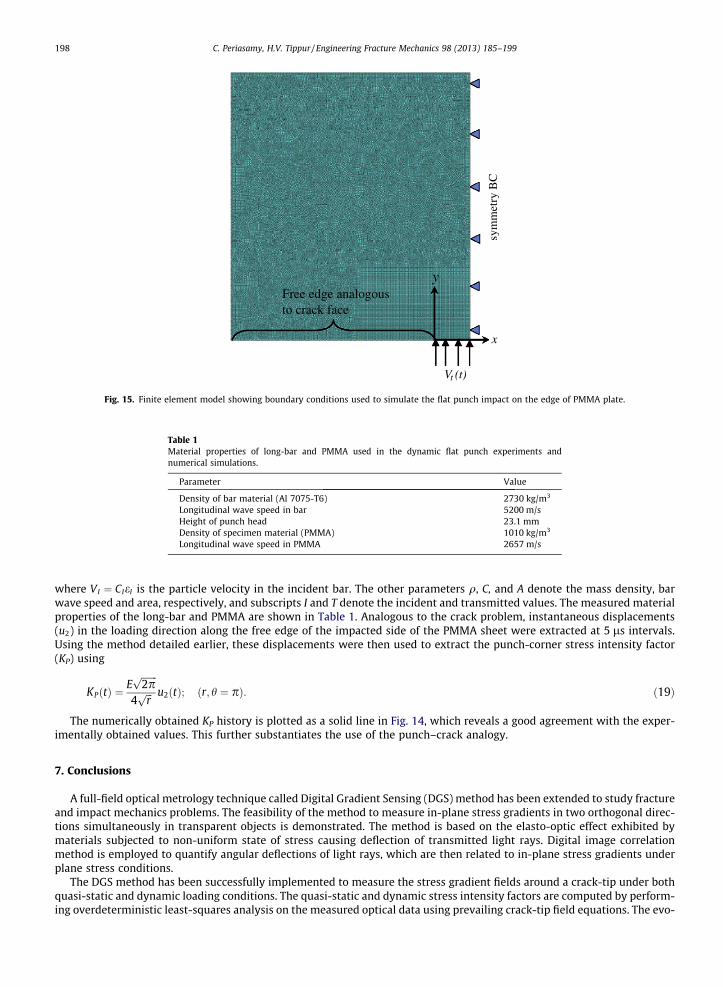
Free edge analogous to crack face
y
Vt (t)
sym
met
ry B
C
x
Fig. 15. Finite element model showing boundary conditions used to simulate the flat punch impact on the edge of PMMA plate.
Table 1Material properties of long-bar and PMMA used in the dynamic flat punch experiments andnumerical simulations.
Parameter Value
Density of bar material (Al 7075-T6) 2730 kg/m3
Longitudinal wave speed in bar 5200 m/sHeight of punch head 23.1 mmDensity of specimen material (PMMA) 1010 kg/m3
Longitudinal wave speed in PMMA 2657 m/s
198 C. Periasamy, H.V. Tippur / Engineering Fracture Mechanics 98 (2013) 185–199
where VI ¼ CIeI is the particle velocity in the incident bar. The other parameters q, C, and A denote the mass density, barwave speed and area, respectively, and subscripts I and T denote the incident and transmitted values. The measured materialproperties of the long-bar and PMMA are shown in Table 1. Analogous to the crack problem, instantaneous displacements(u2) in the loading direction along the free edge of the impacted side of the PMMA sheet were extracted at 5 ls intervals.Using the method detailed earlier, these displacements were then used to extract the punch-corner stress intensity factor(KP) using
KPðtÞ ¼Effiffiffiffiffiffiffi2pp
4ffiffiffirp u2ðtÞ; ðr; h ¼ pÞ: ð19Þ
The numerically obtained KP history is plotted as a solid line in Fig. 14, which reveals a good agreement with the exper-imentally obtained values. This further substantiates the use of the punch–crack analogy.
7. Conclusions
A full-field optical metrology technique called Digital Gradient Sensing (DGS) method has been extended to study fractureand impact mechanics problems. The feasibility of the method to measure in-plane stress gradients in two orthogonal direc-tions simultaneously in transparent objects is demonstrated. The method is based on the elasto-optic effect exhibited bymaterials subjected to non-uniform state of stress causing deflection of transmitted light rays. Digital image correlationmethod is employed to quantify angular deflections of light rays, which are then related to in-plane stress gradients underplane stress conditions.
The DGS method has been successfully implemented to measure the stress gradient fields around a crack-tip under bothquasi-static and dynamic loading conditions. The quasi-static and dynamic stress intensity factors are computed by perform-ing overdeterministic least-squares analysis on the measured optical data using prevailing crack-tip field equations. The evo-
C. Periasamy, H.V. Tippur / Engineering Fracture Mechanics 98 (2013) 185–199 199
lution of static and dynamic stress intensity factor histories are successfully compared with the ones obtained from analyt-ical solutions and finite element simulations. In addition, a good full-field qualitative and quantitative agreement betweenthe measured angular deflection values and the analytical solutions is also seen.
Further, the problem of a flat punch impacting the edge of a planar sheet is experimentally studied and the stress gradientfields around the punch-tip are measured using DGS. Citing the analogy between the problem of a compressively loadeddouble edge crack problem and the square punch problem, the analytical crack-tip angular deflection field equations areused to extract the punch-tip stress intensity factor history from measured deformation fields. The results are again in goodagreement with the numerically obtained punch-tip stress intensity factor history computed using the same analogy but ex-tracted from the crack opening displacements.
Acknowledgments
Partial support for this research through Grants W911NF-08-1-0285, W911NF-12-1-0317 from the U.S. Army ResearchOffice and NSF CMMI-1232821 from the National Science Foundation is gratefully acknowledged.
References
[1] Patel PJ, Gilde GA. Transparent armor materials: needs and requirements. Ceram Trans 2002;134:573–86.[2] Wright SC, Fleck NA, Stronge WJ. Ballistic impact of polycarbonate – an experimental investigation. Int J Impact Engng 1993;13(1):1–20.[3] Kobayashi AS, Mall S. Dynamic fracture toughness of homalite-100. Exp Mech 1978;18(1):11–8.[4] Arakawa K, Mada T, Takahashi K. Experimental analysis of dynamic effects in brittle fracture of PMMA. In: Hwang W, Han KS, editors. Fracture and
strength of solids, Parts 1 and 2 book series: key engineering materials, vol. 183, no. 1; 2000. p. 265–270.[5] Curran DR, Shockey DA, Seaman L. Dynamic fracture criteria for a polycarbonate. J Appl Phys 1973;44(9):4025–38.[6] Dally JW, Barker DB. Dynamic measurements of initiation toughness at high loading rates. Exp Mech 1988;28(3):298–303.[7] Ravichandar K, Knauss WG. An experimental investigation into dynamic fracture: crack initiation and arrest. Int J Fract 1984;25:247–62.[8] Bless S, Chen T. Impact damage in layered glass. Int J Fract 2010;162(1–2):151–8.[9] Subhash G, Haney EJ. Analysis of interacting cracks due to sequential indentations on sapphire. Acta Mater 2011;59(9):3528–36.
[10] Xu LR, Rosakis AJ. Real-time experimental investigation of dynamic crack branching using high-speed optical diagnostics. Exp Tech 2003;27(2):23–6.[11] Park H, Chen W. Experimental investigation on dynamic crack propagating perpendicularly through interface in glass. J Appl Mech Trans ASME
2011;78(5).[12] Dally JW. Dynamic photo-elastic studies of fracture. Exp Mech 1979;19(10):349–61.[13] Parameswaran V, Shukla A. Dynamic fracture of a functionally gradient material having discrete property variation. J Mater Sci 1998;33(13):3303–11.[14] Lee J, Kokaly MT, Kobayashi AS. Dynamic ductile fracture of aluminum SEN specimens an experimental–numerical analysis. Int J Fract 1998;93:39–50.[15] Beinert J, Kalthoff JF. In: Sih GC, editor. Mechanics of fracture, vol. 7. Nijhoff Publishers; 1981. p. 281–328.[16] Zehnder AT, Rosakis AJ. A note on the measurement of K and J under small-scale yielding conditions using the method of caustics. Int J Fract
1986;30(3):R43–8.[17] Tippur HV, Krishnaswamy S, Rosakis AJ. Optical mapping of crack tip deformations using the methods of transmission and reflection coherent gradient
sensing – a study of crack tip K-dominance. Int J Fract 1991;52(2):91–117.[18] Krishnaswamy S, Tippur HV, Rosakis AJ. Measurement of transient crack tip deformation fields using the method of coherent gradient sensing. J Mech
Phys Solids 1992;40(2):339–72.[19] Sutton MA, Orteu U, Schreier H. Image correlation for shape, motion and deformation measurements. Springer; 2009.[20] Kirugulige MS, Tippur HV, Denney TS. Measurement of transient deformations using digital image correlation method and high-speed photography:
application to dynamic fracture. Appl Opt 2007;46(22):5083–96.[21] Kirugulige MS, Tippur HV. Measurement of surface deformations and fracture parameters for a mixed-mode crack driven by stress waves using image
correlation technique and high-speed photography. Strain 2009;45(2):108–22.[22] Reu PL, Miller TJ. The application of high-speed digital image correlation. J Strain Anal Engng Des 2008;43(8):673–88.[23] Periasamy C, Tippur HV. A full-field digital gradient sensing method for evaluating stress gradients in transparent solids. Appl Opt
2012;51(12):2088–97.[24] Dally JW, Riley WF. Experimental stress analysis. 4th ed. College House Enterprises; 2005.[25] Xu L, Tippur HV, Rousseau CE. Measurement of contact stresses using real-time shearing interferometry. Opt Engng 1999;38(11):1932–7.[26] Periasamy C, Tippur HV. Measurement of orthogonal stress gradients due to impact load on a transparent sheet using digital gradient sensing method.
Exp Mech; in press. http://dx.doi.org/10.1007/s11340-012-9653-x.[27] Janssen M, Zuidema J, Wanhill RJH. Fracture mechanics. 2nd ed. VSSD; 2006.[28] Butcher RJ, Rousseau CE, Tippur HV. A functionally graded particulate composite: preparation, measurements and failure analysis. Acta Mater
1998;47(1):259–68.[29] Roessig KM, Mason JJ. Dynamic stress intensity factors in a two dimensional punch test. Engng Fract Mech 1998;60(4):421–35.[30] Chen L, Batra RC. Material instability criterion near a notch-tip under locally adiabatic deformations of thermoviscoplastic materials. Theoret Appl
Fract Mech 1998;30:153–8.[31] Rubio-Gonzalez C, Mason JJ. Experimental investigation of dynamic punch tests on isotropic and composite materials. Exp Mech 1999;41(2):129–39.[32] Periasamy C, Jhaver R, Tippur HV. Quasi-static and dynamic compression response of a lightweight interpenetrating phase composite foam. Mater Sci
Engng-A 2010;527(12):2845–56.[33] Meyers M. Dynamic behavior of materials. John Wiley & Sons, Inc.; 1994. p. 305–307.