Embed Size (px)
Citation preview
Low Carbon Society Scenario Toward 2050
INDONESIA Energy Sector
October, 2010
Institut Teknologi Bandung (ITB) - Indonesia
Institute for Global Environmental Strategies (IGES) - Japan
Kyoto University - Japan
National Institute for Environmental Studies (NIES) - Japan
Mizuho Information & Research Institute - Japan
NIESNIES
Authors
Dr. Retno Gumilang Dewi ITB - Indonesia
Dr. Takuro Kobashi
IGES - Japan
Prof. Dr. Yuzuru Matsuoka Dr. Kei Gomi
Kyoto University - Japan
Dr. Tomoki Ehara Mizuho - Japan
Dr. Mikiko Kainuma Dr. Junichiro Fujino
NIES - Japan
i
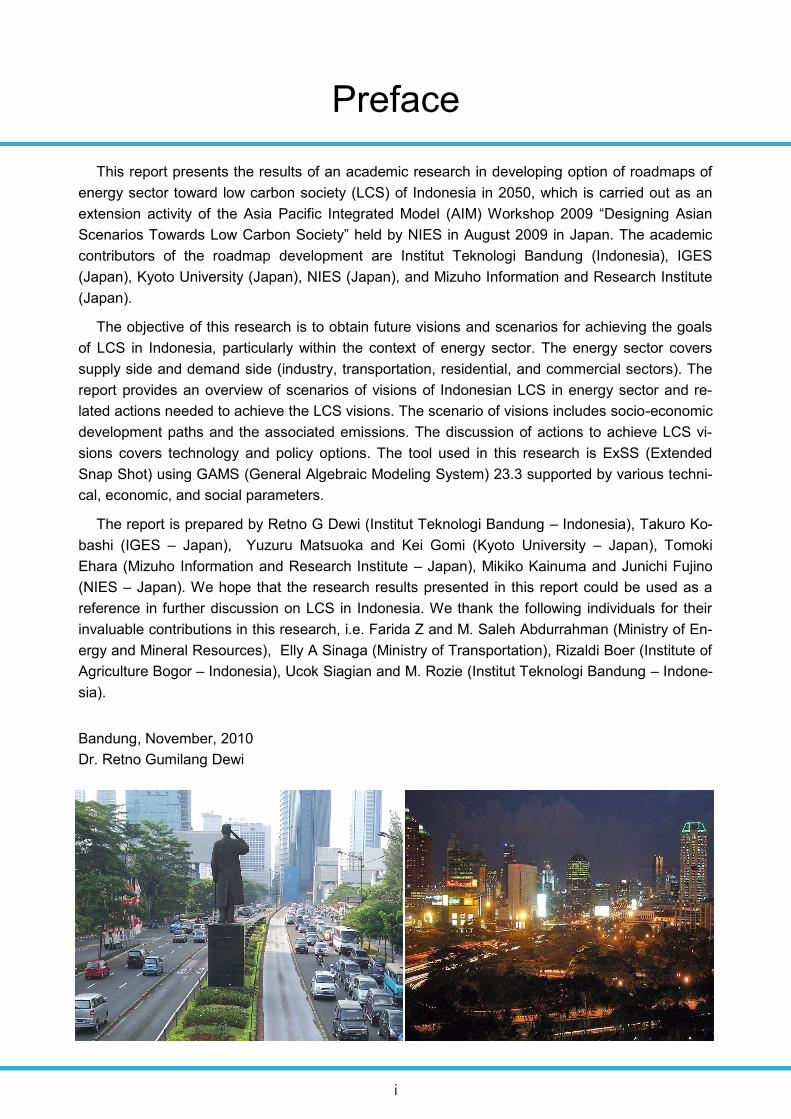
Preface
This report presents the results of an academic research in developing option of roadmaps of
energy sector toward low carbon society (LCS) of Indonesia in 2050, which is carried out as an
extension activity of the Asia Pacific Integrated Model (AIM) Workshop 2009 “Designing Asian
Scenarios Towards Low Carbon Society” held by NIES in August 2009 in Japan. The academic
contributors of the roadmap development are Institut Teknologi Bandung (Indonesia), IGES
(Japan), Kyoto University (Japan), NIES (Japan), and Mizuho Information and Research Institute
(Japan).
The objective of this research is to obtain future visions and scenarios for achieving the goals
of LCS in Indonesia, particularly within the context of energy sector. The energy sector covers
supply side and demand side (industry, transportation, residential, and commercial sectors). The
report provides an overview of scenarios of visions of Indonesian LCS in energy sector and re-
lated actions needed to achieve the LCS visions. The scenario of visions includes socio-economic
development paths and the associated emissions. The discussion of actions to achieve LCS vi-
sions covers technology and policy options. The tool used in this research is ExSS (Extended
Snap Shot) using GAMS (General Algebraic Modeling System) 23.3 supported by various techni-
cal, economic, and social parameters.
The report is prepared by Retno G Dewi (Institut Teknologi Bandung – Indonesia), Takuro Ko-
bashi (IGES – Japan), Yuzuru Matsuoka and Kei Gomi (Kyoto University – Japan), Tomoki
Ehara (Mizuho Information and Research Institute – Japan), Mikiko Kainuma and Junichi Fujino
(NIES – Japan). We hope that the research results presented in this report could be used as a
reference in further discussion on LCS in Indonesia. We thank the following individuals for their
invaluable contributions in this research, i.e. Farida Z and M. Saleh Abdurrahman (Ministry of En-
ergy and Mineral Resources), Elly A Sinaga (Ministry of Transportation), Rizaldi Boer (Institute of
Agriculture Bogor – Indonesia), Ucok Siagian and M. Rozie (Institut Teknologi Bandung – Indone-
sia).
Bandung, November, 2010
Dr. Retno Gumilang Dewi
ii
AIM Asia Pacific Integrated Model
BAU Business as Usual
BPS Biro Pusat Statistik (National Statistical Bureau)
CCS Carbon Capture and Storage
CM1 Counter Measure 1
CM2 Counter Measure 2
CNG Compressed Natural Gas
ExSS Extended Snap Shot
GAMS General Algebraic Modeling System
GHG Green House Gas Emissions
GOI Government of Indonesia
IGCC Integrated Gasification Combined Cycle
IGES Institute for Global Environmental Strategies
LPG Liquefied Petroleum Gas
LCS Loc Carbon Society
MMBOE Million Barrels of Oil Equivalent
MEMR Ministry of Energy and Mineral Resources
NIES National Institute for Environmental Studies
PLN National Electric Utility
PUSDATIN Pusat Data dan Informasi (Center for Data and Information) - Ministry of Energy and Mineral Resources
RUPTL PLN Rencana Umum Pengembangan Tenaga Listrik (General Plan of The Develop-ment of Electric Power)
Toe Ton oil equivalent
Rp. Rupiah
Abbreviations
iii
Table of Contents
Preface i
Abbreviation ii
Table of Contents iii
Executive Summary iv
Background 1
Socio-economic Scenario 3
GHG Emissions and Reductions 6
Five Actions Towards LCS 9
Research Methodology 15
Statistical Data Collection and Estimation 17
page
iv
Executive Summary
Low Carbon Society (LCS) is relatively new con-
cept in Indonesia. Currently, there is no official docu-
ment containing roadmaps to achieve LCS target.
However, there are several government initiatives that
are in line with and supportive to the LCS concept.
This report presents the results of an academic re-
search assessing scenarios of LCS visions 2050 in
Indonesia especially in energy sector and associated
actions and policies to achieve the LCS visions.
Three scenarios are developed to envision Indone-
sian development paths related to LCS including socio
economic, energy, and associated carbon emissions.
The first scenario is designated as business as usual
(BAU) scenario, which assumes that the current devel-
opment trend and society orientation will continue until
2050. What is meant by orientation is peoples‟ life-
styles and activities that has implication to the genera-
tion of CO2 emissions.
The second scenario is designated as Counter-
measure 1 (CM1), which assumes that economic de-
velopment will be the same as BAU but the society is
more efficient in energy utilizations compared to the
BAU. The society is depicted as calmer, slower, and
nature oriented. This scenario is regarded as moder-
ate development path.
The third scenario is designated as Countermea-
sures 2 (CM2), which assumes that Indonesian econ-
omy will grow at much higher rate compared to those
of the BAU but more efficient and less carbon energy
systems. In addition, the scenario assumes that Indo-
nesia is to reduce significant emission to comply with
world‟s LCS target (0.5 ton-C per capita) in 2050. In
this scenario, the society is depicted as more active,
quick changing, and technology oriented. This sce-
nario is regarded as high development path.
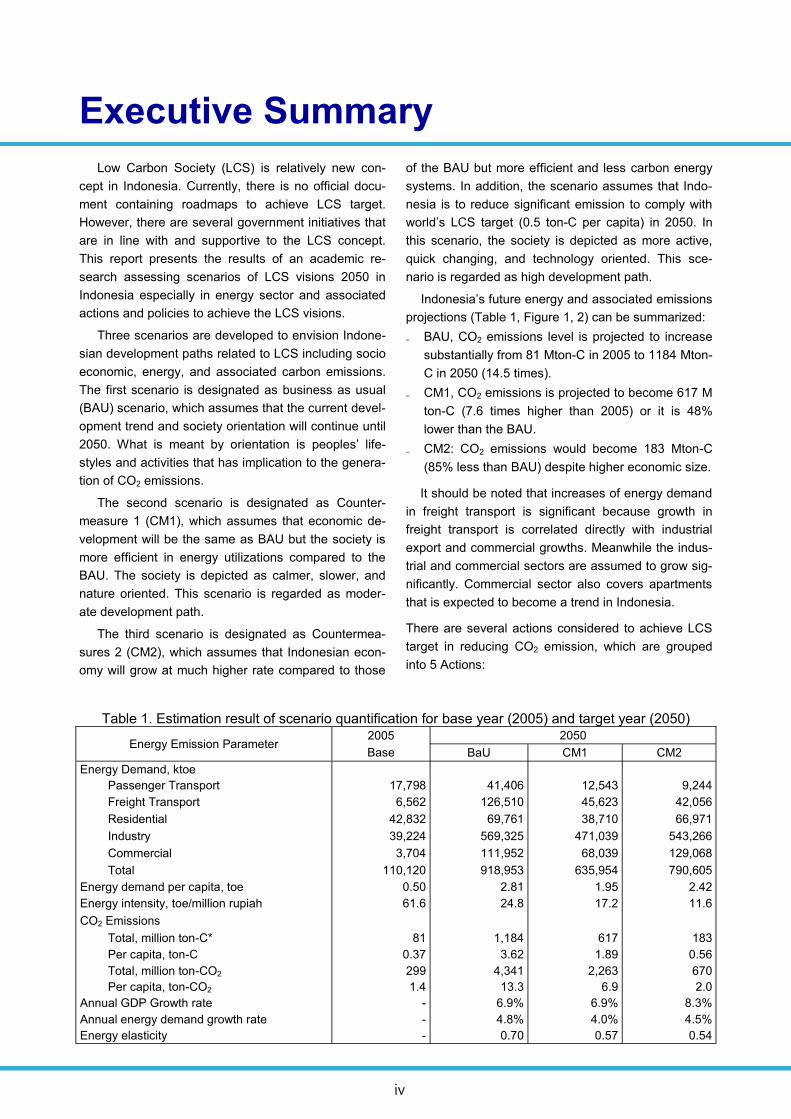
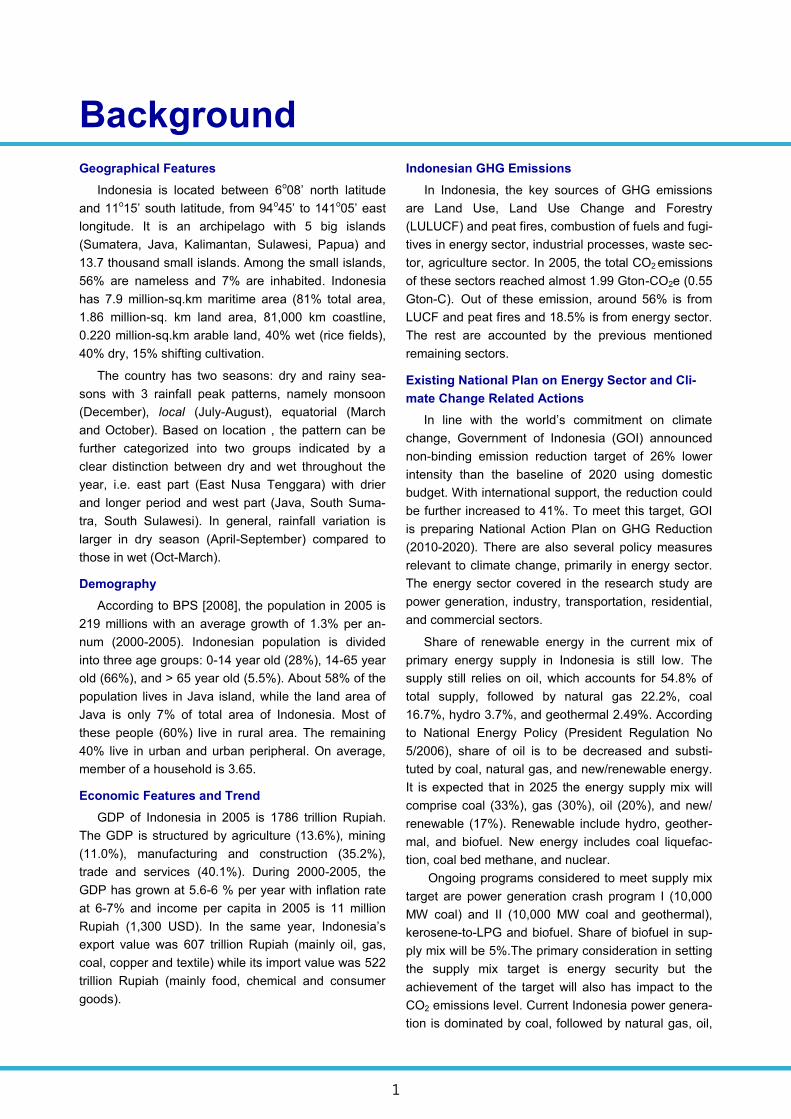
Indonesia‟s future energy and associated emissions
projections (Table 1, Figure 1, 2) can be summarized:
₋ BAU, CO2 emissions level is projected to increase
substantially from 81 Mton-C in 2005 to 1184 Mton-
C in 2050 (14.5 times).
₋ CM1, CO2 emissions is projected to become 617 M
ton-C (7.6 times higher than 2005) or it is 48%
lower than the BAU.
₋ CM2: CO2 emissions would become 183 Mton-C
(85% less than BAU) despite higher economic size.
It should be noted that increases of energy demand
in freight transport is significant because growth in
freight transport is correlated directly with industrial
export and commercial growths. Meanwhile the indus-
trial and commercial sectors are assumed to grow sig-
nificantly. Commercial sector also covers apartments
that is expected to become a trend in Indonesia.
There are several actions considered to achieve LCS
target in reducing CO2 emission, which are grouped
into 5 Actions:
Table 1. Estimation result of scenario quantification for base year (2005) and target year (2050)
Energy Emission Parameter 2005 2050
Base BaU CM1 CM2
Energy Demand, ktoe
Passenger Transport 17,798 41,406 12,543 9,244
Freight Transport 6,562 126,510 45,623 42,056
Residential 42,832 69,761 38,710 66,971
Industry 39,224 569,325 471,039 543,266
Commercial 3,704 111,952 68,039 129,068
Total 110,120 918,953 635,954 790,605
Energy demand per capita, toe 0.50 2.81 1.95 2.42
Energy intensity, toe/million rupiah 61.6 24.8 17.2 11.6
CO2 Emissions
Total, million ton-C* 81 1,184 617 183
Per capita, ton-C 0.37 3.62 1.89 0.56
Total, million ton-CO2 299 4,341 2,263 670
Per capita, ton-CO2 1.4 13.3 6.9 2.0
Annual GDP Growth rate - 6.9% 6.9% 8.3%
Annual energy demand growth rate - 4.8% 4.0% 4.5%
Energy elasticity - 0.70 0.57 0.54
v
(1) Introducing Clean Energy: utilization of renew-
able and less carbon emitting energy types and
technology in residential/commercial sector;
(2) Low Carbon Lifestyle: efficiency improvement
through appliances technology and society behav-
ior in residential/commercial sector;
(3) Low Carbon Electricity: more renewable energy,
efficient power generation (pulverized to sub-
critical, supercritical, and integrated gasification
combined cycle (IGCC) equipped with carbon cap-
ture and storage (CCS), and decreasing losses in
T&D of electricity grids;
(4) Low Carbon Fuels in Industry: energy shift
(toward renewable and less carbon emitting fuels),
efficiency improvement of industrial processes,
equipments, and appliances;
(5) Sustainable transport: transport modal shift (more
mass rapid transport utilization), fuel shift (to re-
newable and less carbon emitting fuels), reducing
trip generation and trip distance (improvement of
infrastructure, telecommunication, and information
access), traffic management, efficiency improve-
ment of vehicles.
There are numerous energy-climate policy initia-
tives, regulations, and actions in energy sector that
could result in CO2 emission reduction. The latest pol-
icy initiative is non-binding emission reduction target of
26% lower than baseline in 2020 using domestic
budget and further increased to 41% with international
support. To implement non-binding commitment, GOI
prepares National Actions Plan 2010 -2020 to Reduce
CO2 Emissions. In addition to the policy initiatives,
most of the actions above will still need policy meas-
ures to support the implementations of these actions,
i.e.:
(1) Increasing share of new/renewable energy and
less carbon emitting fuels (include less carbon
emitting technology) in energy supply mix to sup-
port implementation of Presidential Regulation
5/2006. On-going programs considered to meet
energy supply mix target are power generation
crash program I and II (which include clean coal
and geothermal), kerosene to LPG, mandatory
biofuel in power plant, transportation, industry
(MEMR 32/2008) ;
(2) Increasing share of new/renewable (hydro, geo-
thermal) and oil switch to natural gas as stated in
the National Plan of Electricity Development
(RUPTL) PLN 2008 - 2018;
(3) Regulations that lead to the formulation of national
master plan on energy efficiency;
(4) Policies to support MRT (mass rapid transit) devel-
opment, diversification of fuels (CNG/LPG, biofuel,
electricity) in transportation, and emissions moni-
toring and control of local emission and combus-
tion efficiency that has implication to the CO2 emis-
sions.
Figure 1. CO2 emission by energy demand sector Figure 2. CO2 emission per capita
0
200
400
600
800
1,000
1,200
1,400
2005 Base 2050 BAU 2050 CM1 2050 CM2
mill
ion
to
n-C
Passenger transport
Freight transport
Residential
Commercial
Industry
1.4
13.3
6.9
2.0
0
2
4
6
8
10
12
14
2005 Base 2050 BAU 2050 CM1 2050 CM2
Pe
r cap
ita e
mis
sio
ns (
ton
-CO
2)
1
Background Geographical Features
Indonesia is located between 6o08‟ north latitude
and 11o15‟ south latitude, from 94o45‟ to 141o05‟ east
longitude. It is an archipelago with 5 big islands
(Sumatera, Java, Kalimantan, Sulawesi, Papua) and
13.7 thousand small islands. Among the small islands,
56% are nameless and 7% are inhabited. Indonesia
has 7.9 million-sq.km maritime area (81% total area,
1.86 million-sq. km land area, 81,000 km coastline,
0.220 million-sq.km arable land, 40% wet (rice fields),
40% dry, 15% shifting cultivation.
The country has two seasons: dry and rainy sea-
sons with 3 rainfall peak patterns, namely monsoon
(December), local (July-August), equatorial (March
and October). Based on location , the pattern can be
further categorized into two groups indicated by a
clear distinction between dry and wet throughout the
year, i.e. east part (East Nusa Tenggara) with drier
and longer period and west part (Java, South Suma-
tra, South Sulawesi). In general, rainfall variation is
larger in dry season (April-September) compared to
those in wet (Oct-March).
Demography
According to BPS [2008], the population in 2005 is
219 millions with an average growth of 1.3% per an-
num (2000-2005). Indonesian population is divided
into three age groups: 0-14 year old (28%), 14-65 year
old (66%), and > 65 year old (5.5%). About 58% of the
population lives in Java island, while the land area of
Java is only 7% of total area of Indonesia. Most of
these people (60%) live in rural area. The remaining
40% live in urban and urban peripheral. On average,
member of a household is 3.65.
Economic Features and Trend
GDP of Indonesia in 2005 is 1786 trillion Rupiah.
The GDP is structured by agriculture (13.6%), mining
(11.0%), manufacturing and construction (35.2%),
trade and services (40.1%). During 2000-2005, the
GDP has grown at 5.6-6 % per year with inflation rate
at 6-7% and income per capita in 2005 is 11 million
Rupiah (1,300 USD). In the same year, Indonesia‟s
export value was 607 trillion Rupiah (mainly oil, gas,
coal, copper and textile) while its import value was 522
trillion Rupiah (mainly food, chemical and consumer
goods).
Indonesian GHG Emissions
In Indonesia, the key sources of GHG emissions
are Land Use, Land Use Change and Forestry
(LULUCF) and peat fires, combustion of fuels and fugi-
tives in energy sector, industrial processes, waste sec-
tor, agriculture sector. In 2005, the total CO2 emissions
of these sectors reached almost 1.99 Gton-CO2e (0.55
Gton-C). Out of these emission, around 56% is from
LUCF and peat fires and 18.5% is from energy sector.
The rest are accounted by the previous mentioned
remaining sectors.
Existing National Plan on Energy Sector and Cli-
mate Change Related Actions
In line with the world‟s commitment on climate
change, Government of Indonesia (GOI) announced
non-binding emission reduction target of 26% lower
intensity than the baseline of 2020 using domestic
budget. With international support, the reduction could
be further increased to 41%. To meet this target, GOI
is preparing National Action Plan on GHG Reduction
(2010-2020). There are also several policy measures
relevant to climate change, primarily in energy sector.
The energy sector covered in the research study are
power generation, industry, transportation, residential,
and commercial sectors.
Share of renewable energy in the current mix of
primary energy supply in Indonesia is still low. The
supply still relies on oil, which accounts for 54.8% of
total supply, followed by natural gas 22.2%, coal
16.7%, hydro 3.7%, and geothermal 2.49%. According
to National Energy Policy (President Regulation No
5/2006), share of oil is to be decreased and substi-
tuted by coal, natural gas, and new/renewable energy.
It is expected that in 2025 the energy supply mix will
comprise coal (33%), gas (30%), oil (20%), and new/
renewable (17%). Renewable include hydro, geother-
mal, and biofuel. New energy includes coal liquefac-
tion, coal bed methane, and nuclear.
Ongoing programs considered to meet supply mix
target are power generation crash program I (10,000
MW coal) and II (10,000 MW coal and geothermal),
kerosene-to-LPG and biofuel. Share of biofuel in sup-
ply mix will be 5%.The primary consideration in setting
the supply mix target is energy security but the
achievement of the target will also has impact to the
CO2 emissions level. Current Indonesia power genera-
tion is dominated by coal, followed by natural gas, oil,

2
and renewable. The fuel mix composition of power
generation are coal 40.7%, oil 30.6%, natural gas
5.1%, hydro 8.4%, and geothermal 5.2% (2005). The
share of other renewable energy is not significant. To
achieve renewable energy target in the supply mix,
GOI has passed several regulations, one of them is
mandatory biofuel utilization in transportation, power
generation, industry (MEMR -32/2008).
The fuel mix in power plant is expected to change
in the future. According to national electricity genera-
tion plan 2008–2018 of State Electricity Enterprises
(RUPTL PLN), the fuel mix in 2018 will become coal
63%, oil 2%, natural gas 17%, hydro 6%, wind 12%,
and biomass 1%. After 2018, the fuel mix will be differ-
ent, where the dominant fuel to be used in power plant
is natural gas. Based on Blueprint National Energy
Management Plan 2009, the fuel mix in power sector
(2025) is as follows: gas 48% followed by coal 36%, oil
3%, geothermal 8%, and hydro 5%.
Energy conservation program is formally stated in
Energy Law 30/2007, Presidential Regulation 5/2006
Presidential Instruction 10/2005, Ministerial Regulation
031/2005. These regulations lead to the formulation of
national master plan on energy conservation, which
state that there is 15-30% reduction potential. Based
on Presidential Regulation, energy conservation is to
be implemented so that in 2025 the energy elasticity
(energy growth divided by GDP growth) will become
less than 1.
There are several actions in transportation sector
relevant to energy and climate change are to be imple-
mented in Jakarta and other big cities, i.e. decreasing
of traffic jam through the reduction of private vehicles
by development of MRT (mass rapid transit) or BRT
(bus rapid transit) in 6 cities, development of several
new toll roads, application of transport demand man-
agement, electronic road pricing, and intelligent trans-
port system. Other actions to be implemented are di-
versification of fuels such as CNG and LPG for taxi
and bus-ways, biofuel for public as well as private car,
and in the future, those are development of fuel cell,
methanol and electricity in transportation. In addition,
GOI implements emissions monitoring in transporta-
tion (mobile source) and industrial flue gas (stationery
source) to control local emission as well as combus-
tion efficiency in accordance to GHG emission.
Context of LCS scenario
During 2000-2005, GHG emissions in energy sec-
tor increased from 50.5 million ton-C (2000) to 67 mil-
lion ton-C (2005). At this level, energy sector is the
second contributor of national GHG emission after
forestry and peat fires. On average, level of country‟s
emission increased 5.9 % per year (2000-2005).
Concerning the CO2 emission/capita, energy sector
contributed 0.37 ton-C (1.4 ton-CO2) per capita in
2005. Key sources of CO2 emission are fuel combus-
tions (90.3%) and fugitives from flaring/venting in oil
and gas production facilities (9.7%). In fuel combustion
activities, 33.2% of CO2 emissions is accounted by
energy transformation and losses in power generation
and oil and gas processing, 25% manufacturing,
22.4% transportation, 15% residential and commercial,
4.3% agriculture, mining, construction.
LCS is a relatively new concept for Indonesia. All
the above mentioned government action plans are not
developed as roadmap to achieve Low Carbon Society
(LCS) target of the country. However, all those action
plans actually are in line with and supportive to the
LCS concept.
In this report, a scenario of energy sector in Indo-
nesia towards LCS was developed. The objective is to
describe future visions for achieving the goals of LCS.
In developing the roadmap, there are 5 important
steps:
- Depicting socio economic visions of Indonesia to-
ward 2050;
- Estimating current energy service demand-supply
and resulting CO2 emission that cover quantifying
society behavior on energy utilization, analyzing the
impact of city and transport infrastructure (include
travel behavior) and industrial structure to energy
consumption and resulting CO2 emission;
- Exploring innovations for energy demand-supply;
- Estimating energy service demand and supply in
BAU and two countemeasure scenarios and the
amount of resulting CO2 emissions; and
- Analysis of domestic potential to achieve energy-
related CO2 emission reduction.
3
Socio-economic scenarios in 2050
Depictive Scenario
Three scenarios are used to figure the direction of
future socio economic visions for achieving LCS goals
toward 2050, i.e. BAU (business as usual) and two
countermeasure (CM) scenarios. BAU assumes that
the existing society orientation will continue until 2050.
The two countermeasures assume that there will be
changes in society orientation in the future.
The CM1, which is regarded as a moderate sce-
nario, assumes that the society behavior is depicted
as calmer, slower, and nature oriented ones. The CM2
that is regarded as high growth scenario, assumes
that the society is depicted as more active, quick
changing, and technology oriented. This scenario has
two long-term objectives, i.e. „realizing full socio-
economic potential of the country‟ and „creating a sus-
tainable LCS.
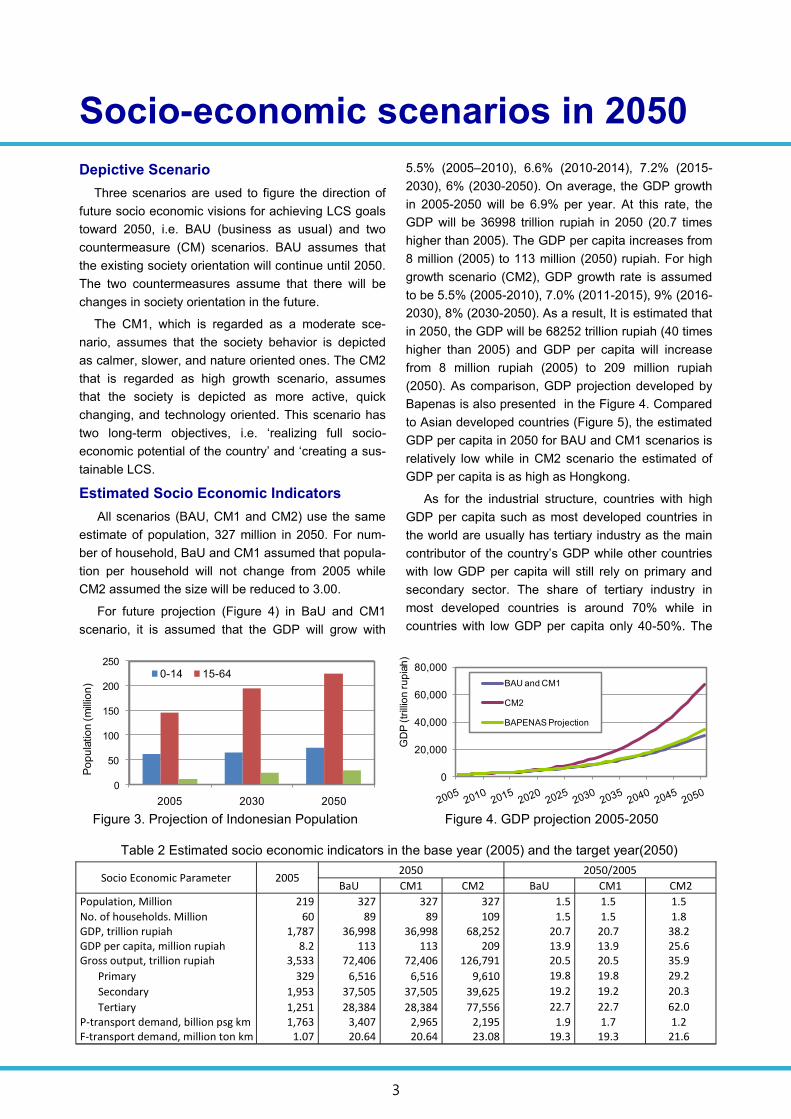
Estimated Socio Economic Indicators
All scenarios (BAU, CM1 and CM2) use the same
estimate of population, 327 million in 2050. For num-
ber of household, BaU and CM1 assumed that popula-
tion per household will not change from 2005 while
CM2 assumed the size will be reduced to 3.00.
For future projection (Figure 4) in BaU and CM1
scenario, it is assumed that the GDP will grow with
5.5% (2005–2010), 6.6% (2010-2014), 7.2% (2015-
2030), 6% (2030-2050). On average, the GDP growth
in 2005-2050 will be 6.9% per year. At this rate, the
GDP will be 36998 trillion rupiah in 2050 (20.7 times
higher than 2005). The GDP per capita increases from
8 million (2005) to 113 million (2050) rupiah. For high
growth scenario (CM2), GDP growth rate is assumed
to be 5.5% (2005-2010), 7.0% (2011-2015), 9% (2016-
2030), 8% (2030-2050). As a result, It is estimated that
in 2050, the GDP will be 68252 trillion rupiah (40 times
higher than 2005) and GDP per capita will increase
from 8 million rupiah (2005) to 209 million rupiah
(2050). As comparison, GDP projection developed by
Bapenas is also presented in the Figure 4. Compared
to Asian developed countries (Figure 5), the estimated
GDP per capita in 2050 for BAU and CM1 scenarios is
relatively low while in CM2 scenario the estimated of
GDP per capita is as high as Hongkong.
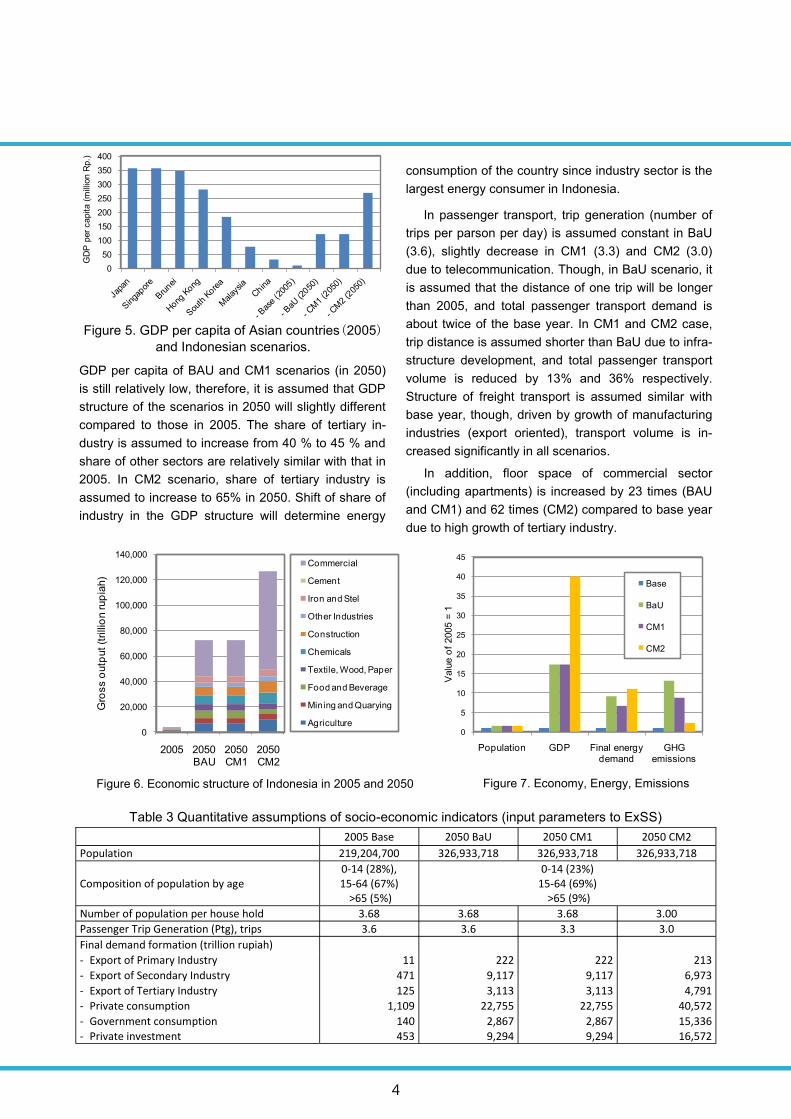
As for the industrial structure, countries with high
GDP per capita such as most developed countries in
the world are usually has tertiary industry as the main
contributor of the country‟s GDP while other countries
with low GDP per capita will still rely on primary and
secondary sector. The share of tertiary industry in
most developed countries is around 70% while in
countries with low GDP per capita only 40-50%. The
Table 2 Estimated socio economic indicators in the base year (2005) and the target year(2050)
Figure 3. Projection of Indonesian Population Figure 4. GDP projection 2005-2050
Socio Economic Parameter 2005 2050 2050/2005
BaU CM1 CM2 BaU CM1 CM2
Population, Million 219 327 327 327 1.5 1.5 1.5
No. of households. Million 60 89 89 109 1.5 1.5 1.8 GDP, trillion rupiah 1,787 36,998 36,998 68,252 20.7 20.7 38.2 GDP per capita, million rupiah 8.2 113 113 209 13.9 13.9 25.6 Gross output, trillion rupiah 3,533 72,406 72,406 126,791 20.5 20.5 35.9
Primary 329 6,516 6,516 9,610 19.8 19.8 29.2
Secondary 1,953 37,505 37,505 39,625 19.2 19.2 20.3
Tertiary 1,251 28,384 28,384 77,556 22.7 22.7 62.0
P-transport demand, billion psg km 1,763 3,407 2,965 2,195 1.9 1.7 1.2 F-transport demand, million ton km 1.07 20.64 20.64 23.08 19.3 19.3 21.6
0
50
100
150
200
250
2005 2030 2050
Po
pu
latio
n (
mill
ion
)
0-14 15-64
0
20,000
40,000
60,000
80,000
GD
P (
trill
ion
ru
pia
h)
BAU and CM1
CM2
BAPENAS Projection
4
GDP per capita of BAU and CM1 scenarios (in 2050)
is still relatively low, therefore, it is assumed that GDP
structure of the scenarios in 2050 will slightly different
compared to those in 2005. The share of tertiary in-
dustry is assumed to increase from 40 % to 45 % and
share of other sectors are relatively similar with that in
2005. In CM2 scenario, share of tertiary industry is
assumed to increase to 65% in 2050. Shift of share of
industry in the GDP structure will determine energy
consumption of the country since industry sector is the
largest energy consumer in Indonesia.
In passenger transport, trip generation (number of
trips per parson per day) is assumed constant in BaU
(3.6), slightly decrease in CM1 (3.3) and CM2 (3.0)
due to telecommunication. Though, in BaU scenario, it
is assumed that the distance of one trip will be longer
than 2005, and total passenger transport demand is
about twice of the base year. In CM1 and CM2 case,
trip distance is assumed shorter than BaU due to infra-
structure development, and total passenger transport
volume is reduced by 13% and 36% respectively.
Structure of freight transport is assumed similar with
base year, though, driven by growth of manufacturing
industries (export oriented), transport volume is in-
creased significantly in all scenarios.
In addition, floor space of commercial sector
(including apartments) is increased by 23 times (BAU
and CM1) and 62 times (CM2) compared to base year
due to high growth of tertiary industry.
Figure 6. Economic structure of Indonesia in 2005 and 2050 Figure 7. Economy, Energy, Emissions
Table 3 Quantitative assumptions of socio-economic indicators (input parameters to ExSS)
2005 Base 2050 BaU 2050 CM1 2050 CM2
Population 219,204,700 326,933,718 326,933,718 326,933,718
Composition of population by age 0-14 (28%), 15-64 (67%)
>65 (5%)
0-14 (23%) 15-64 (69%)
>65 (9%)
Number of population per house hold 3.68 3.68 3.68 3.00
Passenger Trip Generation (Ptg), trips 3.6 3.6 3.3 3.0
Final demand formation (trillion rupiah)
- Export of Primary Industry 11 222 222 213
- Export of Secondary Industry 471 9,117 9,117 6,973
- Export of Tertiary Industry 125 3,113 3,113 4,791
- Private consumption 1,109 22,755 22,755 40,572
- Government consumption 140 2,867 2,867 15,336
- Private investment 453 9,294 9,294 16,572
0
5
10
15
20
25
30
35
40
45
Population GDP Final energy demand
GHG emissions
Valu
e o
f 2005 =
1
Base
BaU
CM1
CM2
0
50
100
150
200
250
300
350
400
Japa
n
Singa
pore
Bru
nei
Hong
Kong
Sou
th K
orea
Malay
sia
Chin
a
- Bas
e (200
5)
- BaU
(2050
)
- CM
1 (2
050)
- CM
2 (2
050)
GD
P p
er
capita (
mill
ion R
p.)
Figure 5. GDP per capita of Asian countries(2005)
and Indonesian scenarios.
0
20,000
40,000
60,000
80,000
100,000
120,000
140,000
2005 2050BAU
2050CM1
2050CM2
Gro
ss o
utp
ut (t
rilli
on rup
iah)
Commercial
Cement
Iron and Stel
Other Industries
Construction
Chemicals
Textile, Wood, Paper
Food and Beverage
Mining and Quarying
Agriculture
5
GHG emissions & reductions
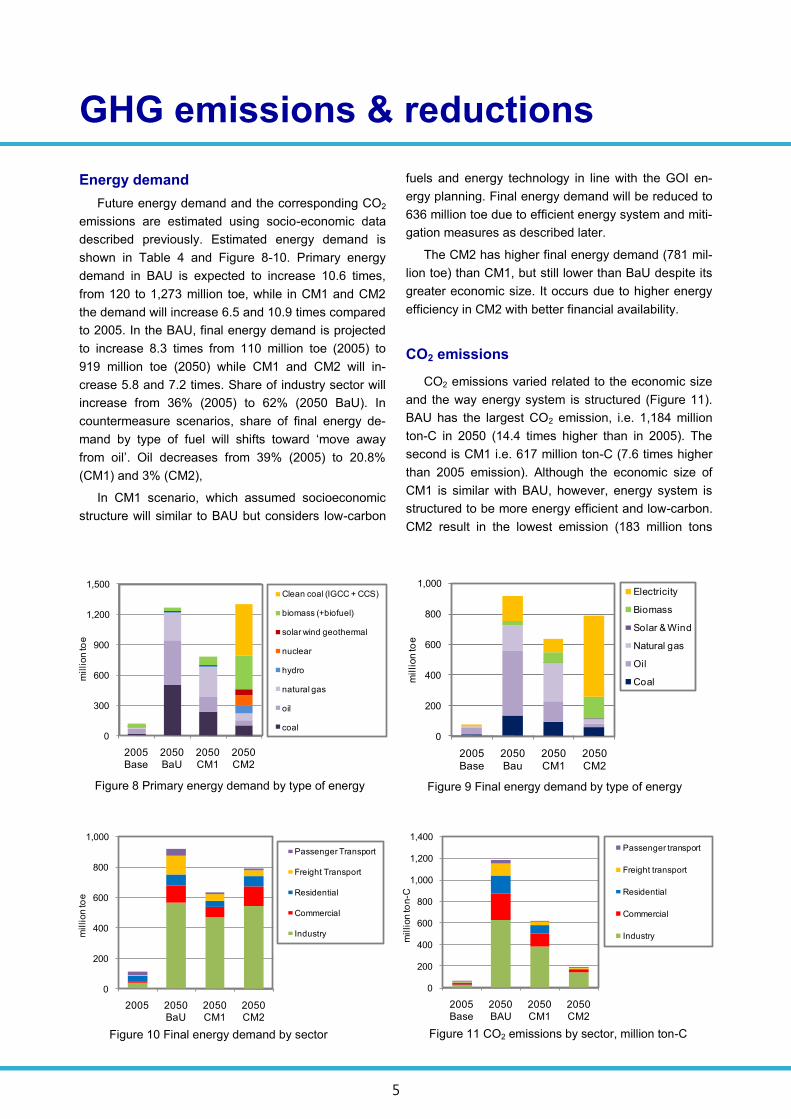
Energy demand
Future energy demand and the corresponding CO2
emissions are estimated using socio-economic data
described previously. Estimated energy demand is
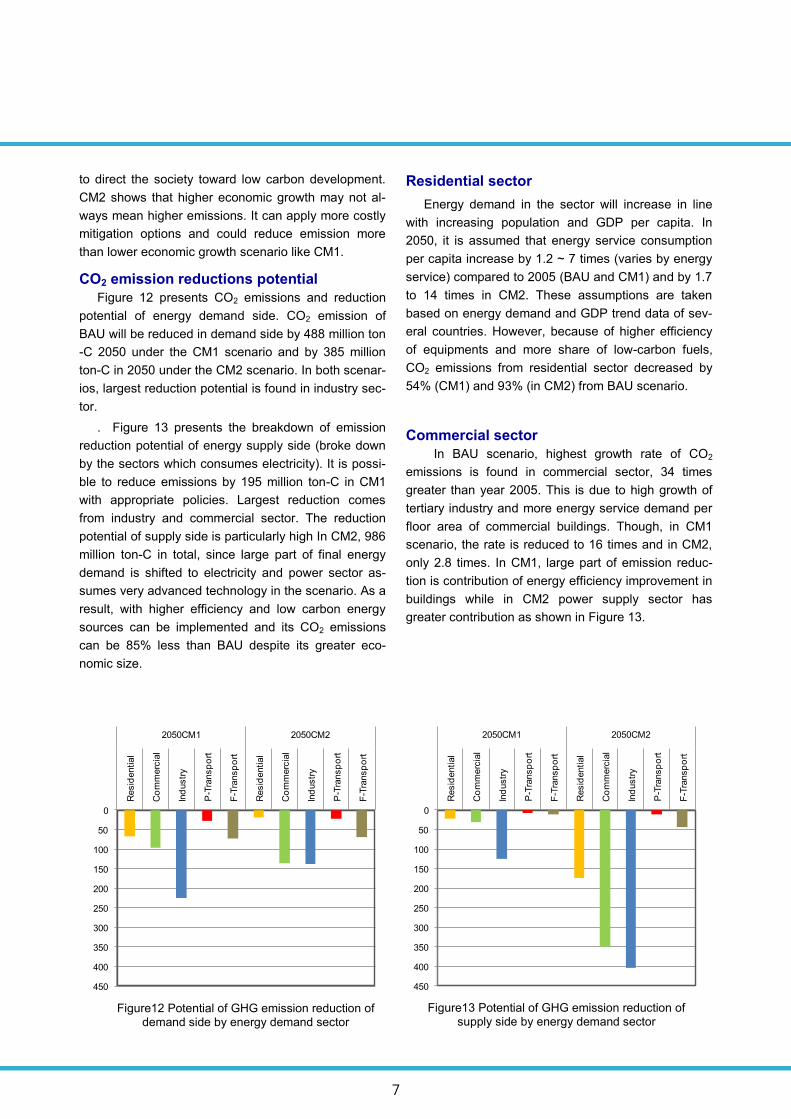
shown in Table 4 and Figure 8-10. Primary energy
demand in BAU is expected to increase 10.6 times,
from 120 to 1,273 million toe, while in CM1 and CM2
the demand will increase 6.5 and 10.9 times compared
to 2005. In the BAU, final energy demand is projected
to increase 8.3 times from 110 million toe (2005) to
919 million toe (2050) while CM1 and CM2 will in-
crease 5.8 and 7.2 times. Share of industry sector will
increase from 36% (2005) to 62% (2050 BaU). In
countermeasure scenarios, share of final energy de-
mand by type of fuel will shifts toward „move away
from oil‟. Oil decreases from 39% (2005) to 20.8%
(CM1) and 3% (CM2),
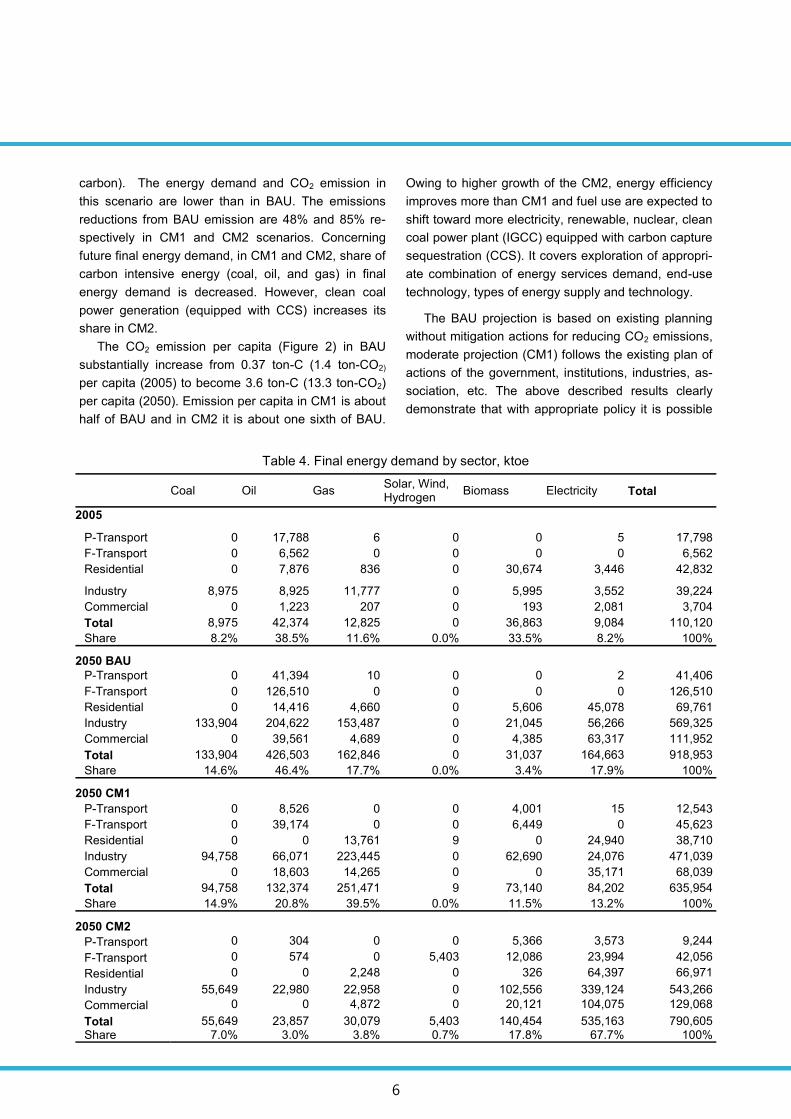
In CM1 scenario, which assumed socioeconomic
structure will similar to BAU but considers low-carbon
fuels and energy technology in line with the GOI en-
ergy planning. Final energy demand will be reduced to
636 million toe due to efficient energy system and miti-
gation measures as described later.
The CM2 has higher final energy demand (781 mil-
lion toe) than CM1, but still lower than BaU despite its
greater economic size. It occurs due to higher energy
efficiency in CM2 with better financial availability.
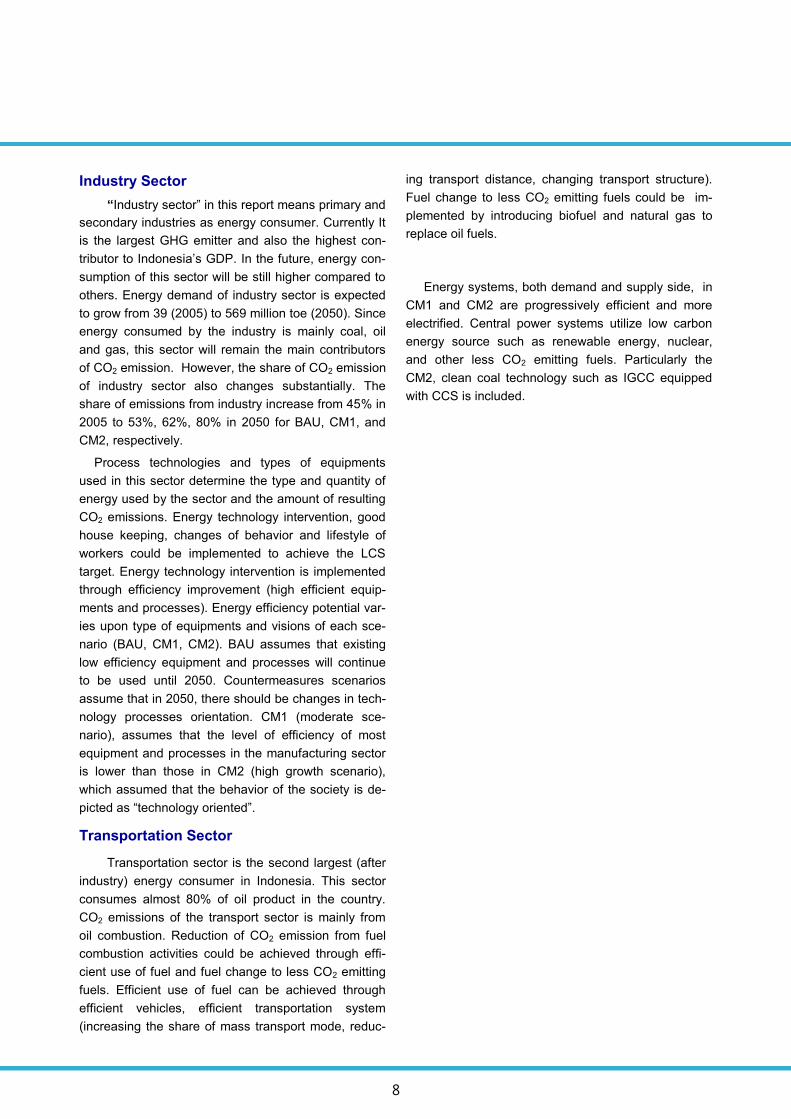
CO2 emissions
CO2 emissions varied related to the economic size
and the way energy system is structured (Figure 11).
BAU has the largest CO2 emission, i.e. 1,184 million
ton-C in 2050 (14.4 times higher than in 2005). The
second is CM1 i.e. 617 million ton-C (7.6 times higher
than 2005 emission). Although the economic size of
CM1 is similar with BAU, however, energy system is
structured to be more energy efficient and low-carbon.
CM2 result in the lowest emission (183 million tons
Figure 8 Primary energy demand by type of energy
Figure 10 Final energy demand by sector Figure 11 CO2 emissions by sector, million ton-C
Figure 9 Final energy demand by type of energy
0
200
400
600
800
1,000
1,200
1,400
2005 Base
2050 BAU
2050 CM1
2050 CM2
million to
n-C
Passenger transport
Freight transport
Residential
Commercial
Industry
0
300
600
900
1,200
1,500
2005 Base
2050 BaU
2050 CM1
2050 CM2
million to
e
Clean coal (IGCC + CCS)
biomass (+biofuel)
solar wind geothermal
nuclear
hydro
natural gas
oil
coal0
200
400
600
800
1,000
2005 Base
2050 Bau
2050 CM1
2050 CM2
million to
e
Electricity
Biomass
Solar & Wind
Natural gas
Oil
Coal
0
200
400
600
800
1,000
2005 2050BaU
2050CM1
2050CM2
million to
e
Passenger Transport
Freight Transport
Residential
Commercial
Industry
6
Table 4. Final energy demand by sector, ktoe
carbon). The energy demand and CO2 emission in
this scenario are lower than in BAU. The emissions
reductions from BAU emission are 48% and 85% re-
spectively in CM1 and CM2 scenarios. Concerning
future final energy demand, in CM1 and CM2, share of
carbon intensive energy (coal, oil, and gas) in final
energy demand is decreased. However, clean coal
power generation (equipped with CCS) increases its
share in CM2.
The CO2 emission per capita (Figure 2) in BAU
substantially increase from 0.37 ton-C (1.4 ton-CO2)
per capita (2005) to become 3.6 ton-C (13.3 ton-CO2)
per capita (2050). Emission per capita in CM1 is about
half of BAU and in CM2 it is about one sixth of BAU.
Owing to higher growth of the CM2, energy efficiency
improves more than CM1 and fuel use are expected to
shift toward more electricity, renewable, nuclear, clean
coal power plant (IGCC) equipped with carbon capture
sequestration (CCS). It covers exploration of appropri-
ate combination of energy services demand, end-use
technology, types of energy supply and technology.
The BAU projection is based on existing planning
without mitigation actions for reducing CO2 emissions,
moderate projection (CM1) follows the existing plan of
actions of the government, institutions, industries, as-
sociation, etc. The above described results clearly
demonstrate that with appropriate policy it is possible
Coal Oil Gas Solar, Wind, Hydrogen
Biomass Electricity Total
2005
P-Transport 0 17,788 6 0 0 5 17,798
F-Transport 0 6,562 0 0 0 0 6,562
Residential 0 7,876 836 0 30,674 3,446 42,832
Industry 8,975 8,925 11,777 0 5,995 3,552 39,224
Commercial 0 1,223 207 0 193 2,081 3,704
Total 8,975 42,374 12,825 0 36,863 9,084 110,120
Share 8.2% 38.5% 11.6% 0.0% 33.5% 8.2% 100%
2050 BAU P-Transport 0 41,394 10 0 0 2 41,406
F-Transport 0 126,510 0 0 0 0 126,510
Residential 0 14,416 4,660 0 5,606 45,078 69,761
Industry 133,904 204,622 153,487 0 21,045 56,266 569,325
Commercial 0 39,561 4,689 0 4,385 63,317 111,952
Total 133,904 426,503 162,846 0 31,037 164,663 918,953
Share 14.6% 46.4% 17.7% 0.0% 3.4% 17.9% 100%
2050 CM1
P-Transport 0 8,526 0 0 4,001 15 12,543
F-Transport 0 39,174 0 0 6,449 0 45,623
Residential 0 0 13,761 9 0 24,940 38,710
Industry 94,758 66,071 223,445 0 62,690 24,076 471,039
Commercial 0 18,603 14,265 0 0 35,171 68,039
Total 94,758 132,374 251,471 9 73,140 84,202 635,954
Share 14.9% 20.8% 39.5% 0.0% 11.5% 13.2% 100%
2050 CM2
P-Transport 0 304 0 0 5,366 3,573 9,244
F-Transport 0 574 0 5,403 12,086 23,994 42,056
Residential 0 0 2,248 0 326 64,397 66,971
Industry 55,649 22,980 22,958 0 102,556 339,124 543,266
Commercial 0 0 4,872 0 20,121 104,075 129,068
Total 55,649 23,857 30,079 5,403 140,454 535,163 790,605 Share 7.0% 3.0% 3.8% 0.7% 17.8% 67.7% 100%
7
to direct the society toward low carbon development.
CM2 shows that higher economic growth may not al-
ways mean higher emissions. It can apply more costly
mitigation options and could reduce emission more
than lower economic growth scenario like CM1.
CO2 emission reductions potential
Figure 12 presents CO2 emissions and reduction
potential of energy demand side. CO2 emission of
BAU will be reduced in demand side by 488 million ton
-C 2050 under the CM1 scenario and by 385 million
ton-C in 2050 under the CM2 scenario. In both scenar-
ios, largest reduction potential is found in industry sec-
tor.
. Figure 13 presents the breakdown of emission
reduction potential of energy supply side (broke down
by the sectors which consumes electricity). It is possi-
ble to reduce emissions by 195 million ton-C in CM1
with appropriate policies. Largest reduction comes
from industry and commercial sector. The reduction
potential of supply side is particularly high In CM2, 986
million ton-C in total, since large part of final energy
demand is shifted to electricity and power sector as-
sumes very advanced technology in the scenario. As a
result, with higher efficiency and low carbon energy
sources can be implemented and its CO2 emissions
can be 85% less than BAU despite its greater eco-
nomic size.
Residential sector
Energy demand in the sector will increase in line
with increasing population and GDP per capita. In
2050, it is assumed that energy service consumption
per capita increase by 1.2 ~ 7 times (varies by energy
service) compared to 2005 (BAU and CM1) and by 1.7
to 14 times in CM2. These assumptions are taken
based on energy demand and GDP trend data of sev-
eral countries. However, because of higher efficiency
of equipments and more share of low-carbon fuels,
CO2 emissions from residential sector decreased by
54% (CM1) and 93% (in CM2) from BAU scenario.
Commercial sector
In BAU scenario, highest growth rate of CO2
emissions is found in commercial sector, 34 times
greater than year 2005. This is due to high growth of
tertiary industry and more energy service demand per
floor area of commercial buildings. Though, in CM1
scenario, the rate is reduced to 16 times and in CM2,
only 2.8 times. In CM1, large part of emission reduc-
tion is contribution of energy efficiency improvement in
buildings while in CM2 power supply sector has
greater contribution as shown in Figure 13.
0
50
100
150
200
250
300
350
400
450
Resid
ential
Co
mm
erc
ial
Ind
ustr
y
P-T
ransp
ort
F-T
ransp
ort
Resid
ential
Co
mm
erc
ial
Ind
ustr
y
P-T
ransp
ort
F-T
ransp
ort
2050CM1 2050CM2
0
50
100
150
200
250
300
350
400
450
Resid
ential
Co
mm
erc
ial
Ind
ustr
y
P-T
ransp
ort
F-T
ransp
ort
Resid
ential
Co
mm
erc
ial
Ind
ustr
y
P-T
ransp
ort
F-T
ransp
ort
2050CM1 2050CM2
Figure13 Potential of GHG emission reduction of supply side by energy demand sector
Figure12 Potential of GHG emission reduction of demand side by energy demand sector
8
Industry Sector
“Industry sector” in this report means primary and
secondary industries as energy consumer. Currently It
is the largest GHG emitter and also the highest con-
tributor to Indonesia‟s GDP. In the future, energy con-
sumption of this sector will be still higher compared to
others. Energy demand of industry sector is expected
to grow from 39 (2005) to 569 million toe (2050). Since
energy consumed by the industry is mainly coal, oil
and gas, this sector will remain the main contributors
of CO2 emission. However, the share of CO2 emission
of industry sector also changes substantially. The
share of emissions from industry increase from 45% in
2005 to 53%, 62%, 80% in 2050 for BAU, CM1, and
CM2, respectively.
Process technologies and types of equipments
used in this sector determine the type and quantity of
energy used by the sector and the amount of resulting
CO2 emissions. Energy technology intervention, good
house keeping, changes of behavior and lifestyle of
workers could be implemented to achieve the LCS
target. Energy technology intervention is implemented
through efficiency improvement (high efficient equip-
ments and processes). Energy efficiency potential var-
ies upon type of equipments and visions of each sce-
nario (BAU, CM1, CM2). BAU assumes that existing
low efficiency equipment and processes will continue
to be used until 2050. Countermeasures scenarios
assume that in 2050, there should be changes in tech-
nology processes orientation. CM1 (moderate sce-
nario), assumes that the level of efficiency of most
equipment and processes in the manufacturing sector
is lower than those in CM2 (high growth scenario),
which assumed that the behavior of the society is de-
picted as “technology oriented”.
Transportation Sector
Transportation sector is the second largest (after
industry) energy consumer in Indonesia. This sector
consumes almost 80% of oil product in the country.
CO2 emissions of the transport sector is mainly from
oil combustion. Reduction of CO2 emission from fuel
combustion activities could be achieved through effi-
cient use of fuel and fuel change to less CO2 emitting
fuels. Efficient use of fuel can be achieved through
efficient vehicles, efficient transportation system
(increasing the share of mass transport mode, reduc-
ing transport distance, changing transport structure).
Fuel change to less CO2 emitting fuels could be im-
plemented by introducing biofuel and natural gas to
replace oil fuels.
Energy systems, both demand and supply side, in
CM1 and CM2 are progressively efficient and more
electrified. Central power systems utilize low carbon
energy source such as renewable energy, nuclear,
and other less CO2 emitting fuels. Particularly the
CM2, clean coal technology such as IGCC equipped
with CCS is included.
9
Five “Actions” towards LCS
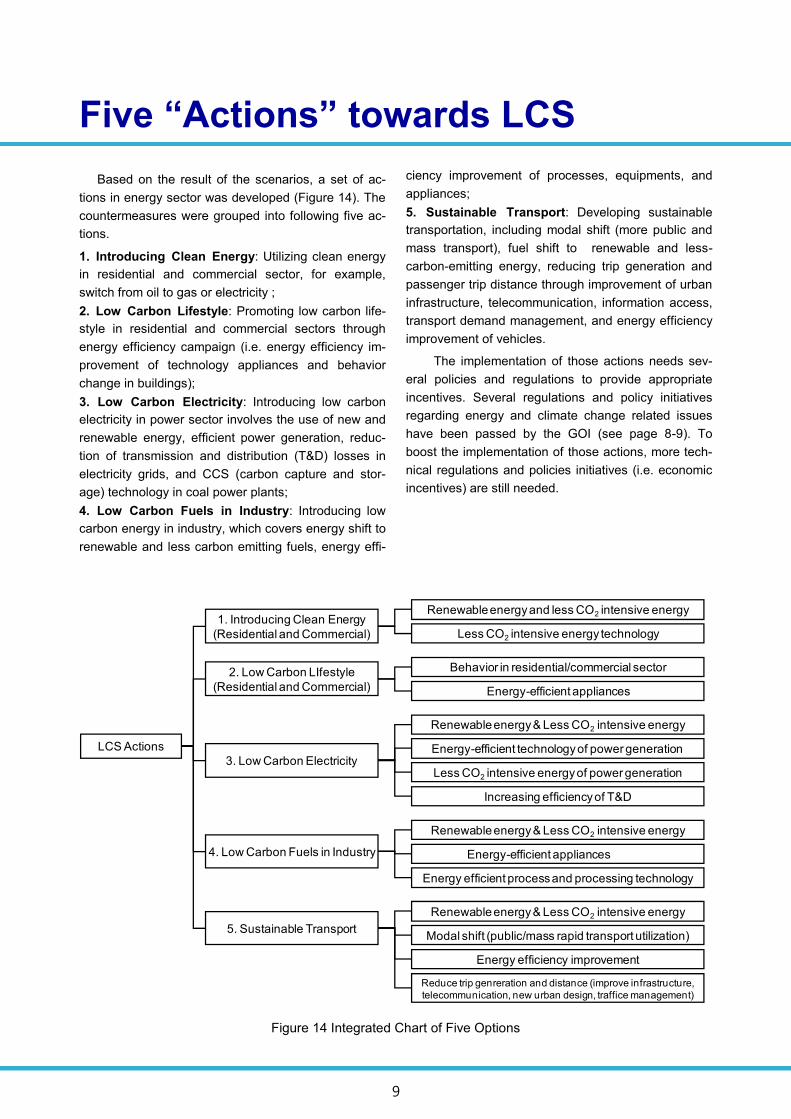
Based on the result of the scenarios, a set of ac-
tions in energy sector was developed (Figure 14). The
countermeasures were grouped into following five ac-
tions.
1. Introducing Clean Energy: Utilizing clean energy
in residential and commercial sector, for example,
switch from oil to gas or electricity ;
2. Low Carbon Lifestyle: Promoting low carbon life-
style in residential and commercial sectors through
energy efficiency campaign (i.e. energy efficiency im-
provement of technology appliances and behavior
change in buildings);
3. Low Carbon Electricity: Introducing low carbon
electricity in power sector involves the use of new and
renewable energy, efficient power generation, reduc-
tion of transmission and distribution (T&D) losses in
electricity grids, and CCS (carbon capture and stor-
age) technology in coal power plants;
4. Low Carbon Fuels in Industry: Introducing low
carbon energy in industry, which covers energy shift to
renewable and less carbon emitting fuels, energy effi-
ciency improvement of processes, equipments, and
appliances;
5. Sustainable Transport: Developing sustainable
transportation, including modal shift (more public and
mass transport), fuel shift to renewable and less-
carbon-emitting energy, reducing trip generation and
passenger trip distance through improvement of urban
infrastructure, telecommunication, information access,
transport demand management, and energy efficiency
improvement of vehicles.
The implementation of those actions needs sev-
eral policies and regulations to provide appropriate
incentives. Several regulations and policy initiatives
regarding energy and climate change related issues
have been passed by the GOI (see page 8-9). To
boost the implementation of those actions, more tech-
nical regulations and policies initiatives (i.e. economic
incentives) are still needed.
Figure 14 Integrated Chart of Five Options
LCS Actions
1. Introducing Clean Energy
(Residential and Commercial)
2. Low Carbon LIfestyle
(Residential and Commercial)
3. Low Carbon Electricity
4. Low Carbon Fuels in Industry
Renewable energy and less CO2 intensive energy
Less CO2 intensive energy technology
Behavior in residential/commercial sector
Energy-efficient appliances
Renewable energy & Less CO2 intensive energy
Energy-efficient technology of power generation
Less CO2 intensive energy of power generation
Increasing efficiency of T&D
Renewable energy & Less CO2 intensive energy
Energy-efficient appliances
Energy efficient process and processing technology
5. Sustainable Transport
Renewable energy & Less CO2 intensive energy
Modal shift (public/mass rapid transport utilization)
Energy efficiency improvement
Reduce trip genreration and distance (improve infrastructure,
telecommunication, new urban design, traffice management)
10
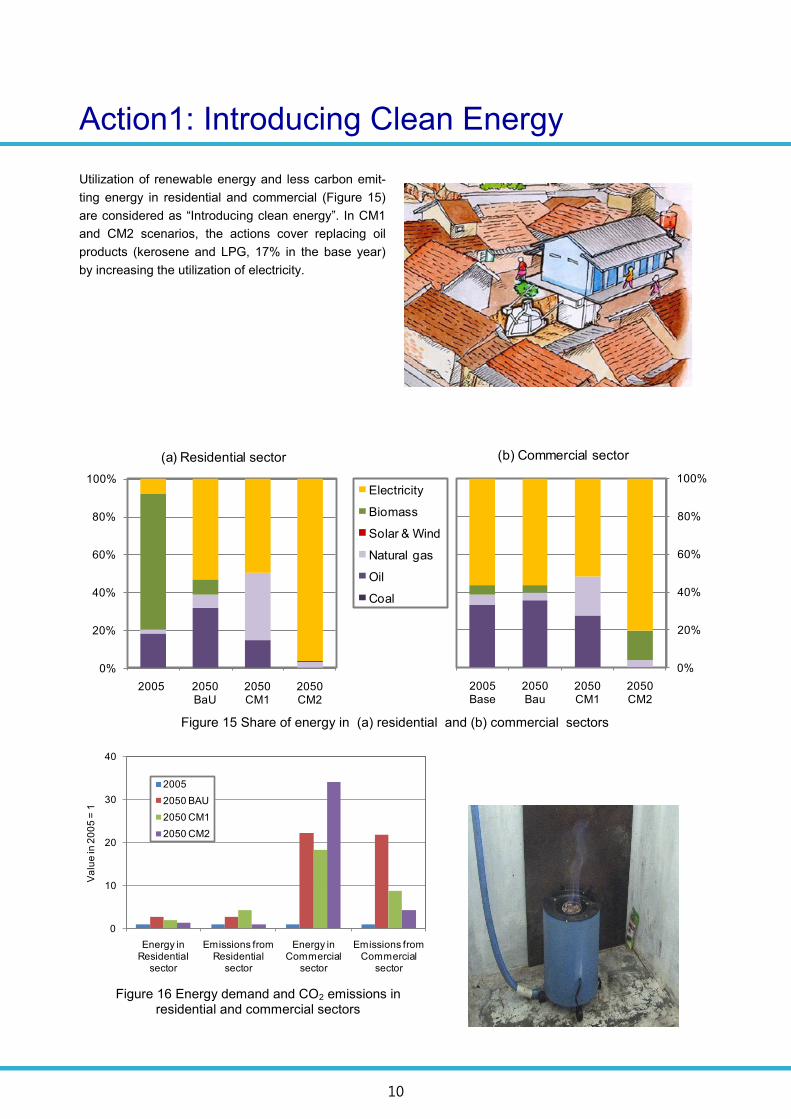
Action1: Introducing Clean Energy
Utilization of renewable energy and less carbon emit-
ting energy in residential and commercial (Figure 15)
are considered as “Introducing clean energy”. In CM1
and CM2 scenarios, the actions cover replacing oil
products (kerosene and LPG, 17% in the base year)
by increasing the utilization of electricity.
0%
20%
40%
60%
80%
100%
2005 2050BaU
2050CM1
2050CM2
(a) Residential sector
0%
20%
40%
60%
80%
100%
2005 Base
2050 Bau
2050 CM1
2050 CM2
(b) Commercial sector
Electricity
Biomass
Solar & Wind
Natural gas
Oil
Coal
Figure 15 Share of energy in (a) residential and (b) commercial sectors
0
10
20
30
40
Energy in Residential
sector
Emissions from Residential
sector
Energy in Commercial
sector
Emissions from Commercial
sector
Va
lue
in 2
00
5 =
1
2005
2050 BAU
2050 CM1
2050 CM2
Figure 16 Energy demand and CO2 emissions in residential and commercial sectors
11
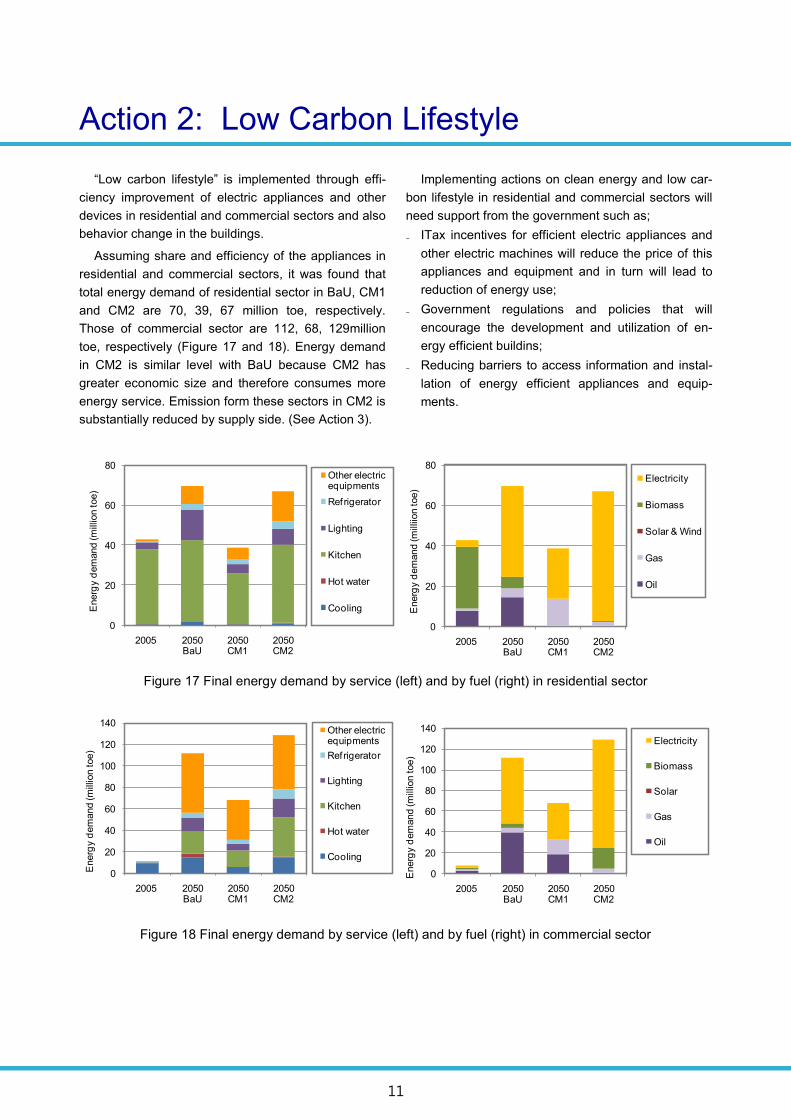
Action 2: Low Carbon Lifestyle
“Low carbon lifestyle” is implemented through effi-
ciency improvement of electric appliances and other
devices in residential and commercial sectors and also
behavior change in the buildings.
Assuming share and efficiency of the appliances in
residential and commercial sectors, it was found that
total energy demand of residential sector in BaU, CM1
and CM2 are 70, 39, 67 million toe, respectively.
Those of commercial sector are 112, 68, 129million
toe, respectively (Figure 17 and 18). Energy demand
in CM2 is similar level with BaU because CM2 has
greater economic size and therefore consumes more
energy service. Emission form these sectors in CM2 is
substantially reduced by supply side. (See Action 3).
Implementing actions on clean energy and low car-
bon lifestyle in residential and commercial sectors will
need support from the government such as;
₋ ITax incentives for efficient electric appliances and
other electric machines will reduce the price of this
appliances and equipment and in turn will lead to
reduction of energy use;
₋ Government regulations and policies that will
encourage the development and utilization of en-
ergy efficient buildins;
₋ Reducing barriers to access information and instal-
lation of energy efficient appliances and equip-
ments.
Figure 17 Final energy demand by service (left) and by fuel (right) in residential sector
Figure 18 Final energy demand by service (left) and by fuel (right) in commercial sector
0
20
40
60
80
100
120
140
2005 2050BaU
2050CM1
2050CM2
Energ
y d
em
and (m
illio
n toe)
Other electric equipments
Refrigerator
Lighting
Kitchen
Hot water
Cooling
0
20
40
60
80
100
120
140
2005 2050BaU
2050CM1
2050CM2
Energ
y d
em
and (m
illio
n toe)
Electricity
Biomass
Solar
Gas
Oil
0
20
40
60
80
2005 2050BaU
2050CM1
2050CM2
Energ
y d
em
and (m
illio
n toe)
Other electric equipments
Refrigerator
Lighting
Kitchen
Hot water
Cooling
0
20
40
60
80
2005 2050BaU
2050CM1
2050CM2
Energ
y d
em
and (m
illiio
n toe)
Electricity
Biomass
Solar & Wind
Gas
Oil
12
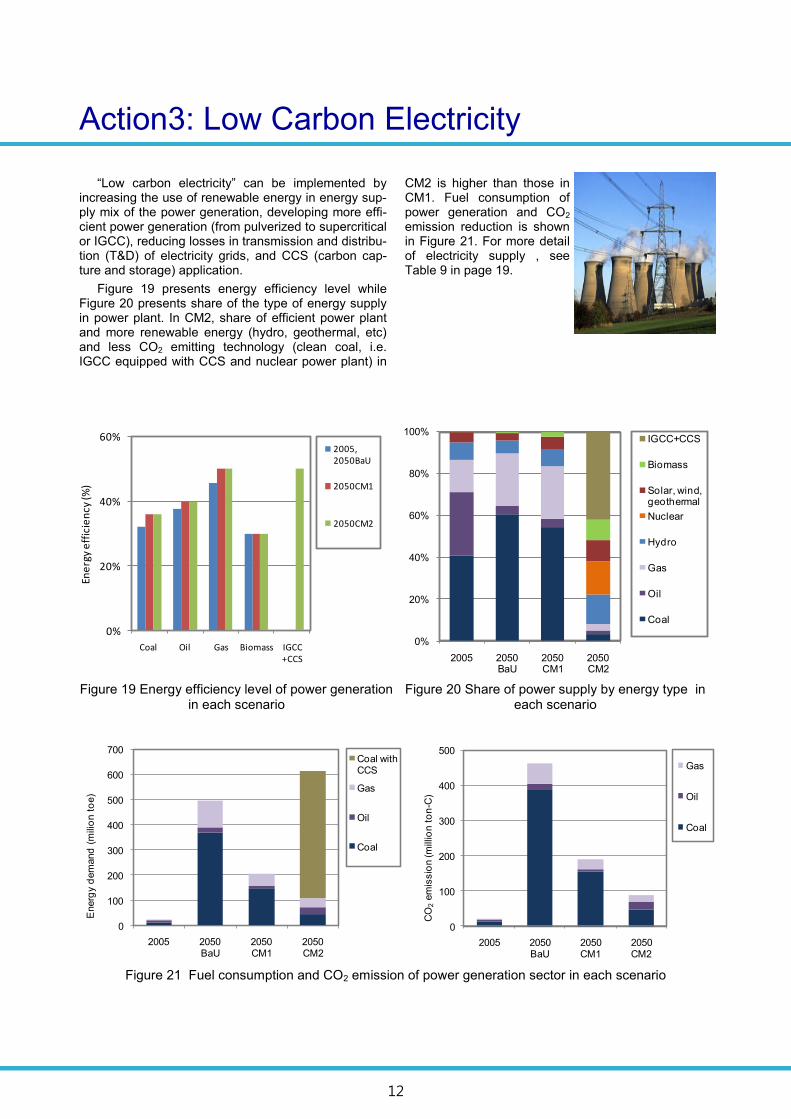
Action3: Low Carbon Electricity
“Low carbon electricity” can be implemented by increasing the use of renewable energy in energy sup-ply mix of the power generation, developing more effi-cient power generation (from pulverized to supercritical or IGCC), reducing losses in transmission and distribu-tion (T&D) of electricity grids, and CCS (carbon cap-ture and storage) application.
Figure 19 presents energy efficiency level while Figure 20 presents share of the type of energy supply in power plant. In CM2, share of efficient power plant and more renewable energy (hydro, geothermal, etc) and less CO2 emitting technology (clean coal, i.e. IGCC equipped with CCS and nuclear power plant) in
CM2 is higher than those in CM1. Fuel consumption of power generation and CO2 emission reduction is shown in Figure 21. For more detail of electricity supply , see Table 9 in page 19.
0%
20%
40%
60%
Coal Oil Gas Biomass IGCC+CCS
Ene
rgy
eff
icie
ncy
(%)
2005, 2050BaU
2050CM1
2050CM2
Figure 19 Energy efficiency level of power generation in each scenario
Figure 21 Fuel consumption and CO2 emission of power generation sector in each scenario
0%
20%
40%
60%
80%
100%
2005 2050BaU
2050CM1
2050CM2
IGCC+CCS
Biomass
Solar, wind, geothermal
Nuclear
Hydro
Gas
Oil
Coal
0
100
200
300
400
500
600
700
2005 2050BaU
2050CM1
2050CM2
Energ
y d
em
and
(m
ilio
n t
oe)
Coal with CCS
Gas
Oil
Coal
0
100
200
300
400
500
2005 2050BaU
2050CM1
2050CM2
CO
2em
issio
n (m
illio
n t
on
-C)
Gas
Oil
Coal
Figure 20 Share of power supply by energy type in each scenario
13
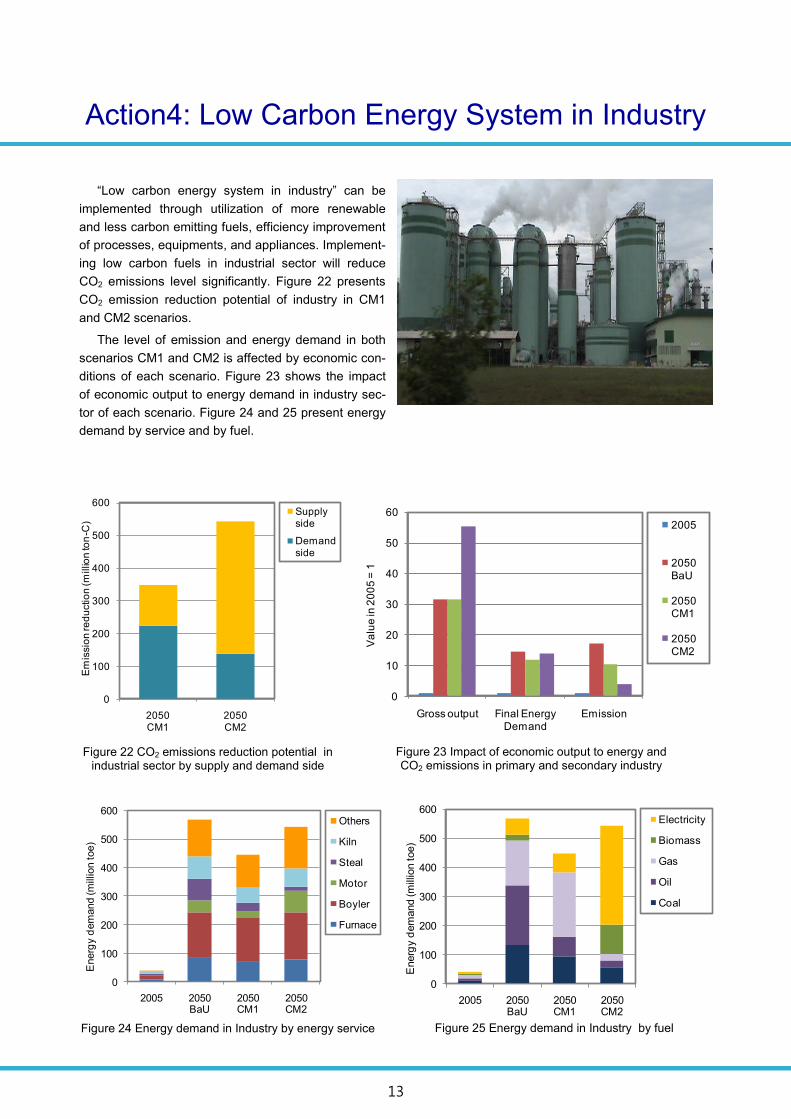
Action4: Low Carbon Energy System in Industry
“Low carbon energy system in industry” can be
implemented through utilization of more renewable
and less carbon emitting fuels, efficiency improvement
of processes, equipments, and appliances. Implement-
ing low carbon fuels in industrial sector will reduce
CO2 emissions level significantly. Figure 22 presents
CO2 emission reduction potential of industry in CM1
and CM2 scenarios.
The level of emission and energy demand in both
scenarios CM1 and CM2 is affected by economic con-
ditions of each scenario. Figure 23 shows the impact
of economic output to energy demand in industry sec-
tor of each scenario. Figure 24 and 25 present energy
demand by service and by fuel.
Figure 24 Energy demand in Industry by energy service
Figure 23 Impact of economic output to energy and CO2 emissions in primary and secondary industry
Figure 22 CO2 emissions reduction potential in industrial sector by supply and demand side
0
100
200
300
400
500
600
2050CM1
2050CM2
Em
issio
n re
du
ctio
n (m
illio
n to
n-C
)
Supply side
Demand side
0
10
20
30
40
50
60
Gross output Final Energy Demand
Emission
Va
lue
in 2
00
5 =
1
2005
2050BaU
2050CM1
2050CM2
0
100
200
300
400
500
600
2005 2050BaU
2050CM1
2050CM2
Energ
y d
em
and (m
illio
n toe)
Others
Kiln
Steal
Motor
Boyler
Furnace
0
100
200
300
400
500
600
2005 2050BaU
2050CM1
2050CM2
Energ
y d
em
and (m
illio
n toe)
Electricity
Biomass
Gas
Oil
Coal
Figure 25 Energy demand in Industry by fuel
14
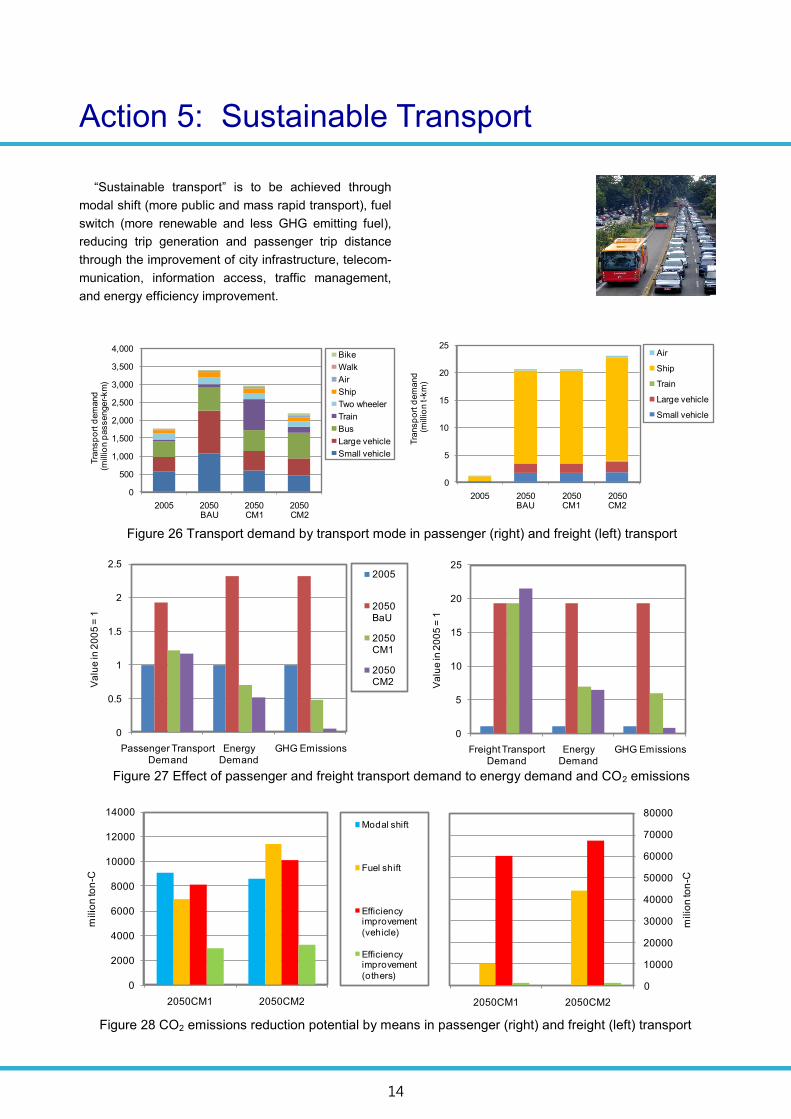
Action 5: Sustainable Transport
“Sustainable transport” is to be achieved through
modal shift (more public and mass rapid transport), fuel
switch (more renewable and less GHG emitting fuel),
reducing trip generation and passenger trip distance
through the improvement of city infrastructure, telecom-
munication, information access, traffic management,
and energy efficiency improvement.
Figure 27 Effect of passenger and freight transport demand to energy demand and CO2 emissions
Figure 28 CO2 emissions reduction potential by means in passenger (right) and freight (left) transport
Figure 26 Transport demand by transport mode in passenger (right) and freight (left) transport
0
5
10
15
20
25
2005 2050BAU
2050CM1
2050CM2
Tra
nsp
ort
dem
and
(mill
ion t-k
m)
Air
Ship
Train
Large vehicle
Small vehicle
0
500
1,000
1,500
2,000
2,500
3,000
3,500
4,000
2005 2050BAU
2050CM1
2050CM2
Tra
nsp
ort
dem
and
(mill
ion p
assenger-
km
)
Bike
Walk
Air
Ship
Two wheeler
Train
Bus
Large vehicle
Small vehicle
0
0.5
1
1.5
2
2.5
Passenger TransportDemand
Energy Demand
GHG Emissions
Va
lue
in 2
00
5 =
1
2005
2050 BaU
2050 CM1
2050 CM2
0
5
10
15
20
25
Freight Transport Demand
Energy Demand
GHG Emissions
Va
lue
in 2
00
5 =
1
0
10000
20000
30000
40000
50000
60000
70000
80000
2050CM1 2050CM2
milio
n to
n-C
0
2000
4000
6000
8000
10000
12000
14000
2050CM1 2050CM2
milio
n to
n-C
Modal shift
Fuel shift
Efficiency improvement
(vehicle)
Efficiency improvement
(others)
15
Methodology
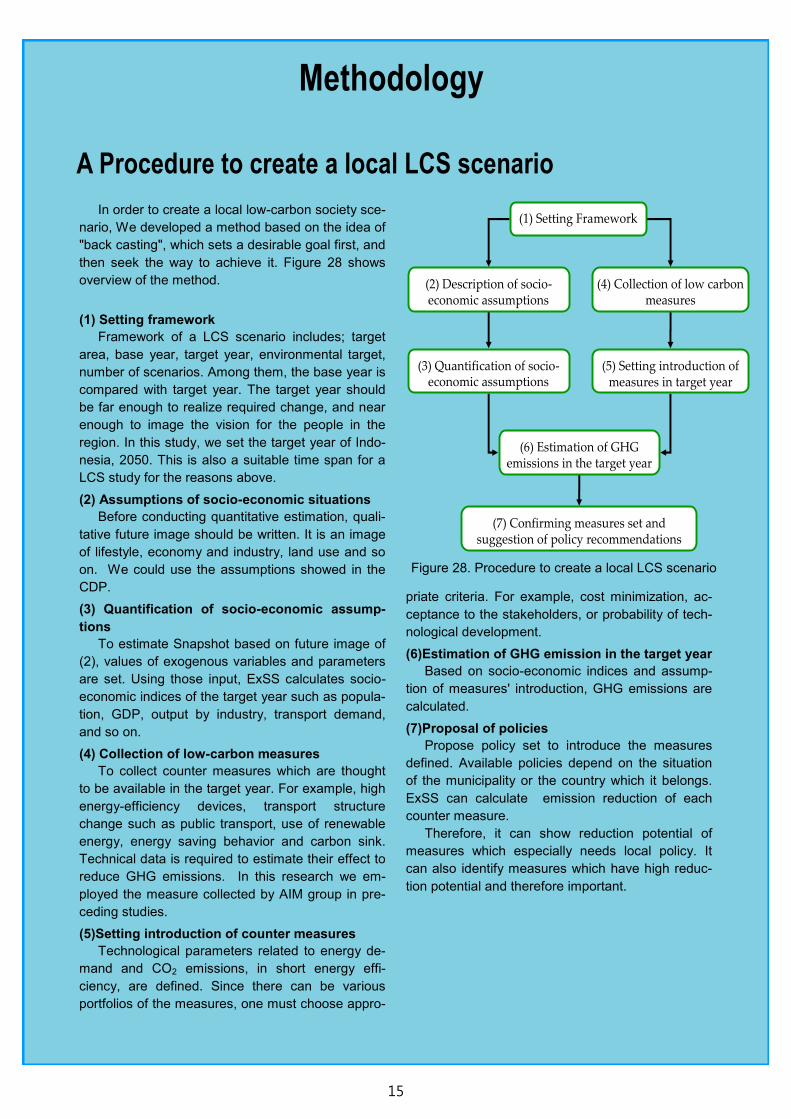
In order to create a local low-carbon society sce-
nario, We developed a method based on the idea of
"back casting", which sets a desirable goal first, and
then seek the way to achieve it. Figure 28 shows
overview of the method.
(1) Setting framework
Framework of a LCS scenario includes; target
area, base year, target year, environmental target,
number of scenarios. Among them, the base year is
compared with target year. The target year should
be far enough to realize required change, and near
enough to image the vision for the people in the
region. In this study, we set the target year of Indo-
nesia, 2050. This is also a suitable time span for a
LCS study for the reasons above.
(2) Assumptions of socio-economic situations
Before conducting quantitative estimation, quali-
tative future image should be written. It is an image
of lifestyle, economy and industry, land use and so
on. We could use the assumptions showed in the
CDP.
(3) Quantification of socio-economic assump-
tions
To estimate Snapshot based on future image of
(2), values of exogenous variables and parameters
are set. Using those input, ExSS calculates socio-
economic indices of the target year such as popula-
tion, GDP, output by industry, transport demand,
and so on.
(4) Collection of low-carbon measures
To collect counter measures which are thought
to be available in the target year. For example, high
energy-efficiency devices, transport structure
change such as public transport, use of renewable
energy, energy saving behavior and carbon sink.
Technical data is required to estimate their effect to
reduce GHG emissions. In this research we em-
ployed the measure collected by AIM group in pre-
ceding studies.
(5)Setting introduction of counter measures
Technological parameters related to energy de-
mand and CO2 emissions, in short energy effi-
ciency, are defined. Since there can be various
portfolios of the measures, one must choose appro-
priate criteria. For example, cost minimization, ac-
ceptance to the stakeholders, or probability of tech-
nological development.
(6)Estimation of GHG emission in the target year
Based on socio-economic indices and assump-
tion of measures' introduction, GHG emissions are
calculated.
(7)Proposal of policies
Propose policy set to introduce the measures
defined. Available policies depend on the situation
of the municipality or the country which it belongs.
ExSS can calculate emission reduction of each
counter measure.
Therefore, it can show reduction potential of
measures which especially needs local policy. It
can also identify measures which have high reduc-
tion potential and therefore important.
A Procedure to create a local LCS scenario
(1) Setting Framework
(3) Quantification of socio-economic assumptions
(4) Collection of low carbon measures
(2) Description of socio-economic assumptions
(6) Estimation of GHG emissions in the target year
(5) Setting introduction of measures in target year
(7) Confirming measures set and suggestion of policy recommendations
Figure 28. Procedure to create a local LCS scenario
16
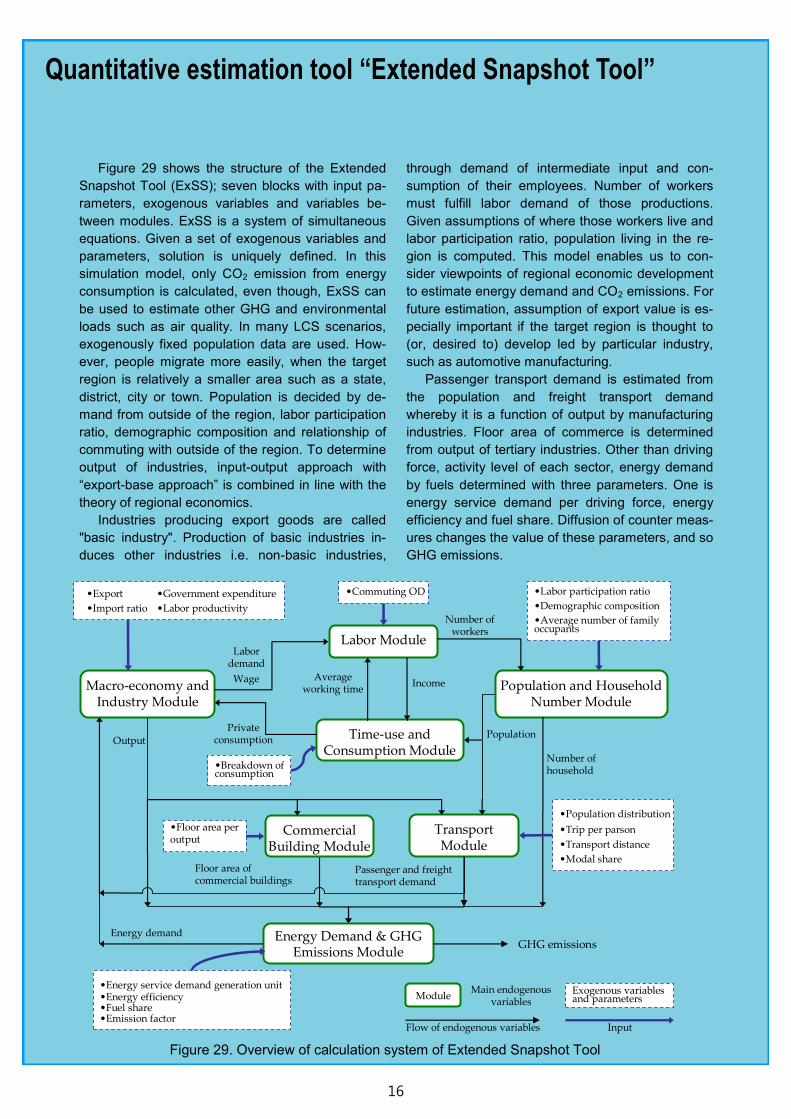
Figure 29 shows the structure of the Extended
Snapshot Tool (ExSS); seven blocks with input pa-
rameters, exogenous variables and variables be-
tween modules. ExSS is a system of simultaneous
equations. Given a set of exogenous variables and
parameters, solution is uniquely defined. In this
simulation model, only CO2 emission from energy
consumption is calculated, even though, ExSS can
be used to estimate other GHG and environmental
loads such as air quality. In many LCS scenarios,
exogenously fixed population data are used. How-
ever, people migrate more easily, when the target
region is relatively a smaller area such as a state,
district, city or town. Population is decided by de-
mand from outside of the region, labor participation
ratio, demographic composition and relationship of
commuting with outside of the region. To determine
output of industries, input-output approach with
“export-base approach” is combined in line with the
theory of regional economics.
Industries producing export goods are called
"basic industry". Production of basic industries in-
duces other industries i.e. non-basic industries,
through demand of intermediate input and con-
sumption of their employees. Number of workers
must fulfill labor demand of those productions.
Given assumptions of where those workers live and
labor participation ratio, population living in the re-
gion is computed. This model enables us to con-
sider viewpoints of regional economic development
to estimate energy demand and CO2 emissions. For
future estimation, assumption of export value is es-
pecially important if the target region is thought to
(or, desired to) develop led by particular industry,
such as automotive manufacturing.
Passenger transport demand is estimated from
the population and freight transport demand
whereby it is a function of output by manufacturing
industries. Floor area of commerce is determined
from output of tertiary industries. Other than driving
force, activity level of each sector, energy demand
by fuels determined with three parameters. One is
energy service demand per driving force, energy
efficiency and fuel share. Diffusion of counter meas-
ures changes the value of these parameters, and so
GHG emissions.
Quantitative estimation tool “Extended Snapshot Tool”
Macro-economy and Industry Module
Labor Module
Population and Household Number Module
Time-use and Consumption Module
Transport Module
Commercial Building Module
Energy Demand & GHG Emissions Module
GHG emissions
Labor demand
Wage
Number of workers
Average working time
PopulationPrivate
consumption
Number of household
Output
Passenger and freight transport demand
Floor area of commercial buildings
Energy demand
Income
•Export
•Import ratio
•Commuting OD •Labor participation ratio
•Demographic composition
•Average number of family occupants
•Breakdown of consumption
•Floor area per output
•Population distribution
•Trip per parson
•Transport distance
•Modal share
•Energy service demand generation unit•Energy efficiency•Fuel share•Emission factor
•Government expenditure
•Labor productivity
Exogenous variables and parameters
Main endogenous variables
Module
InputFlow of endogenous variables
Figure 29. Overview of calculation system of Extended Snapshot Tool
17
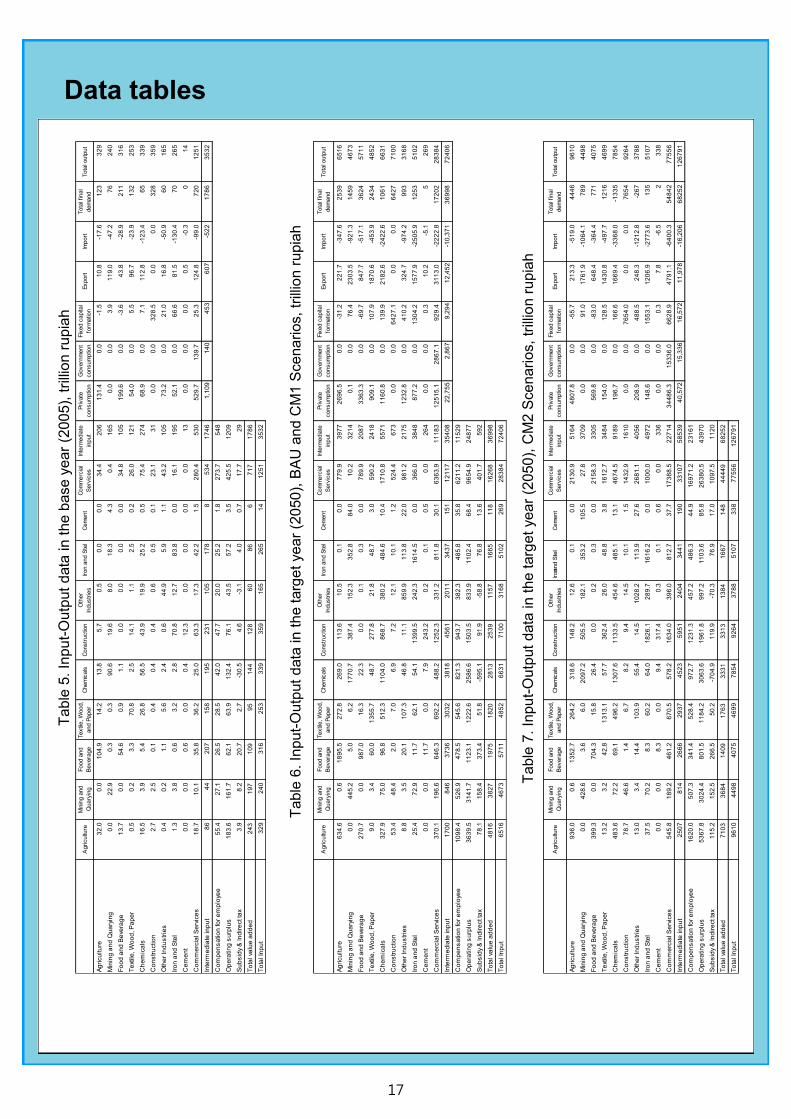
Data tables
Ta
ble
5. In
pu
t-O
utp
ut
data
in t
he b
ase y
ear
(200
5),
trilli
on r
upia
h
Ta
ble
6. In
pu
t-O
utp
ut
data
in t
he t
arg
et ye
ar
(2050
), B
AU
and
CM
1 S
ce
na
rios, tr
illio
n r
upia
h
Ta
ble
7. In
pu
t-O
utp
ut
data
in t
he t
arg
et ye
ar
(2050
), C
M2
Sce
na
rios,
trill
ion
ru
pia
h
Agricultu
reM
inin
g a
nd
Quary
ing
Food a
nd
Bevera
ge
Textil
e, W
ood,
and P
aper
Chem
icals
Constr
uctio
nO
ther
Industr
ies
Iron a
nd S
tel
Cem
ent
Com
merc
ial
Serv
ices
Inte
rmedia
te
input
Private
consum
ptio
n
Govern
ment
consum
ptio
n
Fix
ed c
apita
l
form
atio
nExport
Import
Tota
l fin
al
dem
and
Tota
l outp
ut
Ag
ricu
ltu
re3
2.0
0.0
10
4.9
14
.21
3.8
5.7
0.5
0.0
0.0
34
.42
06
13
1.4
0.0
-1.5
10
.8-1
7.6
12
33
29
Min
ing
an
d Q
ua
ryin
g0
.02
2.9
0.3
0.3
90
.61
9.6
8.0
18
.34
.30
.41
65
0.0
0.0
3.9
11
9.0
-47
.27
62
40
Fo
od
an
d B
eve
rag
e1
3.7
0.0
54
.60
.91
.10
.00
.00
.00
.03
4.8
10
51
99
.60
.0-3
.64
3.8
-28
.92
11
31
6
Te
xtile
, W
oo
d, P
ap
er
0.5
0.2
3.3
70
.82
.51
4.1
1.1
2.5
0.2
26
.01
21
54
.00
.05
.59
6.7
-23
.91
32
25
3
Ch
em
ica
ls1
6.5
3.9
5.4
26
.85
6.5
43
.91
9.9
25
.20
.57
5.4
27
46
8.9
0.0
7.1
11
2.8
-12
3.4
65
33
9
Co
ns
tru
ctio
n2
.72
.50
.10
.40
.40
.40
.60
.50
.12
3.1
31
0.0
0.0
32
8.5
0.0
0.0
32
83
59
Oth
er
Ind
us
trie
s0
.40
.21
.15
.62
.40
.64
4.9
5.9
1.1
43
.21
05
73
.20
.02
1.0
16
.8-5
0.9
60
16
5
Iro
n a
nd
Ste
l1
.33
.80
.63
.22
.87
0.8
12
.78
3.8
0.0
16
.11
95
52
.10
.06
6.6
81
.5-1
30
.47
02
65
Ce
me
nt
0.0
0.0
0.6
0.0
0.4
12
.30
.00
.00
.00
.01
30
.00
.00
.00
.5-0
.30
14
Co
mm
erc
ial S
erv
ice
s1
8.7
10
.13
5.8
36
.22
5.0
63
.31
7.3
42
.21
.52
80
.45
30
52
9.7
13
9.7
25
.31
24
.8-9
9.0
72
01
25
1
Inte
rme
dia
te in
pu
t8
64
42
07
15
81
95
23
11
05
17
88
53
41
74
61
,10
91
40
45
36
07
-52
21
78
63
53
2
Co
mp
en
sa
tio
n fo
r e
mp
loye
e5
5.4
27
.12
6.5
28
.54
2.0
47
.72
0.0
25
.21
.82
73
.75
48
Op
era
tin
g s
urp
lus
18
3.6
16
1.7
62
.16
3.9
13
2.4
76
.14
3.5
57
.23
.54
25
.51
20
9
Su
bs
idy
& In
dir
ect ta
x3
.98
.22
0.7
2.7
-30
.54
.6-3
.14
.00
.71
7.7
29
To
tal va
lue
ad
de
d2
43
19
71
09
95
14
41
28
60
86
67
17
17
86
To
tal In
pu
t3
29
24
03
16
25
33
39
35
91
65
26
51
41
25
13
53
2
Agricultu
reM
inin
g a
nd
Quary
ing
Food a
nd
Bevera
ge
Textil
e, W
ood,
and P
aper
Chem
icals
Constr
uctio
nO
ther
Industr
ies
Iron a
nd S
tel
Cem
ent
Com
merc
ial
Serv
ices
Inte
rmedia
te
input
Private
consum
ptio
n
Govern
ment
consum
ptio
n
Fix
ed c
apita
l
form
atio
nExport
Import
Tota
l fin
al
dem
and
Tota
l outp
ut
Ag
ricu
ltu
re6
34
.60
.61
89
5.5
27
2.8
26
9.0
11
3.6
10
.50
.10
.07
79
.93
97
72
69
6.5
0.0
-31
.22
21
.7-3
47
.62
53
96
51
6
Min
ing
an
d Q
ua
ryin
g0
.04
45
.25
.06
.21
77
0.7
38
7.4
15
2.3
35
2.8
84
.01
0.2
32
14
0.1
0.0
76
.42
30
3.5
-92
1.3
14
59
46
73
Fo
od
an
d B
eve
rag
e2
70
.70
.09
87
.01
6.3
22
.30
.00
.10
.30
.07
89
.92
08
73
36
3.3
0.0
-69
.78
47
.7-5
17
.13
62
45
71
1
Te
xtile
, W
oo
d, P
ap
er
9.0
3.4
60
.01
35
5.7
48
.72
77
.82
1.8
48
.73
.05
90
.22
41
89
09
.10
.01
07
.91
87
0.6
-45
3.9
24
34
48
52
Ch
em
ica
ls3
27
.97
5.0
96
.85
12
.31
10
4.0
86
8.7
38
0.2
48
4.6
10
.41
71
0.8
55
71
11
60
.80
.01
39
.92
18
2.6
-24
22
.61
06
16
63
1
Co
ns
tru
ctio
n5
3.4
48
.42
.07
.06
.97
.21
2.1
10
.11
.25
24
.46
73
0.0
0.0
64
27
.10
.00
.06
42
77
10
0
Oth
er
Ind
us
trie
s8
.83
.52
0.1
10
7.3
46
.81
1.1
85
9.9
11
3.8
22
.09
81
.22
17
51
23
2.8
0.0
41
0.2
32
4.7
-97
4.2
99
33
16
8
Iro
n a
nd
Ste
l2
5.4
72
.91
1.7
62
.15
4.1
13
99
.52
42
.31
61
4.5
0.0
36
6.0
38
48
87
7.2
0.0
13
04
.21
57
7.9
-25
05
.91
25
35
10
2
Ce
me
nt
0.0
0.0
11
.70
.07
.92
43
.20
.20
.10
.50
.02
64
0.0
0.0
0.3
10
.2-5
.15
26
9
Co
mm
erc
ial S
erv
ice
s3
70
.11
96
.66
46
.36
92
.24
88
.21
25
2.3
33
1.2
81
1.8
30
.16
36
3.9
11
18
31
25
15
.12
86
7.1
92
9.4
31
13
.0-2
22
2.8
17
20
22
83
84
Inte
rme
dia
te in
pu
t1
70
08
46
37
36
30
32
38
18
45
61
20
11
34
37
15
11
21
17
35
40
82
2,7
55
2,8
67
9,2
94
12
,45
2-1
0,3
71
36
99
87
24
06
Co
mp
en
sa
tio
n fo
r e
mp
loye
e1
09
8.4
52
6.9
47
8.5
54
5.6
82
1.3
94
3.7
38
2.3
48
5.8
35
.86
21
1.2
11
52
9
Op
era
tin
g s
urp
lus
36
39
.53
14
1.7
11
23
.11
22
2.6
25
86
.61
50
3.5
83
3.9
11
02
.46
8.4
96
54
.92
48
77
Su
bs
idy
& In
dir
ect ta
x7
8.1
15
8.4
37
3.4
51
.8-5
95
.19
1.9
-58
.87
6.8
13
.64
01
.75
92
To
tal va
lue
ad
de
d4
81
63
82
71
97
51
82
02
81
32
53
91
15
71
66
51
18
16
26
83
69
98
To
tal In
pu
t6
51
64
67
35
71
14
85
26
63
17
10
03
16
85
10
22
69
28
38
47
24
06
Agricultu
reM
inin
g a
nd
Quary
ing
Food a
nd
Bevera
ge
Textil
e, W
ood,
and P
aper
Chem
icals
Constr
uctio
nO
ther
Industr
ies
Iron a
nd S
tel
Cem
ent
Com
merc
ial
Serv
ices
Inte
rmedia
te
input
Private
consum
ptio
n
Govern
ment
consum
ptio
n
Fix
ed c
apita
l
form
atio
nExport
Import
Tota
l fin
al
dem
and
Tota
l outp
ut
Ag
ricu
ltu
re9
36
.00
.61
35
2.7
26
4.2
31
8.6
14
8.2
12
.60
.10
.02
13
0.9
51
64
48
07
.80
.0-5
5.7
21
3.3
-51
9.0
44
46
96
10
Min
ing
an
d Q
ua
ryin
g0
.04
28
.63
.66
.02
09
7.2
50
5.5
18
2.1
35
3.2
10
5.5
27
.83
70
90
.00
.09
1.0
17
61
.9-1
06
4.1
78
94
49
8
Fo
od
an
d B
eve
rag
e3
99
.30
.07
04
.31
5.8
26
.40
.00
.20
.30
.02
15
8.3
33
05
56
9.8
0.0
-83
.06
48
.4-3
64
.47
71
40
75
Te
xtile
, W
oo
d, P
ap
er
13
.23
.24
2.8
13
13
.15
7.7
36
2.4
26
.04
8.8
3.8
16
12
.73
48
41
54
.00
.01
28
.51
43
0.8
-49
7.7
12
16
46
99
Ch
em
ica
ls4
83
.67
2.2
69
.14
96
.21
30
7.6
11
33
.54
54
.64
85
.11
3.1
46
74
.59
18
91
96
.70
.01
66
.61
66
9.4
-33
68
.0-1
33
57
85
4
Co
ns
tru
ctio
n7
8.7
46
.61
.46
.78
.29
.41
4.5
10
.11
.51
43
2.9
16
10
0.0
0.0
76
54
.00
.00
.07
65
49
26
4
Oth
er
Ind
us
trie
s1
3.0
3.4
14
.41
03
.95
5.4
14
.51
02
8.2
11
3.9
27
.62
68
1.1
40
56
20
8.9
0.0
48
8.5
24
8.3
-12
12
.8-2
67
37
88
Iro
n a
nd
Ste
l3
7.5
70
.28
.36
0.2
64
.01
82
6.1
28
9.7
16
16
.20
.01
00
0.0
49
72
14
8.6
0.0
15
53
.11
20
6.9
-27
73
.61
35
51
07
Ce
me
nt
0.0
0.0
8.3
0.0
9.4
31
7.4
0.3
0.1
0.6
0.0
33
60
.00
.00
.37
.8-6
.52
33
8
Co
mm
erc
ial S
erv
ice
s5
45
.81
89
.24
61
.26
70
.55
78
.21
63
4.0
39
6.0
81
2.7
37
.71
73
88
.52
27
14
34
48
6.3
15
33
6.0
66
28
.94
79
1.1
-64
00
.35
48
42
77
55
6
Inte
rme
dia
te in
pu
t2
50
78
14
26
66
29
37
45
23
59
51
24
04
34
41
19
03
31
07
58
53
94
0,5
72
15
,33
61
6,5
72
11
,97
8-1
6,2
06
68
25
21
26
79
1
Co
mp
en
sa
tio
n fo
r e
mp
loye
e1
62
0.0
50
7.3
34
1.4
52
8.4
97
2.7
12
31
.34
57
.24
86
.34
4.9
16
97
1.2
23
16
1
Op
era
tin
g s
urp
lus
53
67
.83
02
4.4
80
1.5
11
84
.23
06
3.6
19
61
.89
97
.21
10
3.6
85
.82
63
80
.54
39
70
Su
bs
idy
& In
dir
ect ta
x1
15
.21
52
.52
66
.55
0.2
-70
4.9
11
9.9
-70
.37
6.9
17
.01
09
7.5
11
20
To
tal va
lue
ad
de
d7
10
33
68
41
40
91
76
33
33
13
31
31
38
41
66
71
48
44
44
96
82
52
To
tal In
pu
t9
61
04
49
84
07
54
69
97
85
49
26
43
78
85
10
73
38
77
55
61
26
79
1
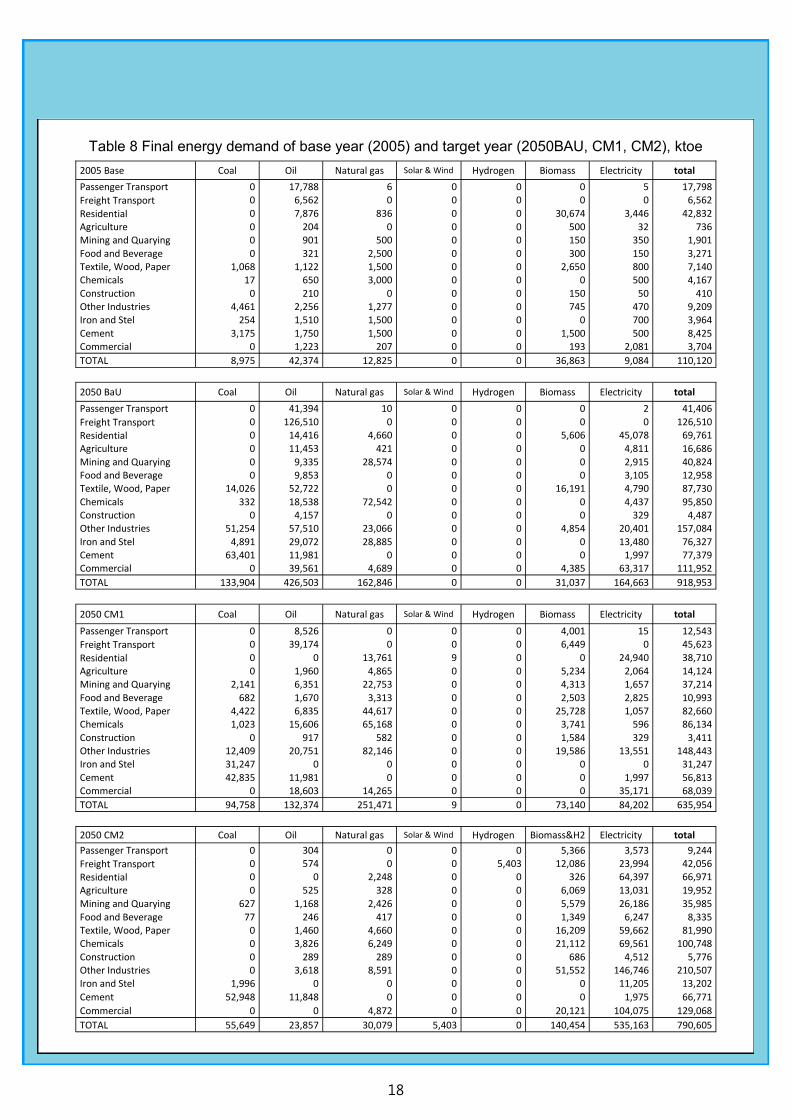
18
2005 Base Coal Oil Natural gas Solar & Wind Hydrogen Biomass Electricity total
Passenger Transport 0 17,788 6 0 0 0 5 17,798
Freight Transport 0 6,562 0 0 0 0 0 6,562
Residential 0 7,876 836 0 0 30,674 3,446 42,832
Agriculture 0 204 0 0 0 500 32 736 Mining and Quarying 0 901 500 0 0 150 350 1,901
Food and Beverage 0 321 2,500 0 0 300 150 3,271 Textile, Wood, Paper 1,068 1,122 1,500 0 0 2,650 800 7,140 Chemicals 17 650 3,000 0 0 0 500 4,167
Construction 0 210 0 0 0 150 50 410 Other Industries 4,461 2,256 1,277 0 0 745 470 9,209 Iron and Stel 254 1,510 1,500 0 0 0 700 3,964
Cement 3,175 1,750 1,500 0 0 1,500 500 8,425 Commercial 0 1,223 207 0 0 193 2,081 3,704
TOTAL 8,975 42,374 12,825 0 0 36,863 9,084 110,120
2050 BaU Coal Oil Natural gas Solar & Wind Hydrogen Biomass Electricity total
Passenger Transport 0 41,394 10 0 0 0 2 41,406
Freight Transport 0 126,510 0 0 0 0 0 126,510
Residential 0 14,416 4,660 0 0 5,606 45,078 69,761
Agriculture 0 11,453 421 0 0 0 4,811 16,686
Mining and Quarying 0 9,335 28,574 0 0 0 2,915 40,824 Food and Beverage 0 9,853 0 0 0 0 3,105 12,958 Textile, Wood, Paper 14,026 52,722 0 0 0 16,191 4,790 87,730
Chemicals 332 18,538 72,542 0 0 0 4,437 95,850 Construction 0 4,157 0 0 0 0 329 4,487 Other Industries 51,254 57,510 23,066 0 0 4,854 20,401 157,084
Iron and Stel 4,891 29,072 28,885 0 0 0 13,480 76,327 Cement 63,401 11,981 0 0 0 0 1,997 77,379 Commercial 0 39,561 4,689 0 0 4,385 63,317 111,952
TOTAL 133,904 426,503 162,846 0 0 31,037 164,663 918,953
2050 CM1 Coal Oil Natural gas Solar & Wind Hydrogen Biomass Electricity total
Passenger Transport 0 8,526 0 0 0 4,001 15 12,543
Freight Transport 0 39,174 0 0 0 6,449 0 45,623
Residential 0 0 13,761 9 0 0 24,940 38,710
Agriculture 0 1,960 4,865 0 0 5,234 2,064 14,124 Mining and Quarying 2,141 6,351 22,753 0 0 4,313 1,657 37,214
Food and Beverage 682 1,670 3,313 0 0 2,503 2,825 10,993 Textile, Wood, Paper 4,422 6,835 44,617 0 0 25,728 1,057 82,660 Chemicals 1,023 15,606 65,168 0 0 3,741 596 86,134
Construction 0 917 582 0 0 1,584 329 3,411 Other Industries 12,409 20,751 82,146 0 0 19,586 13,551 148,443 Iron and Stel 31,247 0 0 0 0 0 0 31,247
Cement 42,835 11,981 0 0 0 0 1,997 56,813 Commercial 0 18,603 14,265 0 0 0 35,171 68,039
TOTAL 94,758 132,374 251,471 9 0 73,140 84,202 635,954
2050 CM2 Coal Oil Natural gas Solar & Wind Hydrogen Biomass&H2 Electricity total
Passenger Transport 0 304 0 0 0 5,366 3,573 9,244
Freight Transport 0 574 0 0 5,403 12,086 23,994 42,056
Residential 0 0 2,248 0 0 326 64,397 66,971
Agriculture 0 525 328 0 0 6,069 13,031 19,952
Mining and Quarying 627 1,168 2,426 0 0 5,579 26,186 35,985
Food and Beverage 77 246 417 0 0 1,349 6,247 8,335 Textile, Wood, Paper 0 1,460 4,660 0 0 16,209 59,662 81,990 Chemicals 0 3,826 6,249 0 0 21,112 69,561 100,748
Construction 0 289 289 0 0 686 4,512 5,776 Other Industries 0 3,618 8,591 0 0 51,552 146,746 210,507 Iron and Stel 1,996 0 0 0 0 0 11,205 13,202
Cement 52,948 11,848 0 0 0 0 1,975 66,771
Commercial 0 0 4,872 0 0 20,121 104,075 129,068
TOTAL 55,649 23,857 30,079 5,403 0 140,454 535,163 790,605
Table 8 Final energy demand of base year (2005) and target year (2050BAU, CM1, CM2), ktoe
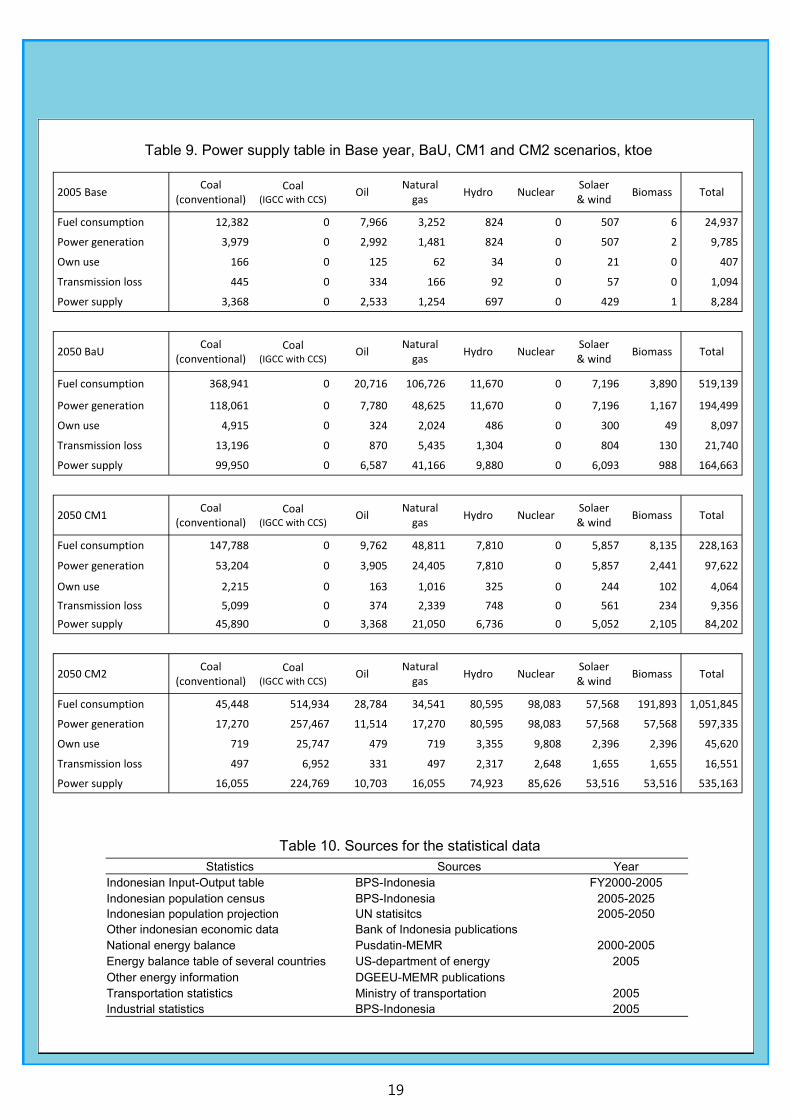
19
Statistics Sources Year
Indonesian Input-Output table BPS-Indonesia FY2000-2005
Indonesian population census BPS-Indonesia 2005-2025
Indonesian population projection UN statisitcs 2005-2050
Other indonesian economic data Bank of Indonesia publications
National energy balance Pusdatin-MEMR 2000-2005
Energy balance table of several countries US-department of energy 2005
Other energy information DGEEU-MEMR publications
Transportation statistics Ministry of transportation 2005
Industrial statistics BPS-Indonesia 2005
Table 10. Sources for the statistical data
2005 Base Coal
(conventional) Coal
(IGCC with CCS) Oil
Natural gas
Hydro Nuclear Solaer & wind
Biomass Total
Fuel consumption 12,382 0 7,966 3,252 824 0 507 6 24,937
Power generation 3,979 0 2,992 1,481 824 0 507 2 9,785
Own use 166 0 125 62 34 0 21 0 407
Transmission loss 445 0 334 166 92 0 57 0 1,094
Power supply 3,368 0 2,533 1,254 697 0 429 1 8,284
2050 BaU Coal
(conventional) Coal
(IGCC with CCS) Oil
Natural gas
Hydro Nuclear Solaer & wind
Biomass Total
Fuel consumption 368,941 0 20,716 106,726 11,670 0 7,196 3,890 519,139
Power generation 118,061 0 7,780 48,625 11,670 0 7,196 1,167 194,499
Own use 4,915 0 324 2,024 486 0 300 49 8,097
Transmission loss 13,196 0 870 5,435 1,304 0 804 130 21,740
Power supply 99,950 0 6,587 41,166 9,880 0 6,093 988 164,663
2050 CM1 Coal
(conventional) Coal
(IGCC with CCS) Oil
Natural gas
Hydro Nuclear Solaer & wind
Biomass Total
Fuel consumption 147,788 0 9,762 48,811 7,810 0 5,857 8,135 228,163
Power generation 53,204 0 3,905 24,405 7,810 0 5,857 2,441 97,622
Own use 2,215 0 163 1,016 325 0 244 102 4,064
Transmission loss 5,099 0 374 2,339 748 0 561 234 9,356
Power supply 45,890 0 3,368 21,050 6,736 0 5,052 2,105 84,202
2050 CM2 Coal
(conventional) Coal
(IGCC with CCS) Oil
Natural gas
Hydro Nuclear Solaer & wind
Biomass Total
Fuel consumption 45,448 514,934 28,784 34,541 80,595 98,083 57,568 191,893 1,051,845
Power generation 17,270 257,467 11,514 17,270 80,595 98,083 57,568 57,568 597,335
Own use 719 25,747 479 719 3,355 9,808 2,396 2,396 45,620
Transmission loss 497 6,952 331 497 2,317 2,648 1,655 1,655 16,551
Power supply 16,055 224,769 10,703 16,055 74,923 85,626 53,516 53,516 535,163
Table 9. Power supply table in Base year, BaU, CM1 and CM2 scenarios, ktoe

NIESNIES
Indonesia Low Carbon Society Vision of 2050 In Energy Sector
Institut Teknologi Bandung (ITB) - Indonesia Retno Gumilang Dewi Institute for Global Environmental Strategies (IGES) - Japan Takuro Kobashi Kyoto University - Japan Yuzuru Matsuoka Kei Gomi Mizuho Information & Research Institute - Japan Tomoki Ehara National Institute for Environmental Studies (NIES) - Japan Mikiko Kainuma Junichiro Fujino


![20070215 report e.pdf Japan: Clear Visions Make It ...2050.nies.go.jp/cop/cop13/presentation/Fujino_COP13.pdf · [vehicle-km per Pkm(Tkm)] Improve fuel economy [Fuel consumption per](https://img.pdfslide.us/doc/110x75/5cce13c588c993ca688cef9f/20070215-report-epdf-japan-clear-visions-make-it-2050niesgojpcopcop13presentationfujinocop13pdf.jpg)