Embed Size (px)
Citation preview
Energy optimization of existing datacenters- Save the planet AND you budget!
Bernhard Schott [email protected]
OGF25 Catania, 5th March 2009
Agenda
• Energy consumption• Why do we care?• How much, How fast?
• Platform’s path to a GreenHPC Data Center• Energy cost optimization methods
• Three easy steps to get on the “path”
12/09/08 2
• Three easy steps to get on the “path”1. Green Workload management by Platform LSF
2. Green Datacenter Daemon (NEW Product)
3. Green Monitoring - Visualization of a greener DC
• ROI: Green pays off!
• Summary
Energy consumption
12/09/08 3
Energy consumption – Why do we care?
About Green – What and why
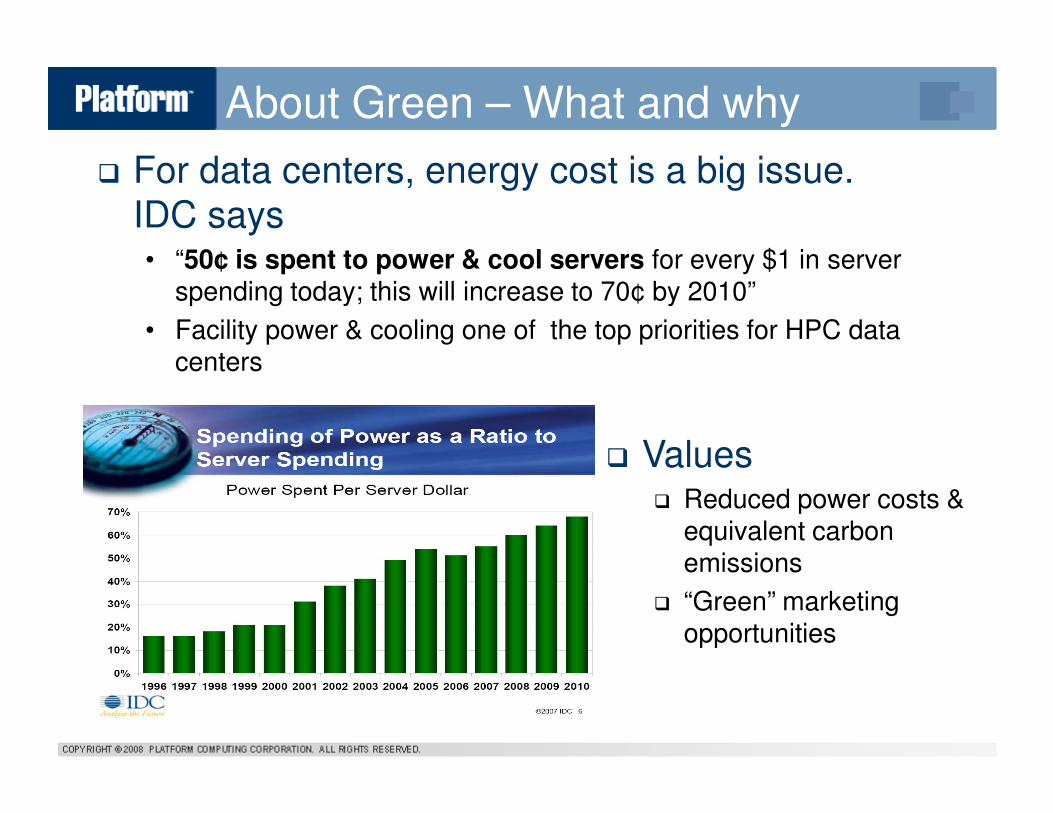
� For data centers, energy cost is a big issue. IDC says • “50¢ is spent to power & cool servers for every $1 in server
spending today; this will increase to 70¢ by 2010”
• Facility power & cooling one of the top priorities for HPC data centers
� Values� Reduced power costs &
equivalent carbon emissions
� “Green” marketing opportunities
Energy Efficiency Importance: EU
•“Western European* electricity consumption of 56 TWh per
year can be estimated for the year 2007 and is projected to
increase to 104 TWh per year by 2020…”*commercial sector
•The European Commission started the CoC program in 2007http://sunbird.jrc.it/energyefficiency/pdf/CoC%20data%20centres%20nov2008/CoC%20DC%20v%201.0%20FINAL.pdf
12/09/08 5
•The Code of Conduct on Data Centres describes steps to improve energy efficiency
•CoC compliance is voluntarily now, eventually becoming compulsory

Tune your Data Center
12/09/08 6
Tune your Data Centerfrom Red to Green
Energy Consumption Optimization Path
Smart Consumption– save energy/CO2 AND money
• Understand and control thermodynamic properties of workload and datacenter
Intuitively switching off some machines may
12/09/08 7
Intuitively switching off some machines may not be target leading to optimized power costs• Arbitrarily selected machine may yield insufficient saving
• Increases job latencies by start-up time
• Some sites reported system (20%) and hardware (1%) failures after power cycling, requiring administrator intervention. No hard evidence that this would happen under controlled conditions.
Please contribute your experience!
Energy Consumption Optimization Path
Platform LSF & GDD smart policies provide scheduling and control actions
• Use workload control before employing HW power down
• Profile applications with regards to energy consumption
• Profile HW with regards to energy consumption
12/09/08 8
• “Switch off” when appropriate to business demand policies
Energy consumption versus load
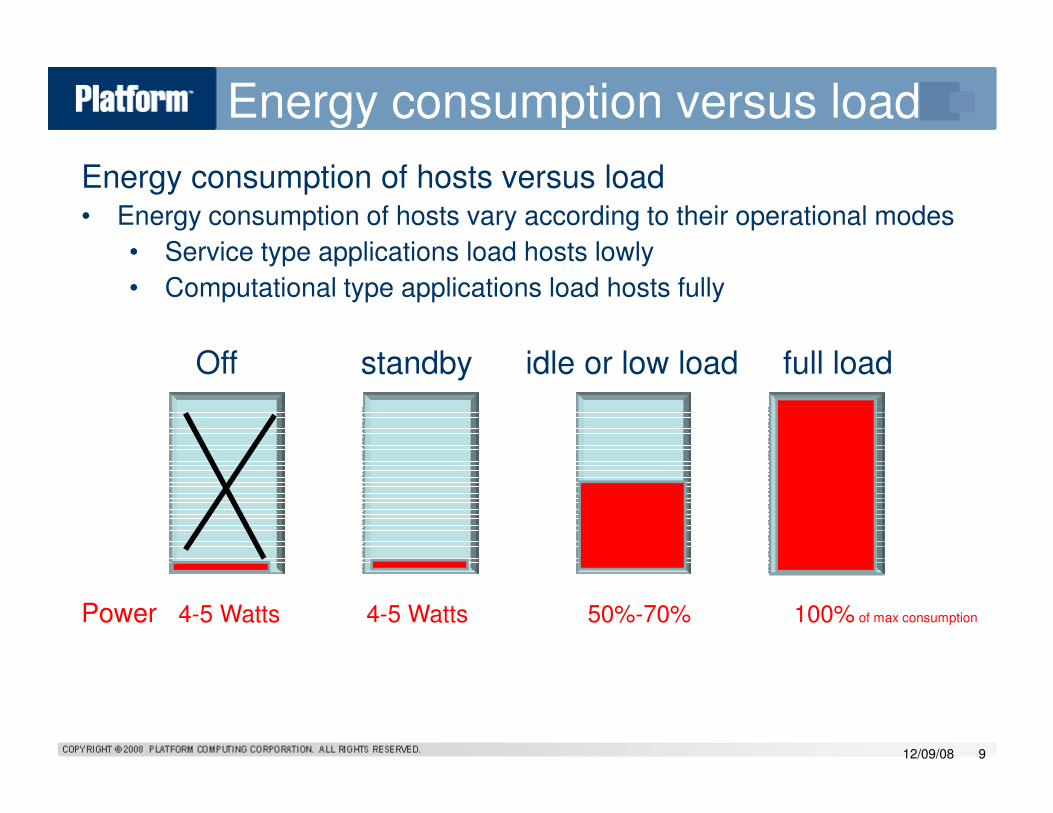
Energy consumption of hosts versus load • Energy consumption of hosts vary according to their operational modes
• Service type applications load hosts lowly
• Computational type applications load hosts fully
Off standby idle or low load full load
12/09/08 9
Power 4-5 Watts 4-5 Watts 50%-70% 100% of max consumption
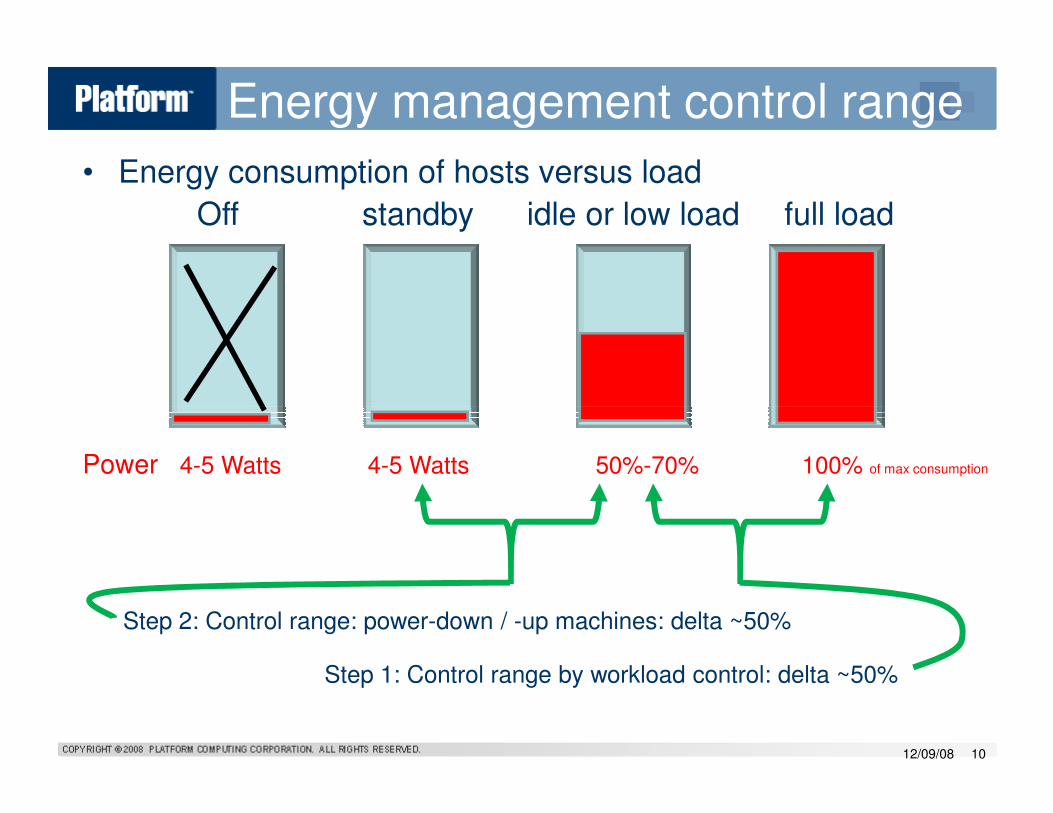
Energy management control range
• Energy consumption of hosts versus load
Off standby idle or low load full load
12/09/08 10
Power 4-5 Watts 4-5 Watts 50%-70% 100% of max consumption
Step 1: Control range by workload control: delta ~50%
Step 2: Control range: power-down / -up machines: delta ~50%
Three Steps to
12/09/08 11
Three Steps to Green-HPC
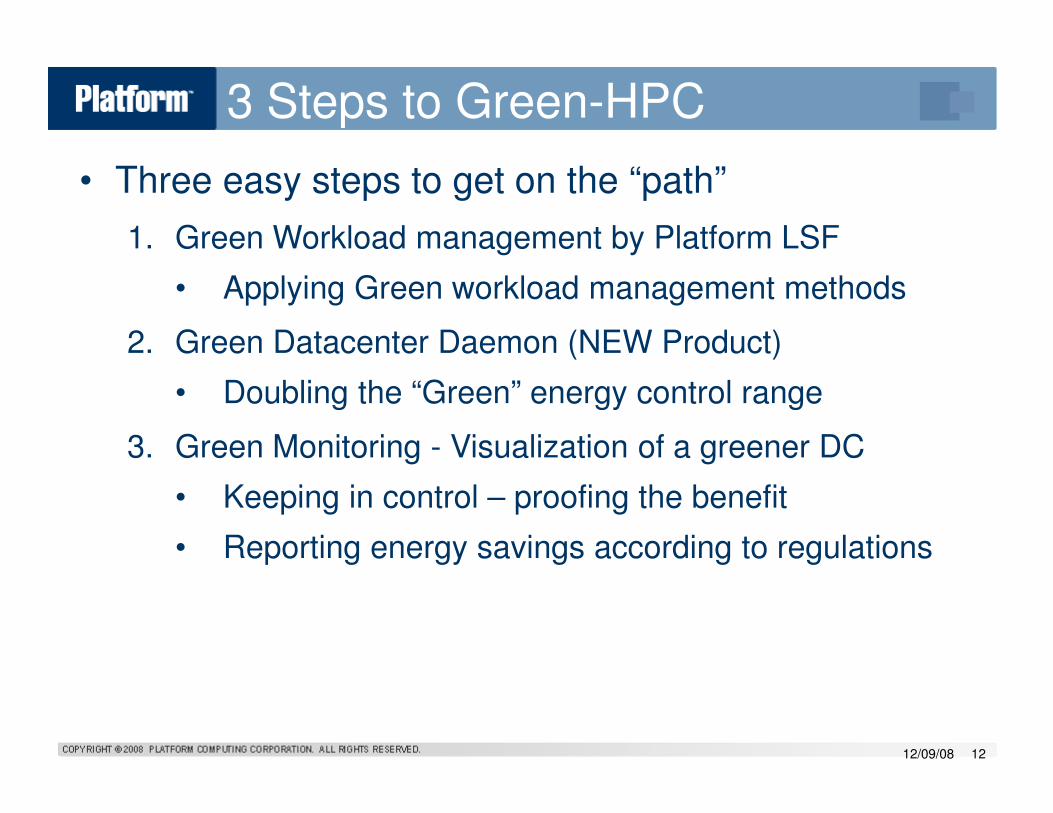
3 Steps to Green-HPC
• Three easy steps to get on the “path”
1. Green Workload management by Platform LSF
• Applying Green workload management methods
2. Green Datacenter Daemon (NEW Product)
• Doubling the “Green” energy control range
12/09/08 12
• Doubling the “Green” energy control range
3. Green Monitoring - Visualization of a greener DC
• Keeping in control – proofing the benefit
• Reporting energy savings according to regulations
Step 2
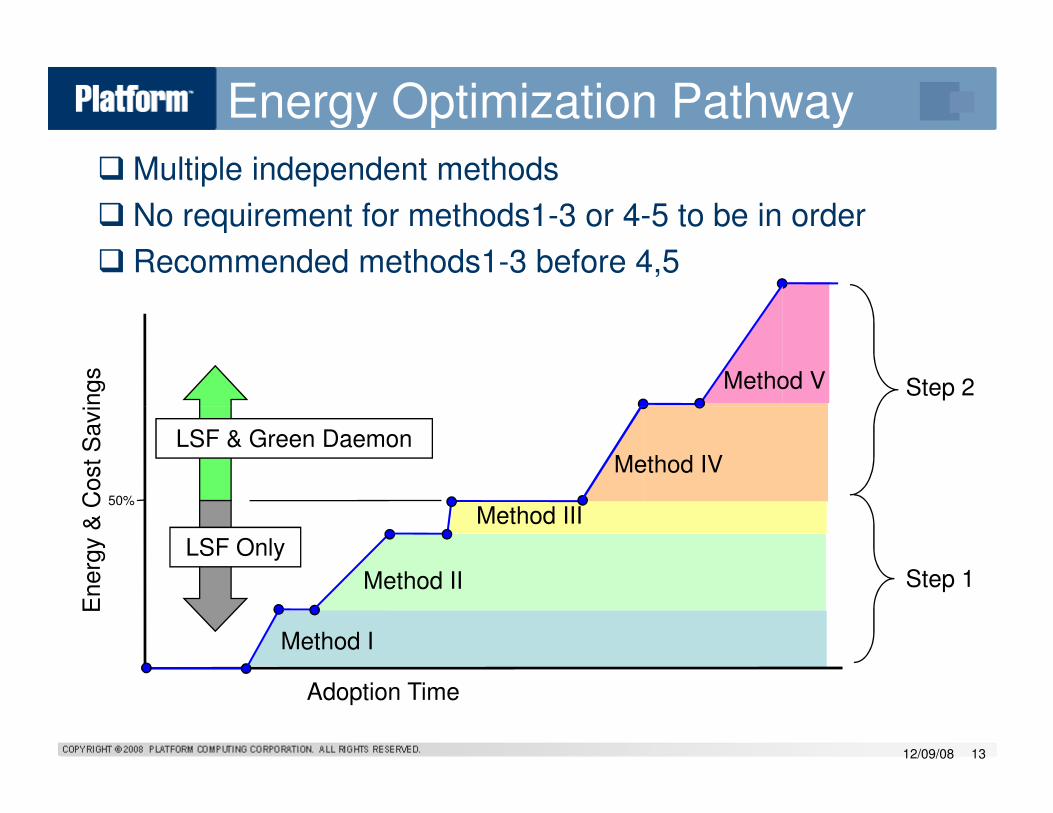
Energy Optimization PathwayC
ost
Savin
gs Method V
� Multiple independent methods
� No requirement for methods1-3 or 4-5 to be in order
� Recommended methods1-3 before 4,5
Step 1
12/09/08 13
Method I
Method II
Method III
Method IV
Energ
y &
Cost
Savin
gs
Adoption Time
LSF & Green Daemon
LSF Only
50%
Implementing Energy optimization
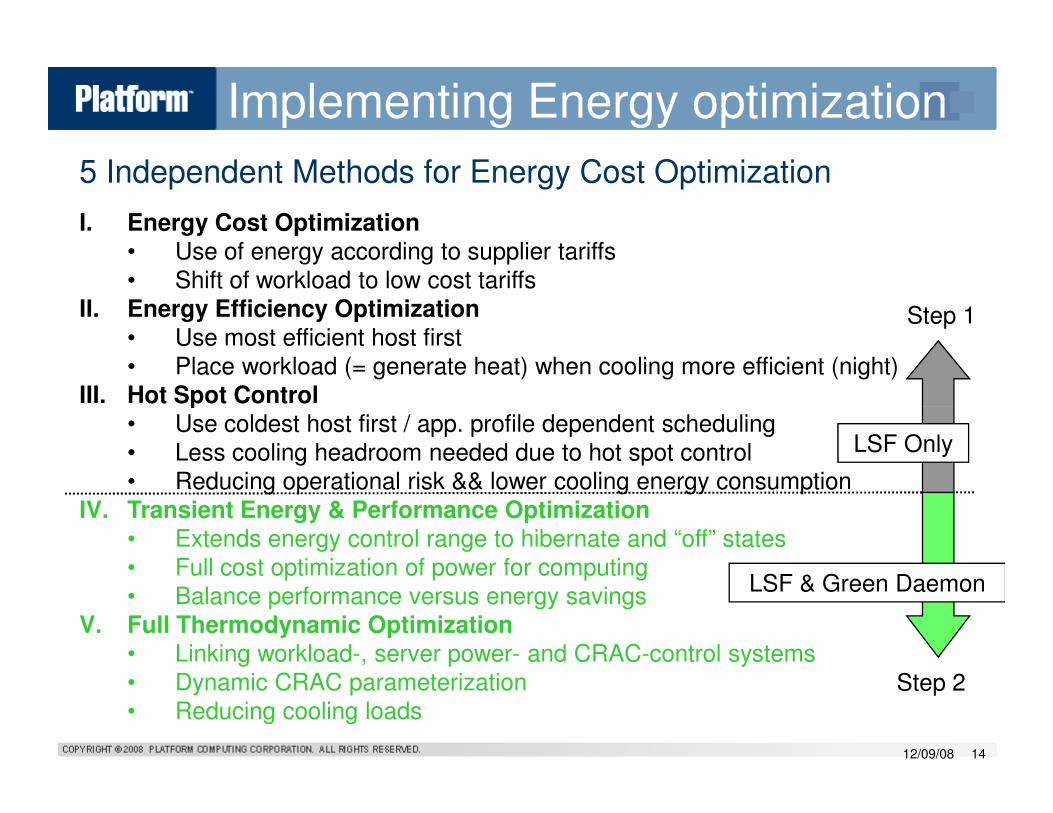
5 Independent Methods for Energy Cost Optimization
I. Energy Cost Optimization
• Use of energy according to supplier tariffs• Shift of workload to low cost tariffs
II. Energy Efficiency Optimization
• Use most efficient host first• Place workload (= generate heat) when cooling more efficient (night)
III. Hot Spot Control
Step 1
12/09/08 14
III. Hot Spot Control
• Use coldest host first / app. profile dependent scheduling• Less cooling headroom needed due to hot spot control• Reducing operational risk && lower cooling energy consumption
IV. Transient Energy & Performance Optimization • Extends energy control range to hibernate and “off” states• Full cost optimization of power for computing• Balance performance versus energy savings
V. Full Thermodynamic Optimization
• Linking workload-, server power- and CRAC-control systems• Dynamic CRAC parameterization • Reducing cooling loads
LSF & Green Daemon
LSF Only
Step 2
Step 1:Green Workload management
12/09/08 15
Green Workload management by Platform LSF-Applying Green workload management methods
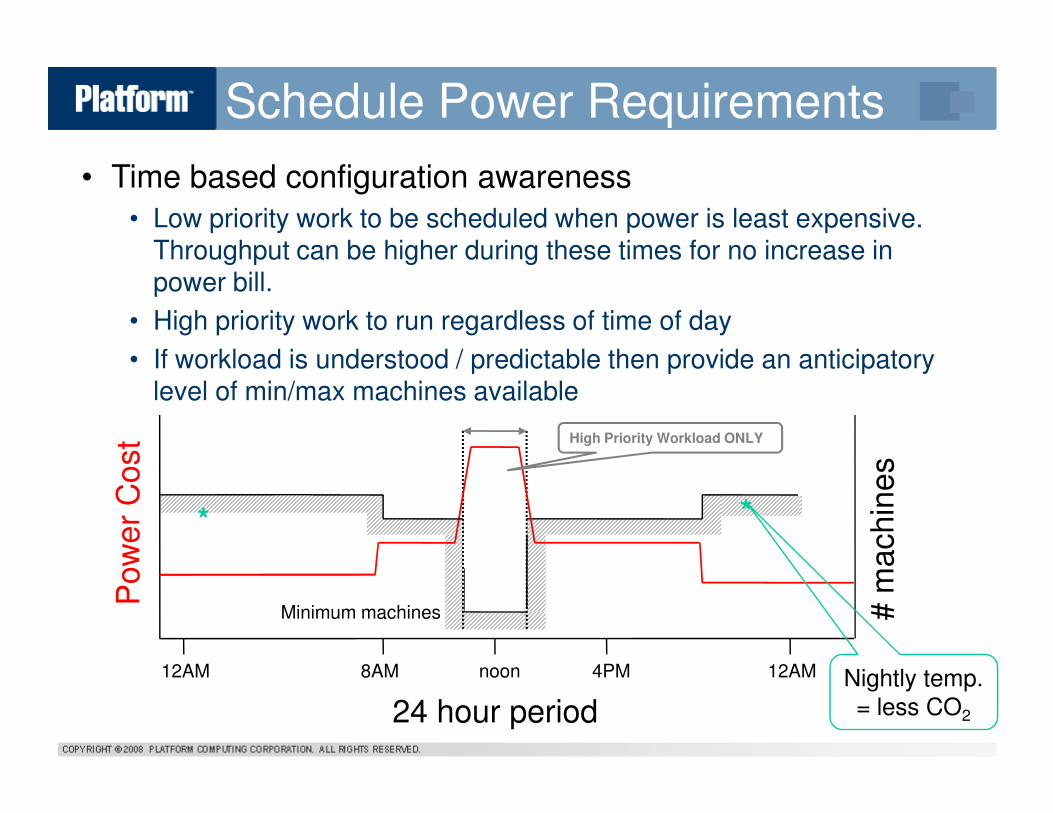
Schedule Power Requirements
• Time based configuration awareness
• Low priority work to be scheduled when power is least expensive. Throughput can be higher during these times for no increase in power bill.
• High priority work to run regardless of time of day
• If workload is understood / predictable then provide an anticipatory level of min/max machines available
Pow
er
Cost
24 hour period
12AM 8AM 4PM 12AM
# m
achin
es
Minimum machines
noon
High Priority Workload ONLY
Nightly temp.= less CO2
* *
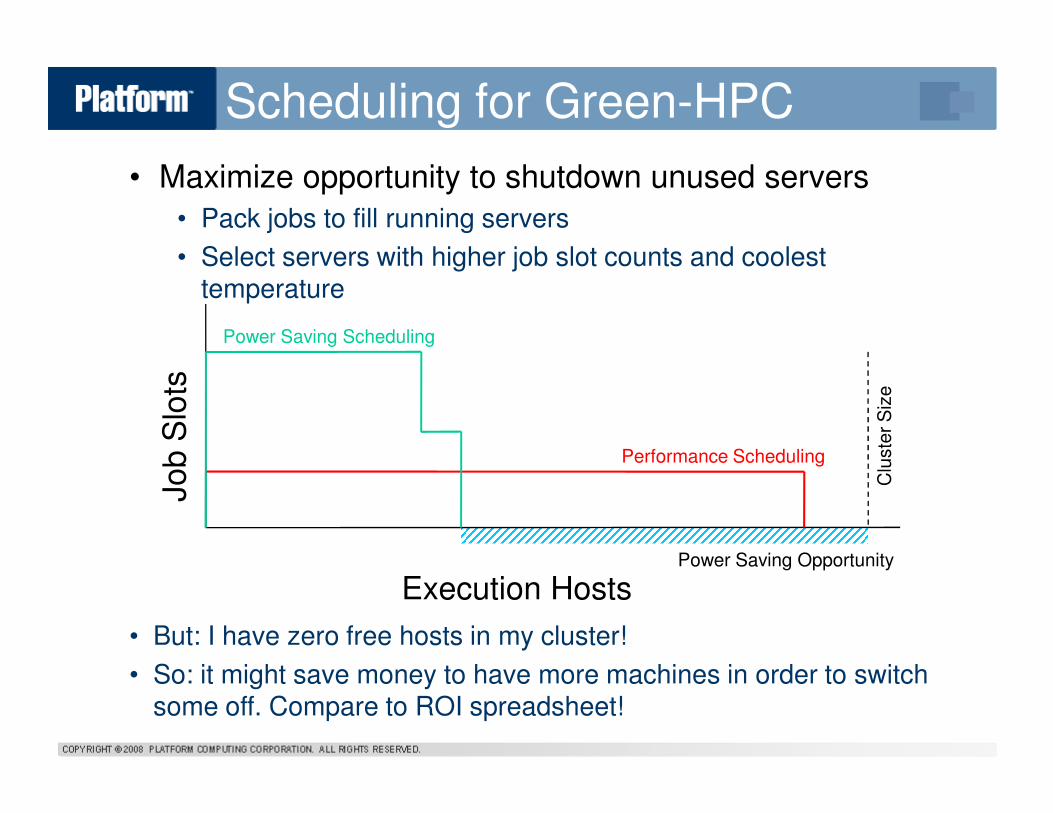
Scheduling for Green-HPC
• Maximize opportunity to shutdown unused servers
• Pack jobs to fill running servers
• Select servers with higher job slot counts and coolest temperature
Job S
lots
Power Saving Scheduling
Clu
ste
r S
ize
• But: I have zero free hosts in my cluster!
• So: it might save money to have more machines in order to switch some off. Compare to ROI spreadsheet!
Job S
lots
Execution Hosts
Performance Scheduling
Clu
ste
r S
ize
Power Saving Opportunity
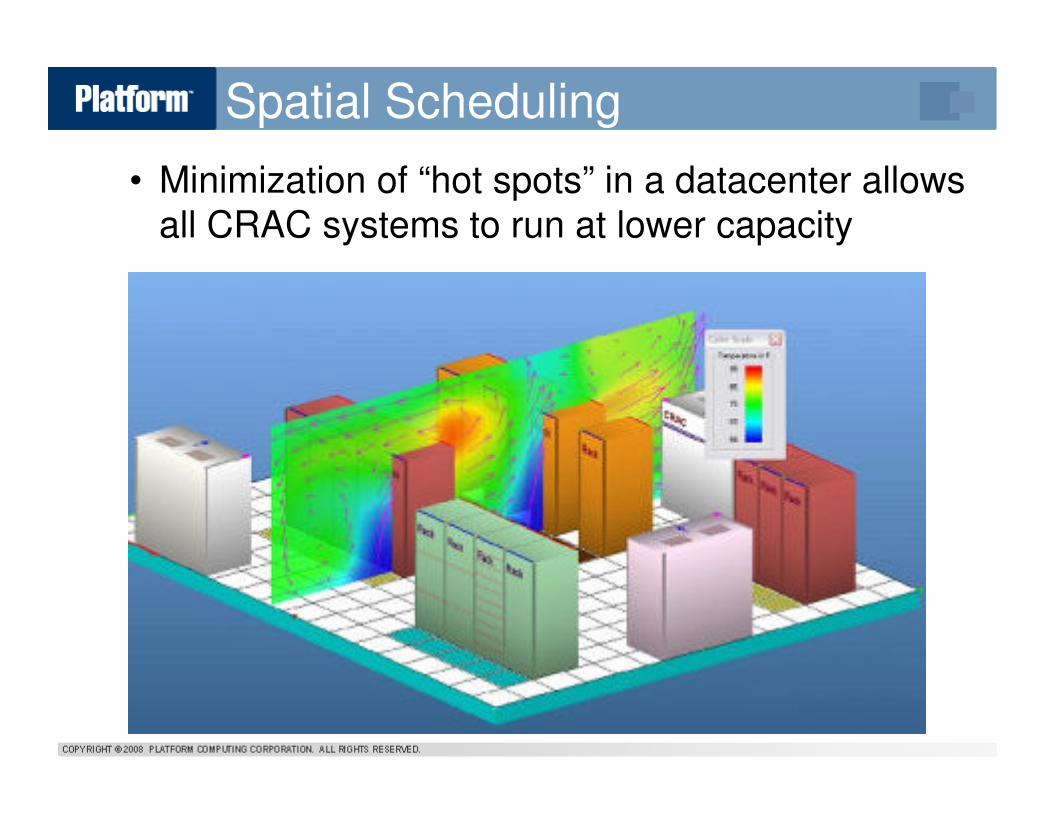
Spatial Scheduling
• Minimization of “hot spots” in a datacenter allows all CRAC systems to run at lower capacity
Step 2:Green Datacenter Daemon
12/09/08 19
Green Datacenter Daemon
Doubling the “Green” energy control range
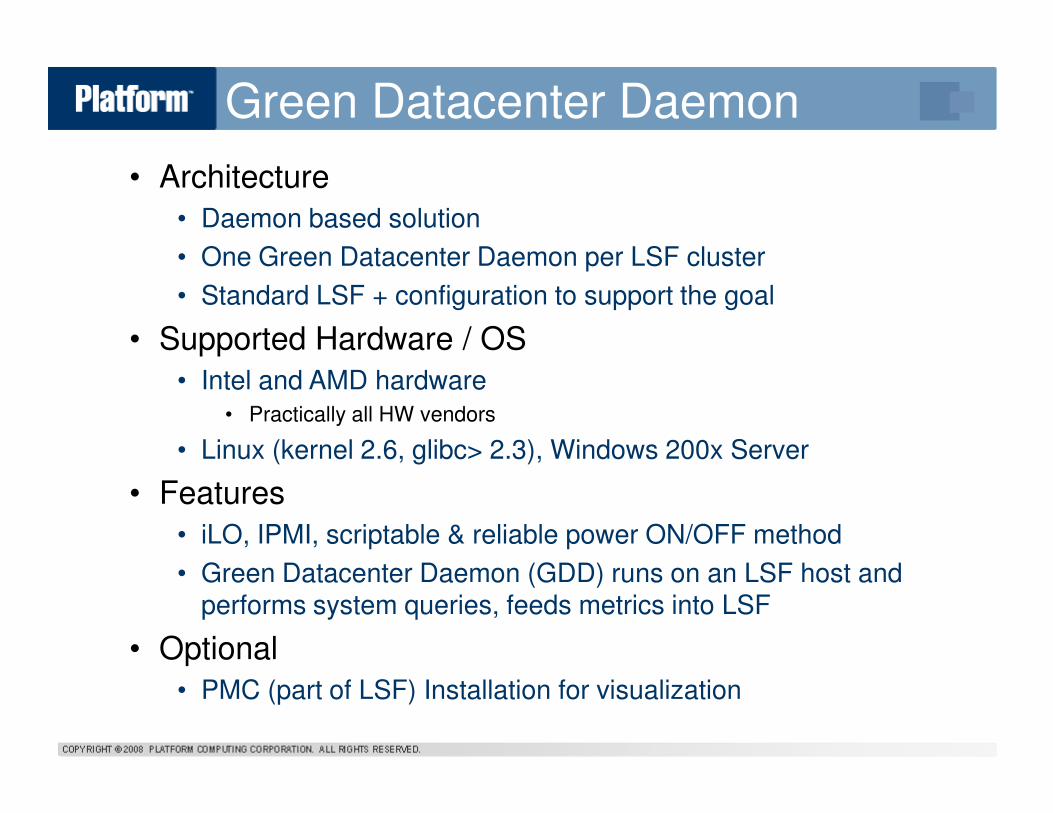
Green Datacenter Daemon
• Architecture
• Daemon based solution
• One Green Datacenter Daemon per LSF cluster
• Standard LSF + configuration to support the goal
• Supported Hardware / OS
• Intel and AMD hardware• Practically all HW vendors• Practically all HW vendors
• Linux (kernel 2.6, glibc> 2.3), Windows 200x Server
• Features
• iLO, IPMI, scriptable & reliable power ON/OFF method
• Green Datacenter Daemon (GDD) runs on an LSF host and performs system queries, feeds metrics into LSF
• Optional
• PMC (part of LSF) Installation for visualization
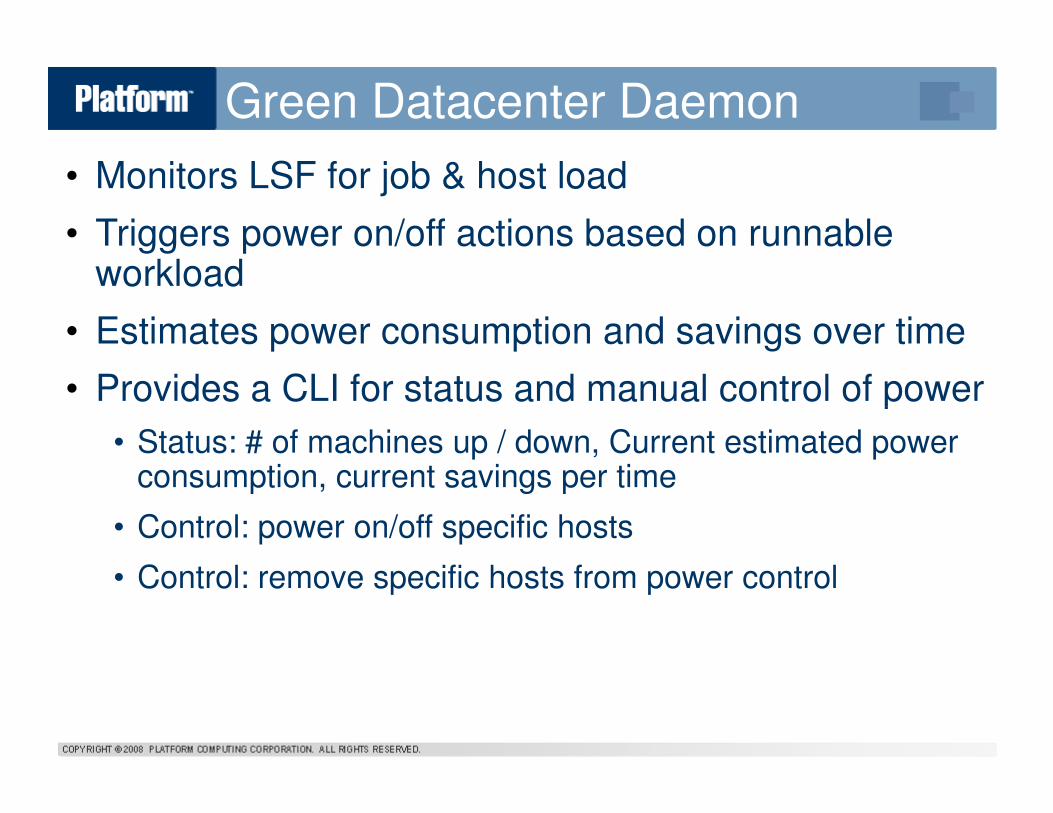
Green Datacenter Daemon
• Monitors LSF for job & host load
• Triggers power on/off actions based on runnable workload
• Estimates power consumption and savings over time
• Provides a CLI for status and manual control of power• Provides a CLI for status and manual control of power
• Status: # of machines up / down, Current estimated power consumption, current savings per time
• Control: power on/off specific hosts
• Control: remove specific hosts from power control
What about MTBF decrease?
• Power cycling compute hardware might cause increased failures or require manual intervention
• What does Platform’s GreenIT technology do to minimize the impact of this effect?
• Power thrash prevention
• Minimum duration of downtime and uptime per host
• Minimum number of runable pending before power action• Minimum number of runable pending before power action
• Maximum number of power cycles per server
• Power action in groups of servers
• Logging
• If a server is sent a power ON signal but does not join the LSF cluster within a certain time, that server is labelled as requiring manual intervention and removed from power control
Step 3:Green Monitoring - Visualization
12/09/08 23
Green Monitoring - Visualization
Report energy savings according to Energy Star or CoC
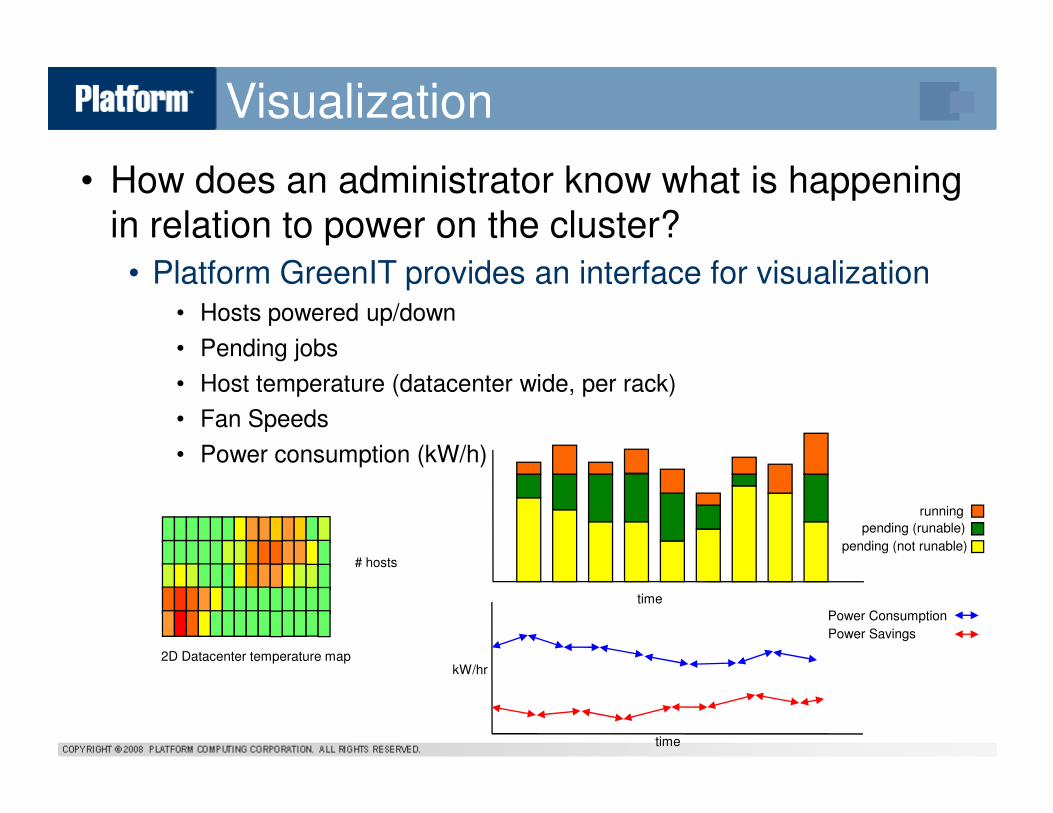
Visualization
• How does an administrator know what is happening in relation to power on the cluster?
• Platform GreenIT provides an interface for visualization• Hosts powered up/down
• Pending jobs
• Host temperature (datacenter wide, per rack)
• Fan Speeds• Fan Speeds
• Power consumption (kW/h)
running
pending (runable)
pending (not runable)
time
2D Datacenter temperature map
# hosts
Power Consumption
Power Savings
time
kW/hr

Green pays off
12/09/08 25
Green pays off – do the math!
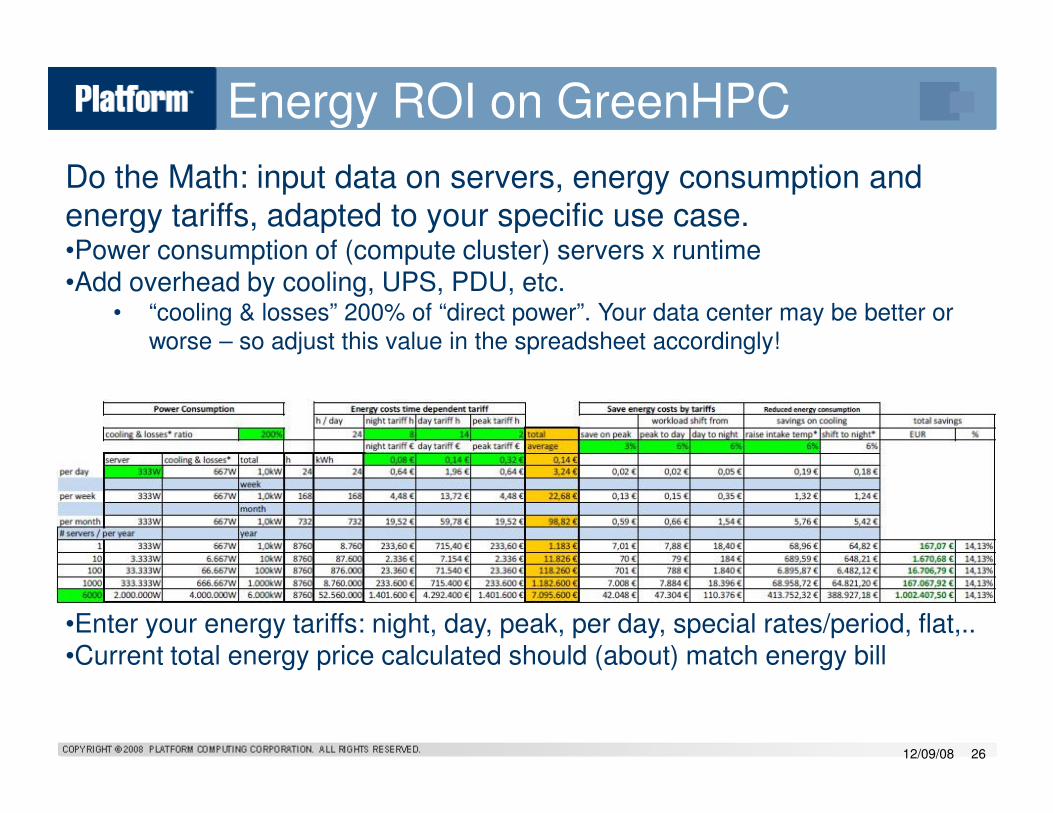
Energy ROI on GreenHPC
Do the Math: input data on servers, energy consumption and energy tariffs, adapted to your specific use case. •Power consumption of (compute cluster) servers x runtime •Add overhead by cooling, UPS, PDU, etc.
• “cooling & losses” 200% of “direct power”. Your data center may be better or worse – so adjust this value in the spreadsheet accordingly!
12/09/08 26
•Enter your energy tariffs: night, day, peak, per day, special rates/period, flat,..•Current total energy price calculated should (about) match energy bill
12/09/08 27
Summary
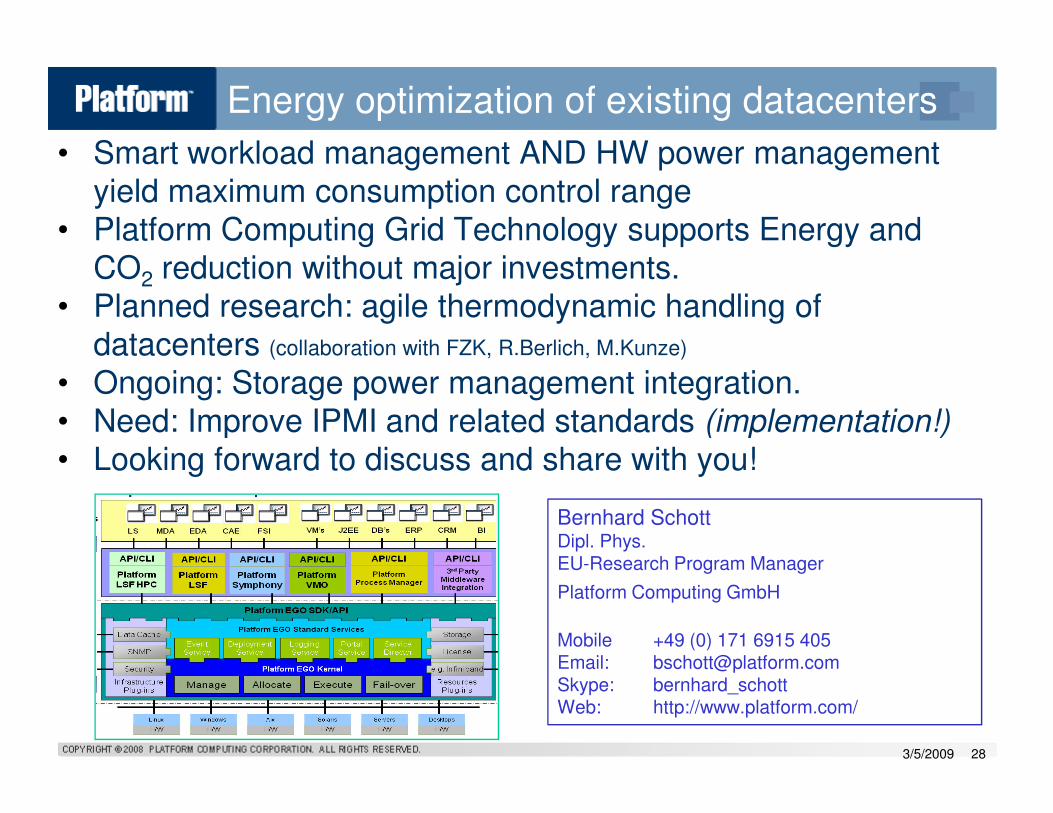
• Smart workload management AND HW power management yield maximum consumption control range
• Platform Computing Grid Technology supports Energy and CO2 reduction without major investments.
• Planned research: agile thermodynamic handling of datacenters (collaboration with FZK, R.Berlich, M.Kunze)
• Ongoing: Storage power management integration.• Need: Improve IPMI and related standards (implementation!)
Energy optimization of existing datacenters
• Need: Improve IPMI and related standards (implementation!)
• Looking forward to discuss and share with you!
3/5/2009 28
Bernhard SchottDipl. Phys.EU-Research Program Manager
Platform Computing GmbH
Mobile +49 (0) 171 6915 405Email: [email protected] Skype: bernhard_schottWeb: http://www.platform.com/