Embed Size (px)
Citation preview
on February 14, 2018http://rstb.royalsocietypublishing.org/Downloaded from
Phil. Trans. R. Soc. B (2010) 365, 2991–3006
doi:10.1098/rstb.2010.0172
Review
* Autho
While ththe viewand do
One conworld in
Energy and the food systemJeremy Woods1,*, Adrian Williams3, John K. Hughes4,
Mairi Black1 and Richard Murphy2
1Porter Alliance, Centre for Environmental Policy, and 2Porter Alliance, Department of Biology,Imperial College London, London SW7 2AZ, UK
3Natural Resources Management Centre, Department of Natural Resources, University of Cranfield,Bedford MK43 0AL, UK
4Agri-Environment and Land Use Strategy, Food and Environment Research Agency,Sand Hutton, York YO41 1LZ, UK
Modern agriculture is heavily dependent on fossil resources. Both direct energy use for crop man-agement and indirect energy use for fertilizers, pesticides and machinery production havecontributed to the major increases in food production seen since the 1960s. However, the relation-ship between energy inputs and yields is not linear. Low-energy inputs can lead to lower yields andperversely to higher energy demands per tonne of harvested product. At the other extreme, increas-ing energy inputs can lead to ever-smaller yield gains. Although fossil fuels remain the dominantsource of energy for agriculture, the mix of fuels used differs owing to the different fertilizationand cultivation requirements of individual crops. Nitrogen fertilizer production uses large amountsof natural gas and some coal, and can account for more than 50 per cent of total energy use incommercial agriculture. Oil accounts for between 30 and 75 per cent of energy inputs of UKagriculture, depending on the cropping system. While agriculture remains dependent on fossilsources of energy, food prices will couple to fossil energy prices and food production will remaina significant contributor to anthropogenic greenhouse gas emissions. Technological developments,changes in crop management, and renewable energy will all play important roles in increasing theenergy efficiency of agriculture and reducing its reliance of fossil resources.
Keywords: energy in agriculture; fossil energy; agricultural greenhouse gas emissions;land use; agroforestry; policy
1. INTRODUCTIONThe future for farming and agriculture holds manychallenges, not least the continued efforts to optimizeenergy inputs and reduce greenhouse gas (GHG)emissions. This needs to be set against the urgentand growing need to improve yields to meet the antici-pated requirements to provide food, feed, fuel,chemicals and materials for the growing global popu-lation. These challenges are and will increasingly beinfluenced by the availability and price of oil, naturalgas and coal, as well as by policies set to meetcarbon emissions targets and other sustainabilityrequirements. This paper aims to investigate theimpact of energy inputs on agricultural systems tothe farm gate, for the production of key commodities.It has a strong UK focus but draws conclusions wherepossible from an international perspective.
The paper reviews the impact of current and futureagricultural production on climate change and policies
r for correspondence ([email protected]).
e Government Office for Science commissioned this review,s are those of the author(s), are independent of Government,not constitute Government policy.
tribution of 23 to a Theme Issue ‘Food security: feeding the2050’.
2991
associated with reducing GHG emissions and finallyconsiders options for reducing the dependency ofagriculture on energy by considering alternatives,including the optimization and integration of landuse for multi-purpose outcomes.
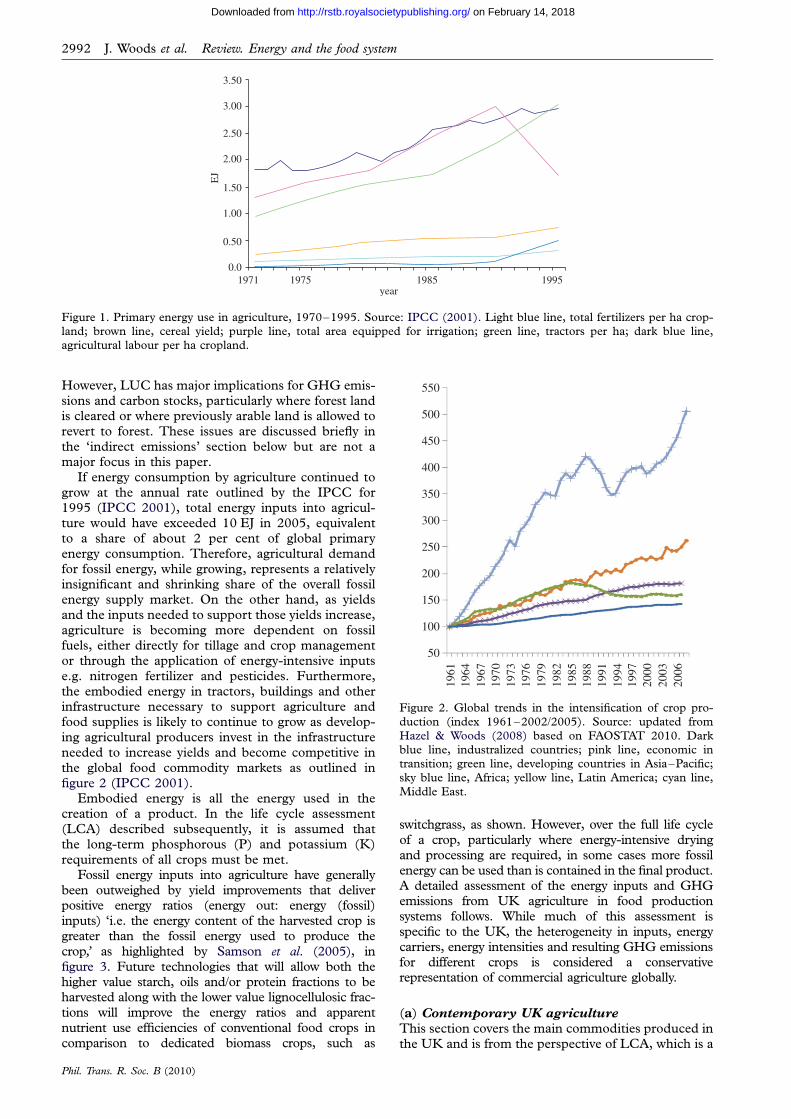
2. ENERGY USE FOR FOOD PRODUCTIONThe 3rd Assessment report of the IntergovernmentalPanel on Climate Change (IPCC 2001) estimatedthat by 1995, agriculture accounted for about 3 percent (9 EJ) of global energy consumption, but morethan 20 per cent of global GHG emissions. Figure 1highlights the trend of increasing energy inputs to agri-culture since 1971 and shows the high degree ofvariability both between regions and over time, forexample, the collapse in energy inputs in the formerUnion of Soviet Socialist Republic (USSR) after thefall of the iron curtain in 1989.
Substantial areas of agricultural land also came outof production as these (former USSR) farms becameexposed to global competition with governmentsunable to continue subsidizing production.
The links between agricultural energy inputs,yields, economic returns, land requirements andland-use change (LUC) needs further research.
This journal is # 2010 The Royal Society
3.50
3.00
2.50
2.00
1.50
EJ
1.00
0.50
0.01971 1975 1985 1995
year
Figure 1. Primary energy use in agriculture, 1970–1995. Source: IPCC (2001). Light blue line, total fertilizers per ha crop-land; brown line, cereal yield; purple line, total area equipped for irrigation; green line, tractors per ha; dark blue line,agricultural labour per ha cropland.
550
500
450
400
350
300
250
200
150
100
50
1961
1964
1967
1970
1973
1976
1979
1982
1985
1988
1991
1994
1997
2000
2003
2006
Figure 2. Global trends in the intensification of crop pro-duction (index 1961–2002/2005). Source: updated from
Hazel & Woods (2008) based on FAOSTAT 2010. Darkblue line, industralized countries; pink line, economic intransition; green line, developing countries in Asia–Pacific;sky blue line, Africa; yellow line, Latin America; cyan line,
Middle East.
2992 J. Woods et al. Review. Energy and the food system
on February 14, 2018http://rstb.royalsocietypublishing.org/Downloaded from
However, LUC has major implications for GHG emis-sions and carbon stocks, particularly where forest landis cleared or where previously arable land is allowed torevert to forest. These issues are discussed briefly inthe ‘indirect emissions’ section below but are not amajor focus in this paper.
If energy consumption by agriculture continued togrow at the annual rate outlined by the IPCC for1995 (IPCC 2001), total energy inputs into agricul-ture would have exceeded 10 EJ in 2005, equivalentto a share of about 2 per cent of global primaryenergy consumption. Therefore, agricultural demandfor fossil energy, while growing, represents a relativelyinsignificant and shrinking share of the overall fossilenergy supply market. On the other hand, as yieldsand the inputs needed to support those yields increase,agriculture is becoming more dependent on fossilfuels, either directly for tillage and crop managementor through the application of energy-intensive inputse.g. nitrogen fertilizer and pesticides. Furthermore,the embodied energy in tractors, buildings and otherinfrastructure necessary to support agriculture andfood supplies is likely to continue to grow as develop-ing agricultural producers invest in the infrastructureneeded to increase yields and become competitive inthe global food commodity markets as outlined infigure 2 (IPCC 2001).
Embodied energy is all the energy used in thecreation of a product. In the life cycle assessment(LCA) described subsequently, it is assumed thatthe long-term phosphorous (P) and potassium (K)requirements of all crops must be met.
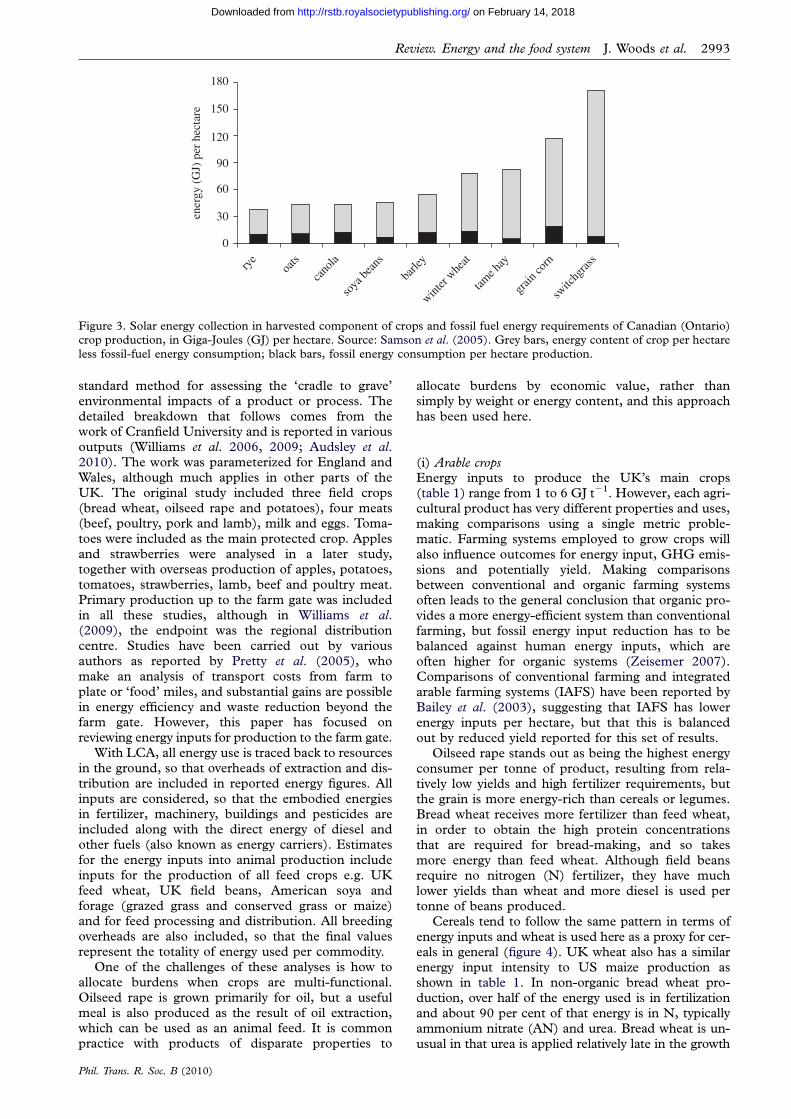
Fossil energy inputs into agriculture have generallybeen outweighed by yield improvements that deliverpositive energy ratios (energy out: energy (fossil)inputs) ‘i.e. the energy content of the harvested crop isgreater than the fossil energy used to produce thecrop,’ as highlighted by Samson et al. (2005), infigure 3. Future technologies that will allow both thehigher value starch, oils and/or protein fractions to beharvested along with the lower value lignocellulosic frac-tions will improve the energy ratios and apparentnutrient use efficiencies of conventional food crops incomparison to dedicated biomass crops, such as
Phil. Trans. R. Soc. B (2010)
switchgrass, as shown. However, over the full life cycleof a crop, particularly where energy-intensive dryingand processing are required, in some cases more fossilenergy can be used than is contained in the final product.A detailed assessment of the energy inputs and GHGemissions from UK agriculture in food productionsystems follows. While much of this assessment isspecific to the UK, the heterogeneity in inputs, energycarriers, energy intensities and resulting GHG emissionsfor different crops is considered a conservativerepresentation of commercial agriculture globally.
(a) Contemporary UK agriculture
This section covers the main commodities produced inthe UK and is from the perspective of LCA, which is a
180
150
120
ener
gy (
GJ)
per
hec
tare
90
60
30
0
rye
oats
cano
la
soya
bean
s
barle
y
winter
wheat
tame h
ay
grain
corn
switc
hgras
s
Figure 3. Solar energy collection in harvested component of crops and fossil fuel energy requirements of Canadian (Ontario)crop production, in Giga-Joules (GJ) per hectare. Source: Samson et al. (2005). Grey bars, energy content of crop per hectare
less fossil-fuel energy consumption; black bars, fossil energy consumption per hectare production.
Review. Energy and the food system J. Woods et al. 2993
on February 14, 2018http://rstb.royalsocietypublishing.org/Downloaded from
standard method for assessing the ‘cradle to grave’environmental impacts of a product or process. Thedetailed breakdown that follows comes from thework of Cranfield University and is reported in variousoutputs (Williams et al. 2006, 2009; Audsley et al.2010). The work was parameterized for England andWales, although much applies in other parts of theUK. The original study included three field crops(bread wheat, oilseed rape and potatoes), four meats(beef, poultry, pork and lamb), milk and eggs. Toma-toes were included as the main protected crop. Applesand strawberries were analysed in a later study,together with overseas production of apples, potatoes,tomatoes, strawberries, lamb, beef and poultry meat.Primary production up to the farm gate was includedin all these studies, although in Williams et al.(2009), the endpoint was the regional distributioncentre. Studies have been carried out by variousauthors as reported by Pretty et al. (2005), whomake an analysis of transport costs from farm toplate or ‘food’ miles, and substantial gains are possiblein energy efficiency and waste reduction beyond thefarm gate. However, this paper has focused onreviewing energy inputs for production to the farm gate.
With LCA, all energy use is traced back to resourcesin the ground, so that overheads of extraction and dis-tribution are included in reported energy figures. Allinputs are considered, so that the embodied energiesin fertilizer, machinery, buildings and pesticides areincluded along with the direct energy of diesel andother fuels (also known as energy carriers). Estimatesfor the energy inputs into animal production includeinputs for the production of all feed crops e.g. UKfeed wheat, UK field beans, American soya andforage (grazed grass and conserved grass or maize)and for feed processing and distribution. All breedingoverheads are also included, so that the final valuesrepresent the totality of energy used per commodity.
One of the challenges of these analyses is how toallocate burdens when crops are multi-functional.Oilseed rape is grown primarily for oil, but a usefulmeal is also produced as the result of oil extraction,which can be used as an animal feed. It is commonpractice with products of disparate properties to
Phil. Trans. R. Soc. B (2010)
allocate burdens by economic value, rather thansimply by weight or energy content, and this approachhas been used here.
(i) Arable cropsEnergy inputs to produce the UK’s main crops(table 1) range from 1 to 6 GJ t21. However, each agri-cultural product has very different properties and uses,making comparisons using a single metric proble-matic. Farming systems employed to grow crops willalso influence outcomes for energy input, GHG emis-sions and potentially yield. Making comparisonsbetween conventional and organic farming systemsoften leads to the general conclusion that organic pro-vides a more energy-efficient system than conventionalfarming, but fossil energy input reduction has to bebalanced against human energy inputs, which areoften higher for organic systems (Zeisemer 2007).Comparisons of conventional farming and integratedarable farming systems (IAFS) have been reported byBailey et al. (2003), suggesting that IAFS has lowerenergy inputs per hectare, but that this is balancedout by reduced yield reported for this set of results.
Oilseed rape stands out as being the highest energyconsumer per tonne of product, resulting from rela-tively low yields and high fertilizer requirements, butthe grain is more energy-rich than cereals or legumes.Bread wheat receives more fertilizer than feed wheat,in order to obtain the high protein concentrationsthat are required for bread-making, and so takesmore energy than feed wheat. Although field beansrequire no nitrogen (N) fertilizer, they have muchlower yields than wheat and more diesel is used pertonne of beans produced.
Cereals tend to follow the same pattern in terms ofenergy inputs and wheat is used here as a proxy for cer-eals in general (figure 4). UK wheat also has a similarenergy input intensity to US maize production asshown in table 1. In non-organic bread wheat pro-duction, over half of the energy used is in fertilizationand about 90 per cent of that energy is in N, typicallyammonium nitrate (AN) and urea. Bread wheat is un-usual in that urea is applied relatively late in the growth
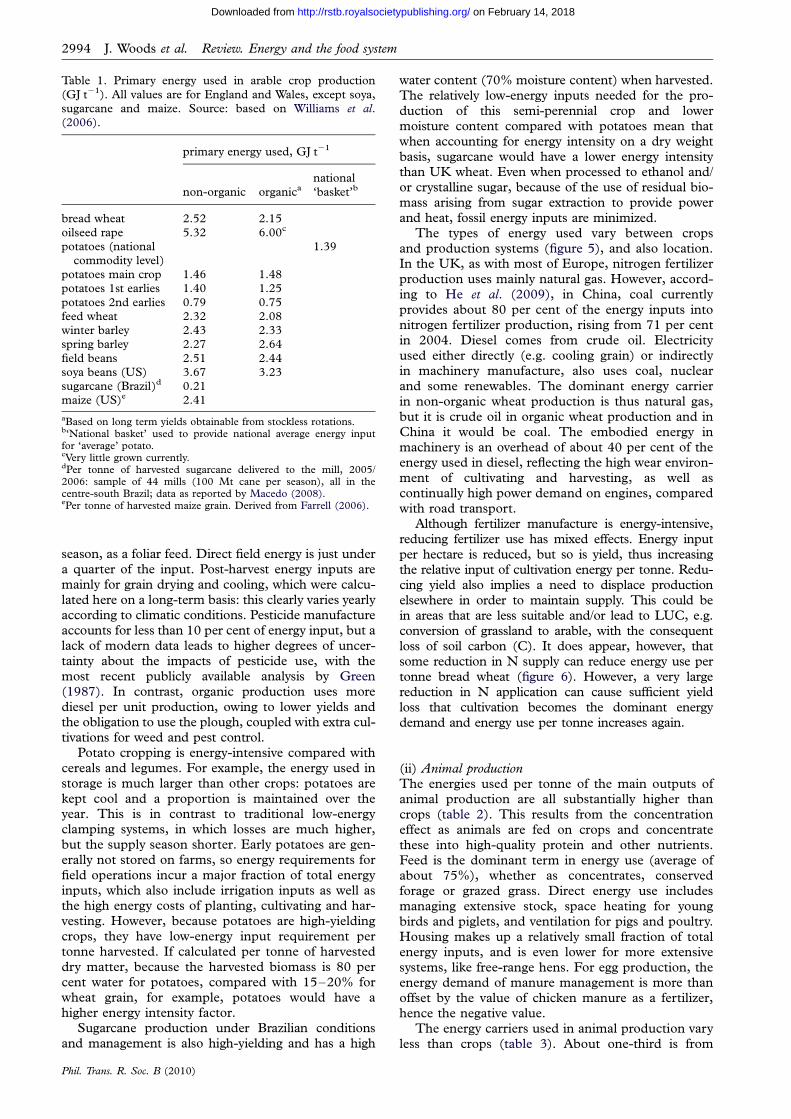
Table 1. Primary energy used in arable crop production
(GJ t21). All values are for England and Wales, except soya,sugarcane and maize. Source: based on Williams et al.(2006).
primary energy used, GJ t21
non-organic organicanational
‘basket’b
bread wheat 2.52 2.15
oilseed rape 5.32 6.00c
potatoes (nationalcommodity level)
1.39
potatoes main crop 1.46 1.48potatoes 1st earlies 1.40 1.25
potatoes 2nd earlies 0.79 0.75feed wheat 2.32 2.08winter barley 2.43 2.33spring barley 2.27 2.64
field beans 2.51 2.44soya beans (US) 3.67 3.23sugarcane (Brazil)d 0.21maize (US)e 2.41
aBased on long term yields obtainable from stockless rotations.b‘National basket’ used to provide national average energy inputfor ‘average’ potato.cVery little grown currently.dPer tonne of harvested sugarcane delivered to the mill, 2005/2006: sample of 44 mills (100 Mt cane per season), all in thecentre-south Brazil; data as reported by Macedo (2008).ePer tonne of harvested maize grain. Derived from Farrell (2006).
2994 J. Woods et al. Review. Energy and the food system
on February 14, 2018http://rstb.royalsocietypublishing.org/Downloaded from
season, as a foliar feed. Direct field energy is just undera quarter of the input. Post-harvest energy inputs aremainly for grain drying and cooling, which were calcu-lated here on a long-term basis: this clearly varies yearlyaccording to climatic conditions. Pesticide manufactureaccounts for less than 10 per cent of energy input, but alack of modern data leads to higher degrees of uncer-tainty about the impacts of pesticide use, with themost recent publicly available analysis by Green(1987). In contrast, organic production uses morediesel per unit production, owing to lower yields andthe obligation to use the plough, coupled with extra cul-tivations for weed and pest control.
Potato cropping is energy-intensive compared withcereals and legumes. For example, the energy used instorage is much larger than other crops: potatoes arekept cool and a proportion is maintained over theyear. This is in contrast to traditional low-energyclamping systems, in which losses are much higher,but the supply season shorter. Early potatoes are gen-erally not stored on farms, so energy requirements forfield operations incur a major fraction of total energyinputs, which also include irrigation inputs as well asthe high energy costs of planting, cultivating and har-vesting. However, because potatoes are high-yieldingcrops, they have low-energy input requirement pertonne harvested. If calculated per tonne of harvesteddry matter, because the harvested biomass is 80 percent water for potatoes, compared with 15–20% forwheat grain, for example, potatoes would have ahigher energy intensity factor.
Sugarcane production under Brazilian conditionsand management is also high-yielding and has a high
Phil. Trans. R. Soc. B (2010)
water content (70% moisture content) when harvested.The relatively low-energy inputs needed for the pro-duction of this semi-perennial crop and lowermoisture content compared with potatoes mean thatwhen accounting for energy intensity on a dry weightbasis, sugarcane would have a lower energy intensitythan UK wheat. Even when processed to ethanol and/or crystalline sugar, because of the use of residual bio-mass arising from sugar extraction to provide powerand heat, fossil energy inputs are minimized.
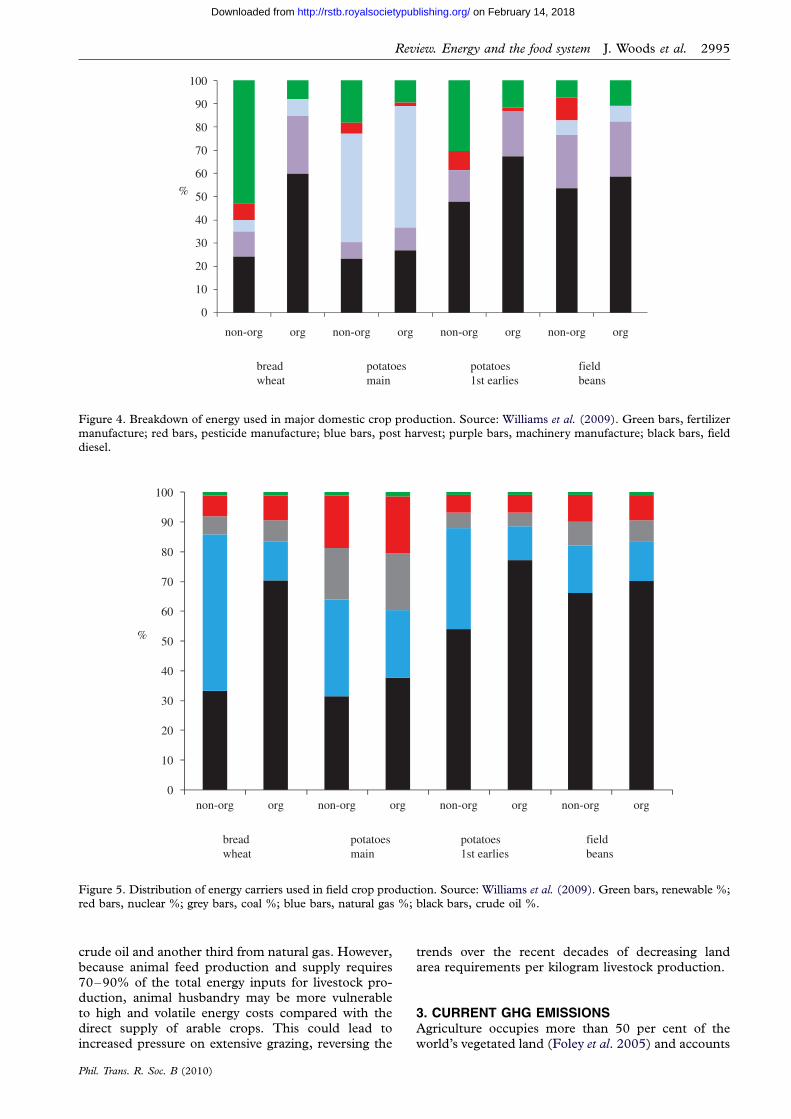
The types of energy used vary between cropsand production systems (figure 5), and also location.In the UK, as with most of Europe, nitrogen fertilizerproduction uses mainly natural gas. However, accord-ing to He et al. (2009), in China, coal currentlyprovides about 80 per cent of the energy inputs intonitrogen fertilizer production, rising from 71 per centin 2004. Diesel comes from crude oil. Electricityused either directly (e.g. cooling grain) or indirectlyin machinery manufacture, also uses coal, nuclearand some renewables. The dominant energy carrierin non-organic wheat production is thus natural gas,but it is crude oil in organic wheat production and inChina it would be coal. The embodied energy inmachinery is an overhead of about 40 per cent of theenergy used in diesel, reflecting the high wear environ-ment of cultivating and harvesting, as well ascontinually high power demand on engines, comparedwith road transport.
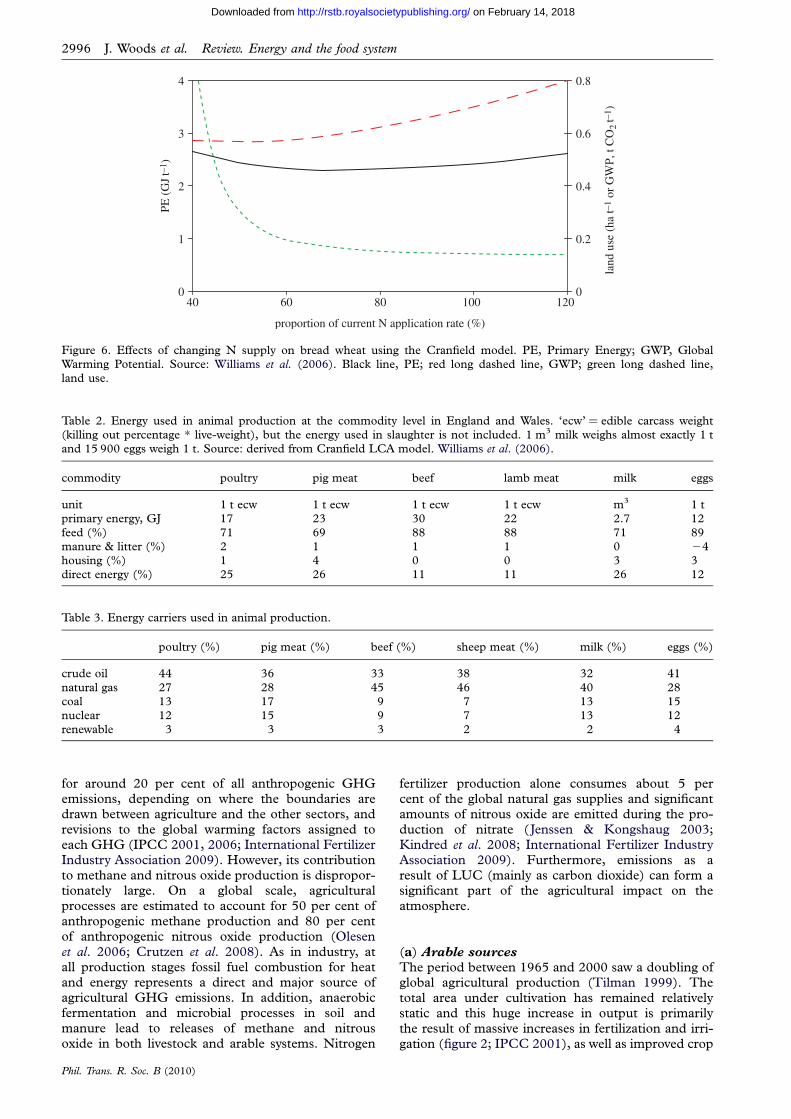
Although fertilizer manufacture is energy-intensive,reducing fertilizer use has mixed effects. Energy inputper hectare is reduced, but so is yield, thus increasingthe relative input of cultivation energy per tonne. Redu-cing yield also implies a need to displace productionelsewhere in order to maintain supply. This could bein areas that are less suitable and/or lead to LUC, e.g.conversion of grassland to arable, with the consequentloss of soil carbon (C). It does appear, however, thatsome reduction in N supply can reduce energy use pertonne bread wheat (figure 6). However, a very largereduction in N application can cause sufficient yieldloss that cultivation becomes the dominant energydemand and energy use per tonne increases again.
(ii) Animal productionThe energies used per tonne of the main outputs ofanimal production are all substantially higher thancrops (table 2). This results from the concentrationeffect as animals are fed on crops and concentratethese into high-quality protein and other nutrients.Feed is the dominant term in energy use (average ofabout 75%), whether as concentrates, conservedforage or grazed grass. Direct energy use includesmanaging extensive stock, space heating for youngbirds and piglets, and ventilation for pigs and poultry.Housing makes up a relatively small fraction of totalenergy inputs, and is even lower for more extensivesystems, like free-range hens. For egg production, theenergy demand of manure management is more thanoffset by the value of chicken manure as a fertilizer,hence the negative value.
The energy carriers used in animal production varyless than crops (table 3). About one-third is from
0
10
20
30
40
50%
60
70
80
90
100
non-org org non-org org non-org org non-org org
breadwheat
potatoesmain
potatoes1st earlies
fieldbeans
Figure 5. Distribution of energy carriers used in field crop production. Source: Williams et al. (2009). Green bars, renewable %;red bars, nuclear %; grey bars, coal %; blue bars, natural gas %; black bars, crude oil %.
0
10
20
30
40
% 50
60
70
80
90
100
non-org org non-org org non-org org non-org org
breadwheat
potatoesmain
potatoes1st earlies
fieldbeans
Figure 4. Breakdown of energy used in major domestic crop production. Source: Williams et al. (2009). Green bars, fertilizermanufacture; red bars, pesticide manufacture; blue bars, post harvest; purple bars, machinery manufacture; black bars, fielddiesel.
Review. Energy and the food system J. Woods et al. 2995
on February 14, 2018http://rstb.royalsocietypublishing.org/Downloaded from
crude oil and another third from natural gas. However,because animal feed production and supply requires70–90% of the total energy inputs for livestock pro-duction, animal husbandry may be more vulnerableto high and volatile energy costs compared with thedirect supply of arable crops. This could lead toincreased pressure on extensive grazing, reversing the
Phil. Trans. R. Soc. B (2010)
trends over the recent decades of decreasing landarea requirements per kilogram livestock production.
3. CURRENT GHG EMISSIONSAgriculture occupies more than 50 per cent of theworld’s vegetated land (Foley et al. 2005) and accounts
0
1
2
3
4
40 60 80 100 120
proportion of current N application rate (%)
PE (
GJ
t–1 )
0
0.2
0.4
0.6
0.8
land
use
(ha
t–1
or G
WP,
t C
O2
t–1 )
Figure 6. Effects of changing N supply on bread wheat using the Cranfield model. PE, Primary Energy; GWP, GlobalWarming Potential. Source: Williams et al. (2006). Black line, PE; red long dashed line, GWP; green long dashed line,land use.
Table 2. Energy used in animal production at the commodity level in England and Wales. ‘ecw’ ¼ edible carcass weight(killing out percentage * live-weight), but the energy used in slaughter is not included. 1 m3 milk weighs almost exactly 1 tand 15 900 eggs weigh 1 t. Source: derived from Cranfield LCA model. Williams et al. (2006).
commodity poultry pig meat beef lamb meat milk eggs
unit 1 t ecw 1 t ecw 1 t ecw 1 t ecw m3 1 tprimary energy, GJ 17 23 30 22 2.7 12
feed (%) 71 69 88 88 71 89manure & litter (%) 2 1 1 1 0 24housing (%) 1 4 0 0 3 3direct energy (%) 25 26 11 11 26 12
Table 3. Energy carriers used in animal production.
poultry (%) pig meat (%) beef (%) sheep meat (%) milk (%) eggs (%)
crude oil 44 36 33 38 32 41
natural gas 27 28 45 46 40 28coal 13 17 9 7 13 15nuclear 12 15 9 7 13 12renewable 3 3 3 2 2 4
2996 J. Woods et al. Review. Energy and the food system
on February 14, 2018http://rstb.royalsocietypublishing.org/Downloaded from
for around 20 per cent of all anthropogenic GHGemissions, depending on where the boundaries aredrawn between agriculture and the other sectors, andrevisions to the global warming factors assigned toeach GHG (IPCC 2001, 2006; International FertilizerIndustry Association 2009). However, its contributionto methane and nitrous oxide production is dispropor-tionately large. On a global scale, agriculturalprocesses are estimated to account for 50 per cent ofanthropogenic methane production and 80 per centof anthropogenic nitrous oxide production (Olesenet al. 2006; Crutzen et al. 2008). As in industry, atall production stages fossil fuel combustion for heatand energy represents a direct and major source ofagricultural GHG emissions. In addition, anaerobicfermentation and microbial processes in soil andmanure lead to releases of methane and nitrousoxide in both livestock and arable systems. Nitrogen
Phil. Trans. R. Soc. B (2010)
fertilizer production alone consumes about 5 percent of the global natural gas supplies and significantamounts of nitrous oxide are emitted during the pro-duction of nitrate (Jenssen & Kongshaug 2003;Kindred et al. 2008; International Fertilizer IndustryAssociation 2009). Furthermore, emissions as aresult of LUC (mainly as carbon dioxide) can form asignificant part of the agricultural impact on theatmosphere.
(a) Arable sources
The period between 1965 and 2000 saw a doubling ofglobal agricultural production (Tilman 1999). Thetotal area under cultivation has remained relativelystatic and this huge increase in output is primarilythe result of massive increases in fertilization and irri-gation (figure 2; IPCC 2001), as well as improved crop
Review. Energy and the food system J. Woods et al. 2997
on February 14, 2018http://rstb.royalsocietypublishing.org/Downloaded from
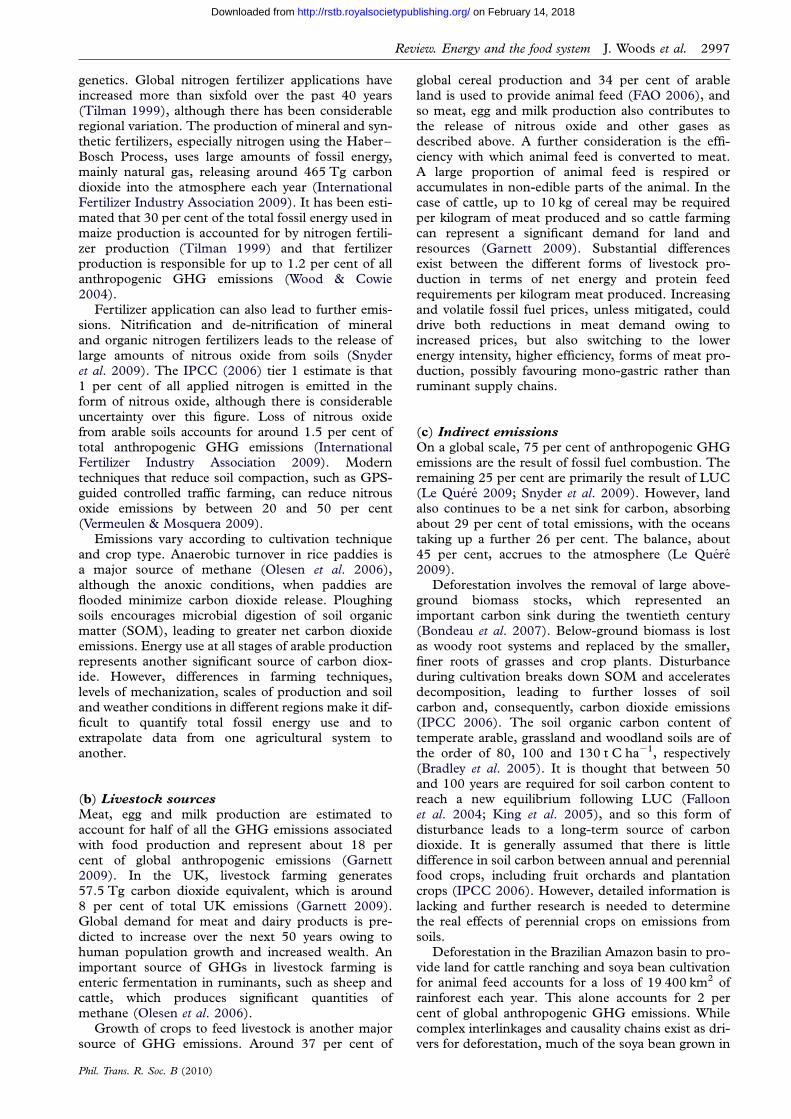
genetics. Global nitrogen fertilizer applications haveincreased more than sixfold over the past 40 years(Tilman 1999), although there has been considerableregional variation. The production of mineral and syn-thetic fertilizers, especially nitrogen using the Haber–Bosch Process, uses large amounts of fossil energy,mainly natural gas, releasing around 465 Tg carbondioxide into the atmosphere each year (InternationalFertilizer Industry Association 2009). It has been esti-mated that 30 per cent of the total fossil energy used inmaize production is accounted for by nitrogen fertili-zer production (Tilman 1999) and that fertilizerproduction is responsible for up to 1.2 per cent of allanthropogenic GHG emissions (Wood & Cowie2004).
Fertilizer application can also lead to further emis-sions. Nitrification and de-nitrification of mineraland organic nitrogen fertilizers leads to the release oflarge amounts of nitrous oxide from soils (Snyderet al. 2009). The IPCC (2006) tier 1 estimate is that1 per cent of all applied nitrogen is emitted in theform of nitrous oxide, although there is considerableuncertainty over this figure. Loss of nitrous oxidefrom arable soils accounts for around 1.5 per cent oftotal anthropogenic GHG emissions (InternationalFertilizer Industry Association 2009). Moderntechniques that reduce soil compaction, such as GPS-guided controlled traffic farming, can reduce nitrousoxide emissions by between 20 and 50 per cent(Vermeulen & Mosquera 2009).
Emissions vary according to cultivation techniqueand crop type. Anaerobic turnover in rice paddies isa major source of methane (Olesen et al. 2006),although the anoxic conditions, when paddies areflooded minimize carbon dioxide release. Ploughingsoils encourages microbial digestion of soil organicmatter (SOM), leading to greater net carbon dioxideemissions. Energy use at all stages of arable productionrepresents another significant source of carbon diox-ide. However, differences in farming techniques,levels of mechanization, scales of production and soiland weather conditions in different regions make it dif-ficult to quantify total fossil energy use and toextrapolate data from one agricultural system toanother.
(b) Livestock sources
Meat, egg and milk production are estimated toaccount for half of all the GHG emissions associatedwith food production and represent about 18 percent of global anthropogenic emissions (Garnett2009). In the UK, livestock farming generates57.5 Tg carbon dioxide equivalent, which is around8 per cent of total UK emissions (Garnett 2009).Global demand for meat and dairy products is pre-dicted to increase over the next 50 years owing tohuman population growth and increased wealth. Animportant source of GHGs in livestock farming isenteric fermentation in ruminants, such as sheep andcattle, which produces significant quantities ofmethane (Olesen et al. 2006).
Growth of crops to feed livestock is another majorsource of GHG emissions. Around 37 per cent of
Phil. Trans. R. Soc. B (2010)
global cereal production and 34 per cent of arableland is used to provide animal feed (FAO 2006), andso meat, egg and milk production also contributes tothe release of nitrous oxide and other gases asdescribed above. A further consideration is the effi-ciency with which animal feed is converted to meat.A large proportion of animal feed is respired oraccumulates in non-edible parts of the animal. In thecase of cattle, up to 10 kg of cereal may be requiredper kilogram of meat produced and so cattle farmingcan represent a significant demand for land andresources (Garnett 2009). Substantial differencesexist between the different forms of livestock pro-duction in terms of net energy and protein feedrequirements per kilogram meat produced. Increasingand volatile fossil fuel prices, unless mitigated, coulddrive both reductions in meat demand owing toincreased prices, but also switching to the lowerenergy intensity, higher efficiency, forms of meat pro-duction, possibly favouring mono-gastric rather thanruminant supply chains.
(c) Indirect emissions
On a global scale, 75 per cent of anthropogenic GHGemissions are the result of fossil fuel combustion. Theremaining 25 per cent are primarily the result of LUC(Le Quere 2009; Snyder et al. 2009). However, landalso continues to be a net sink for carbon, absorbingabout 29 per cent of total emissions, with the oceanstaking up a further 26 per cent. The balance, about45 per cent, accrues to the atmosphere (Le Quere2009).
Deforestation involves the removal of large above-ground biomass stocks, which represented animportant carbon sink during the twentieth century(Bondeau et al. 2007). Below-ground biomass is lostas woody root systems and replaced by the smaller,finer roots of grasses and crop plants. Disturbanceduring cultivation breaks down SOM and acceleratesdecomposition, leading to further losses of soilcarbon and, consequently, carbon dioxide emissions(IPCC 2006). The soil organic carbon content oftemperate arable, grassland and woodland soils are ofthe order of 80, 100 and 130 t C ha21, respectively(Bradley et al. 2005). It is thought that between 50and 100 years are required for soil carbon content toreach a new equilibrium following LUC (Falloonet al. 2004; King et al. 2005), and so this form ofdisturbance leads to a long-term source of carbondioxide. It is generally assumed that there is littledifference in soil carbon between annual and perennialfood crops, including fruit orchards and plantationcrops (IPCC 2006). However, detailed information islacking and further research is needed to determinethe real effects of perennial crops on emissions fromsoils.
Deforestation in the Brazilian Amazon basin to pro-vide land for cattle ranching and soya bean cultivationfor animal feed accounts for a loss of 19 400 km2 ofrainforest each year. This alone accounts for 2 percent of global anthropogenic GHG emissions. Whilecomplex interlinkages and causality chains exist as dri-vers for deforestation, much of the soya bean grown in
$18
$16
$14
$12
$10
$8
$6
$4
$2
$0
1972
1975
1978
1981
1984
1987
1990
1993
1996
1999
2002
2005
2008
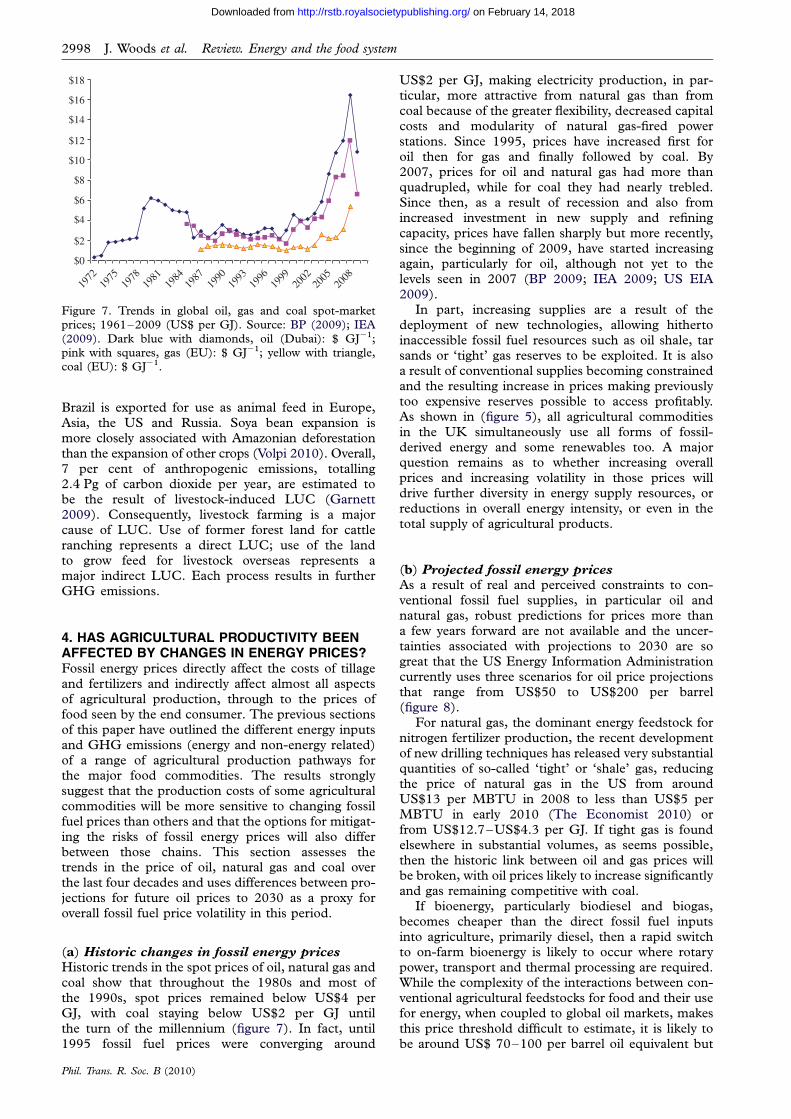
Figure 7. Trends in global oil, gas and coal spot-marketprices; 1961–2009 (US$ per GJ). Source: BP (2009); IEA
(2009). Dark blue with diamonds, oil (Dubai): $ GJ21;pink with squares, gas (EU): $ GJ21; yellow with triangle,coal (EU): $ GJ21.
2998 J. Woods et al. Review. Energy and the food system
on February 14, 2018http://rstb.royalsocietypublishing.org/Downloaded from
Brazil is exported for use as animal feed in Europe,Asia, the US and Russia. Soya bean expansion ismore closely associated with Amazonian deforestationthan the expansion of other crops (Volpi 2010). Overall,7 per cent of anthropogenic emissions, totalling2.4 Pg of carbon dioxide per year, are estimated tobe the result of livestock-induced LUC (Garnett2009). Consequently, livestock farming is a majorcause of LUC. Use of former forest land for cattleranching represents a direct LUC; use of the landto grow feed for livestock overseas represents amajor indirect LUC. Each process results in furtherGHG emissions.
4. HAS AGRICULTURAL PRODUCTIVITY BEENAFFECTED BY CHANGES IN ENERGY PRICES?Fossil energy prices directly affect the costs of tillageand fertilizers and indirectly affect almost all aspectsof agricultural production, through to the prices offood seen by the end consumer. The previous sectionsof this paper have outlined the different energy inputsand GHG emissions (energy and non-energy related)of a range of agricultural production pathways forthe major food commodities. The results stronglysuggest that the production costs of some agriculturalcommodities will be more sensitive to changing fossilfuel prices than others and that the options for mitigat-ing the risks of fossil energy prices will also differbetween those chains. This section assesses thetrends in the price of oil, natural gas and coal overthe last four decades and uses differences between pro-jections for future oil prices to 2030 as a proxy foroverall fossil fuel price volatility in this period.
(a) Historic changes in fossil energy prices
Historic trends in the spot prices of oil, natural gas andcoal show that throughout the 1980s and most ofthe 1990s, spot prices remained below US$4 perGJ, with coal staying below US$2 per GJ untilthe turn of the millennium (figure 7). In fact, until1995 fossil fuel prices were converging around
Phil. Trans. R. Soc. B (2010)
US$2 per GJ, making electricity production, in par-ticular, more attractive from natural gas than fromcoal because of the greater flexibility, decreased capitalcosts and modularity of natural gas-fired powerstations. Since 1995, prices have increased first foroil then for gas and finally followed by coal. By2007, prices for oil and natural gas had more thanquadrupled, while for coal they had nearly trebled.Since then, as a result of recession and also fromincreased investment in new supply and refiningcapacity, prices have fallen sharply but more recently,since the beginning of 2009, have started increasingagain, particularly for oil, although not yet to thelevels seen in 2007 (BP 2009; IEA 2009; US EIA2009).
In part, increasing supplies are a result of thedeployment of new technologies, allowing hithertoinaccessible fossil fuel resources such as oil shale, tarsands or ‘tight’ gas reserves to be exploited. It is alsoa result of conventional supplies becoming constrainedand the resulting increase in prices making previouslytoo expensive reserves possible to access profitably.As shown in (figure 5), all agricultural commoditiesin the UK simultaneously use all forms of fossil-derived energy and some renewables too. A majorquestion remains as to whether increasing overallprices and increasing volatility in those prices willdrive further diversity in energy supply resources, orreductions in overall energy intensity, or even in thetotal supply of agricultural products.
(b) Projected fossil energy prices
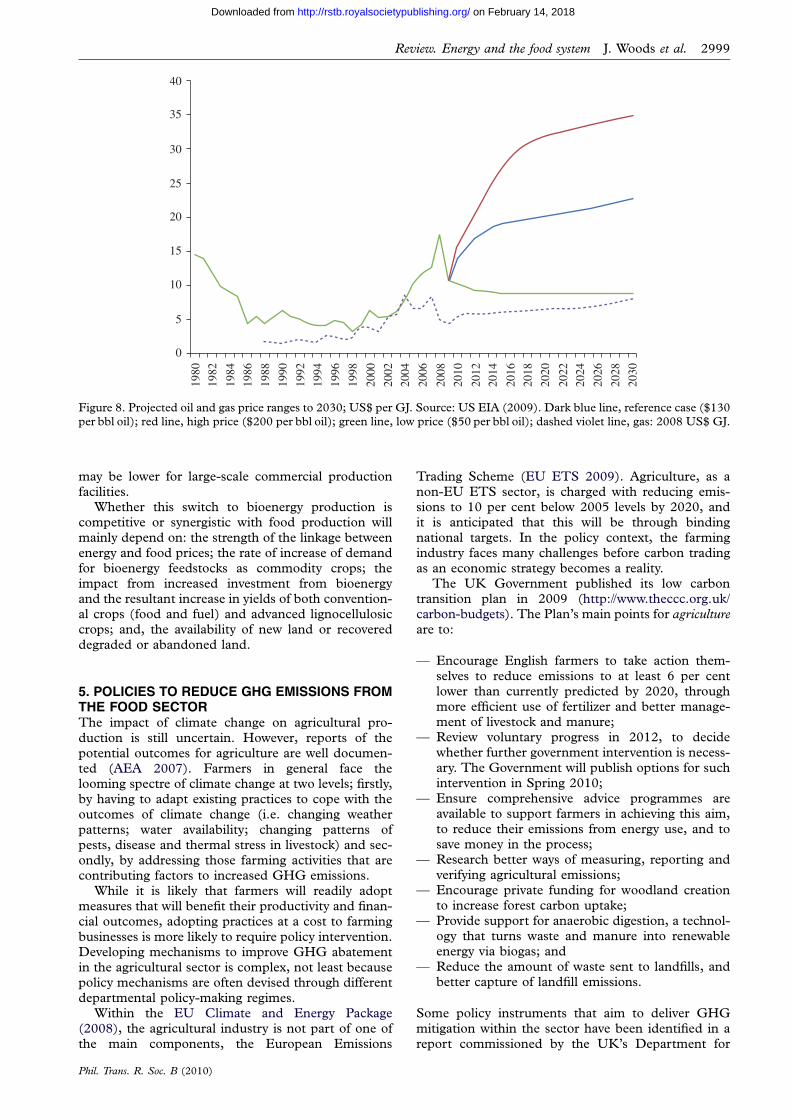
As a result of real and perceived constraints to con-ventional fossil fuel supplies, in particular oil andnatural gas, robust predictions for prices more thana few years forward are not available and the uncer-tainties associated with projections to 2030 are sogreat that the US Energy Information Administrationcurrently uses three scenarios for oil price projectionsthat range from US$50 to US$200 per barrel(figure 8).
For natural gas, the dominant energy feedstock fornitrogen fertilizer production, the recent developmentof new drilling techniques has released very substantialquantities of so-called ‘tight’ or ‘shale’ gas, reducingthe price of natural gas in the US from aroundUS$13 per MBTU in 2008 to less than US$5 perMBTU in early 2010 (The Economist 2010) orfrom US$12.7–US$4.3 per GJ. If tight gas is foundelsewhere in substantial volumes, as seems possible,then the historic link between oil and gas prices willbe broken, with oil prices likely to increase significantlyand gas remaining competitive with coal.
If bioenergy, particularly biodiesel and biogas,becomes cheaper than the direct fossil fuel inputsinto agriculture, primarily diesel, then a rapid switchto on-farm bioenergy is likely to occur where rotarypower, transport and thermal processing are required.While the complexity of the interactions between con-ventional agricultural feedstocks for food and their usefor energy, when coupled to global oil markets, makesthis price threshold difficult to estimate, it is likely tobe around US$ 70–100 per barrel oil equivalent but
40
35
30
25
20
15
10
5
0
1980
1982
1984
1986
1988
1990
1992
1994
1996
1998
2000
2002
2004
2006
2008
2010
2012
2014
2016
2018
2020
2022
2024
2026
2028
2030
Figure 8. Projected oil and gas price ranges to 2030; US$ per GJ. Source: US EIA (2009). Dark blue line, reference case ($130per bbl oil); red line, high price ($200 per bbl oil); green line, low price ($50 per bbl oil); dashed violet line, gas: 2008 US$ GJ.
Review. Energy and the food system J. Woods et al. 2999
on February 14, 2018http://rstb.royalsocietypublishing.org/Downloaded from
may be lower for large-scale commercial productionfacilities.
Whether this switch to bioenergy production iscompetitive or synergistic with food production willmainly depend on: the strength of the linkage betweenenergy and food prices; the rate of increase of demandfor bioenergy feedstocks as commodity crops; theimpact from increased investment from bioenergyand the resultant increase in yields of both convention-al crops (food and fuel) and advanced lignocellulosiccrops; and, the availability of new land or recovereddegraded or abandoned land.
5. POLICIES TO REDUCE GHG EMISSIONS FROMTHE FOOD SECTORThe impact of climate change on agricultural pro-duction is still uncertain. However, reports of thepotential outcomes for agriculture are well documen-ted (AEA 2007). Farmers in general face thelooming spectre of climate change at two levels; firstly,by having to adapt existing practices to cope with theoutcomes of climate change (i.e. changing weatherpatterns; water availability; changing patterns ofpests, disease and thermal stress in livestock) and sec-ondly, by addressing those farming activities that arecontributing factors to increased GHG emissions.
While it is likely that farmers will readily adoptmeasures that will benefit their productivity and finan-cial outcomes, adopting practices at a cost to farmingbusinesses is more likely to require policy intervention.Developing mechanisms to improve GHG abatementin the agricultural sector is complex, not least becausepolicy mechanisms are often devised through differentdepartmental policy-making regimes.
Within the EU Climate and Energy Package(2008), the agricultural industry is not part of one ofthe main components, the European Emissions
Phil. Trans. R. Soc. B (2010)
Trading Scheme (EU ETS 2009). Agriculture, as anon-EU ETS sector, is charged with reducing emis-sions to 10 per cent below 2005 levels by 2020, andit is anticipated that this will be through bindingnational targets. In the policy context, the farmingindustry faces many challenges before carbon tradingas an economic strategy becomes a reality.
The UK Government published its low carbontransition plan in 2009 (http://www.theccc.org.uk/carbon-budgets). The Plan’s main points for agricultureare to:
— Encourage English farmers to take action them-selves to reduce emissions to at least 6 per centlower than currently predicted by 2020, throughmore efficient use of fertilizer and better manage-ment of livestock and manure;
— Review voluntary progress in 2012, to decidewhether further government intervention is necess-ary. The Government will publish options for suchintervention in Spring 2010;
— Ensure comprehensive advice programmes areavailable to support farmers in achieving this aim,to reduce their emissions from energy use, and tosave money in the process;
— Research better ways of measuring, reporting andverifying agricultural emissions;
— Encourage private funding for woodland creationto increase forest carbon uptake;
— Provide support for anaerobic digestion, a technol-ogy that turns waste and manure into renewableenergy via biogas; and
— Reduce the amount of waste sent to landfills, andbetter capture of landfill emissions.
Some policy instruments that aim to deliver GHGmitigation within the sector have been identified in areport commissioned by the UK’s Department for
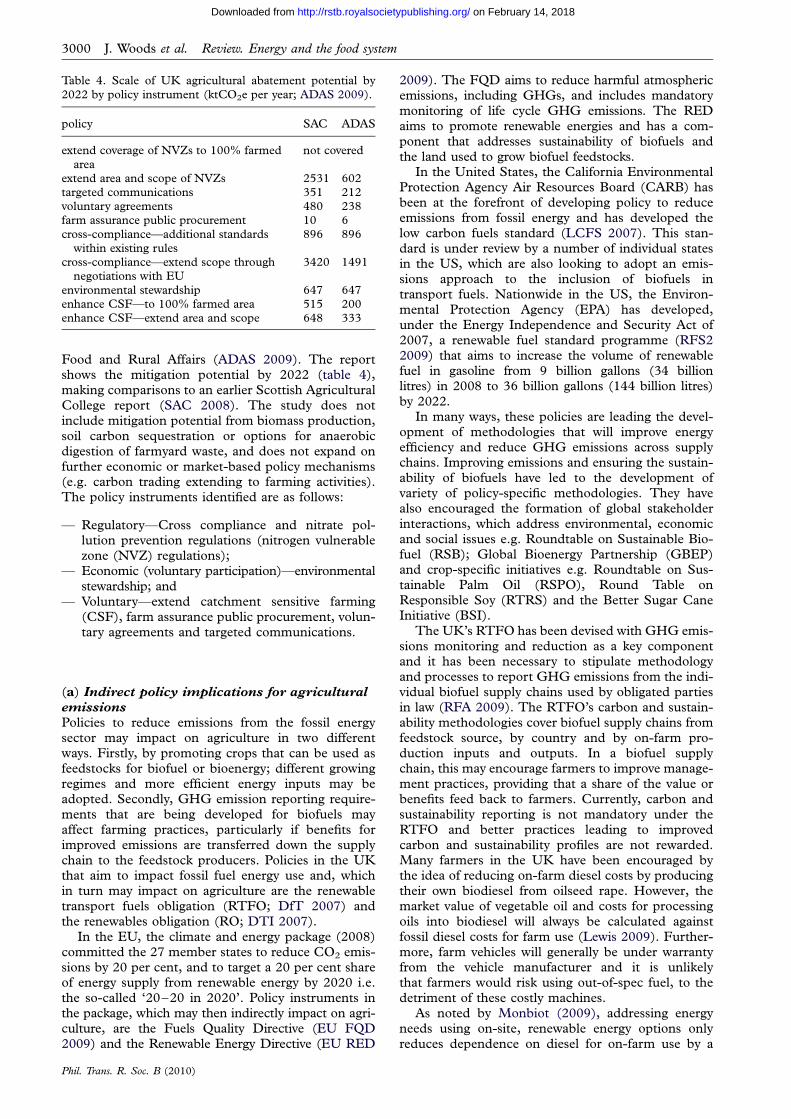
Table 4. Scale of UK agricultural abatement potential by
2022 by policy instrument (ktCO2e per year; ADAS 2009).
policy SAC ADAS
extend coverage of NVZs to 100% farmed
area
not covered
extend area and scope of NVZs 2531 602targeted communications 351 212voluntary agreements 480 238farm assurance public procurement 10 6
cross-compliance—additional standardswithin existing rules
896 896
cross-compliance—extend scope throughnegotiations with EU
3420 1491
environmental stewardship 647 647enhance CSF—to 100% farmed area 515 200enhance CSF—extend area and scope 648 333
3000 J. Woods et al. Review. Energy and the food system
on February 14, 2018http://rstb.royalsocietypublishing.org/Downloaded from
Food and Rural Affairs (ADAS 2009). The reportshows the mitigation potential by 2022 (table 4),making comparisons to an earlier Scottish AgriculturalCollege report (SAC 2008). The study does notinclude mitigation potential from biomass production,soil carbon sequestration or options for anaerobicdigestion of farmyard waste, and does not expand onfurther economic or market-based policy mechanisms(e.g. carbon trading extending to farming activities).The policy instruments identified are as follows:
— Regulatory—Cross compliance and nitrate pol-lution prevention regulations (nitrogen vulnerablezone (NVZ) regulations);
— Economic (voluntary participation)—environmentalstewardship; and
— Voluntary—extend catchment sensitive farming(CSF), farm assurance public procurement, volun-tary agreements and targeted communications.
(a) Indirect policy implications for agricultural
emissions
Policies to reduce emissions from the fossil energysector may impact on agriculture in two differentways. Firstly, by promoting crops that can be used asfeedstocks for biofuel or bioenergy; different growingregimes and more efficient energy inputs may beadopted. Secondly, GHG emission reporting require-ments that are being developed for biofuels mayaffect farming practices, particularly if benefits forimproved emissions are transferred down the supplychain to the feedstock producers. Policies in the UKthat aim to impact fossil fuel energy use and, whichin turn may impact on agriculture are the renewabletransport fuels obligation (RTFO; DfT 2007) andthe renewables obligation (RO; DTI 2007).
In the EU, the climate and energy package (2008)committed the 27 member states to reduce CO2 emis-sions by 20 per cent, and to target a 20 per cent shareof energy supply from renewable energy by 2020 i.e.the so-called ‘20–20 in 2020’. Policy instruments inthe package, which may then indirectly impact on agri-culture, are the Fuels Quality Directive (EU FQD2009) and the Renewable Energy Directive (EU RED
Phil. Trans. R. Soc. B (2010)
2009). The FQD aims to reduce harmful atmosphericemissions, including GHGs, and includes mandatorymonitoring of life cycle GHG emissions. The REDaims to promote renewable energies and has a com-ponent that addresses sustainability of biofuels andthe land used to grow biofuel feedstocks.
In the United States, the California EnvironmentalProtection Agency Air Resources Board (CARB) hasbeen at the forefront of developing policy to reduceemissions from fossil energy and has developed thelow carbon fuels standard (LCFS 2007). This stan-dard is under review by a number of individual statesin the US, which are also looking to adopt an emis-sions approach to the inclusion of biofuels intransport fuels. Nationwide in the US, the Environ-mental Protection Agency (EPA) has developed,under the Energy Independence and Security Act of2007, a renewable fuel standard programme (RFS22009) that aims to increase the volume of renewablefuel in gasoline from 9 billion gallons (34 billionlitres) in 2008 to 36 billion gallons (144 billion litres)by 2022.
In many ways, these policies are leading the devel-opment of methodologies that will improve energyefficiency and reduce GHG emissions across supplychains. Improving emissions and ensuring the sustain-ability of biofuels have led to the development ofvariety of policy-specific methodologies. They havealso encouraged the formation of global stakeholderinteractions, which address environmental, economicand social issues e.g. Roundtable on Sustainable Bio-fuel (RSB); Global Bioenergy Partnership (GBEP)and crop-specific initiatives e.g. Roundtable on Sus-tainable Palm Oil (RSPO), Round Table onResponsible Soy (RTRS) and the Better Sugar CaneInitiative (BSI).
The UK’s RTFO has been devised with GHG emis-sions monitoring and reduction as a key componentand it has been necessary to stipulate methodologyand processes to report GHG emissions from the indi-vidual biofuel supply chains used by obligated partiesin law (RFA 2009). The RTFO’s carbon and sustain-ability methodologies cover biofuel supply chains fromfeedstock source, by country and by on-farm pro-duction inputs and outputs. In a biofuel supplychain, this may encourage farmers to improve manage-ment practices, providing that a share of the value orbenefits feed back to farmers. Currently, carbon andsustainability reporting is not mandatory under theRTFO and better practices leading to improvedcarbon and sustainability profiles are not rewarded.Many farmers in the UK have been encouraged bythe idea of reducing on-farm diesel costs by producingtheir own biodiesel from oilseed rape. However, themarket value of vegetable oil and costs for processingoils into biodiesel will always be calculated againstfossil diesel costs for farm use (Lewis 2009). Further-more, farm vehicles will generally be under warrantyfrom the vehicle manufacturer and it is unlikelythat farmers would risk using out-of-spec fuel, to thedetriment of these costly machines.
As noted by Monbiot (2009), addressing energyneeds using on-site, renewable energy options onlyreduces dependence on diesel for on-farm use by a
1411.78
10.17 9.4310.16
8.81
T1 T2 T3
Mg kg–1
T4 T5
12
10
8
6
4
2
0
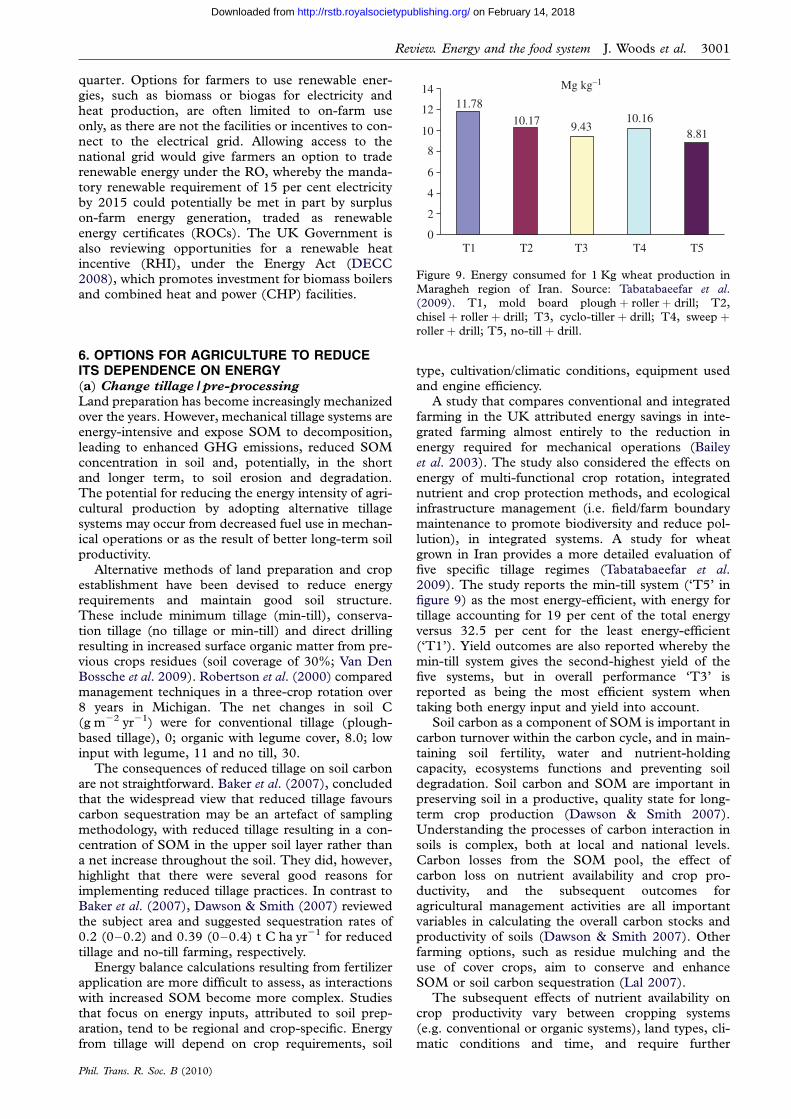
Figure 9. Energy consumed for 1 Kg wheat production inMaragheh region of Iran. Source: Tabatabaeefar et al.
Review. Energy and the food system J. Woods et al. 3001
on February 14, 2018http://rstb.royalsocietypublishing.org/Downloaded from
quarter. Options for farmers to use renewable ener-gies, such as biomass or biogas for electricity andheat production, are often limited to on-farm useonly, as there are not the facilities or incentives to con-nect to the electrical grid. Allowing access to thenational grid would give farmers an option to traderenewable energy under the RO, whereby the manda-tory renewable requirement of 15 per cent electricityby 2015 could potentially be met in part by surpluson-farm energy generation, traded as renewableenergy certificates (ROCs). The UK Government isalso reviewing opportunities for a renewable heatincentive (RHI), under the Energy Act (DECC2008), which promotes investment for biomass boilersand combined heat and power (CHP) facilities.
(2009). T1, mold board plough þ roller þ drill; T2,chisel þ roller þ drill; T3, cyclo-tiller þ drill; T4, sweep þroller þ drill; T5, no-till þ drill.
6. OPTIONS FOR AGRICULTURE TO REDUCEITS DEPENDENCE ON ENERGY(a) Change tillage / pre-processing
Land preparation has become increasingly mechanizedover the years. However, mechanical tillage systems areenergy-intensive and expose SOM to decomposition,leading to enhanced GHG emissions, reduced SOMconcentration in soil and, potentially, in the shortand longer term, to soil erosion and degradation.The potential for reducing the energy intensity of agri-cultural production by adopting alternative tillagesystems may occur from decreased fuel use in mechan-ical operations or as the result of better long-term soilproductivity.
Alternative methods of land preparation and cropestablishment have been devised to reduce energyrequirements and maintain good soil structure.These include minimum tillage (min-till), conserva-tion tillage (no tillage or min-till) and direct drillingresulting in increased surface organic matter from pre-vious crops residues (soil coverage of 30%; Van DenBossche et al. 2009). Robertson et al. (2000) comparedmanagement techniques in a three-crop rotation over8 years in Michigan. The net changes in soil C(g m22 yr21) were for conventional tillage (plough-based tillage), 0; organic with legume cover, 8.0; lowinput with legume, 11 and no till, 30.
The consequences of reduced tillage on soil carbonare not straightforward. Baker et al. (2007), concludedthat the widespread view that reduced tillage favourscarbon sequestration may be an artefact of samplingmethodology, with reduced tillage resulting in a con-centration of SOM in the upper soil layer rather thana net increase throughout the soil. They did, however,highlight that there were several good reasons forimplementing reduced tillage practices. In contrast toBaker et al. (2007), Dawson & Smith (2007) reviewedthe subject area and suggested sequestration rates of0.2 (0–0.2) and 0.39 (0–0.4) t C ha yr21 for reducedtillage and no-till farming, respectively.
Energy balance calculations resulting from fertilizerapplication are more difficult to assess, as interactionswith increased SOM become more complex. Studiesthat focus on energy inputs, attributed to soil prep-aration, tend to be regional and crop-specific. Energyfrom tillage will depend on crop requirements, soil
Phil. Trans. R. Soc. B (2010)
type, cultivation/climatic conditions, equipment usedand engine efficiency.
A study that compares conventional and integratedfarming in the UK attributed energy savings in inte-grated farming almost entirely to the reduction inenergy required for mechanical operations (Baileyet al. 2003). The study also considered the effects onenergy of multi-functional crop rotation, integratednutrient and crop protection methods, and ecologicalinfrastructure management (i.e. field/farm boundarymaintenance to promote biodiversity and reduce pol-lution), in integrated systems. A study for wheatgrown in Iran provides a more detailed evaluation offive specific tillage regimes (Tabatabaeefar et al.2009). The study reports the min-till system (‘T5’ infigure 9) as the most energy-efficient, with energy fortillage accounting for 19 per cent of the total energyversus 32.5 per cent for the least energy-efficient(‘T1’). Yield outcomes are also reported whereby themin-till system gives the second-highest yield of thefive systems, but in overall performance ‘T3’ isreported as being the most efficient system whentaking both energy input and yield into account.
Soil carbon as a component of SOM is important incarbon turnover within the carbon cycle, and in main-taining soil fertility, water and nutrient-holdingcapacity, ecosystems functions and preventing soildegradation. Soil carbon and SOM are important inpreserving soil in a productive, quality state for long-term crop production (Dawson & Smith 2007).Understanding the processes of carbon interaction insoils is complex, both at local and national levels.Carbon losses from the SOM pool, the effect ofcarbon loss on nutrient availability and crop pro-ductivity, and the subsequent outcomes foragricultural management activities are all importantvariables in calculating the overall carbon stocks andproductivity of soils (Dawson & Smith 2007). Otherfarming options, such as residue mulching and theuse of cover crops, aim to conserve and enhanceSOM or soil carbon sequestration (Lal 2007).
The subsequent effects of nutrient availability oncrop productivity vary between cropping systems(e.g. conventional or organic systems), land types, cli-matic conditions and time, and require further
35
30
25
20
GJ
t–1
prod
uct
15
10
5
0
NH 4 AP
Nitro A
Pur
ea AN ASCN KN
MAP
DAPTSP
SSPM
OPSOP
liquid
UAN
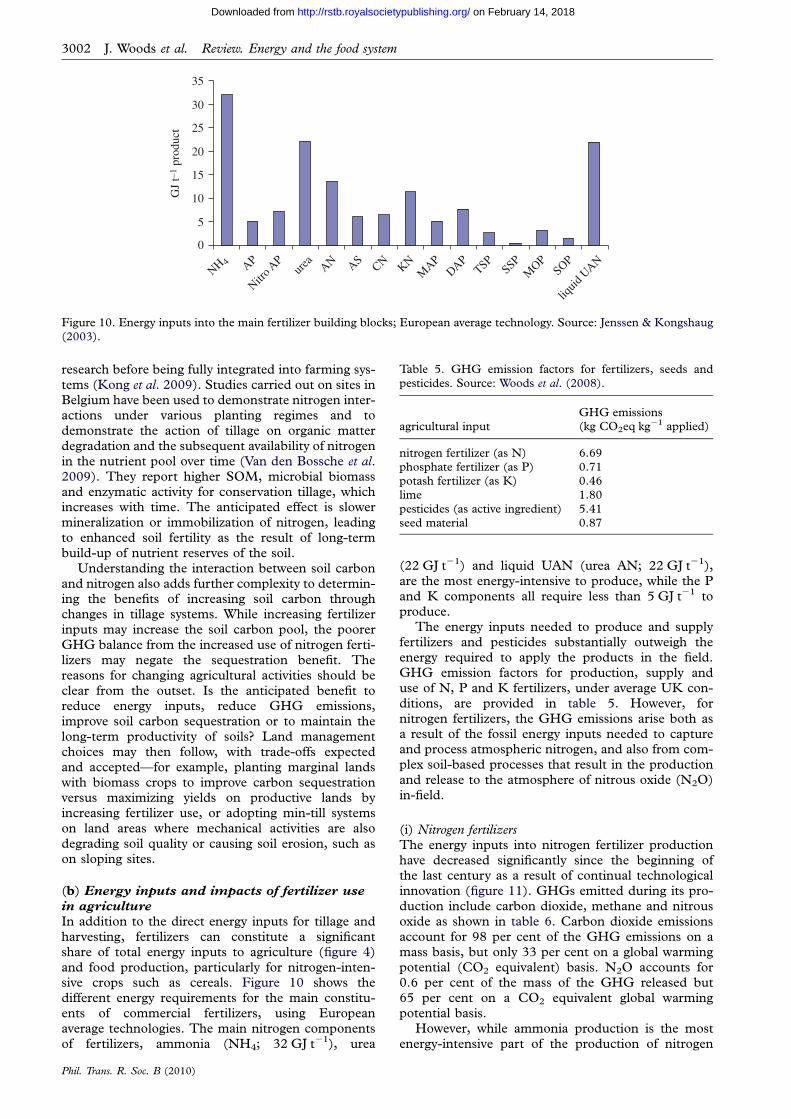
Figure 10. Energy inputs into the main fertilizer building blocks; European average technology. Source: Jenssen & Kongshaug(2003).
Table 5. GHG emission factors for fertilizers, seeds and
pesticides. Source: Woods et al. (2008).
agricultural inputGHG emissions(kg CO2eq kg21 applied)
nitrogen fertilizer (as N) 6.69phosphate fertilizer (as P) 0.71potash fertilizer (as K) 0.46lime 1.80
pesticides (as active ingredient) 5.41seed material 0.87
3002 J. Woods et al. Review. Energy and the food system
on February 14, 2018http://rstb.royalsocietypublishing.org/Downloaded from
research before being fully integrated into farming sys-tems (Kong et al. 2009). Studies carried out on sites inBelgium have been used to demonstrate nitrogen inter-actions under various planting regimes and todemonstrate the action of tillage on organic matterdegradation and the subsequent availability of nitrogenin the nutrient pool over time (Van den Bossche et al.2009). They report higher SOM, microbial biomassand enzymatic activity for conservation tillage, whichincreases with time. The anticipated effect is slowermineralization or immobilization of nitrogen, leadingto enhanced soil fertility as the result of long-termbuild-up of nutrient reserves of the soil.
Understanding the interaction between soil carbonand nitrogen also adds further complexity to determin-ing the benefits of increasing soil carbon throughchanges in tillage systems. While increasing fertilizerinputs may increase the soil carbon pool, the poorerGHG balance from the increased use of nitrogen ferti-lizers may negate the sequestration benefit. Thereasons for changing agricultural activities should beclear from the outset. Is the anticipated benefit toreduce energy inputs, reduce GHG emissions,improve soil carbon sequestration or to maintain thelong-term productivity of soils? Land managementchoices may then follow, with trade-offs expectedand accepted—for example, planting marginal landswith biomass crops to improve carbon sequestrationversus maximizing yields on productive lands byincreasing fertilizer use, or adopting min-till systemson land areas where mechanical activities are alsodegrading soil quality or causing soil erosion, such ason sloping sites.
(b) Energy inputs and impacts of fertilizer use
in agriculture
In addition to the direct energy inputs for tillage andharvesting, fertilizers can constitute a significantshare of total energy inputs to agriculture (figure 4)and food production, particularly for nitrogen-inten-sive crops such as cereals. Figure 10 shows thedifferent energy requirements for the main constitu-ents of commercial fertilizers, using Europeanaverage technologies. The main nitrogen componentsof fertilizers, ammonia (NH4; 32 GJ t21), urea
Phil. Trans. R. Soc. B (2010)
(22 GJ t21) and liquid UAN (urea AN; 22 GJ t21),are the most energy-intensive to produce, while the Pand K components all require less than 5 GJ t21 toproduce.
The energy inputs needed to produce and supplyfertilizers and pesticides substantially outweigh theenergy required to apply the products in the field.GHG emission factors for production, supply anduse of N, P and K fertilizers, under average UK con-ditions, are provided in table 5. However, fornitrogen fertilizers, the GHG emissions arise both asa result of the fossil energy inputs needed to captureand process atmospheric nitrogen, and also from com-plex soil-based processes that result in the productionand release to the atmosphere of nitrous oxide (N2O)in-field.
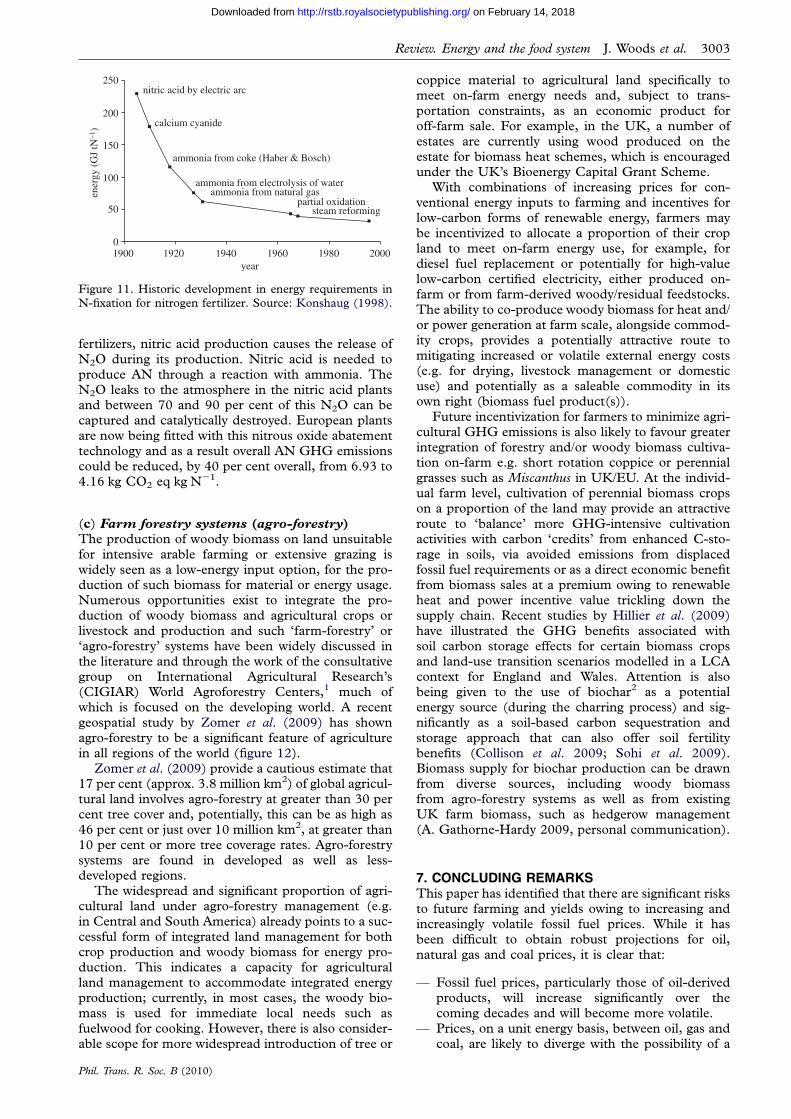
(i) Nitrogen fertilizersThe energy inputs into nitrogen fertilizer productionhave decreased significantly since the beginning ofthe last century as a result of continual technologicalinnovation (figure 11). GHGs emitted during its pro-duction include carbon dioxide, methane and nitrousoxide as shown in table 6. Carbon dioxide emissionsaccount for 98 per cent of the GHG emissions on amass basis, but only 33 per cent on a global warmingpotential (CO2 equivalent) basis. N2O accounts for0.6 per cent of the mass of the GHG released but65 per cent on a CO2 equivalent global warmingpotential basis.
However, while ammonia production is the mostenergy-intensive part of the production of nitrogen
250
200
nitric acid by electric arc
calcium cyanide
ammonia from coke (Haber & Bosch)
ammonia from electrolysis of waterammonia from natural gas
partial oxidationsteam reforming
150
100
ener
gy (
GJ
tN–1
)
50
01900 1920 1940 1960 1980 2000
year
Figure 11. Historic development in energy requirements inN-fixation for nitrogen fertilizer. Source: Konshaug (1998).
Review. Energy and the food system J. Woods et al. 3003
on February 14, 2018http://rstb.royalsocietypublishing.org/Downloaded from
fertilizers, nitric acid production causes the release ofN2O during its production. Nitric acid is needed toproduce AN through a reaction with ammonia. TheN2O leaks to the atmosphere in the nitric acid plantsand between 70 and 90 per cent of this N2O can becaptured and catalytically destroyed. European plantsare now being fitted with this nitrous oxide abatementtechnology and as a result overall AN GHG emissionscould be reduced, by 40 per cent overall, from 6.93 to4.16 kg CO2 eq kg N21.
(c) Farm forestry systems (agro-forestry)The production of woody biomass on land unsuitablefor intensive arable farming or extensive grazing iswidely seen as a low-energy input option, for the pro-duction of such biomass for material or energy usage.Numerous opportunities exist to integrate the pro-duction of woody biomass and agricultural crops orlivestock and production and such ‘farm-forestry’ or‘agro-forestry’ systems have been widely discussed inthe literature and through the work of the consultativegroup on International Agricultural Research’s(CIGIAR) World Agroforestry Centers,1 much ofwhich is focused on the developing world. A recentgeospatial study by Zomer et al. (2009) has shownagro-forestry to be a significant feature of agriculturein all regions of the world (figure 12).
Zomer et al. (2009) provide a cautious estimate that17 per cent (approx. 3.8 million km2) of global agricul-tural land involves agro-forestry at greater than 30 percent tree cover and, potentially, this can be as high as46 per cent or just over 10 million km2, at greater than10 per cent or more tree coverage rates. Agro-forestrysystems are found in developed as well as less-developed regions.
The widespread and significant proportion of agri-cultural land under agro-forestry management (e.g.in Central and South America) already points to a suc-cessful form of integrated land management for bothcrop production and woody biomass for energy pro-duction. This indicates a capacity for agriculturalland management to accommodate integrated energyproduction; currently, in most cases, the woody bio-mass is used for immediate local needs such asfuelwood for cooking. However, there is also consider-able scope for more widespread introduction of tree or
Phil. Trans. R. Soc. B (2010)
coppice material to agricultural land specifically tomeet on-farm energy needs and, subject to trans-portation constraints, as an economic product foroff-farm sale. For example, in the UK, a number ofestates are currently using wood produced on theestate for biomass heat schemes, which is encouragedunder the UK’s Bioenergy Capital Grant Scheme.
With combinations of increasing prices for con-ventional energy inputs to farming and incentives forlow-carbon forms of renewable energy, farmers maybe incentivized to allocate a proportion of their cropland to meet on-farm energy use, for example, fordiesel fuel replacement or potentially for high-valuelow-carbon certified electricity, either produced on-farm or from farm-derived woody/residual feedstocks.The ability to co-produce woody biomass for heat and/or power generation at farm scale, alongside commod-ity crops, provides a potentially attractive route tomitigating increased or volatile external energy costs(e.g. for drying, livestock management or domesticuse) and potentially as a saleable commodity in itsown right (biomass fuel product(s)).
Future incentivization for farmers to minimize agri-cultural GHG emissions is also likely to favour greaterintegration of forestry and/or woody biomass cultiva-tion on-farm e.g. short rotation coppice or perennialgrasses such as Miscanthus in UK/EU. At the individ-ual farm level, cultivation of perennial biomass cropson a proportion of the land may provide an attractiveroute to ‘balance’ more GHG-intensive cultivationactivities with carbon ‘credits’ from enhanced C-sto-rage in soils, via avoided emissions from displacedfossil fuel requirements or as a direct economic benefitfrom biomass sales at a premium owing to renewableheat and power incentive value trickling down thesupply chain. Recent studies by Hillier et al. (2009)have illustrated the GHG benefits associated withsoil carbon storage effects for certain biomass cropsand land-use transition scenarios modelled in a LCAcontext for England and Wales. Attention is alsobeing given to the use of biochar2 as a potentialenergy source (during the charring process) and sig-nificantly as a soil-based carbon sequestration andstorage approach that can also offer soil fertilitybenefits (Collison et al. 2009; Sohi et al. 2009).Biomass supply for biochar production can be drawnfrom diverse sources, including woody biomassfrom agro-forestry systems as well as from existingUK farm biomass, such as hedgerow management(A. Gathorne-Hardy 2009, personal communication).
7. CONCLUDING REMARKSThis paper has identified that there are significant risksto future farming and yields owing to increasing andincreasingly volatile fossil fuel prices. While it hasbeen difficult to obtain robust projections for oil,natural gas and coal prices, it is clear that:
— Fossil fuel prices, particularly those of oil-derivedproducts, will increase significantly over thecoming decades and will become more volatile.
— Prices, on a unit energy basis, between oil, gas andcoal, are likely to diverge with the possibility of a
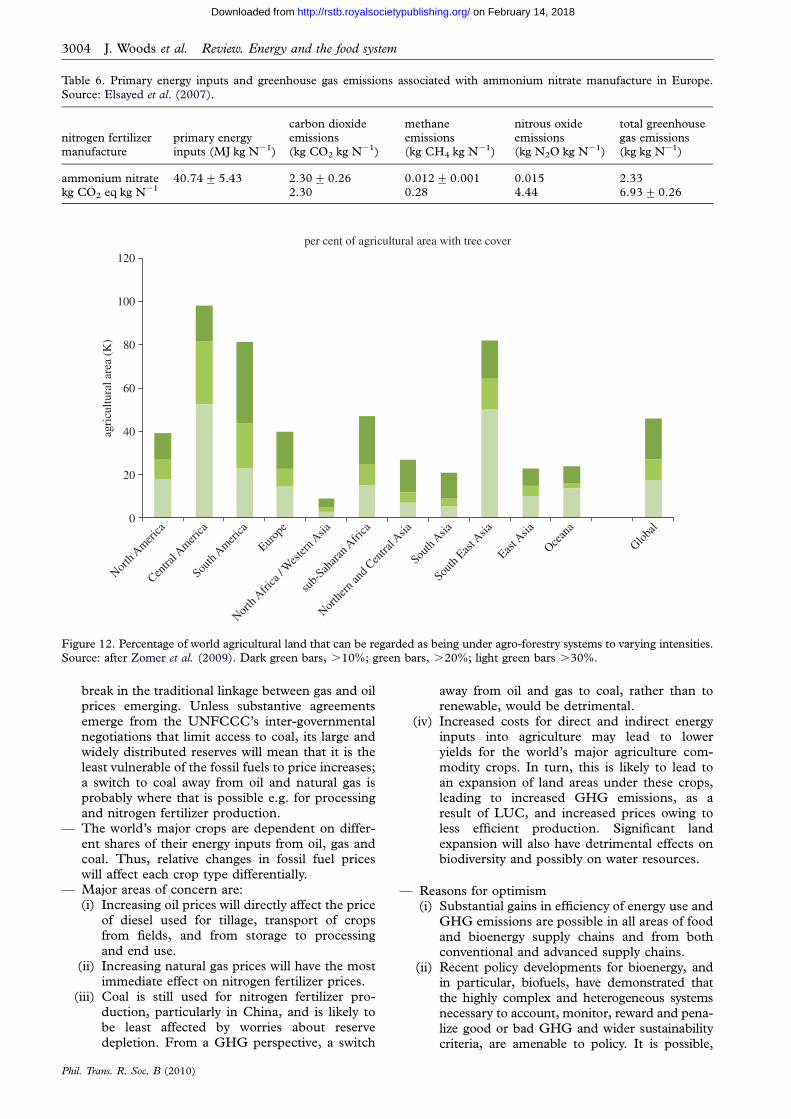
Table 6. Primary energy inputs and greenhouse gas emissions associated with ammonium nitrate manufacture in Europe.
Source: Elsayed et al. (2007).
nitrogen fertilizermanufacture
primary energyinputs (MJ kg N21)
carbon dioxideemissions(kg CO2 kg N21)
methaneemissions(kg CH4 kg N21)
nitrous oxideemissions(kg N2O kg N21)
total greenhousegas emissions(kg kg N21)
ammonium nitrate 40.74+5.43 2.30+0.26 0.012+0.001 0.015 2.33kg CO2 eq kg N21 2.30 0.28 4.44 6.93+0.26
per cent of agricultural area with tree cover
120
100
80
60
40agri
cultu
ral a
rea
(K)
20
0
North
America
Centra
l Ameri
ca
South
America
Europ
e
North
Africa
/ Wes
tern A
sia
sub-
Sahara
n Afri
ca
Northe
rn an
d Cen
tral A
sia
South
Asia
South
East A
sia
East A
sia
Ocean
a
Global
Figure 12. Percentage of world agricultural land that can be regarded as being under agro-forestry systems to varying intensities.Source: after Zomer et al. (2009). Dark green bars, .10%; green bars, .20%; light green bars .30%.
3004 J. Woods et al. Review. Energy and the food system
on February 14, 2018http://rstb.royalsocietypublishing.org/Downloaded from
break in the traditional linkage between gas and oilprices emerging. Unless substantive agreementsemerge from the UNFCCC’s inter-governmentalnegotiations that limit access to coal, its large andwidely distributed reserves will mean that it is theleast vulnerable of the fossil fuels to price increases;a switch to coal away from oil and natural gas isprobably where that is possible e.g. for processingand nitrogen fertilizer production.
— The world’s major crops are dependent on differ-ent shares of their energy inputs from oil, gas andcoal. Thus, relative changes in fossil fuel priceswill affect each crop type differentially.
— Major areas of concern are:(i) Increasing oil prices will directly affect the price
of diesel used for tillage, transport of cropsfrom fields, and from storage to processingand end use.
(ii) Increasing natural gas prices will have the mostimmediate effect on nitrogen fertilizer prices.
(iii) Coal is still used for nitrogen fertilizer pro-duction, particularly in China, and is likely tobe least affected by worries about reservedepletion. From a GHG perspective, a switch
Phil. Trans. R. Soc. B (2010)
away from oil and gas to coal, rather than torenewable, would be detrimental.
(iv) Increased costs for direct and indirect energyinputs into agriculture may lead to loweryields for the world’s major agriculture com-modity crops. In turn, this is likely to lead toan expansion of land areas under these crops,leading to increased GHG emissions, as aresult of LUC, and increased prices owing toless efficient production. Significant landexpansion will also have detrimental effects onbiodiversity and possibly on water resources.
— Reasons for optimism(i) Substantial gains in efficiency of energy use and
GHG emissions are possible in all areas of foodand bioenergy supply chains and from bothconventional and advanced supply chains.
(ii) Recent policy developments for bioenergy, andin particular, biofuels, have demonstrated thatthe highly complex and heterogeneous systemsnecessary to account, monitor, reward and pena-lize good or bad GHG and wider sustainabilitycriteria, are amenable to policy. It is possible,
Review. Energy and the food system J. Woods et al. 3005
on February 14, 2018http://rstb.royalsocietypublishing.org/Downloaded from
and indeed necessary, that many of the lessonslearnt in developing these policies and mechan-isms for biofuels can be applied to any form ofbiological production including food.
(iii) New tools, in particular spatial zoning and landmanagement tools, are highlighting the poten-tial for revised management and crop choicesthat could allow enhanced carbon stockingand biodiversity from integrated land manage-ment and planning that couples annual andperennial agriculture.
(iv) The developing of novel drilling technologies thathave enabled access to ‘tight’ gas reserves in theUS may delay a switch to coal and reduceinflationary pressures on nitrogen fertilizer prices.
While increasing fossil fuel prices could pose a majorrisk to agriculture as production costs increase, andalso cause increased volatility in prices between thedifferent major agricultural commodities, there is sub-stantial scope for technological and managementinnovations to occur, decreasing the dependence onfossil energy supplies and creating opportunities fornew markets e.g. in renewable energy. The opportu-nities and threats will vary substantively between thedifferent crops and a careful review on a crop-by-crop basis is necessary to understand and managethese threats and the risks to future productionposed by increasing fossil fuel prices.
ENDNOTES1See http://www.worldagroforestry.org/af/.2Biochar is carbonised biomass or charcoal. When biomass is turned
into charcoal and applied to soils it is believed to have a half-life in
the soil in order of 1000 years.
REFERENCESADAS 2009 Analysis of policy instruments for reducing
greenhouse gas emissions from agriculture, forestryand land management. Defra report RMP/5142.Wolverhampton, UK: ADAS Ltd.
AEA Energy and Environment. 2007 Adaptation to climatechange in the agricultural sector. AGR1-2006-G4-05.AEA Energy and Environment and Universidad dePolitecnica de Madrid. Report to European Commission
DG Agriculture and Rural Development. ED05334.Brussels, Belgium: European Commission.
Audsley, E., Brander, M., Chatterton, J., Murphy-Bokern, D.,Webster, C. & Williams, A. G. 2010 An assessment of green-house gas emissions from the UK food system and the scope forreduction by 2050: how low can we go? Godalming, UK:WWF UK and Food Climate Research Network.
Bailey, A. P., Basford, W. D., Penlington, N., Park, J. R.,Keatinge, J. D. H., Rehman, T., Tranter, R. B. & Yates,C. M. 2003 A comparison of energy use in conventional
and integrated arable farming systems in the UK. Agric.Ecosyst. Environ. 97, 241–253.
Baker, J. M., Ochsner, T. E., Venterea, R. T. & Griffis, T. J.2007 Tillage and soil carbon sequestration—what do wereally know. Agric. Ecosyst. Environ. 118, 1–5.
Bondeau, A., Smith, P. C., Zaehle, S., Schaphoff, S., Lucht,W., Cramer, W. & Gerten, D. 2007 Modelling the role ofagriculture for the 20th century global terrestrial carbonbalance. Glob. Change Biol. 13, 679–706.
BP 2009 BP statistical review of world energy June 2009. Seewww.bp.com/statisticalreview (accessed 02 december 09).
Phil. Trans. R. Soc. B (2010)
Bradley, R. I., Milne, R., Bell, J., Lilly, A., Jordan, C. &Higgins, A. 2005 A soil carbon and land usedatabase for the United Kingdom. Soil Use Manage. 21,
363–369.Collison, M., Collison, L., Sakrabani, R., Tofield, B. &
Wallage, Z. 2009 Biochar and carbon sequestration: aregional perspective. Norwich, UK: The Low CarbonInnovation Centre, University of East Anglia. (A report
prepared for East of England Development Agency(EEDA), DA1 Carbon Reduction Ref. No: 7049).
Crutzen, P. J., Mosier, A. R., Smith, K. A. & Winiwarter, W.2008 N2O release from agro-biofuel production negates
global warming reduction by replacing fossil fuels.Atmos. Chem. Phys. 8, 389–395.
Dawson, J. J. C. & Smith, P. 2007 Carbon losses from soiland its consequences for land use management. Sci.Total Environ. 382, 165–190.
DECC 2008 Energy Act 2008. See http://www.decc.gov.uk/en/content/cms/legislation/energy_act_08/energy_act_08.aspx.
DfT 2007 The renewable transport fuels obligations order 2007.Statutory Instrument 2007 No. 3072.
DTI 2007 The renewables obligation order 2006 (Amendment)order 2007. Statutory Instruments 2007 No. 1078.
Elsayed, M. A., Evans, A. & Mortimer, N. D. 2007 Selectivelife cycle assessment for ammonium nitrate fertiliser productionusing natural gas as a feedstock. London, UK: Defra.
EU Climate and Energy Package. 2020 by 2020. 2008
(COM (2008) 30 final). Brussels, Belgium: EuropeanCommission.
EU ETS 2009 Directive 2009/29/EC. Official Journal of theEuropean Union, L 140/63. Brussels, Belgium: European
Commission.EU FQD 2009 Directive 2009/30/EC., Official Journal
of the European Union, L 140/88. Brussels, Belgium:European Commission.
EU RED 2009 Directive 2009/28/EC. Official Journal of the
European Union, L 140/16. Brussels, Belgium: EuropeanCommission.
FAO 2006 Livestock in geographic transition. In Livestock’slong shadow: environmental issues and options, ch. 2.Rome, Italy: FAO. See www.virtualcentre.org.
Falloon, P., Powlson, D. & Smith, P. 2004 Managing fieldmargins for biodiversity and carbon sequestration: aGreat Britain case study. Soil Use Manage. 20, 240–247.
Farrell, A. 2006 Ethanol can contribute to energy andenvironmental goals. Science 311, 506–508. (doi:10.
1126/science.1121416)Foley, J. A. et al. 2005 Global consequences of land use.
Science 309, 570–574.Garnett, T. 2009 Livestock-related greenhouse gas emis-
sions: impacts and options for policy makers. Environ.Sci. Policy 12, 491–503.
Green, M. B. 1987 Energy in pesticide manufacture, distri-bution and use. In Energy in plant nutrition and pestcontrol (ed. Z. R. Helsel), pp. 165–177. Amsterdam,
The Netherlands: Elsevier.Hazel, P. & Woods, S. 2008 Drivers of change in global
agriculture. Phil. Trans. R. Soc. B 363, 295–515.He, P., Zhang, W. & Zhang, F. 2009. GHG emission from
nitrogen fertilizer in China: preliminary results of FCO
project. In College of Resources and Environmental Sciences,China Agricultural University, 21 September2009, Nanjing,China. Nanjing, China: Nanjing University.
Hillier, J. et al. 2009 Greenhouse gas emissions from fourbioenergy crops in England and Wales: Integrating spatial
estimates of yield and soil carbon balance in life cycleanalyses. GCBiol. Bioenergy 1, 267–281.
IEA 2009 Natural gas market review 2009: executive sum-mary. Paris, France: International Energy Agency/OECD. See www.iea.org (accessed 30 november 09).
3006 J. Woods et al. Review. Energy and the food system
on February 14, 2018http://rstb.royalsocietypublishing.org/Downloaded from
International Fertilizer Industry Association. 2009 Fertilizers,climate change and enhancing agricultural productivity sus-tainably. Paris, France: International Fertilizer Industry
Association.IPCC 2001 Technological and economic potential of greenhouse
gas emissions reduction. (W. Moomaw, J. R. Moreira, co-ordinating lead authors). Chapter 3 in IPCC 2006.IPCC third assessment report—climate change 2001.
See http://www.grida.no/publications/other/ipcc_tar/.IPCC 2006 2006 IPCC Guidelines for national greenhouse gas
inventories. (eds H. S. Eggleston, L. Buendia, K. Miwa,T. Ngara & K. Tanabe). Prepared by the National Green-
house Gas Inventories Programme. Tokyo, Japan: IGES.Jenssen, T. K. & Kongshaug, G. 2003 Energy consumption
and greenhouse gas emissions in fertiliser production.Proc. of the Int. Fertiliser Society No. 509. Paris, France:International Fertiliser Industry Association.
Kindred, D., Mortimer, N., Sylvester-Bradley, R., Brown, G.& Woods, J. 2008 Understanding and managing uncertain-ties to improve biofuel GHG emissions calculations London,UK: Home Grown Cereals Authority (HGCA).
King, J. A., Bradley, R. I. & Harrison, R. 2005 Current
trends of soil organic carbon in English arable soils. SoilUse Manage. 21, 189–195.
Kong, A. Y. Y., Fonte, S. J., van Kessel, C. & Six, J. 2009Transitioning from standard to minimum tillage: trade-offs between soil organic matter stabalization, nitrous
oxide emissions, and N availability in irrigated croppingsystems. Soil Till. Res. 104, 256–262.
Konshaug, G. 1998 Energy consumption and greenhousegas emissions in fertiliser production. In Proc. of the IFATechnical Conf. in Marrakesk, Morocco. Paris, France:International Fertiliser Industry Association.
Lal, R. 2007 Farming carbon. Soil Till. Res. 97, 1–5.LCFS (Low Carbon Fuel Standard). 2007 Executive order
S-1-07. Sacramento, CA: California Environmental
Protection Agency Air Resources Board.Le Quere, C. 2009 Recent trends in the sources and sinks
of carbon dioxide. Norwich, UK: University of EastAnglia: The Global Carbon Project. See www.globalcarbonproject.org.
Lewis, D. 2009 Biodiesel case studies—logistical and econ-omic issues. Royal Agricultural College and KnowledgeWest Report See http://www.knowledgewest.org.uk.
Macedo, I. 2008 Mitigation of GHG emissions using sugar-cane bio-ethanol. Biofuels and sustainability: Brazilian
perspectives. London, UK: British Academy. (A ChathamHouse briefing in collaboration with the Embassy ofBrazil. Held 8th October 2008).
Monbiot, G. 2009 ‘The one thing depleting faster than oil is
the credibility of those measuring it’. The Guardian, 16thNovember See (http://www.guardian.co.uk/commentisfree/2009/nov/16/oil-running-out-madman-sandwich-board).
Olesen, J. E., Schelde, K., Weiske, A., Weisbjerg, M. R.,Asman, W. A. H. & Djurhuus, J. 2006 Modelling green-
house gas emissions from European conventional andorganic dairy farms. Agric. Ecosyst. Environ 112, 207–220.
Pretty, J. N., Ball, A. S., Lang, T. & Morison, J. I. L. 2005Farm costs and food miles: an assessment of the fullcost of the UK weekly food basket. Food Policy 30, 1–19.
RFA 2009 Carbon and sustainability reporting within therenewable transport fuel obligation. Technical GuidancePart 1. See http://www.renewablefuelsagency.gov.uk/_db/_documents/Carbon_and_Sustainability_Guidance_Part_1.pdf.
RFS2 (Renewable Fuel Standard). 2009 EPA proposes newregulations for the National Renewable Fuel StandardProgram for 2010 and beyond. Office of Transportationand Air Quality, United States Environmental ProtectionAgency. EPA-420-F-09-023, Washington, DC.
Phil. Trans. R. Soc. B (2010)
Robertson, G. P., Eldor, A. P. & Harwood, R. P. 2000Greenhouse gases in intensive agriculture: contributionsof individual gases to the radiative forcing of the atmos-
phere. Science 289, 1922–1925.SAC 2008 UK marginal abatement cost curves for the agri-
culture and land use, land-use change and forestry sectorsout to 2022, with qualitative analysis of options to 2050.,(RMP4950 Final Report to the Committee on Climate
Change). Edinburgh, UK: Scottish Agricultural College.Samson, R., Mani, S., Boddey, R., Sokhansanj, S., Quesada,
D., Urquiaga, S., Reis, V. & Ho Lem, C. 2005 The Poten-tial of C4 perennial grasses for developing a global
bioheat industry. Crit. Rev. Plant Sci. 24, 461–495.(doi: 10.1080/07352680500316508).
Snyder, C. S., Bruulsema, T. W., Jensen, T. L. & Fixen, P. E.2009 Review of greenhouse gas emissions from cropproduction systems and fertilizer management effects.
Agric. Ecosyst. Environ. 133, 247–266.Sohi, S., Loez-Capel, E., Krull, E. & Bol, R. 2009 Biochar’s
roles in soil and climate change: a review of researchneeds. CSIRO Land Water Sci. Rep. 05/09, 64. pp.
Tabatabaeefar, A., Emamzadeh, H., GhasemiVarnamkhasti,
M., Rahimizadeh, R. & Karimi, M. 2009 Comparison ofenergy of tillage systems in wheat production. Energy 34,41–45.
The Economist. 2010 An unconventional glut. Newly econ-omic, widely distributed sources are shifting the balance ofpower in the world’s gas. 11 March 2010, pp. 1–6.
Tilman, D. 1999 Global environmental impacts of agricul-tural expansion: the need for sustainable and efficientpractices. Proc. Natl Acad. Sci. 96, 5995–6000.
US EIA 2009 International energy outlook, 2009.Washington, DC: Energy Information Administration(EIA),Office of Integrated Analysis and Forecasting, USDepartment of Energy. 20585. www.eia.doe.gov/oiaf/ieo/index.html. (accessed 01december 09).
Van Den Bossche, A., De Bolle, S., De Neve, S. & Hofman,G. 2009 Effect of tillage intensity on N mineralization ofdifferent crop residues in a temperate climate. Soil Till.Res. 103, 316–324.
Vermeulen, G. D. & Mosquera, J. 2009 Soil, crop and emission
responses to seasonal-controlled traffic in organic vegetablefarming on loam soil. Soil Till. Res. 102, 126–134.
Volpi, G. 2010 Biofuels in Brazil and land use change.J. Biomaterials. Bioenergy 4, 1–10.
Williams, A. G., Audsley, E. & Sandars, D. L. 2006 Deter-
mining the environmental burdens and resource use inthe production of agricultural and horticultural commod-ities. (Final Report to Defra on Project IS0205).Cranfield, UK: Cranfield University.
Williams, A. G., Pell, E., Webb, J., Tribe, E., Evans, D.,Moorhouse, E. & Watkiss, P. 2009 Comparative lifecycle assessment of food commodities procured for UKconsumption through a diversity of supply chains.(Final Report to Defra on Project FO0103). Cranfield,
UK: Cranfield University.Wood, S. & Cowie, A. 2004 A review of greenhouse gas emis-
sion factors for fertiliser production. Paris, France: IEABioenergy.
Woods, J., Brown, G., Gathorne-Hardy, A., Sylvester
Bradley, R., Kindred, D. & Mortimer, N. 2008 Facilitat-ing carbon (GHG) accreditation schemes for biofuels:feedstock production. London, UK: HGCA.
Zeisemer, J. 2007 Energy Use in Organic Farming Systems.FAO publication. See http://www.fao.org/docs/eims/
upload/233069/energy-use-oa.pdf.Zomer, R. J., Trabucco, A., Coe, R. & Place, F. 2009 Trees
on farm: analysis of global extent and geographical pat-terns of agroforestry. ICRAF working paper, vol. 89Nairobi, Kenya: World Agroforestry Centre.