Embed Size (px)
Citation preview
Employers and DM ServicesWhat Matters
Jack Mahoney, MD, MPH
Strategic Health Initiatives
Pitney Bowes

Overview
Employer Priorities Benefits Director role
Employers and DM Changing needs and marketplace Employers’ “Wish List”
Current and Future Issues Enhancing Value for the Employer
DM at Pitney Bowes

Budget
Benefits Director/Manager

Annual Health Care Cost Increases
0%
2%
4%
6%
8%
10%
12%
14%
16%
1998 1999 2000 2001 2002 2003 2004 2005 2006 2007
Active Employees

Annual Total Health Care Cost Per EmployeePitney Bowes Benchmark Companies
$0
$1,000
$2,000
$3,000
$4,000
$5,000
$6,000
$7,000
$8,000
$9,000
1998 1999 2000 2001 2002 2003 2004 2005 2006 2007
Active Employees

CFOs Concerns About Rising Health Care Costs
13
27
10 1
49
A Top Issue
Very Important
Important
Somewhat Important
Not Important
Source: The Business Value of Health; Integrated Benefits Institute, May 2006

I Need Flat Costs

Disease Management Programs and Cost Management More than 80% of employers have DM programs
Customization Carve-In/Carve-Out
83% of employers are very or somewhat satisfied with DM programs
82% of employers are very or somewhat confident that DM provides positive financial return
Source: Disease Management Programs: Critical Issue Update National Business Group on Health 2008

Healthy, Productive Employees
Corporate FocusCorporate Focus
Employee Focus
• IncentivesIncentives• AlignmentAlignment• CommunicationCommunication
• ProgramsPrograms• CultureCulture• ValuesValues
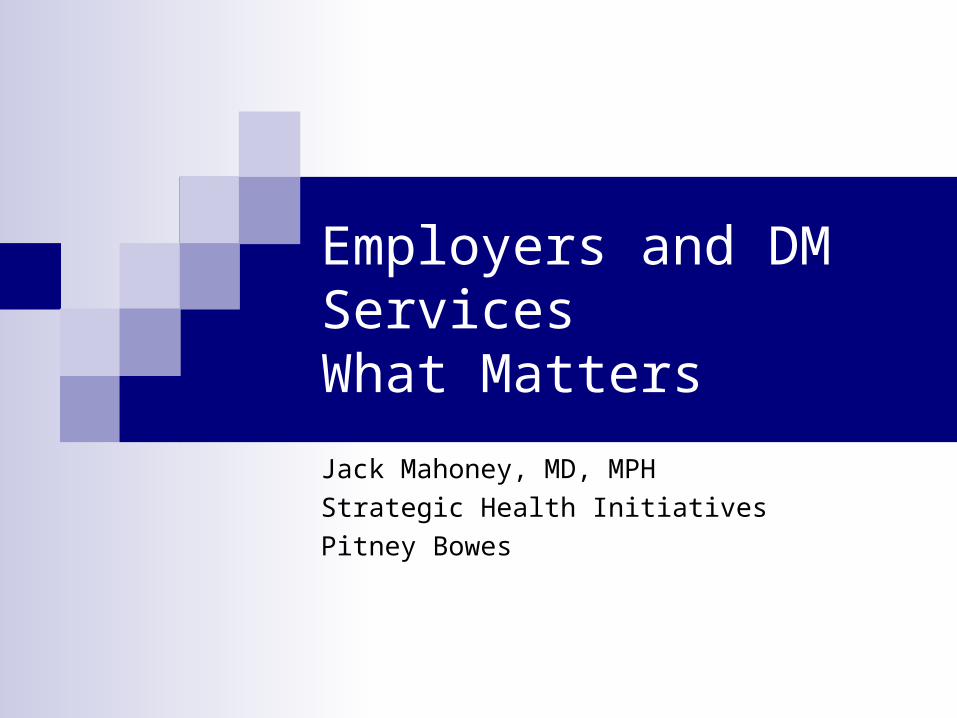
Strategic Health Goals
Risk ReductionRisk Reduction
Health ManagementHealth Management
Condition ManagementCondition Management
Absence ManagementAbsence Management

Strategic Health Goals
Health and Productivity Health and Productivity ManagementManagement

Healthy, Productive Employees
Corporate FocusCorporate Focus
Employee Focus
• IncentivesIncentives• AlignmentAlignment• CommunicationCommunication
• ProgramsPrograms• CultureCulture• ValuesValues
Health & Productivity Service Health & Productivity Service SpectrumSpectrum

Health RiskAssessment
WellnessHealth
Improvement
Disease Management
HealthPlan
CaseManagementPlan Design
Health and Productivity Service Spectrum
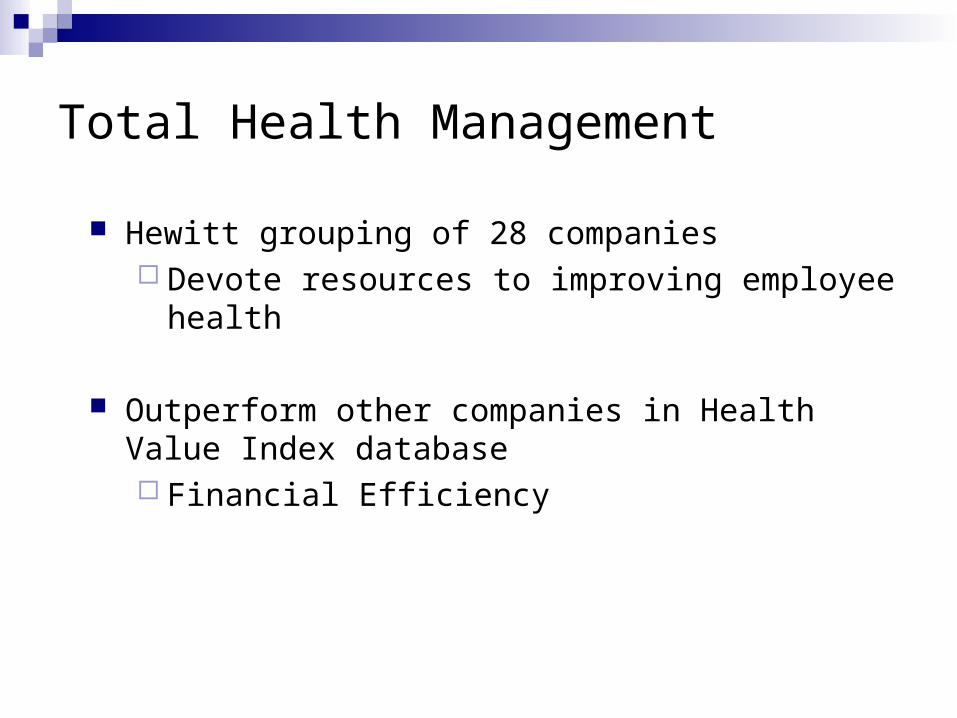
Total Health Management
Hewitt grouping of 28 companies Devote resources to improving employee health
Outperform other companies in Health Value Index database Financial Efficiency

Employers Deploying Significant Focus/Resources to Employee Health
Financial IndexSource: Hewitt Associates
97
98
99
100
101
102
103
104
105
2003 2004 2005 2006
Eff
icie
ncy
(h
igh
er is
bet
ter)
100 = Database of 300+ large employers Industry Peers of "The 28" 28 Innovative/Aggressive Health Focused Companies

* Cost includes:▪ Employer subsidy▪ Employee contribution▪ Estimated employee out-of-pocket expense
Employers Deploying Significant Focus/Resources to Employee Health
Annual Cost Trend*Source: Hewitt Associates
3%
5%
7%
9%
11%
13%
15%
17%
19%
2003 2004 2005 2006
Rat
e of
In
crea
se
100 = Database of 300+ large employers Industry Peers of "The 28" 28 Innovative/Aggressive Health Focused Companies

Cost variation across companies
High Performing Companies
Low Performing
Companies
Cost per employee $8,532 $10,200
Increase in Employer cost 5% 7%
Source: Towers Perrin 2008 Health Care Cost Survey
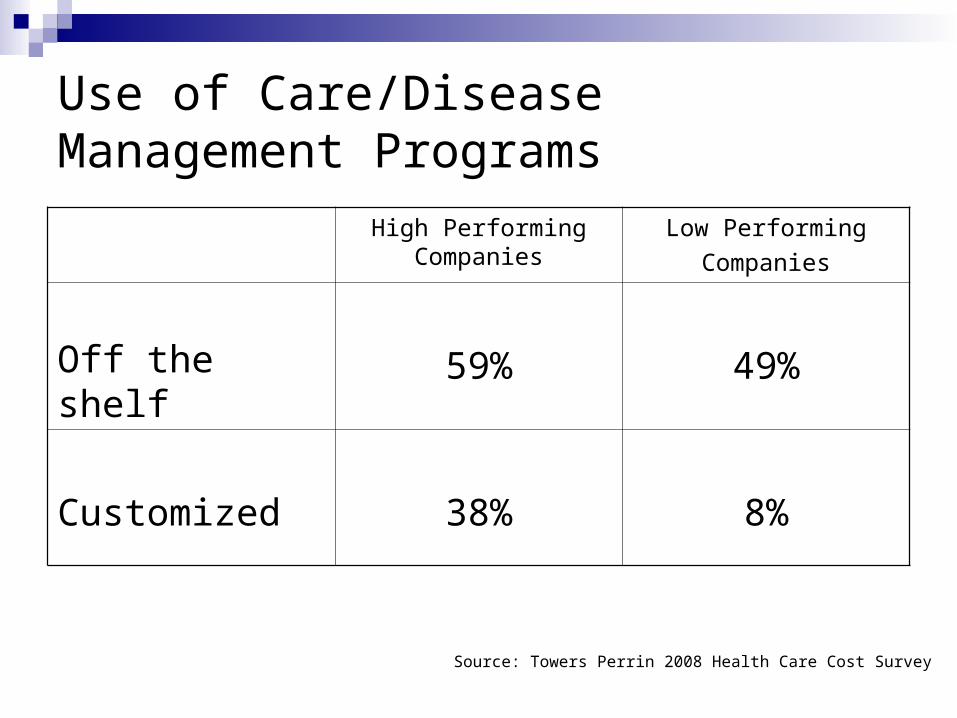
Use of Care/Disease Management Programs
High Performing Companies
Low Performing
Companies
Off the shelf 59% 49%
Customized 38% 8%
Source: Towers Perrin 2008 Health Care Cost Survey

Budget
Talent Acquisition and Retention
Productivity
Privacy
Vendor Management

Budget
Talent Acquisition and Retention
ProductivityFinance
Human Resources
Risk Management
PrivacyLegal
AdministrationVendor Management

“We need a new benefits manager.”

What Matters to the Employer
VALUE
Program Structure
Integration
Employee Perception/Acceptance
Demonstrated Outcomes ROI?

Program Structure: Components
Patient Identification Outreach/Communications Predictive Modeling
Evidence-Based Guidelines Collaboration with Treating Physician
Medical Home? Benefit Design
Population specific Incentives/Disincentives Value-Based Design
Self-Management

Evidence of Disease Management Outcomes
Positive Effect on Adherence to evidence-based guidelines for CHF CAD Diabetes Depression
Impact on Asthma and COPD less clear
Source: Mattke et al, AJMC, December 2007

Program Structure: Integration
Associated Programs HRA/Health Assessment Health Improvement Programs EAP Disability Management

Program Structure: Integration
Health Plan Carve-In/Out
PBM
Behavioral Health Vendor
Data Issues

Health Risk Health Risk AppraisalAppraisal
Health Plan Health Plan 33
PharmacyPharmacy
Health Plan Health Plan 11
Health Plan Health Plan 22
Program Structure :Data Management

CFOs’ Understanding of the Impacts of Poor Health
96% Higher Medical Costs
90% Employees have more trouble focusing on their jobs
86% More absence, affecting operating performance
84% Affects bottom line beyond healthcare costs alone
71% Adverse effect on other benefits costs
47% Requires a larger workforce
Source: The Business Value of Health; Integrated Benefits Institute, May 2006

Health RiskAssessment
WellnessHealth
Improvement
Disease Management
HealthPlan
CaseManagement
Plan Design
Health Plan Costs
Presenteeism
Casual Absence
Disability
Workers’ Comp
Total Value ROI

About Pitney Bowes
80-plus year legacy
Fortune 500 company
$5.9 billion global provider of integrated mail and document management solutions
Global team of more than 35,000 employees
Presence in more than 130 countries worldwide
More than 2 million customers

Pitney Bowes Medical Benefits
HMO providers:HMO providers: 46 local and national carriers46 local and national carriers
PPO providersPPO providers:: 4 national carriers4 national carriers
Mixture of Self-insured (90%) and Fully-insured (10%) plans, Mixture of Self-insured (90%) and Fully-insured (10%) plans, with common benefit designswith common benefit designs

Pitney Bowes Health Plan Structure
Health Plans Four National PPO Plan Managers 46 Local HMOs Responsibility
Disease Management Health Risk Assessment
Carve-Outs Pharmacy Behavioral Health including EAP
Internal Management Disability Workers’ Compensation

Pitney Bowes Strategic Approach
Value-Based PurchasingeValue8
Value-Based Benefit DesignChronic ConditionsPrevention
Health Management/WellnessHealth Care University

Medical Plan—Quality Purchasing
• Used by business health coalitions and national employers to assess and manage the quality of available HMO/POS and PPO plans.
• eValue8 raises the bar for health care performance and moves the market to deliver greater value for the purchaser's health care dollar..
• Gathers information on hundreds of benchmarks
• Standardized performance reports are prepared for comparison

Selecting a DM ProgrameValue8 Criteria
Program Scope and Accreditation Coordination Member Identification Member Support Practitioner Support Performance Measurements
CAD Diabetes Back Pain

Health Plan Deliverables for DM
Patient Identification Effectiveness measured through integrated data warehouse
Patient Engagement “Touched” Program enrollment
ROI Condition Specific Impact on
Disability Scorecard
Based on data warehouse

Pitney Bowes Total Annual Cost per Employee vs. Benchmark
$0
$1,000
$2,000
$3,000
$4,000
$5,000
$6,000
$7,000
$8,000
$9,000
1996 1997 1998 1999 2000 2001 2002 2003 2004 2005 2006 2007
Benchmark PB

Pitney Bowes Total Annual Cost per Employee vs. Benchmark
$0
$1,000
$2,000
$3,000
$4,000
$5,000
$6,000
$7,000
$8,000
$9,000
1996 1997 1998 1999 2000 2001 2002 2003 2004 2005 2006 2007
Benchmark PB

Estimated Cost offset for 2007 is $39.8mmBased on per employee cost for PB vs Benchmark
Drivers of Success One third of Offset Due to Health Plan Management
Efficiency Quality
Remainder Related to Employee-based Programs Condition/Disease Management Wellness/Health Improvement On-Site Clinics Consumerism

Summary
DM found at most major employers Regarded as a component to total Health and
Productivity management Value measurements may be limited to ROI or expanded
to include broader impacts on productivity measurements
Future demands from DM vendors will include integration HRAs Disability Absenteeism