Embed Size (px)
Citation preview
Coastal Engineering 60 (2012) 286–298
Contents lists available at SciVerse ScienceDirect
Coastal Engineering
j ourna l homepage: www.e lsev ie r .com/ locate /coasta leng
Empirical design of scour protections around monopile foundations. Part 2:Dynamic approach
Leen De Vos a,⁎, Julien De Rouck a, Peter Troch a, Peter Frigaard b
a Ghent University, Dept. of Civil Engineering, Technologiepark 904, 9052 Ghent, Belgiumb Aalborg University, Dept. of Civil Engineering, Sohngaardsholmsvej 57, DK-9000 Aalborg, Denmark
⁎ Corresponding author.E-mail addresses: [email protected] (
[email protected] (J. De Rouck), Peter.Troch@[email protected] (P. Frigaard).
0378-3839/$ – see front matter © 2011 Elsevier B.V. Alldoi:10.1016/j.coastaleng.2011.11.001
a b s t r a c t
a r t i c l e i n f oArticle history:Received 11 April 2011Received in revised form 11 October 2011Accepted 1 November 2011Available online 2 December 2011
Keywords:MonopileScour protectionOffshore windDesign formulaDynamic stability
When building offshore wind turbines, a static scour protection is typically designed, allowing no movementof top layer stones under design conditions, leading to an often conservative design. Furthermore, littledesign guidelines exist for a scour protection around a monopile foundation under combined wave andcurrent loading.In part 1 (De Vos et al., 2011), preceding this paper, a static design guideline for a scour protection around amonopile is suggested, based on a combined wave and current flow field. By allowing some movement of thetop layer stones of the scour protection, a more economical design is obtained. This paper describes thederivation of a dynamic design formula to calculate the required stone size for a scour protection around amonopile foundation in a combined wave and current climate. The formula is based on the results of anexperimental model study, described in this paper. The formula gives an expected damage level to thescour protection, based on the wave orbital velocity, wave period, steady current velocity, water depth,relative stone density and stone size.When applying the formula for a typical situation in the North Sea, a reduction of 20% to 80% of the requiredstone size is obtained, compared to the static design approach, described in part 1.
© 2011 Elsevier B.V. All rights reserved.
1. Introduction
When designing a statically stable scour protection, in principle nodamage to the top layer is accepted. For such a scour protection, dam-age is defined as the displacement of top layer stones. As the designlife time of offshore wind turbines is typically only 20 years (denBoon et al., 2003), it is important to decrease the costs of a windturbine as much as possible. An opportunity to do this can be foundin using significantly smaller rock sizes for the scour protection. Theuse of smaller rock sizes decreases the basic cost of the protectionlayer, additionally it may lead a decrease of the cost by reducing thenumber of filter layers.
When designing a scour protection with smaller elements, allow-ing movement of individual stones without failure of the protection, itis important:
- to clearly define damage;- to formulate an acceptable damage criterion;- to add damage as a parameter in the stability formula;
L. De Vos),ent.be (P. Troch),
rights reserved.
- to account for damage development over time as an importantelement in the design of scour protections.
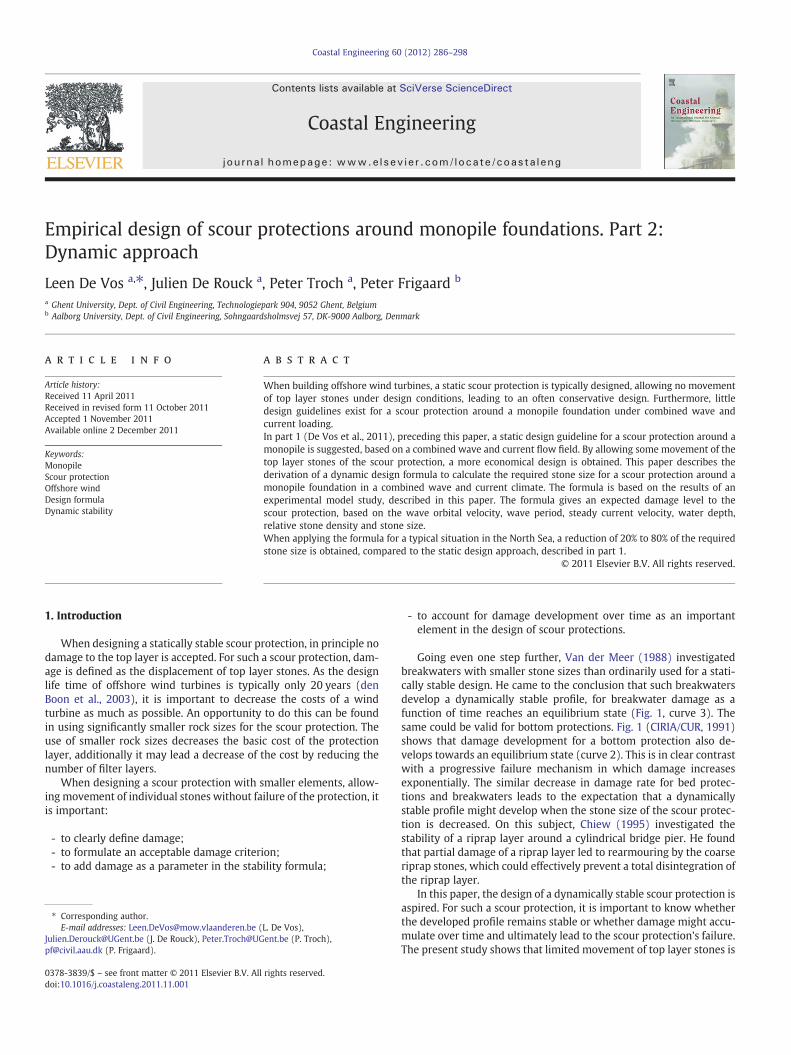
Going even one step further, Van der Meer (1988) investigatedbreakwaters with smaller stone sizes than ordinarily used for a stati-cally stable design. He came to the conclusion that such breakwatersdevelop a dynamically stable profile, for breakwater damage as afunction of time reaches an equilibrium state (Fig. 1, curve 3). Thesame could be valid for bottom protections. Fig. 1 (CIRIA/CUR, 1991)shows that damage development for a bottom protection also de-velops towards an equilibrium state (curve 2). This is in clear contrastwith a progressive failure mechanism in which damage increasesexponentially. The similar decrease in damage rate for bed protec-tions and breakwaters leads to the expectation that a dynamicallystable profile might develop when the stone size of the scour protec-tion is decreased. On this subject, Chiew (1995) investigated thestability of a riprap layer around a cylindrical bridge pier. He foundthat partial damage of a riprap layer led to rearmouring by the coarseriprap stones, which could effectively prevent a total disintegration ofthe riprap layer.
In this paper, the design of a dynamically stable scour protection isaspired. For such a scour protection, it is important to know whetherthe developed profile remains stable or whether damage might accu-mulate over time and ultimately lead to the scour protection's failure.The present study shows that limited movement of top layer stones is
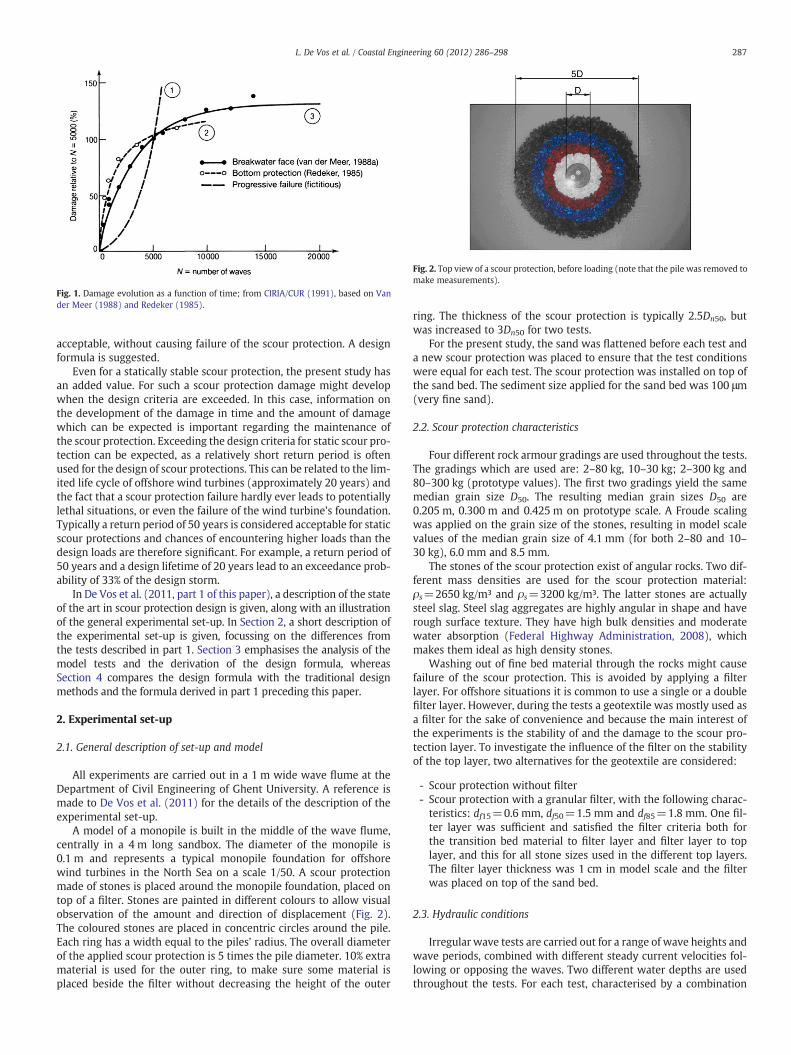
Fig. 1. Damage evolution as a function of time; from CIRIA/CUR (1991), based on Vander Meer (1988) and Redeker (1985).
Fig. 2. Top view of a scour protection, before loading (note that the pile was removed tomake measurements).
287L. De Vos et al. / Coastal Engineering 60 (2012) 286–298
acceptable, without causing failure of the scour protection. A designformula is suggested.
Even for a statically stable scour protection, the present study hasan added value. For such a scour protection damage might developwhen the design criteria are exceeded. In this case, information onthe development of the damage in time and the amount of damagewhich can be expected is important regarding the maintenance ofthe scour protection. Exceeding the design criteria for static scour pro-tection can be expected, as a relatively short return period is oftenused for the design of scour protections. This can be related to the lim-ited life cycle of offshore wind turbines (approximately 20 years) andthe fact that a scour protection failure hardly ever leads to potentiallylethal situations, or even the failure of the wind turbine's foundation.Typically a return period of 50 years is considered acceptable for staticscour protections and chances of encountering higher loads than thedesign loads are therefore significant. For example, a return period of50 years and a design lifetime of 20 years lead to an exceedance prob-ability of 33% of the design storm.
In De Vos et al. (2011, part 1 of this paper), a description of the stateof the art in scour protection design is given, along with an illustrationof the general experimental set-up. In Section 2, a short description ofthe experimental set-up is given, focussing on the differences fromthe tests described in part 1. Section 3 emphasises the analysis of themodel tests and the derivation of the design formula, whereasSection 4 compares the design formula with the traditional designmethods and the formula derived in part 1 preceding this paper.
2. Experimental set-up
2.1. General description of set-up and model
All experiments are carried out in a 1 m wide wave flume at theDepartment of Civil Engineering of Ghent University. A reference ismade to De Vos et al. (2011) for the details of the description of theexperimental set-up.
A model of a monopile is built in the middle of the wave flume,centrally in a 4 m long sandbox. The diameter of the monopile is0.1 m and represents a typical monopile foundation for offshorewind turbines in the North Sea on a scale 1/50. A scour protectionmade of stones is placed around the monopile foundation, placed ontop of a filter. Stones are painted in different colours to allow visualobservation of the amount and direction of displacement (Fig. 2).The coloured stones are placed in concentric circles around the pile.Each ring has a width equal to the piles’ radius. The overall diameterof the applied scour protection is 5 times the pile diameter. 10% extramaterial is used for the outer ring, to make sure some material isplaced beside the filter without decreasing the height of the outer
ring. The thickness of the scour protection is typically 2.5Dn50, butwas increased to 3Dn50 for two tests.
For the present study, the sand was flattened before each test anda new scour protection was placed to ensure that the test conditionswere equal for each test. The scour protection was installed on top ofthe sand bed. The sediment size applied for the sand bed was 100 μm(very fine sand).
2.2. Scour protection characteristics
Four different rock armour gradings are used throughout the tests.The gradings which are used are: 2–80 kg, 10–30 kg; 2–300 kg and80–300 kg (prototype values). The first two gradings yield the samemedian grain size D50. The resulting median grain sizes D50 are0.205 m, 0.300 m and 0.425 m on prototype scale. A Froude scalingwas applied on the grain size of the stones, resulting in model scalevalues of the median grain size of 4.1 mm (for both 2–80 and 10–30 kg), 6.0 mm and 8.5 mm.
The stones of the scour protection exist of angular rocks. Two dif-ferent mass densities are used for the scour protection material:ρs=2650 kg/m³ and ρs=3200 kg/m³. The latter stones are actuallysteel slag. Steel slag aggregates are highly angular in shape and haverough surface texture. They have high bulk densities and moderatewater absorption (Federal Highway Administration, 2008), whichmakes them ideal as high density stones.
Washing out of fine bed material through the rocks might causefailure of the scour protection. This is avoided by applying a filterlayer. For offshore situations it is common to use a single or a doublefilter layer. However, during the tests a geotextile was mostly used asa filter for the sake of convenience and because the main interest ofthe experiments is the stability of and the damage to the scour pro-tection layer. To investigate the influence of the filter on the stabilityof the top layer, two alternatives for the geotextile are considered:
- Scour protection without filter- Scour protection with a granular filter, with the following charac-teristics: df15=0.6 mm, df50=1.5 mm and df85=1.8 mm. One fil-ter layer was sufficient and satisfied the filter criteria both forthe transition bed material to filter layer and filter layer to toplayer, and this for all stone sizes used in the different top layers.The filter layer thickness was 1 cm in model scale and the filterwas placed on top of the sand bed.
2.3. Hydraulic conditions
Irregular wave tests are carried out for a range of wave heights andwave periods, combined with different steady current velocities fol-lowing or opposing the waves. Two different water depths are usedthroughout the tests. For each test, characterised by a combination
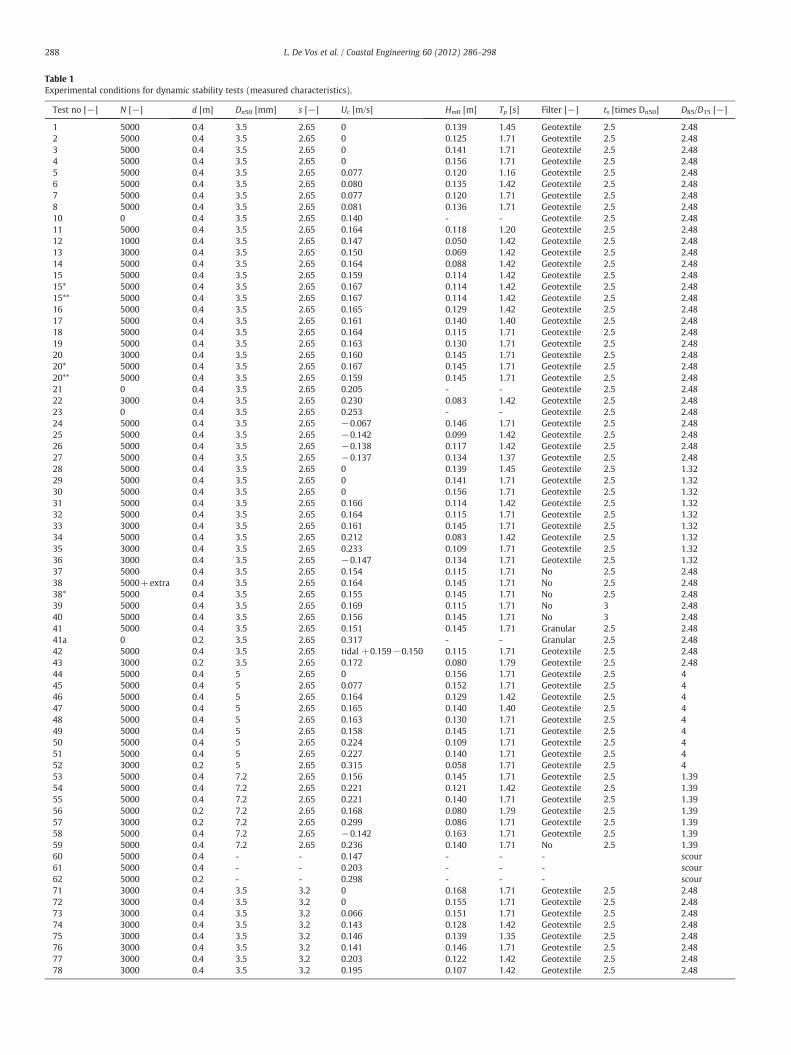
Table 1Experimental conditions for dynamic stability tests (measured characteristics).
Test no [−] N [−] d [m] Dn50 [mm] s [−] Uc [m/s] Hm0 [m] Tp [s] Filter [−] ts [times Dn50] D85/D15 [−]
1 5000 0.4 3.5 2.65 0 0.139 1.45 Geotextile 2.5 2.482 5000 0.4 3.5 2.65 0 0.125 1.71 Geotextile 2.5 2.483 5000 0.4 3.5 2.65 0 0.141 1.71 Geotextile 2.5 2.484 5000 0.4 3.5 2.65 0 0.156 1.71 Geotextile 2.5 2.485 5000 0.4 3.5 2.65 0.077 0.120 1.16 Geotextile 2.5 2.486 5000 0.4 3.5 2.65 0.080 0.135 1.42 Geotextile 2.5 2.487 5000 0.4 3.5 2.65 0.077 0.120 1.71 Geotextile 2.5 2.488 5000 0.4 3.5 2.65 0.081 0.136 1.71 Geotextile 2.5 2.4810 0 0.4 3.5 2.65 0.140 - - Geotextile 2.5 2.4811 5000 0.4 3.5 2.65 0.164 0.118 1.20 Geotextile 2.5 2.4812 1000 0.4 3.5 2.65 0.147 0.050 1.42 Geotextile 2.5 2.4813 3000 0.4 3.5 2.65 0.150 0.069 1.42 Geotextile 2.5 2.4814 5000 0.4 3.5 2.65 0.164 0.088 1.42 Geotextile 2.5 2.4815 5000 0.4 3.5 2.65 0.159 0.114 1.42 Geotextile 2.5 2.4815* 5000 0.4 3.5 2.65 0.167 0.114 1.42 Geotextile 2.5 2.4815** 5000 0.4 3.5 2.65 0.167 0.114 1.42 Geotextile 2.5 2.4816 5000 0.4 3.5 2.65 0.165 0.129 1.42 Geotextile 2.5 2.4817 5000 0.4 3.5 2.65 0.161 0.140 1.40 Geotextile 2.5 2.4818 5000 0.4 3.5 2.65 0.164 0.115 1.71 Geotextile 2.5 2.4819 5000 0.4 3.5 2.65 0.163 0.130 1.71 Geotextile 2.5 2.4820 3000 0.4 3.5 2.65 0.160 0.145 1.71 Geotextile 2.5 2.4820* 5000 0.4 3.5 2.65 0.167 0.145 1.71 Geotextile 2.5 2.4820** 5000 0.4 3.5 2.65 0.159 0.145 1.71 Geotextile 2.5 2.4821 0 0.4 3.5 2.65 0.205 - - Geotextile 2.5 2.4822 3000 0.4 3.5 2.65 0.230 0.083 1.42 Geotextile 2.5 2.4823 0 0.4 3.5 2.65 0.253 - - Geotextile 2.5 2.4824 5000 0.4 3.5 2.65 −0.067 0.146 1.71 Geotextile 2.5 2.4825 5000 0.4 3.5 2.65 −0.142 0.099 1.42 Geotextile 2.5 2.4826 5000 0.4 3.5 2.65 −0.138 0.117 1.42 Geotextile 2.5 2.4827 5000 0.4 3.5 2.65 −0.137 0.134 1.37 Geotextile 2.5 2.4828 5000 0.4 3.5 2.65 0 0.139 1.45 Geotextile 2.5 1.3229 5000 0.4 3.5 2.65 0 0.141 1.71 Geotextile 2.5 1.3230 5000 0.4 3.5 2.65 0 0.156 1.71 Geotextile 2.5 1.3231 5000 0.4 3.5 2.65 0.166 0.114 1.42 Geotextile 2.5 1.3232 5000 0.4 3.5 2.65 0.164 0.115 1.71 Geotextile 2.5 1.3233 3000 0.4 3.5 2.65 0.161 0.145 1.71 Geotextile 2.5 1.3234 5000 0.4 3.5 2.65 0.212 0.083 1.42 Geotextile 2.5 1.3235 3000 0.4 3.5 2.65 0.233 0.109 1.71 Geotextile 2.5 1.3236 3000 0.4 3.5 2.65 −0.147 0.134 1.71 Geotextile 2.5 1.3237 5000 0.4 3.5 2.65 0.154 0.115 1.71 No 2.5 2.4838 5000+extra 0.4 3.5 2.65 0.164 0.145 1.71 No 2.5 2.4838* 5000 0.4 3.5 2.65 0.155 0.145 1.71 No 2.5 2.4839 5000 0.4 3.5 2.65 0.169 0.115 1.71 No 3 2.4840 5000 0.4 3.5 2.65 0.156 0.145 1.71 No 3 2.4841 5000 0.4 3.5 2.65 0.151 0.145 1.71 Granular 2.5 2.4841a 0 0.2 3.5 2.65 0.317 - - Granular 2.5 2.4842 5000 0.4 3.5 2.65 tidal +0.159−0.150 0.115 1.71 Geotextile 2.5 2.4843 3000 0.2 3.5 2.65 0.172 0.080 1.79 Geotextile 2.5 2.4844 5000 0.4 5 2.65 0 0.156 1.71 Geotextile 2.5 445 5000 0.4 5 2.65 0.077 0.152 1.71 Geotextile 2.5 446 5000 0.4 5 2.65 0.164 0.129 1.42 Geotextile 2.5 447 5000 0.4 5 2.65 0.165 0.140 1.40 Geotextile 2.5 448 5000 0.4 5 2.65 0.163 0.130 1.71 Geotextile 2.5 449 5000 0.4 5 2.65 0.158 0.145 1.71 Geotextile 2.5 450 5000 0.4 5 2.65 0.224 0.109 1.71 Geotextile 2.5 451 5000 0.4 5 2.65 0.227 0.140 1.71 Geotextile 2.5 452 3000 0.2 5 2.65 0.315 0.058 1.71 Geotextile 2.5 453 5000 0.4 7.2 2.65 0.156 0.145 1.71 Geotextile 2.5 1.3954 5000 0.4 7.2 2.65 0.221 0.121 1.42 Geotextile 2.5 1.3955 5000 0.4 7.2 2.65 0.221 0.140 1.71 Geotextile 2.5 1.3956 5000 0.2 7.2 2.65 0.168 0.080 1.79 Geotextile 2.5 1.3957 3000 0.2 7.2 2.65 0.299 0.086 1.71 Geotextile 2.5 1.3958 5000 0.4 7.2 2.65 −0.142 0.163 1.71 Geotextile 2.5 1.3959 5000 0.4 7.2 2.65 0.236 0.140 1.71 No 2.5 1.3960 5000 0.4 - - 0.147 - - - scour61 5000 0.4 - - 0.203 - - - scour62 5000 0.2 - - 0.298 - - - scour71 3000 0.4 3.5 3.2 0 0.168 1.71 Geotextile 2.5 2.4872 3000 0.4 3.5 3.2 0 0.155 1.71 Geotextile 2.5 2.4873 3000 0.4 3.5 3.2 0.066 0.151 1.71 Geotextile 2.5 2.4874 3000 0.4 3.5 3.2 0.143 0.128 1.42 Geotextile 2.5 2.4875 3000 0.4 3.5 3.2 0.146 0.139 1.35 Geotextile 2.5 2.4876 3000 0.4 3.5 3.2 0.141 0.146 1.71 Geotextile 2.5 2.4877 3000 0.4 3.5 3.2 0.203 0.122 1.42 Geotextile 2.5 2.4878 3000 0.4 3.5 3.2 0.195 0.107 1.42 Geotextile 2.5 2.48
288 L. De Vos et al. / Coastal Engineering 60 (2012) 286–298
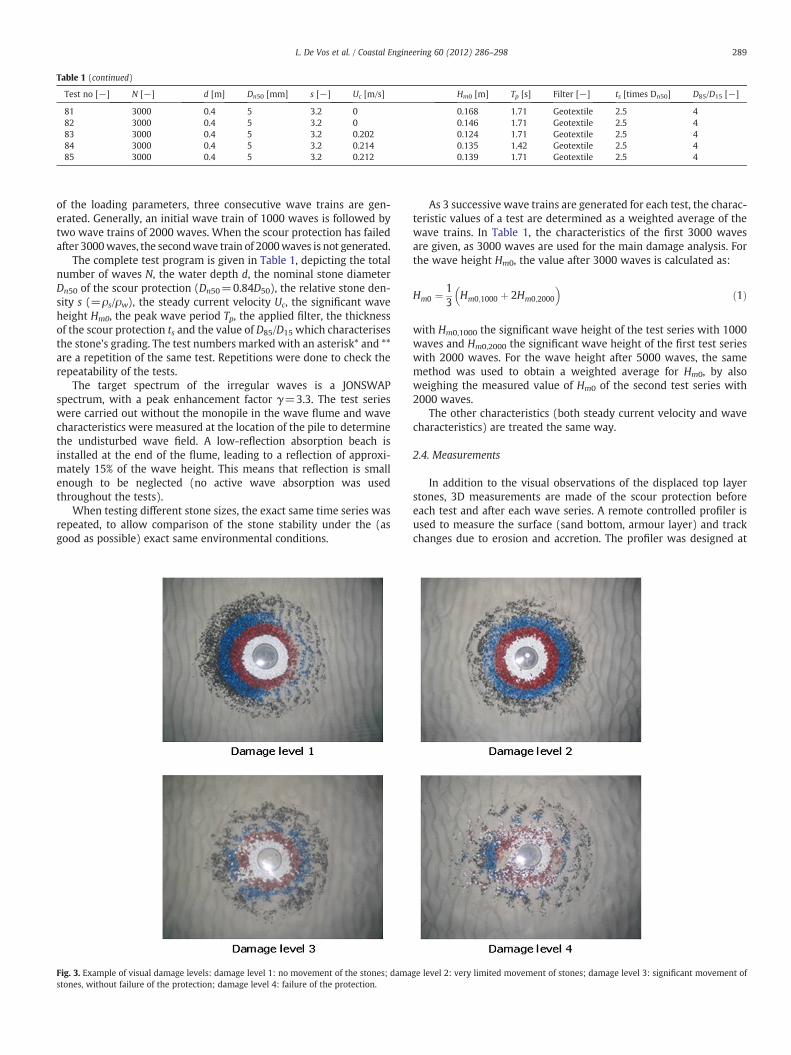
Table 1 (continued)
Test no [−] N [−] d [m] Dn50 [mm] s [−] Uc [m/s] Hm0 [m] Tp [s] Filter [−] ts [times Dn50] D85/D15 [−]
81 3000 0.4 5 3.2 0 0.168 1.71 Geotextile 2.5 482 3000 0.4 5 3.2 0 0.146 1.71 Geotextile 2.5 483 3000 0.4 5 3.2 0.202 0.124 1.71 Geotextile 2.5 484 3000 0.4 5 3.2 0.214 0.135 1.42 Geotextile 2.5 485 3000 0.4 5 3.2 0.212 0.139 1.71 Geotextile 2.5 4
289L. De Vos et al. / Coastal Engineering 60 (2012) 286–298
of the loading parameters, three consecutive wave trains are gen-erated. Generally, an initial wave train of 1000 waves is followed bytwo wave trains of 2000 waves. When the scour protection has failedafter 3000waves, the secondwave train of 2000waves is not generated.
The complete test program is given in Table 1, depicting the totalnumber of waves N, the water depth d, the nominal stone diameterDn50 of the scour protection (Dn50=0.84D50), the relative stone den-sity s (=ρs/ρw), the steady current velocity Uc, the significant waveheight Hm0, the peak wave period Tp, the applied filter, the thicknessof the scour protection ts and the value of D85/D15 which characterisesthe stone's grading. The test numbers marked with an asterisk* and **are a repetition of the same test. Repetitions were done to check therepeatability of the tests.
The target spectrum of the irregular waves is a JONSWAPspectrum, with a peak enhancement factor γ=3.3. The test serieswere carried out without the monopile in the wave flume and wavecharacteristics were measured at the location of the pile to determinethe undisturbed wave field. A low-reflection absorption beach isinstalled at the end of the flume, leading to a reflection of approxi-mately 15% of the wave height. This means that reflection is smallenough to be neglected (no active wave absorption was usedthroughout the tests).
When testing different stone sizes, the exact same time series wasrepeated, to allow comparison of the stone stability under the (asgood as possible) exact same environmental conditions.
Fig. 3. Example of visual damage levels: damage level 1: no movement of the stones; damastones, without failure of the protection; damage level 4: failure of the protection.
As 3 successive wave trains are generated for each test, the charac-teristic values of a test are determined as a weighted average of thewave trains. In Table 1, the characteristics of the first 3000 wavesare given, as 3000 waves are used for the main damage analysis. Forthe wave height Hm0, the value after 3000 waves is calculated as:
Hm0 ¼ 13
Hm0;1000 þ 2Hm0;2000
� �ð1Þ
with Hm0,1000 the significant wave height of the test series with 1000waves and Hm0,2000 the significant wave height of the first test serieswith 2000 waves. For the wave height after 5000 waves, the samemethod was used to obtain a weighted average for Hm0, by alsoweighing the measured value of Hm0 of the second test series with2000 waves.
The other characteristics (both steady current velocity and wavecharacteristics) are treated the same way.
2.4. Measurements
In addition to the visual observations of the displaced top layerstones, 3D measurements are made of the scour protection beforeeach test and after each wave series. A remote controlled profiler isused to measure the surface (sand bottom, armour layer) and trackchanges due to erosion and accretion. The profiler was designed at
ge level 2: very limited movement of stones; damage level 3: significant movement of
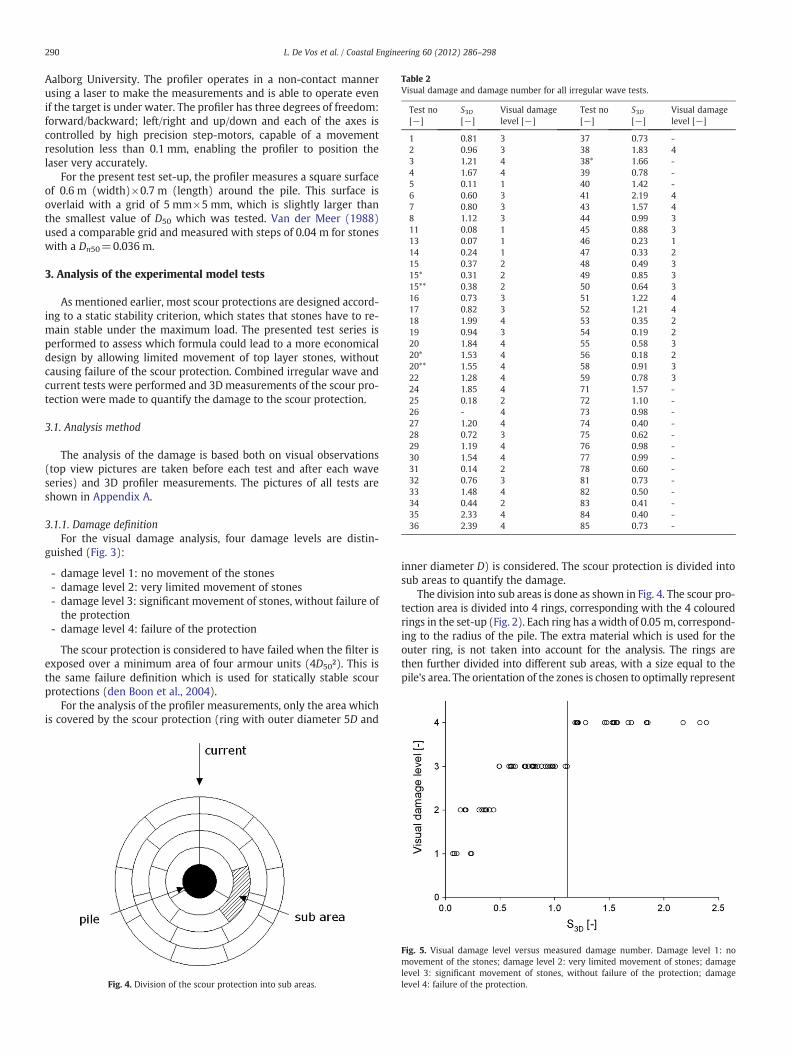
Table 2Visual damage and damage number for all irregular wave tests.
Test no[−]
S3D[−]
Visual damagelevel [−]
Test no[−]
S3D[−]
Visual damagelevel [−]
1 0.81 3 37 0.73 -2 0.96 3 38 1.83 43 1.21 4 38* 1.66 -4 1.67 4 39 0.78 -5 0.11 1 40 1.42 -6 0.60 3 41 2.19 47 0.80 3 43 1.57 48 1.12 3 44 0.99 311 0.08 1 45 0.88 313 0.07 1 46 0.23 114 0.24 1 47 0.33 215 0.37 2 48 0.49 315* 0.31 2 49 0.85 315** 0.38 2 50 0.64 316 0.73 3 51 1.22 417 0.82 3 52 1.21 418 1.99 4 53 0.35 219 0.94 3 54 0.19 220 1.84 4 55 0.58 320* 1.53 4 56 0.18 220** 1.55 4 58 0.91 322 1.28 4 59 0.78 324 1.85 4 71 1.57 -25 0.18 2 72 1.10 -26 - 4 73 0.98 -27 1.20 4 74 0.40 -28 0.72 3 75 0.62 -29 1.19 4 76 0.98 -30 1.54 4 77 0.99 -31 0.14 2 78 0.60 -32 0.76 3 81 0.73 -33 1.48 4 82 0.50 -34 0.44 2 83 0.41 -35 2.33 4 84 0.40 -36 2.39 4 85 0.73 -
290 L. De Vos et al. / Coastal Engineering 60 (2012) 286–298
Aalborg University. The profiler operates in a non-contact mannerusing a laser to make the measurements and is able to operate evenif the target is under water. The profiler has three degrees of freedom:forward/backward; left/right and up/down and each of the axes iscontrolled by high precision step-motors, capable of a movementresolution less than 0.1 mm, enabling the profiler to position thelaser very accurately.
For the present test set-up, the profiler measures a square surfaceof 0.6 m (width)×0.7 m (length) around the pile. This surface isoverlaid with a grid of 5 mm×5 mm, which is slightly larger thanthe smallest value of D50 which was tested. Van der Meer (1988)used a comparable grid and measured with steps of 0.04 m for stoneswith a Dn50=0.036 m.
3. Analysis of the experimental model tests
As mentioned earlier, most scour protections are designed accord-ing to a static stability criterion, which states that stones have to re-main stable under the maximum load. The presented test series isperformed to assess which formula could lead to a more economicaldesign by allowing limited movement of top layer stones, withoutcausing failure of the scour protection. Combined irregular wave andcurrent tests were performed and 3D measurements of the scour pro-tection were made to quantify the damage to the scour protection.
3.1. Analysis method
The analysis of the damage is based both on visual observations(top view pictures are taken before each test and after each waveseries) and 3D profiler measurements. The pictures of all tests areshown in Appendix A.
3.1.1. Damage definitionFor the visual damage analysis, four damage levels are distin-
guished (Fig. 3):
- damage level 1: no movement of the stones- damage level 2: very limited movement of stones- damage level 3: significant movement of stones, without failure ofthe protection
- damage level 4: failure of the protection
The scour protection is considered to have failed when the filter isexposed over a minimum area of four armour units (4D50²). This isthe same failure definition which is used for statically stable scourprotections (den Boon et al., 2004).
For the analysis of the profiler measurements, only the area whichis covered by the scour protection (ring with outer diameter 5D and
Fig. 4. Division of the scour protection into sub areas.
inner diameter D) is considered. The scour protection is divided intosub areas to quantify the damage.
The division into sub areas is done as shown in Fig. 4. The scour pro-tection area is divided into 4 rings, corresponding with the 4 colouredrings in the set-up (Fig. 2). Each ring has a width of 0.05 m, correspond-ing to the radius of the pile. The extra material which is used for theouter ring, is not taken into account for the analysis. The rings arethen further divided into different sub areas, with a size equal to thepile's area. The orientation of the zones is chosen to optimally represent
Fig. 5. Visual damage level versus measured damage number. Damage level 1: nomovement of the stones; damage level 2: very limited movement of stones; damagelevel 3: significant movement of stones, without failure of the protection; damagelevel 4: failure of the protection.
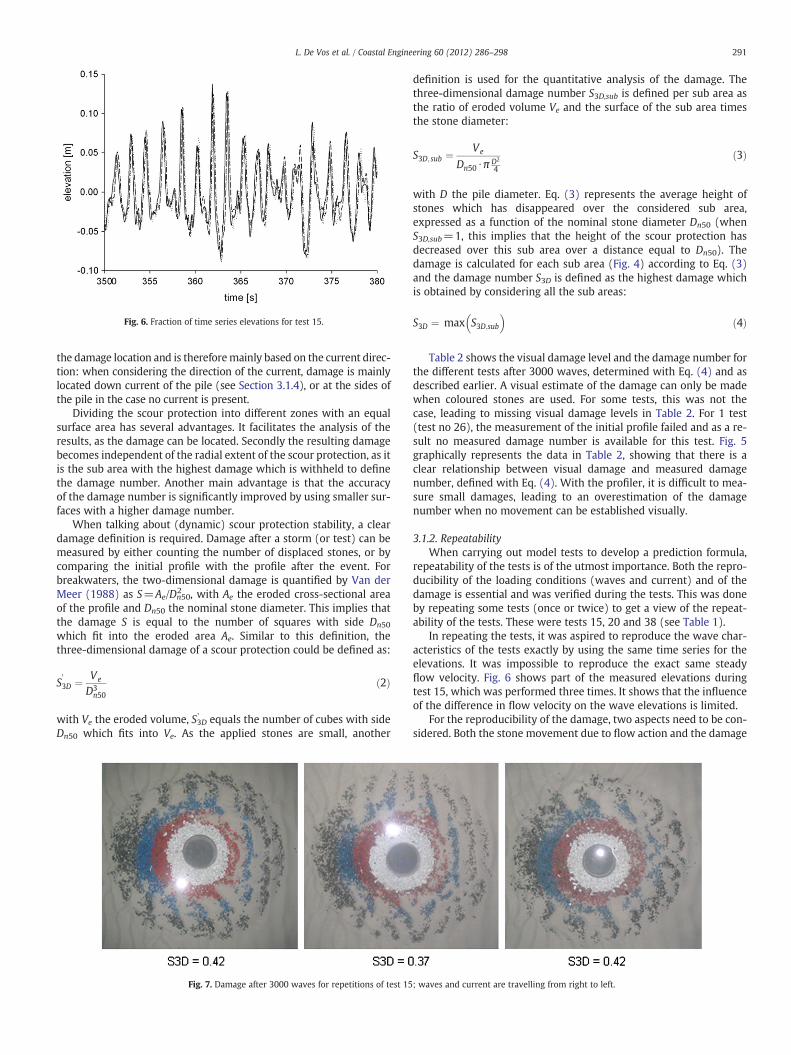
Fig. 6. Fraction of time series elevations for test 15.
291L. De Vos et al. / Coastal Engineering 60 (2012) 286–298
the damage location and is thereforemainly based on the current direc-tion: when considering the direction of the current, damage is mainlylocated down current of the pile (see Section 3.1.4), or at the sides ofthe pile in the case no current is present.
Dividing the scour protection into different zones with an equalsurface area has several advantages. It facilitates the analysis of theresults, as the damage can be located. Secondly the resulting damagebecomes independent of the radial extent of the scour protection, as itis the sub area with the highest damage which is withheld to definethe damage number. Another main advantage is that the accuracyof the damage number is significantly improved by using smaller sur-faces with a higher damage number.
When talking about (dynamic) scour protection stability, a cleardamage definition is required. Damage after a storm (or test) can bemeasured by either counting the number of displaced stones, or bycomparing the initial profile with the profile after the event. Forbreakwaters, the two-dimensional damage is quantified by Van derMeer (1988) as S=Ae/Dn50
2 , with Ae the eroded cross-sectional areaof the profile and Dn50 the nominal stone diameter. This implies thatthe damage S is equal to the number of squares with side Dn50
which fit into the eroded area Ae. Similar to this definition, thethree-dimensional damage of a scour protection could be defined as:
S0
3D ¼ Ve
D3n50
ð2Þ
with Ve the eroded volume, S3D' equals the number of cubes with sideDn50 which fits into Ve. As the applied stones are small, another
Fig. 7. Damage after 3000 waves for repetitions of test 15
definition is used for the quantitative analysis of the damage. Thethree-dimensional damage number S3D,sub is defined per sub area asthe ratio of eroded volume Ve and the surface of the sub area timesthe stone diameter:
S3D; sub ¼ Ve
Dn50 ⋅π D2
4
ð3Þ
with D the pile diameter. Eq. (3) represents the average height ofstones which has disappeared over the considered sub area,expressed as a function of the nominal stone diameter Dn50 (whenS3D,sub=1, this implies that the height of the scour protection hasdecreased over this sub area over a distance equal to Dn50). Thedamage is calculated for each sub area (Fig. 4) according to Eq. (3)and the damage number S3D is defined as the highest damage whichis obtained by considering all the sub areas:
S3D ¼ max S3D;sub� �
ð4Þ
Table 2 shows the visual damage level and the damage number forthe different tests after 3000 waves, determined with Eq. (4) and asdescribed earlier. A visual estimate of the damage can only be madewhen coloured stones are used. For some tests, this was not thecase, leading to missing visual damage levels in Table 2. For 1 test(test no 26), the measurement of the initial profile failed and as a re-sult no measured damage number is available for this test. Fig. 5graphically represents the data in Table 2, showing that there is aclear relationship between visual damage and measured damagenumber, defined with Eq. (4). With the profiler, it is difficult to mea-sure small damages, leading to an overestimation of the damagenumber when no movement can be established visually.
3.1.2. RepeatabilityWhen carrying out model tests to develop a prediction formula,
repeatability of the tests is of the utmost importance. Both the repro-ducibility of the loading conditions (waves and current) and of thedamage is essential and was verified during the tests. This was doneby repeating some tests (once or twice) to get a view of the repeat-ability of the tests. These were tests 15, 20 and 38 (see Table 1).
In repeating the tests, it was aspired to reproduce the wave char-acteristics of the tests exactly by using the same time series for theelevations. It was impossible to reproduce the exact same steadyflow velocity. Fig. 6 shows part of the measured elevations duringtest 15, which was performed three times. It shows that the influenceof the difference in flow velocity on the wave elevations is limited.
For the reproducibility of the damage, two aspects need to be con-sidered. Both the stone movement due to flow action and the damage
; waves and current are travelling from right to left.
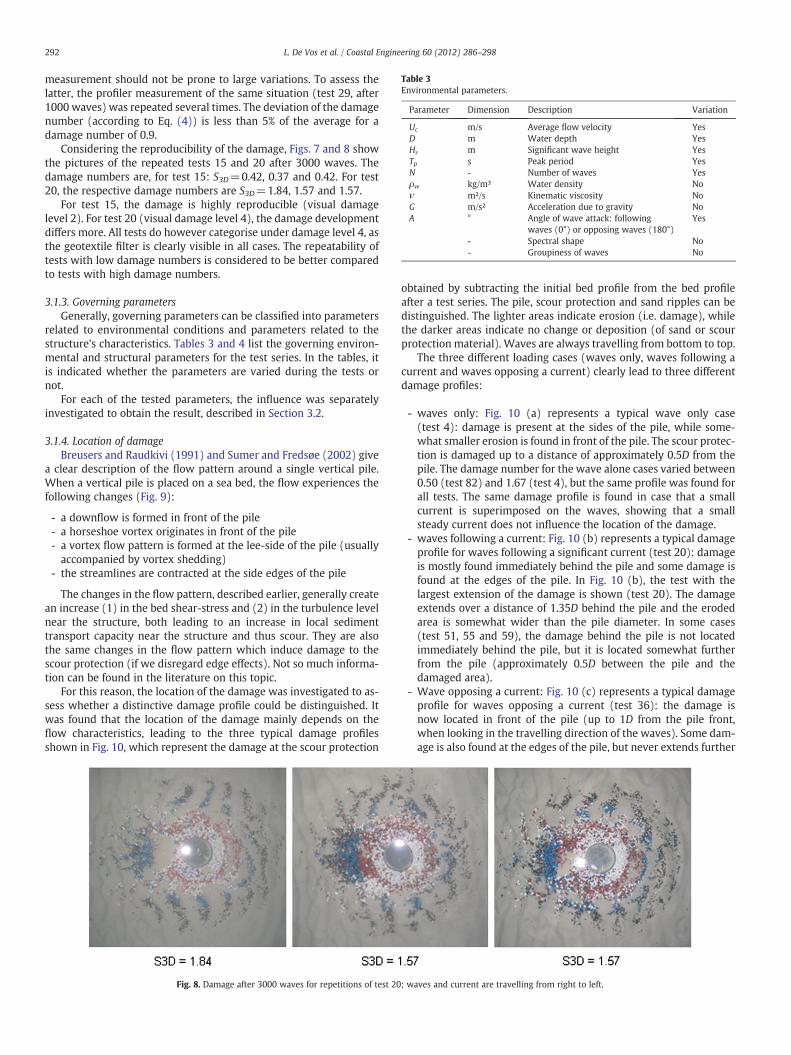
Table 3Environmental parameters.
Parameter Dimension Description Variation
Uc m/s Average flow velocity YesD m Water depth YesHs m Significant wave height YesTp s Peak period YesN - Number of waves Yesρw kg/m³ Water density Noν m²/s Kinematic viscosity NoG m/s² Acceleration due to gravity NoΑ ° Angle of wave attack: following
waves (0°) or opposing waves (180°)Yes
- Spectral shape No- Groupiness of waves No
292 L. De Vos et al. / Coastal Engineering 60 (2012) 286–298
measurement should not be prone to large variations. To assess thelatter, the profiler measurement of the same situation (test 29, after1000 waves) was repeated several times. The deviation of the damagenumber (according to Eq. (4)) is less than 5% of the average for adamage number of 0.9.
Considering the reproducibility of the damage, Figs. 7 and 8 showthe pictures of the repeated tests 15 and 20 after 3000 waves. Thedamage numbers are, for test 15: S3D=0.42, 0.37 and 0.42. For test20, the respective damage numbers are S3D=1.84, 1.57 and 1.57.
For test 15, the damage is highly reproducible (visual damagelevel 2). For test 20 (visual damage level 4), the damage developmentdiffers more. All tests do however categorise under damage level 4, asthe geotextile filter is clearly visible in all cases. The repeatability oftests with low damage numbers is considered to be better comparedto tests with high damage numbers.
3.1.3. Governing parametersGenerally, governing parameters can be classified into parameters
related to environmental conditions and parameters related to thestructure's characteristics. Tables 3 and 4 list the governing environ-mental and structural parameters for the test series. In the tables, itis indicated whether the parameters are varied during the tests ornot.
For each of the tested parameters, the influence was separatelyinvestigated to obtain the result, described in Section 3.2.
3.1.4. Location of damageBreusers and Raudkivi (1991) and Sumer and Fredsøe (2002) give
a clear description of the flow pattern around a single vertical pile.When a vertical pile is placed on a sea bed, the flow experiences thefollowing changes (Fig. 9):
- a downflow is formed in front of the pile- a horseshoe vortex originates in front of the pile- a vortex flow pattern is formed at the lee-side of the pile (usuallyaccompanied by vortex shedding)
- the streamlines are contracted at the side edges of the pile
The changes in the flow pattern, described earlier, generally createan increase (1) in the bed shear-stress and (2) in the turbulence levelnear the structure, both leading to an increase in local sedimenttransport capacity near the structure and thus scour. They are alsothe same changes in the flow pattern which induce damage to thescour protection (if we disregard edge effects). Not so much informa-tion can be found in the literature on this topic.
For this reason, the location of the damage was investigated to as-sess whether a distinctive damage profile could be distinguished. Itwas found that the location of the damage mainly depends on theflow characteristics, leading to the three typical damage profilesshown in Fig. 10, which represent the damage at the scour protection
Fig. 8. Damage after 3000 waves for repetitions of test 20
obtained by subtracting the initial bed profile from the bed profileafter a test series. The pile, scour protection and sand ripples can bedistinguished. The lighter areas indicate erosion (i.e. damage), whilethe darker areas indicate no change or deposition (of sand or scourprotection material). Waves are always travelling from bottom to top.
The three different loading cases (waves only, waves following acurrent and waves opposing a current) clearly lead to three differentdamage profiles:
- waves only: Fig. 10 (a) represents a typical wave only case(test 4): damage is present at the sides of the pile, while some-what smaller erosion is found in front of the pile. The scour protec-tion is damaged up to a distance of approximately 0.5D from thepile. The damage number for the wave alone cases varied between0.50 (test 82) and 1.67 (test 4), but the same profile was found forall tests. The same damage profile is found in case that a smallcurrent is superimposed on the waves, showing that a smallsteady current does not influence the location of the damage.
- waves following a current: Fig. 10 (b) represents a typical damageprofile for waves following a significant current (test 20): damageis mostly found immediately behind the pile and some damage isfound at the edges of the pile. In Fig. 10 (b), the test with thelargest extension of the damage is shown (test 20). The damageextends over a distance of 1.35D behind the pile and the erodedarea is somewhat wider than the pile diameter. In some cases(test 51, 55 and 59), the damage behind the pile is not locatedimmediately behind the pile, but it is located somewhat furtherfrom the pile (approximately 0.5D between the pile and thedamaged area).
- Wave opposing a current: Fig. 10 (c) represents a typical damageprofile for waves opposing a current (test 36): the damage isnow located in front of the pile (up to 1D from the pile front,when looking in the travelling direction of the waves). Some dam-age is also found at the edges of the pile, but never extends further
; waves and current are travelling from right to left.
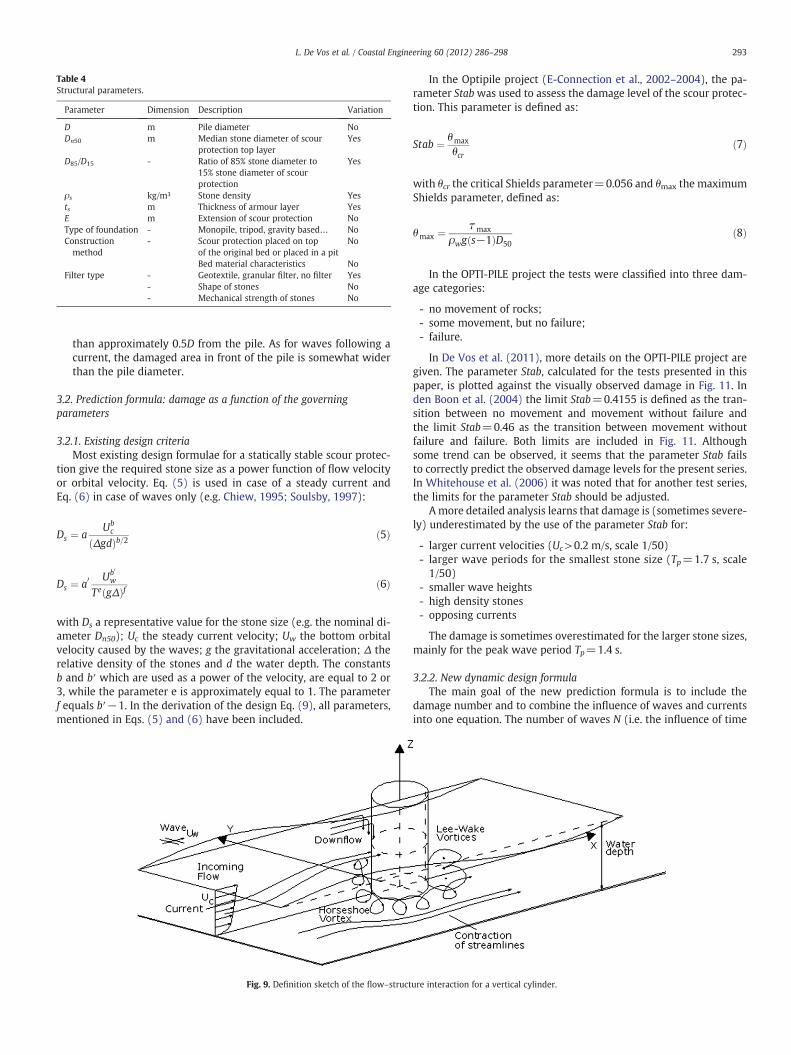
Table 4Structural parameters.
Parameter Dimension Description Variation
D m Pile diameter NoDn50 m Median stone diameter of scour
protection top layerYes
D85/D15 - Ratio of 85% stone diameter to15% stone diameter of scourprotection
Yes
ρs kg/m³ Stone density Yests m Thickness of armour layer YesE m Extension of scour protection NoType of foundation - Monopile, tripod, gravity based… NoConstructionmethod
- Scour protection placed on topof the original bed or placed in a pit
No
Bed material characteristics NoFilter type - Geotextile, granular filter, no filter Yes
- Shape of stones No- Mechanical strength of stones No
293L. De Vos et al. / Coastal Engineering 60 (2012) 286–298
than approximately 0.5D from the pile. As for waves following acurrent, the damaged area in front of the pile is somewhat widerthan the pile diameter.
3.2. Prediction formula: damage as a function of the governingparameters
3.2.1. Existing design criteriaMost existing design formulae for a statically stable scour protec-
tion give the required stone size as a power function of flow velocityor orbital velocity. Eq. (5) is used in case of a steady current andEq. (6) in case of waves only (e.g. Chiew, 1995; Soulsby, 1997):
Ds ¼ aUb
c
Δgdð Þb=2 ð5Þ
Ds ¼ a0Ub0
w
Te gΔð Þf ð6Þ
with Ds a representative value for the stone size (e.g. the nominal di-ameter Dn50); Uc the steady current velocity; Uw the bottom orbitalvelocity caused by the waves; g the gravitational acceleration; Δ therelative density of the stones and d the water depth. The constantsb and b′ which are used as a power of the velocity, are equal to 2 or3, while the parameter e is approximately equal to 1. The parameterf equals b′−1. In the derivation of the design Eq. (9), all parameters,mentioned in Eqs. (5) and (6) have been included.
Fig. 9. Definition sketch of the flow–struct
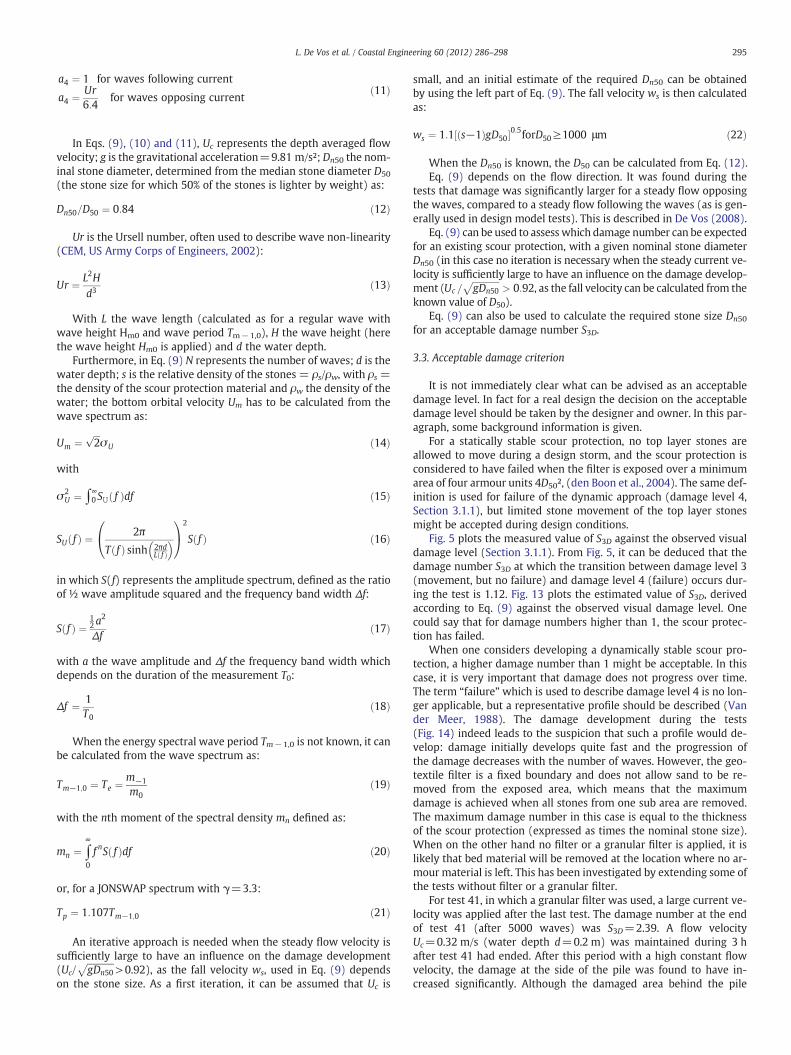
In the Optipile project (E-Connection et al., 2002–2004), the pa-rameter Stabwas used to assess the damage level of the scour protec-tion. This parameter is defined as:
Stab ¼ θmax
θcrð7Þ
with θcr the critical Shields parameter=0.056 and θmax the maximumShields parameter, defined as:
θmax ¼ τmax
ρwg s−1ð ÞD50ð8Þ
In the OPTI-PILE project the tests were classified into three dam-age categories:
- no movement of rocks;- some movement, but no failure;- failure.
In De Vos et al. (2011), more details on the OPTI-PILE project aregiven. The parameter Stab, calculated for the tests presented in thispaper, is plotted against the visually observed damage in Fig. 11. Inden Boon et al. (2004) the limit Stab=0.4155 is defined as the tran-sition between no movement and movement without failure andthe limit Stab=0.46 as the transition between movement withoutfailure and failure. Both limits are included in Fig. 11. Althoughsome trend can be observed, it seems that the parameter Stab failsto correctly predict the observed damage levels for the present series.In Whitehouse et al. (2006) it was noted that for another test series,the limits for the parameter Stab should be adjusted.
A more detailed analysis learns that damage is (sometimes severe-ly) underestimated by the use of the parameter Stab for:
- larger current velocities (Uc>0.2 m/s, scale 1/50)- larger wave periods for the smallest stone size (Tp=1.7 s, scale1/50)
- smaller wave heights- high density stones- opposing currents
The damage is sometimes overestimated for the larger stone sizes,mainly for the peak wave period Tp=1.4 s.
3.2.2. New dynamic design formulaThe main goal of the new prediction formula is to include the
damage number and to combine the influence of waves and currentsinto one equation. The number of waves N (i.e. the influence of time
ure interaction for a vertical cylinder.
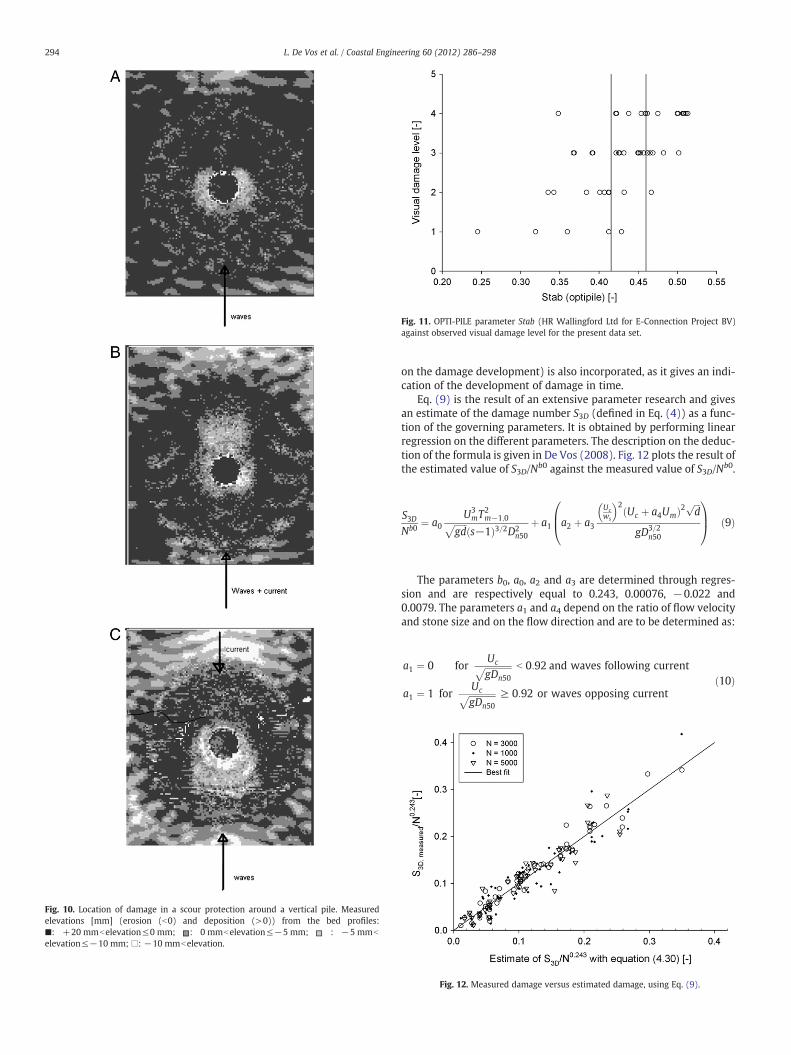
Fig. 10. Location of damage in a scour protection around a vertical pile. Measuredelevations [mm] (erosion (b0) and deposition (>0)) from the bed profiles:■: +20 mmbelevation≤0 mm; : 0 mmbelevation≤−5 mm; : −5 mmb
elevation≤−10 mm; □: −10 mmbelevation.
Fig. 11. OPTI-PILE parameter Stab (HR Wallingford Ltd for E-Connection Project BV)against observed visual damage level for the present data set.
294 L. De Vos et al. / Coastal Engineering 60 (2012) 286–298
on the damage development) is also incorporated, as it gives an indi-cation of the development of damage in time.
Eq. (9) is the result of an extensive parameter research and givesan estimate of the damage number S3D (defined in Eq. (4)) as a func-tion of the governing parameters. It is obtained by performing linearregression on the different parameters. The description on the deduc-tion of the formula is given in De Vos (2008). Fig. 12 plots the result ofthe estimated value of S3D/Nb0 against the measured value of S3D/Nb0.
S3DNb0
¼ a0U3
mT2m−1;0ffiffiffiffiffiffi
gdp
s−1ð Þ3=2D2n50
þ a1 a2 þ a3
Ucws
� �2Uc þ a4Umð Þ2
ffiffiffid
p
gD3=2n50
0B@
1CA ð9Þ
The parameters b0, a0, a2 and a3 are determined through regres-sion and are respectively equal to 0.243, 0.00076, −0.022 and0.0079. The parameters a1 and a4 depend on the ratio of flow velocityand stone size and on the flow direction and are to be determined as:
a1 ¼ 0 forUcffiffiffiffiffiffiffiffiffiffiffiffigDn50
p b 0:92 and waves following current
a1 ¼ 1 forUcffiffiffiffiffiffiffiffiffiffiffiffigDn50
p ≥ 0:92 or waves opposing currentð10Þ
Fig. 12. Measured damage versus estimated damage, using Eq. (9).
295L. De Vos et al. / Coastal Engineering 60 (2012) 286–298
a4 ¼ 1 for waves following current
a4 ¼ Ur6:4
for waves opposing currentð11Þ
In Eqs. (9), (10) and (11), Uc represents the depth averaged flowvelocity; g is the gravitational acceleration=9.81 m/s²; Dn50 the nom-inal stone diameter, determined from the median stone diameter D50
(the stone size for which 50% of the stones is lighter by weight) as:
Dn50=D50 ¼ 0:84 ð12Þ
Ur is the Ursell number, often used to describe wave non-linearity(CEM, US Army Corps of Engineers, 2002):
Ur ¼ L2Hd3
ð13Þ
With L the wave length (calculated as for a regular wave withwave height Hm0 and wave period Tm−1,0), H the wave height (herethe wave height Hm0 is applied) and d the water depth.
Furthermore, in Eq. (9) N represents the number of waves; d is thewater depth; s is the relative density of the stones = ρs/ρw, with ρs =the density of the scour protection material and ρw the density of thewater; the bottom orbital velocity Um has to be calculated from thewave spectrum as:
Um ¼ffiffiffi2
pσU ð14Þ
with
σ2U ¼ ∫∞
0 SU fð Þdf ð15Þ
SU fð Þ ¼ 2π
T fð Þ sinh 2πdL fð Þ
� �0@
1A
2
S fð Þ ð16Þ
in which S(f) represents the amplitude spectrum, defined as the ratioof ½ wave amplitude squared and the frequency band width Δf:
S fð Þ ¼12 a
2
Δfð17Þ
with a the wave amplitude and Δf the frequency band width whichdepends on the duration of the measurement T0:
Δf ¼ 1T0
ð18Þ
When the energy spectral wave period Tm−1,0 is not known, it canbe calculated from the wave spectrum as:
Tm−1;0 ¼ Te ¼m−1
m0ð19Þ
with the nth moment of the spectral density mn defined as:
mn ¼ ∫∞
0
f nS fð Þdf ð20Þ
or, for a JONSWAP spectrum with γ=3.3:
Tp ¼ 1:107Tm−1;0 ð21Þ
An iterative approach is needed when the steady flow velocity issufficiently large to have an influence on the damage development(Uc/
ffiffiffiffiffiffiffiffiffiffiffiffigDn50
p>0.92), as the fall velocity ws, used in Eq. (9) depends
on the stone size. As a first iteration, it can be assumed that Uc is
small, and an initial estimate of the required Dn50 can be obtainedby using the left part of Eq. (9). The fall velocity ws is then calculatedas:
ws ¼ 1:1 s−1ð ÞgD50½ �0:5forD50≥1000 μm ð22Þ
When the Dn50 is known, the D50 can be calculated from Eq. (12).Eq. (9) depends on the flow direction. It was found during the
tests that damage was significantly larger for a steady flow opposingthe waves, compared to a steady flow following the waves (as is gen-erally used in design model tests). This is described in De Vos (2008).
Eq. (9) can be used to assess which damage number can be expectedfor an existing scour protection, with a given nominal stone diameterDn50 (in this case no iteration is necessary when the steady current ve-locity is sufficiently large to have an influence on the damage develop-ment (Uc =
ffiffiffiffiffiffiffiffiffiffiffiffigDn50
p> 0:92, as the fall velocity can be calculated from the
known value of D50).Eq. (9) can also be used to calculate the required stone size Dn50
for an acceptable damage number S3D.
3.3. Acceptable damage criterion
It is not immediately clear what can be advised as an acceptabledamage level. In fact for a real design the decision on the acceptabledamage level should be taken by the designer and owner. In this par-agraph, some background information is given.
For a statically stable scour protection, no top layer stones areallowed to move during a design storm, and the scour protection isconsidered to have failed when the filter is exposed over a minimumarea of four armour units 4D50², (den Boon et al., 2004). The same def-inition is used for failure of the dynamic approach (damage level 4,Section 3.1.1), but limited stone movement of the top layer stonesmight be accepted during design conditions.
Fig. 5 plots the measured value of S3D against the observed visualdamage level (Section 3.1.1). From Fig. 5, it can be deduced that thedamage number S3D at which the transition between damage level 3(movement, but no failure) and damage level 4 (failure) occurs dur-ing the test is 1.12. Fig. 13 plots the estimated value of S3D, derivedaccording to Eq. (9) against the observed visual damage level. Onecould say that for damage numbers higher than 1, the scour protec-tion has failed.
When one considers developing a dynamically stable scour pro-tection, a higher damage number than 1 might be acceptable. In thiscase, it is very important that damage does not progress over time.The term “failure” which is used to describe damage level 4 is no lon-ger applicable, but a representative profile should be described (Vander Meer, 1988). The damage development during the tests(Fig. 14) indeed leads to the suspicion that such a profile would de-velop: damage initially develops quite fast and the progression ofthe damage decreases with the number of waves. However, the geo-textile filter is a fixed boundary and does not allow sand to be re-moved from the exposed area, which means that the maximumdamage is achieved when all stones from one sub area are removed.The maximum damage number in this case is equal to the thicknessof the scour protection (expressed as times the nominal stone size).When on the other hand no filter or a granular filter is applied, it islikely that bed material will be removed at the location where no ar-mour material is left. This has been investigated by extending some ofthe tests without filter or a granular filter.
For test 41, in which a granular filter was used, a large current ve-locity was applied after the last test. The damage number at the endof test 41 (after 5000 waves) was S3D=2.39. A flow velocityUc=0.32 m/s (water depth d=0.2 m) was maintained during 3 hafter test 41 had ended. After this period with a high constant flowvelocity, the damage at the side of the pile was found to have in-creased significantly. Although the damaged area behind the pile
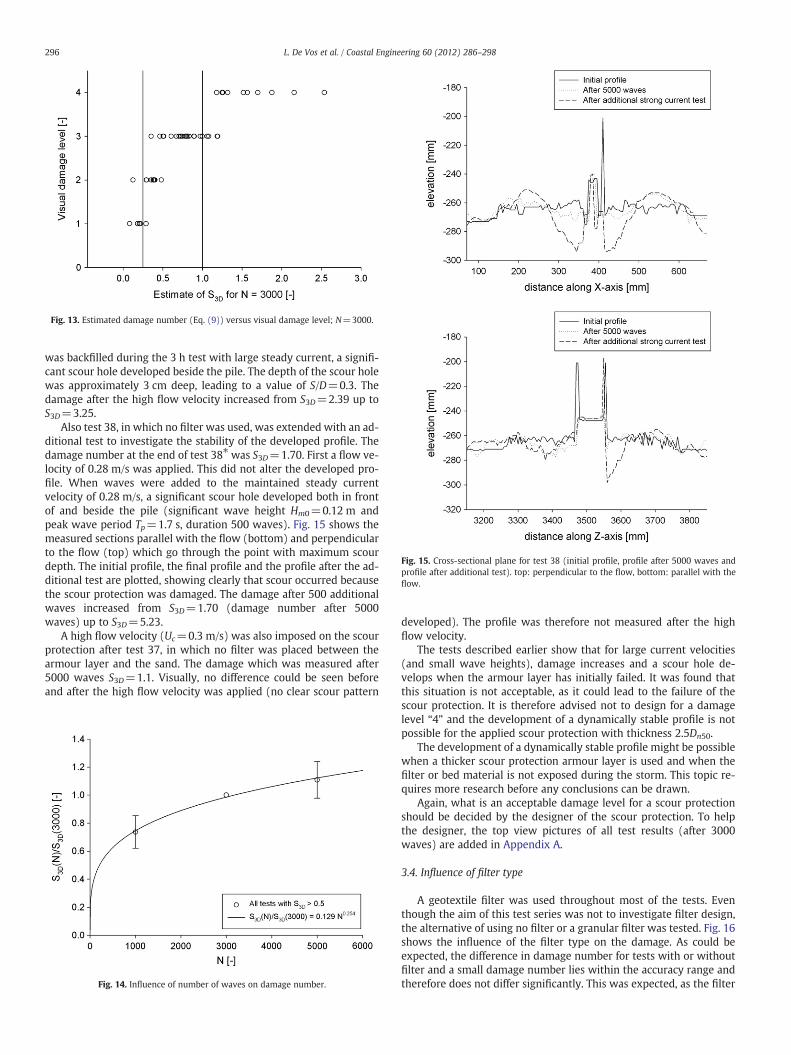
Fig. 15. Cross-sectional plane for test 38 (initial profile, profile after 5000 waves andprofile after additional test). top: perpendicular to the flow, bottom: parallel with theflow.
Fig. 13. Estimated damage number (Eq. (9)) versus visual damage level; N=3000.
296 L. De Vos et al. / Coastal Engineering 60 (2012) 286–298
was backfilled during the 3 h test with large steady current, a signifi-cant scour hole developed beside the pile. The depth of the scour holewas approximately 3 cm deep, leading to a value of S/D=0.3. Thedamage after the high flow velocity increased from S3D=2.39 up toS3D=3.25.
Also test 38, in which no filter was used, was extended with an ad-ditional test to investigate the stability of the developed profile. Thedamage number at the end of test 38⁎ was S3D=1.70. First a flow ve-locity of 0.28 m/s was applied. This did not alter the developed pro-file. When waves were added to the maintained steady currentvelocity of 0.28 m/s, a significant scour hole developed both in frontof and beside the pile (significant wave height Hm0=0.12 m andpeak wave period Tp=1.7 s, duration 500 waves). Fig. 15 shows themeasured sections parallel with the flow (bottom) and perpendicularto the flow (top) which go through the point with maximum scourdepth. The initial profile, the final profile and the profile after the ad-ditional test are plotted, showing clearly that scour occurred becausethe scour protection was damaged. The damage after 500 additionalwaves increased from S3D=1.70 (damage number after 5000waves) up to S3D=5.23.
A high flow velocity (Uc=0.3 m/s) was also imposed on the scourprotection after test 37, in which no filter was placed between thearmour layer and the sand. The damage which was measured after5000 waves S3D=1.1. Visually, no difference could be seen beforeand after the high flow velocity was applied (no clear scour pattern
Fig. 14. Influence of number of waves on damage number.
developed). The profile was therefore not measured after the highflow velocity.
The tests described earlier show that for large current velocities(and small wave heights), damage increases and a scour hole de-velops when the armour layer has initially failed. It was found thatthis situation is not acceptable, as it could lead to the failure of thescour protection. It is therefore advised not to design for a damagelevel “4” and the development of a dynamically stable profile is notpossible for the applied scour protection with thickness 2.5Dn50.
The development of a dynamically stable profile might be possiblewhen a thicker scour protection armour layer is used and when thefilter or bed material is not exposed during the storm. This topic re-quires more research before any conclusions can be drawn.
Again, what is an acceptable damage level for a scour protectionshould be decided by the designer of the scour protection. To helpthe designer, the top view pictures of all test results (after 3000waves) are added in Appendix A.
3.4. Influence of filter type
A geotextile filter was used throughout most of the tests. Eventhough the aim of this test series was not to investigate filter design,the alternative of using no filter or a granular filter was tested. Fig. 16shows the influence of the filter type on the damage. As could beexpected, the difference in damage number for tests with or withoutfilter and a small damage number lies within the accuracy range andtherefore does not differ significantly. This was expected, as the filter
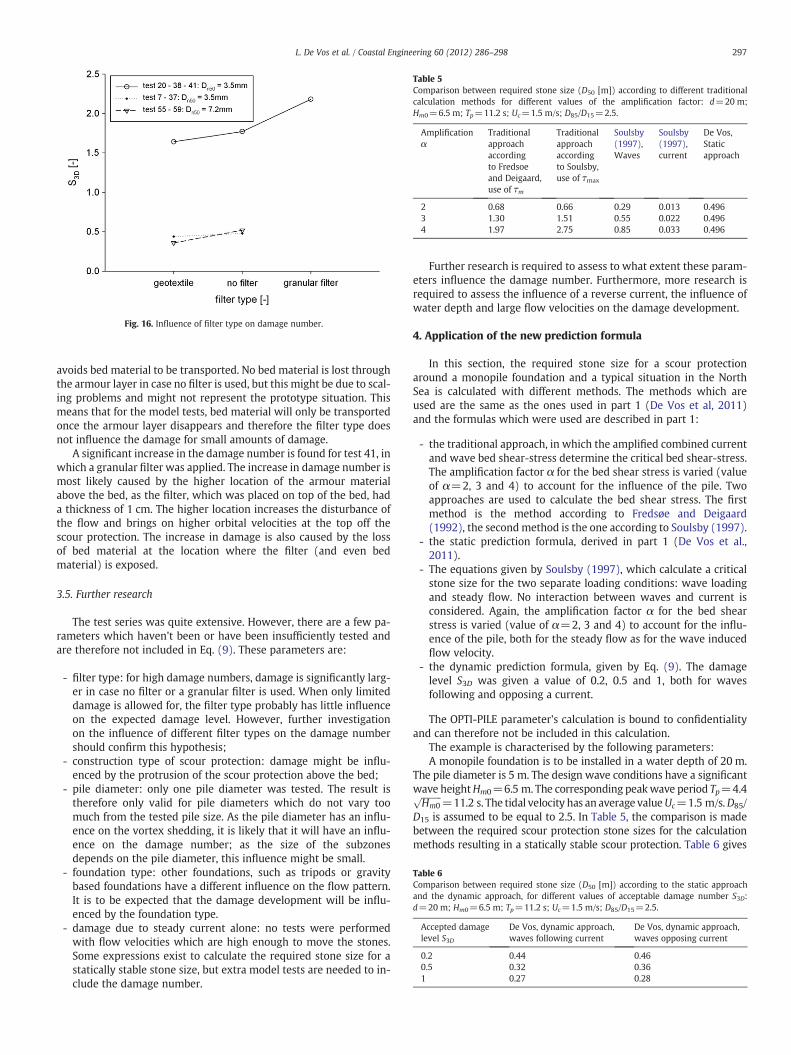
Table 5Comparison between required stone size (D50 [m]) according to different traditionalcalculation methods for different values of the amplification factor: d=20 m;Hm0=6.5 m; Tp=11.2 s; Uc=1.5 m/s; D85/D15=2.5.
Amplificationα
Traditionalapproachaccordingto Fredsoeand Deigaard,use of τm
Traditionalapproachaccordingto Soulsby,use of τmax
Soulsby(1997),Waves
Soulsby(1997),current
De Vos,Staticapproach
2 0.68 0.66 0.29 0.013 0.4963 1.30 1.51 0.55 0.022 0.4964 1.97 2.75 0.85 0.033 0.496
Table 6Comparison between required stone size (D50 [m]) according to the static approachand the dynamic approach, for different values of acceptable damage number S3D:d=20 m; Hm0=6.5 m; Tp=11.2 s; Uc=1.5 m/s; D85/D15=2.5.
Accepted damagelevel S3D
De Vos, dynamic approach,waves following current
De Vos, dynamic approach,waves opposing current
0.2 0.44 0.460.5 0.32 0.361 0.27 0.28
Fig. 16. Influence of filter type on damage number.
297L. De Vos et al. / Coastal Engineering 60 (2012) 286–298
avoids bed material to be transported. No bed material is lost throughthe armour layer in case no filter is used, but this might be due to scal-ing problems and might not represent the prototype situation. Thismeans that for the model tests, bed material will only be transportedonce the armour layer disappears and therefore the filter type doesnot influence the damage for small amounts of damage.
A significant increase in the damage number is found for test 41, inwhich a granular filter was applied. The increase in damage number ismost likely caused by the higher location of the armour materialabove the bed, as the filter, which was placed on top of the bed, hada thickness of 1 cm. The higher location increases the disturbance ofthe flow and brings on higher orbital velocities at the top off thescour protection. The increase in damage is also caused by the lossof bed material at the location where the filter (and even bedmaterial) is exposed.
3.5. Further research
The test series was quite extensive. However, there are a few pa-rameters which haven't been or have been insufficiently tested andare therefore not included in Eq. (9). These parameters are:
- filter type: for high damage numbers, damage is significantly larg-er in case no filter or a granular filter is used. When only limiteddamage is allowed for, the filter type probably has little influenceon the expected damage level. However, further investigationon the influence of different filter types on the damage numbershould confirm this hypothesis;
- construction type of scour protection: damage might be influ-enced by the protrusion of the scour protection above the bed;
- pile diameter: only one pile diameter was tested. The result istherefore only valid for pile diameters which do not vary toomuch from the tested pile size. As the pile diameter has an influ-ence on the vortex shedding, it is likely that it will have an influ-ence on the damage number; as the size of the subzonesdepends on the pile diameter, this influence might be small.
- foundation type: other foundations, such as tripods or gravitybased foundations have a different influence on the flow pattern.It is to be expected that the damage development will be influ-enced by the foundation type.
- damage due to steady current alone: no tests were performedwith flow velocities which are high enough to move the stones.Some expressions exist to calculate the required stone size for astatically stable stone size, but extra model tests are needed to in-clude the damage number.
Further research is required to assess to what extent these param-eters influence the damage number. Furthermore, more research isrequired to assess the influence of a reverse current, the influence ofwater depth and large flow velocities on the damage development.
4. Application of the new prediction formula
In this section, the required stone size for a scour protectionaround a monopile foundation and a typical situation in the NorthSea is calculated with different methods. The methods which areused are the same as the ones used in part 1 (De Vos et al, 2011)and the formulas which were used are described in part 1:
- the traditional approach, in which the amplified combined currentand wave bed shear-stress determine the critical bed shear-stress.The amplification factor α for the bed shear stress is varied (valueof α=2, 3 and 4) to account for the influence of the pile. Twoapproaches are used to calculate the bed shear stress. The firstmethod is the method according to Fredsøe and Deigaard(1992), the secondmethod is the one according to Soulsby (1997).
- the static prediction formula, derived in part 1 (De Vos et al.,2011).
- The equations given by Soulsby (1997), which calculate a criticalstone size for the two separate loading conditions: wave loadingand steady flow. No interaction between waves and current isconsidered. Again, the amplification factor α for the bed shearstress is varied (value of α=2, 3 and 4) to account for the influ-ence of the pile, both for the steady flow as for the wave inducedflow velocity.
- the dynamic prediction formula, given by Eq. (9). The damagelevel S3D was given a value of 0.2, 0.5 and 1, both for wavesfollowing and opposing a current.
The OPTI-PILE parameter's calculation is bound to confidentialityand can therefore not be included in this calculation.
The example is characterised by the following parameters:A monopile foundation is to be installed in a water depth of 20 m.
The pile diameter is 5 m. The design wave conditions have a significantwave heightHm0=6.5 m. The corresponding peakwave period Tp=4.4ffiffiffiffiffiffiffiffiffiHm0
p=11.2 s. The tidal velocity has an average valueUc=1.5 m/s.D85/
D15 is assumed to be equal to 2.5. In Table 5, the comparison is madebetween the required scour protection stone sizes for the calculationmethods resulting in a statically stable scour protection. Table 6 gives
298 L. De Vos et al. / Coastal Engineering 60 (2012) 286–298
the results for the required stone size when using Eq. (9) for differentvalues of S3D. It shows that, for this example, the stone size is onlyslightly smaller than the stone size obtained with the static approachfrom part 1 when using a very small value of the accepted damagelevel (e.g. S3D=0.2). A significantly smaller stone size can be obtainedwhen using Eq. (9) and allowing a somewhat higher amount of damage(S3D between 0.5 and 1). For this example a reduction factor between1.2 and 1.8 is obtained. As mentioned, a slightly larger stone size isrequired when applying a reverse current.
5. Conclusion
In this paper, the experimental research which was performed todetermine the required stone size for the top layer of a scour protec-tion around a monopile foundation in a combined wave–currentclimate is discussed. A dynamic design approach is used, leading toa scour protection for which limited movement of top layer stonesduring a design storm might be accepted.
The experiments were performed with irregular waves and asteady current on a scale 1/50. Design Eq. (9) gives the requiredstone size as a function of the accepted damage number. It wasfound that damage is higher for a steady current opposing thewaves, and that the damage profile mainly depends on the directionand presence of the steady current. Furthermore, some tests werecarried out to verify whether a dynamically stable profile developsfor large damage numbers. This did not seem to be the case. It istherefore advised to design for a limited accepted damage level,when applying a scour protection with a limited thickness (e.g.2.5Dn50, which was also applied during the tests).
When comparing the proposed design formula to the existingdesign methods, and with the static approach, described in part 1, asignificant reduction in required stone size can be achieved whenallowing a damage number S3D up to 1.
It is advised to compare the results obtained with Eq. (9) withother data sets or field measurements when possible.
Acknowledgements
The authors gratefully acknowledge the Research Foundation —
Flanders for the grant which was provided for their research at GhentUniversity.
Appendix A. Pictures of dynamic scour protection tests
In this appendix, pictures of the top view of all scour protectiontests with irregular waves are shown below. The pictures after 1000waves, 3000 waves and 5000 waves are shown. The tests are shownin order of the measured damage. The damage after 3000 waves (involume % of eroded material) is included, as is the test number. Thetest matrix is given in the main text (Table 1). Waves are alwaystravelling from right to left. The direction of the steady current isindicated with an arrow.
References
Breusers, H.N.C., Raudkivi, A.J., 1991. Scouring-hydraulic Structures Design Manual.IAHR, A.A. Balkema, Rotterdam. p. 143.
CEM, US Army Corps of Engineers, 2002. Coastal Engineering Manual 1110-2-1100,Washington, D.C.
Chiew, Y.M., 1995. Mechanics of riprap failure at bridge piers. Journal of HydraulicEngineering 121 (9), 635–643.
CIRIA/CUR, 1991. Manual on the use of rock in coastal and shoreline engineering.CIRIA/CUR special publication, 83, p. 607.
den Boon, H., Hessels, J., van Rooij, J., 2003. Cost reduction of offshore wind parks bylow cost load monitoring of pile foundations, offshore wind energy in Mediterra-nean and other European Seas (OWEMES), Napels, Italy.
den Boon, J.H., Sutherland, J., Whitehouse, R., Soulsby, R., Stam, C.J.M., Verhoeven, K.,Høgedal, M., Hald, T., 2004. Scour behaviour and scour protection for monopilefoundations of offshore wind turbines. European Wind Energy Conference &exhibition (EWEC), London, UK.
De Vos, L., 2008. Optimisation of scour protection design for monopiles and quantifica-tion of wave run-up. Engineering the influence of an offshore wind turbine on localflow conditions. PhD Thesis, Ghent University, Ghent, pp 319.
De Vos, L., De Rouck, J., Troch, P., Frigaard, P., 2011. Empirical design of scour protec-tions around monopile foundations. Part 1: Static Aproach, Coastal Engineering,58. Elsevier.
E-Connection, Vestas Wind Systems D.K., Germanischer Lloyd Windenergie D.,2002–2004. OPTI-PILE, Fifth Research and Technological Development FrameworkProgramme.
Federal Highway Administration, 2008. Use of Waste and Byproduct Materials inPavement Construction.
Fredsøe, J., Deigaard, R., 1992. Mechanics of Coastal Sediment Transport. AdvancedSeries on Ocean Engineering, Vol. 3. World Scientific.
Redeker, F., 1985. Probabilistic Approach of Cover Layer Material. Delft University ofTechnology.
Soulsby, R., 1997. Dynamics of Marine Sands: a Manual for Practical Applications.Thomas Telford.
Sumer, B.M., Fredsøe, J., 2002. The mechanics of scour in the marine environment.Advanced Series on Ocean Engineering. World Scientific, River Edge, N.J. 536pp.
Whitehouse, R.J.S., Sutherland, J., O'Brien, D., 2006. Seabed scour assessment for off-shore windfarm, International Conference on scour and erosion, Nanyang University,Nanyang, Singapore.
Van der Meer, J.W., 1988. Rock Slopes and Gravel Beaches Under Wave Attack. DelftHydraulics.