Embed Size (px)
Citation preview

Aalborg Universitet
Scour around monopile foundations for off-shore wind turbines
Margheritini, Lucia; Frigaard, Peter Bak; Martinelli, Luca; Lamberti, Alberto
Published in:The First International Conference on the Application of Physical Modelling to Port and Coastal Protection(CoastLab06)
Publication date:2006
Document VersionPublisher's PDF, also known as Version of record
Link to publication from Aalborg University
Citation for published version (APA):Margheritini, L., Frigaard, P., Martinelli, L., & Lamberti, A. (2006). Scour around monopile foundations for off-shore wind turbines: . In The First International Conference on the Application of Physical Modelling to Port andCoastal Protection (CoastLab06) Faculty of Engineering, University of Porto.
General rightsCopyright and moral rights for the publications made accessible in the public portal are retained by the authors and/or other copyright ownersand it is a condition of accessing publications that users recognise and abide by the legal requirements associated with these rights.
? Users may download and print one copy of any publication from the public portal for the purpose of private study or research. ? You may not further distribute the material or use it for any profit-making activity or commercial gain ? You may freely distribute the URL identifying the publication in the public portal ?
Take down policyIf you believe that this document breaches copyright please contact us at [email protected] providing details, and we will remove access tothe work immediately and investigate your claim.
Downloaded from vbn.aau.dk on: April 29, 2017

© 2006, Proceedings of the First International Conference on the Application of Physical Modelling to Port and Coastal Protection. ISBN xxx-xxxx-xx-x
1
SCOUR AROUND MONOPILE FOUNDATIONS FOR OFF-SHORE WIND TURBINES
LUCIA MARGHERITINI1, PETER FRIGAARD1, LUCA MARTINELLI2 AND ALBERTO LAMBERTI2
(1) Aalborg University, Department of Civil Engineering, Hydraulics and Coastal Engineering Laboratory, Sohngaardsholmsvej 57; DK 9000, Denmark, phone (+45) 96 35 84 79, fax (+45) 98 14 25 55, e-mail:
[email protected]/[email protected]
(2) DISTART Idraulica, University of Bologna, e-mail: luca.martinelli/[email protected]
Abstract
The present paper aims to describe the scour hole process around large piles through laboratory tests under waves, unidirectional and tidal currents in time. The process for unidirectional and tidal currents has been compared. The tests have been carried out in a wave flume equipped with a two way recirculation pump at the Hydraulic Laboratory at Aalborg University. The mobile bed around the model was leveled with an automatic laser profiler and the results are graphically displayed as maximum scour depths and eroded volumes.
1. Introduction
Scour around monopile foundations for off-shore wind turbines is a problem growing together with the rise of offshore wind energy market in Northern Europe. Traditional design for foundations is based on the equilibrium scour depth and for the tower on fatigue that increases with increasing scour depths. It is very important, then, to evaluate correctly the maximum scour depth and give an esteem of the time development of the scour hole. Moreover scour protection might require the knowledge of time development and eroded volume that could be filled in with rocks before the hole is completely developed (dynamic scour protection).
The erosion process around piles has been exhaustively discussed in literature mainly concerning bridge scour (Breusers et al., 1977; Sumer and Fredsøe, 1997; Melville and Coleman, 2000; Richardson and Davis, 2001; den Boon et al., 2004): the presence of the pile in a flow is an obstacle that changes the flow pattern. The downflow ahead of the pier causes a horseshoe vortex at the base that lifts up the sediment that is carried away by the current. Downstream the erosion process is dominated by the wake vortices arisen from flow separation at the side of the pile. As a result of an asymmetrical process, an asymmetrical scour hole occurs. The equilibrium scour depth S occurs after a certain time T depending on different parameter as: the volume to be eroded V , the pile diameter D, the porosity n, the flow velocity U, the tide period Tm and the fluid’s and sediment’s characteristics.
The marine environment where wind parks are built, brings out new topics to be debated as the influence of tidal currents (Escarameia, 1999) and waves.

2
This article propose an evaluation of scour holes in tidal currents and a discussion of time development and scaling low.
2. The set-up
Tests have been carried out in the deep water wave flume at the Hydraulics and Coastal Engineering Laboratory at the Department of Civil Engineering at Aalborg University (DK).
The objectives of the experiments were: • To describe the scour hole process around monopile foundations under unidirectional and
tidal currents in time; • to estimate the equilibrium scour hole for tidal currents and answer if it is or not deeper
than in case of unidirectional currents. 2.1 The physical model The flume used during the tests is 25 m long 1.2 m wide and 1.5 m deep (Fig. 1). The sloping bed was designed in order to provoke wave breaking. The bed was constructed of concrete with a 4 m long sand box filled with fine sand (grain size was 0.15 mm) where the model was fixed. Sand was spread out in a thin layer across the slope and all the tests were in live-bed conditions. A two way recirculation system allowed the simulation of steady and tidal currents. The scale of the model is 1:30.
Currents and waves were measured beside the model by an acoustic Doppler velocimeter and two wave gauges, one of them close to the wave generator in order to allow waves separation into incident and reflected waves.
The tests covered a wide range of velocities (0.3÷0.5 m/s) and water depth (0.1÷0.3 m) and two pile diameters (0.1 m and 0.2 m). Tide was simulated by reverting the current velocity every half an hour for two hours (2 tidal cycles).
Pump
1:111:18
M odel
W avemachine
Figure 1. The tests flume equipped with wave generator, two ways recirculation pump, concrete slopes and sand box with model of the pile.
2.2 The profiler The bed was levelled by an automatic profiler at the end of the steady current tests but in some cases the time evolution of the scour was monitored.
The profiler is working in a no contact manner using a laser for the measurements. Each axis is controlled by high precision step motors with a movement resolution of less then 1 mm. The main advantage consists on having accurate measurement without entering the tested area and without emptying the flume as the laser is able to work also under water level.
The measured grid was 1.5 m long by 0.93 m wide and the grid step was 1.5 cm. The time needed to take the measurement was 35 minutes. Before levelling the bed, the upper part of the model was dismounted in order to allow laser’s movements (Figure 2).

3
The profiler is controlled by the program EPro (Meinert 2004). This program enables multi-measurements of the defined target area and afterwards the profiled surface is visually presented and the results can be inspected in detail; the program also enable the damage calculation between two profiles as eroded volume.
Figure 2. The profiler during a measurement of the tested area; the upper part of the pile was removed to allow laser passage. EPro graphic result.
2.3 Tests description The tests are divided in tests with unidirectional currents (Table 1), tidal currents (Table 2), breaking waves and waves combined to unidirectional current (Table3). The red indicates tests of which the results are collected in Table 4.
Table1.
Test For Pile Diameter
D (m)
Significant wave height
Hs (m)
Peak period Tp (s)
Water depth at the pile
h (m)
Current velocity (m/s)
4.1 4.2 4.3 4.4 4.5 4.6 4.7 4.8 4.9
0.10 - - 0.29 0.17 0.10
From 0.30 To 0.50
4.10 4.11 4.12 4.13 4.14 4.15 4.16 4.17 4.18
Uni
dire
ctio
nal c
urre
nts
0.20 - - 0.29 0.17 0.10
From 0.30 To 0.50

4
Table2.
Test For Pile Diameter
D (m)
Significant wave height
Hs (m)
Peak period Tp (s)
Water depth at the pile
h (m)
Current velocity (m/s)
2.1 2.2 2.3 2.4 2.5 2.6 2.7 2.8 2.9
0.10 - 60 0.29 0.17 0.10
From 0.30 To 0.50
2.10 2.11 2.12 2.13 2.14 2.15 2.16 2.17 2.18
Tida
l cur
rent
s
0.20 - 60 0.29 0.17 0.10
From 0.30 To 0.50
Table3.
Test For Pile Diameter
D (m)
Significant wave height
Hs (m)
Peak period Tp (s)
Water depth at the pile
h (m)
Current velocity (m/s)
1.1 1.2 1.3 1.4 1.5 1.6 Br
eaki
ng w
aves
an
d c
urre
nt
0.10 0.12 0.08 0.12
1.28 2.01 1.28 2.01 1.28 2.01
0.29 0.17 0.10
0.00 0.00 0.30
Tests in Table 1 and 3 lasted 30 minutes but the current was stopped also after 15 minutes
to carry out the measurement of the scour hole. Only few tests lasted more (3 or 4 hours) than the decided duration in order to document time development.
Tests in Table 2 lasted 2 hours reverting the current every 30 minutes for 2 tidal cycles. The measurements were taken before reverting the current and for few tests that lasted longer (3 or 4 hours), every 5, 10, 15 minutes. The tidal current was simulated by adopting a steady current with velocity equal to the maximum half-period velocity. Tide period is then shorter then the oscillatory one.
As all tests were in live-bed conditions, small ripples and ripples have been observed: U*/w= 0.68÷1.13. with w = falling velocity of the send = 1.5 cm/s e U* bed shear velocity. U*ε/ν (ε= roughness of the bed = 0.5÷1 cm) is higher than 50÷170 and therefore the bed is rough.
5
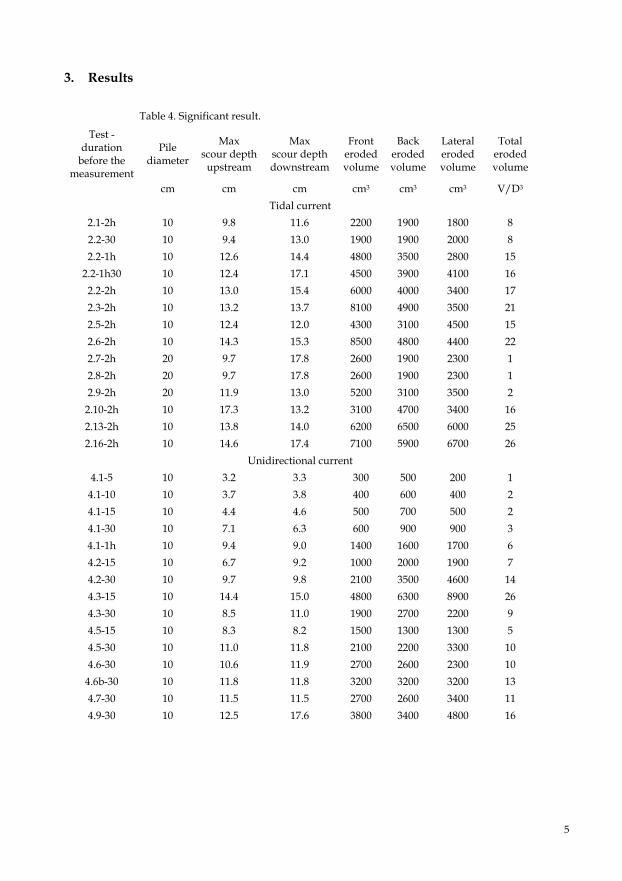
3. Results
Table 4. Significant result.
Test - duration
before the measurement
Pile diameter
Max scour depth
upstream
Max scour depth downstream
Front eroded volume
Back eroded volume
Lateral eroded volume
Total eroded volume
cm cm cm cm3 cm3 cm3 V/D3
Tidal current 2.1-2h 10 9.8 11.6 2200 1900 1800 8 2.2-30 10 9.4 13.0 1900 1900 2000 8 2.2-1h 10 12.6 14.4 4800 3500 2800 15
2.2-1h30 10 12.4 17.1 4500 3900 4100 16 2.2-2h 10 13.0 15.4 6000 4000 3400 17 2.3-2h 10 13.2 13.7 8100 4900 3500 21 2.5-2h 10 12.4 12.0 4300 3100 4500 15 2.6-2h 10 14.3 15.3 8500 4800 4400 22 2.7-2h 20 9.7 17.8 2600 1900 2300 1 2.8-2h 20 9.7 17.8 2600 1900 2300 1 2.9-2h 20 11.9 13.0 5200 3100 3500 2 2.10-2h 10 17.3 13.2 3100 4700 3400 16 2.13-2h 10 13.8 14.0 6200 6500 6000 25 2.16-2h 10 14.6 17.4 7100 5900 6700 26
Unidirectional current 4.1-5 10 3.2 3.3 300 500 200 1
4.1-10 10 3.7 3.8 400 600 400 2 4.1-15 10 4.4 4.6 500 700 500 2 4.1-30 10 7.1 6.3 600 900 900 3 4.1-1h 10 9.4 9.0 1400 1600 1700 6 4.2-15 10 6.7 9.2 1000 2000 1900 7 4.2-30 10 9.7 9.8 2100 3500 4600 14 4.3-15 10 14.4 15.0 4800 6300 8900 26 4.3-30 10 8.5 11.0 1900 2700 2200 9 4.5-15 10 8.3 8.2 1500 1300 1300 5 4.5-30 10 11.0 11.8 2100 2200 3300 10 4.6-30 10 10.6 11.9 2700 2600 2300 10
4.6b-30 10 11.8 11.8 3200 3200 3200 13 4.7-30 10 11.5 11.5 2700 2600 3400 11 4.9-30 10 12.5 17.6 3800 3400 4800 16

6
Significant results are presented in Table 4. The area around the pile was divide in a front, a rear and two laterals sub areas. For every one the eroded volume and the maximum scour depth were calculated.
In case of waves, for a given pile spacing D, the scour depth is mainly governed by the KC number = UmT/D: the larger the KC number, the larger the scour depth. If 0≤ KC ≤4 no scour hole occurs (Frigaard et al., 2005). In our case 1.7 ≤ KC ≤ 2.7 and no local erosion was indeed measured (Figure 3) .
In case of waves superimposed to a current the dimensionless equilibrium scour hole is a function of the combined current and wave orbital velocity, the latter reducing the scour:
)( cwUFDS
= , where )/( mcccw UUUU += [1]
and Uc= undisturbed current velocity, Uw=maximum value of the oscillatory flow velocity due to rms waves at the bottom. During tests with waves and currents, the global erosion was very high (≈ 0.025 m) and bigger for waves with higher Tp. Tests with stronger currents and waves were impossible to realize in our set-up. Although the estimate global erosion was not very precise, the result from the comparison with test 4.1 was unquestionable; according to it (Table 5) and to literature indications (Sumer and Fredsøe, 2002), waves do not increase scour depths when superimposed on a current.
Figure 3 EPro graphic result and picture of no scour hole under wave attack. Small ripples.
Figure 4. EPro graphic result and picture of scour hole under wave and current attack. Ripples and downstream damp outside the hole.
Table5. Results from tests with only waves and waves superimposed to current.
Test T Uc Uw KC waves and
currents
Ucw θ Measured S/D (after
30 min) 4.1 - 0.3 0 - 0 0.074 ≈ 0.65 1.5 1.28 0.3 0.21 4.7 0.41 0.138 ≈ 0.65 1.6 2.01 0.3 0.13 6.6 0.31 0.078 ≈ 0.45
7
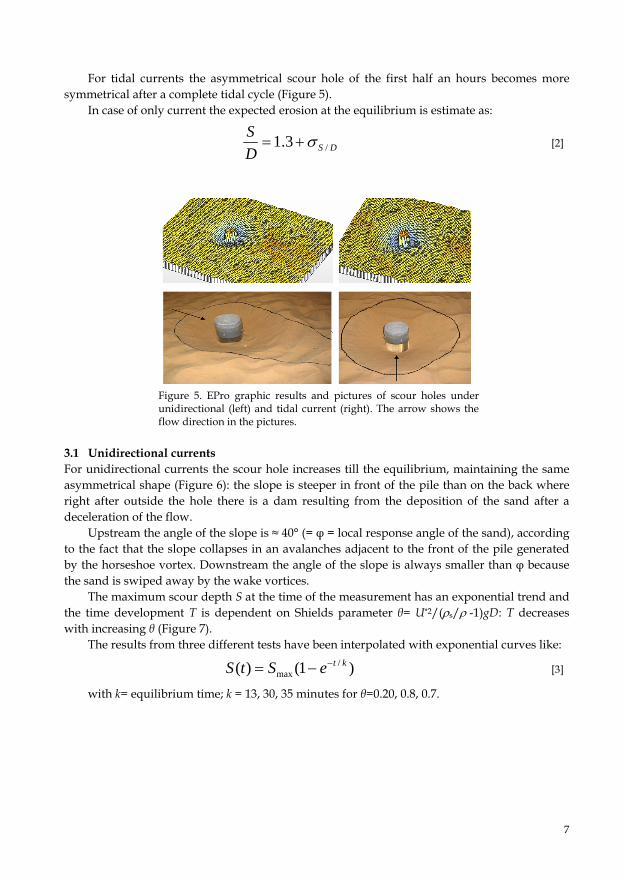
For tidal currents the asymmetrical scour hole of the first half an hours becomes more symmetrical after a complete tidal cycle (Figure 5).
In case of only current the expected erosion at the equilibrium is estimate as:
DSDS
/3.1 σ+= [2]
Figure 5. EPro graphic results and pictures of scour holes under unidirectional (left) and tidal current (right). The arrow shows the flow direction in the pictures.
3.1 Unidirectional currents For unidirectional currents the scour hole increases till the equilibrium, maintaining the same asymmetrical shape (Figure 6): the slope is steeper in front of the pile than on the back where right after outside the hole there is a dam resulting from the deposition of the sand after a deceleration of the flow.
Upstream the angle of the slope is ≈ 40° (= φ = local response angle of the sand), according to the fact that the slope collapses in an avalanches adjacent to the front of the pile generated by the horseshoe vortex. Downstream the angle of the slope is always smaller than φ because the sand is swiped away by the wake vortices.
The maximum scour depth S at the time of the measurement has an exponential trend and the time development T is dependent on Shields parameter θ= U*2/(ρs/ρ -1)gD: T decreases with increasing θ (Figure 7).
The results from three different tests have been interpolated with exponential curves like:
[3] )1()( /max
kteStS −−=
with k= equilibrium time; k = 13, 30, 35 minutes for θ=0.20, 0.8, 0.7.
8
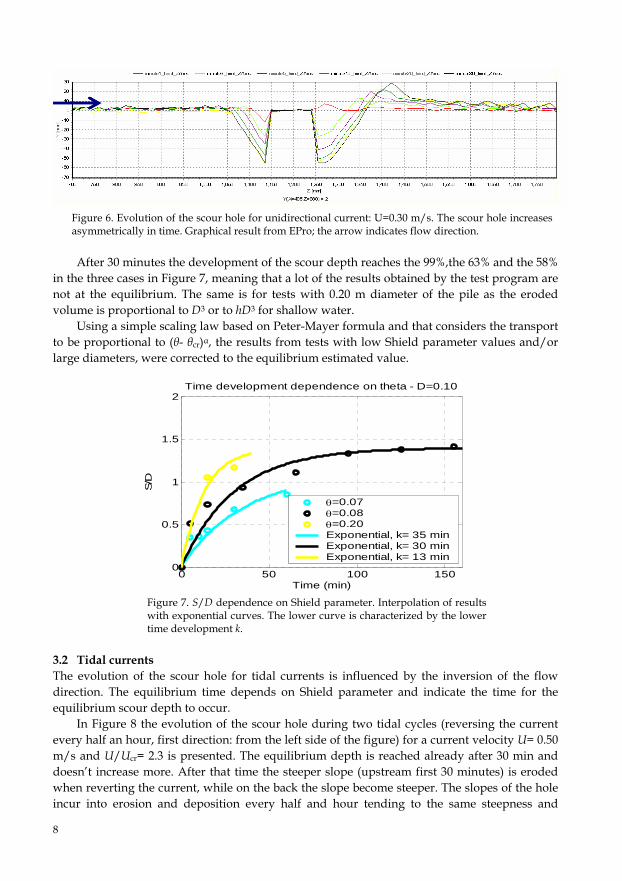
Figure 6. Evolution of the scour hole for unidirectional current: U=0.30 m/s. The scour hole increases asymmetrically in time. Graphical result from EPro; the arrow indicates flow direction.
After 30 minutes the development of the scour depth reaches the 99%,the 63% and the 58% in the three cases in Figure 7, meaning that a lot of the results obtained by the test program are not at the equilibrium. The same is for tests with 0.20 m diameter of the pile as the eroded volume is proportional to D3 or to hD3 for shallow water.
Using a simple scaling law based on Peter-Mayer formula and that considers the transport to be proportional to (θ- θcr)α, the results from tests with low Shield parameter values and/or large diameters, were corrected to the equilibrium estimated value.
0 50 100 1500
0.5
1
1.5
2Time development dependence on theta - D=0.10
Time (min)
S/D
θ=0.07θ=0.08θ=0.20Exponential, k= 35 minExponential, k= 30 minExponential, k= 13 min
Figure 7. S/D dependence on Shield parameter. Interpolation of results with exponential curves. The lower curve is characterized by the lower time development k.
3.2 Tidal currents The evolution of the scour hole for tidal currents is influenced by the inversion of the flow direction. The equilibrium time depends on Shield parameter and indicate the time for the equilibrium scour depth to occur.
In Figure 8 the evolution of the scour hole during two tidal cycles (reversing the current every half an hour, first direction: from the left side of the figure) for a current velocity U= 0.50 m/s and U/Ucr= 2.3 is presented. The equilibrium depth is reached already after 30 min and doesn’t increase more. After that time the steeper slope (upstream first 30 minutes) is eroded when reverting the current, while on the back the slope become steeper. The slopes of the hole incur into erosion and deposition every half and hour tending to the same steepness and

9
generating a symmetrical erosion. Such observed local deposition is not accompanied by a clear global accretion, i.e. in terms of volumes the deposition is weak or absent.
Y(X=405,Z=1195) = 0
minutes30_fw _ZAxis minutes60_rew _ZAxis hour1and30min_fw d_ZAxis hours2_rew _ZAxis
Z [mm]1,7501,7001,6501,6001,5501,5001,4501,4001,3501,3001,2501,2001,1501,1001,0501,000950900850800750700
Y [m
m]
40200
-20-40-60-80
-100-120-140
Figure 8. Evolution of the scour hole for tidal current: U=0.50 m/s. Graphical result from EPro; the first direction of the oscillatory velocity is left-right.
For a weaker tidal current the evolution in time is different (Figure 9 where U= 0.30 m/s and U/Ucr= 1.4) and deposition is not observed at all. While changing the flow direction S increases till the equilibrium after 1 hour and 30 min. After 3 hours the scour hole shape is quite symmetrical.
Y(X=390,Z=1195) = 0
minute30_fw d_ZAxis hour1_rew _ZAxis hour1and30min_fw d_ZAxis hour2_rew _ZAxis hour2and30min_fw d_ZAxis hour3_rew _ZAxis
Z [mm]1,7501,7001,6501,6001,5501,5001,4501,4001,3501,3001,2501,2001,1501,1001,0501,000950900850800750700
Y [m
m]
20
0
-20
-40
-60
-80
-100
-120
Figure 9. Evolution of the scour hole for tidal current: U=0.30 m/s. Graphical result from EPro; the first direction of the oscillatory velocity is left-right.
The comparison between the time development for unidirectional and tidal currents is plotted in Figure 10 for 2 different current velocities. The scour depth progress for tidal currents is influenced by the inversion of the flow following an “up and down” trend.
The two kind of currents generate the same scour depth at the equilibrium.
time development
0
0.02
0.04
0.06
0.08
0.1
0.12
0.14
0.16
0.18
0 20 40 60 80 100 120 140 160 180 200
Time (min)
S/D
uni0.50m/stidal0.50m/suni0.30m/stidal0.30m/s
Figure 10. Plot of S/D from unidirectional and tidal tests.

10
3.3 Eroded volumes It can be observed that the development of the scour is slower in presence of a tidal flow and that the hole becomes symmetrical.
The observed total eroded volume for tidal currents were close to equilibrium for cases with smaller pile diameter and greater mobility. In these cases V/D3 ≈ 16 is bigger than for unidirectional currents V/D3 ≈ 13 (Table 4); this is reasonable as the asymmetrical scour hole is enlarged in a symmetrical shape.
4. Conclusions
The significant test results have been presented in Tale 4. 1. The evolution of the scour depth for unidirectional currents follows an exponential trend
in which the scaling time decreases with increasing θ and decreases with the volume to be eroded ≈D3; for tidal currents S/D is the same as for unidirectional currents ≈1.3;
2. for unidirectional currents the eroded volume increases constantly maintaining a similar shape of the scour hole. For tidal currents the eroded volumes downstream and upstream increase intermittently depending on the direction of the last tidal flow; a slightly evident erosion and/or deposition may occur, while at the sides the erosion process is constant;
3. eroded volumes at the equilibrium are bigger for tidal currents than for unidirectional currents (V/D3 ≈ 16 for tidal case and ≈ 13 for steady current), due to the symmetry of tidal scour holes and to less steep slopes.
References
Breusers, H.N.C., Nicolette, G.and Shen, H.W. (1977): ‘Local scour around cylindrical piles’, Hyd. Res., vol 15, No. 3, 211-252.
den Boon H.J., J. Sutherland, R. Whitehouse, R. Soulsby, C.J.M. Stam, K. Verhoeven, M. Hoegedal and Tue Hald (2004): ‘Scour Behaviour and Scour Protection for Monopile Foundations of Offshore Wind Turbines’, European Wind Energy Conference & Exhibition, Aalborg, 14 pp.
Escarameia, M. (1999): ‘Scour around structures in tidal flows’, HR Wallingford Report n. SR521
Frigaard, P., Hansen, E.A., Christensen, E.D. and Jensen, M.S. (2005): ‘Effect of breaking waves on scour processes around circular offshore wind turbine foundations’. Copenhagen Offshore Wind, Copenhagen 2005.
Larsen, B., Frigaard, P. and Jensen, M.S. (2005): ‘Offshore Windturbines in Areas with Strong Currents’. Hydraulics and Coastal Engineering No 19. Aalborg University. ISBN 1603-9874
Meinert P. (2004): Epro User manual, [http://www.hydrosoft.civil.auc.dk/epro/index.htm].Melville, B.W. and Coleman, S.E. (2000): ‘Bridge Scour’. Water Resources Publications, LLC, CO,
USA, xxii + 550p. Richardson, E.V and S.R. Davis (2001): ‘HEC-18. Evaluating Scour at Bridges. Hydraulic
Engineering’ Circular No. 18. Fourth edition. National Highway Institute, Federal Highway Administration, U.S. Dept. of Transportation.
Sumer, B.M. and Fredsøe, (1997): ‘Hydrodynamics around cylindrical Structures’. World Scientific. 530p.
Sumer, B.M. and Fredsøe, (2002): ‘The Mechanics of Scour in the Marine Environment’